Abstract
Insects rely on olfaction for mating, finding oviposition sites, and locating hosts. Hyphantria cunea is a serious pest that severely damages forests. Differential expression analysis of olfactory-related genes between males and females is the basis for elucidating the functions of olfactory-related proteins in H. cunea. In this study, Illumina HiSeqTM 4000 high-throughput sequencing technology was used to perform transcriptome sequencing of the antennal tissues of adult male and female H. cunea. Functional annotation was conducted using the NR, Swiss-Prot, KOG, KEGG, and GO databases, and the results showed that the antennal transcriptome of adult H. cunea contained 50,158 unigenes. Differential expression analysis identified 3923 genes that were significantly differentially expressed between male and female antennae. A total of 221 olfactory-related genes were annotated, and 96 sex-biased genes were identified, including 13 odorant receptors (ORs), 48 odorant binding proteins (OBPs), 7 chemosensory proteins (CSPs), 10 ionotropic receptors (IRs), 10 sensory neuron membrane proteins (SNMPs), 2 gustatory receptors (GRs), and 6 odorant-degrading enzymes (ODEs), indicating that there were differences in olfaction between male and female H. cunea. Quantitative real-time PCR was used to verify the expression levels of 21 putative general odorant receptor genes in male and female antennae. HcunOR4 and HcunOR5 showed female-biased expression; HcunOR48, HcunOR49 and HcunOR50 showed male-biased expression. The results were consistent with the transcriptome differential analysis. The screening of male-biased odorant receptor genes might provide a theoretical basis for the functional characterization of odorant receptors for recognizing sex pheromones in H. cunea.
1. Introduction
Insects rely on their olfactory senses to perceive various odors and chemical cues in the environment, enabling them to locate mates, find hosts, identify oviposition sites, and evade predators [1,2]. The olfactory sensing process of insects recognizing odor molecules and elicit behavioral responses involves two primary steps: (1) In the peripheral olfactory system, odor molecules enter the lymph through the pores of the antennae and are transported by olfactory-related proteins to the dendritic membranes of olfactory neurons, subsequently activating membrane-bound olfactory-related proteins; (2) olfactory neurons convert the chemical signals into electrical signals, transmitting them to the central nervous system, eliciting behavioral responses in insects [3,4]. Chemosensory proteins (CSPs) and odorant binding proteins (OBPs) are involved in dissolving odor molecules and transporting them to the vicinity of olfactory neuron dendritic membranes. Odorant receptors (ORs) and ionotropic receptors (IRs) on the dendritic membranes recognize odor molecules and transmit signals to the central nervous system. After the olfactory response, odorant-degrading enzymes (ODEs) and sensory neuron membrane proteins (SNMPs) degrade odor molecules, preventing continuous stimulation of odor receptors that could damage the insect’s nervous system [5]. The insect antennal transcriptome serves as an important foundation for studying the function of olfactory proteins. In recent years, with the development of high-throughput sequencing technologies, an increasing number of insect antennal transcriptomes have been reported [6,7].
Hyphantria cunea is a highly polyphagous pest that can feed on a wide range of host plants, including almost all forest trees and even crops, except for some hardwood and evergreen coniferous trees [8]. H. cunea has a large feeding capacity, with larvae exhibiting the ability to withstand starvation and strong adaptability. In addition, H. cunea has a broad dispersal range and can be transmitted through multiple pathways, causing severe economic losses [9]. The antennal transcriptome of H. cunea was first reported in 2016, identifying olfactory-related proteins such as OBPs, CSPs, ORs, SNMPs, GRs, and IRs [10]. In addition, they performed semi-quantitative and relative quantitative analysis of the expression levels of 27 OBPs and 17 CSPs in different tissues between the two sexes, but sex-biased expression levels of odorant receptor genes were not identified. Since the publication of the antennal transcriptome of H. cunea in 2016, only a few studies have been published on the function characterization of general odorant receptors and sex pheromone-binding proteins in H. cunea [11,12,13]. However, the identification of odorant receptors for recognizing the sex pheromones of H. cunea has not been reported. This suggests that there may be difficulties in the identification of sex pheromone receptors in H. cunea. The sex pheromones of H. cunea belong to type II moth sex pheromones, which are relatively rare [14]. Thus, the odorant receptors for recognizing sex pheromones of H. cunea may have low identity with the odorant receptors that recognize the more common type I moth sex pheromones [15,16]. Therefore, it was hypothesized that the sex pheromone receptors of H. cunea may not belong to the traditional sex pheromone receptor evolutionary branch. Analyzing the sex-biased expression of the antennal transcriptome and the differential expression of odorant receptor genes of adult H. cunea may help to screen for male-biased odorant receptor genes, which could provide a theoretical basis for the identification of the sex pheromone receptors in H. cunea.
This study utilized second-generation transcriptome sequencing technology and fluorescent quantitative PCR technology to analyze the differences in transcription levels in the antennal tissues of H. cunea. A total of 221 olfactory-related genes were annotated, and in the differential analysis, 96 sex-specific genes were identified, including 13 ORs, 48 OBPs, 7 CSPs, 10 IRs, 10 SNMPs, 2 GRs, and 6 ODEs, indicating the presence of olfactory differences between male and female H. cunea. Both GO enrichment analysis and KEGG enrichment analysis were conducted, and the differentially expressed genes were mainly enriched in the subcategories of single-organism process (GO) and global and overview maps (KEGG). Fluorescent quantitative PCR technology was used to analyze the relative expression levels of 21 general odorant receptor genes obtained from the evolutionary analysis of the antennae of both male and female moths. HcunOR4 and HcunOR5 showed female-biased expression, while HcunOR48, HcunOR49, and HcunOR50 exhibited male-biased expression. These results were consistent with the transcriptome differential analysis, and the identification of genes with male-biased expression provides a foundation for predicting the sex pheromone receptors of H. cunea.
2. Results
2.1. Quality Control
The filtering results of the raw transcriptome data of H. cunea antennae are shown in Table 1 and Table S1. The number of raw reads (raw data) from the F-An-1 biological replicate was 38,038,376, with the number and percentage of high-quality reads (clean reads) based on raw reads being 37,905,884 (99.65%) and the number of low-quality reads being 132,050 (0.35%). The percentage of high-quality data of the raw data of biological replicate M-An-2 was the lowest, at 99.62%. After filtering the data, the analysis of the base composition and quality distribution was performed, as shown in Table 1 and Table S1. Taking the biological replicate F-An-1 as an example, the total number of bases in the raw data was 5,705,756,400 (in bp), and the total number of high-quality bases after filtering was 5,685,746,323 (in bp). The number of bases with a sequencing quality reaching above the Q20 level (clean bases) after filtering and its percentage of raw bases was 5,566,314,157 (97.90%). The number of bases with a sequencing quality reaching above the Q30 level after filtering and its percentage of raw bases (or clean bases) was 5,315,695,472 (93.49%). The number and percentage of bases with N bases in the single-end read after filtering was 70,126 (0.00%). The GC ratio of the filtered sequence bases was 2,421,542,093 (42.59%). The lowest Q20 value was found in the biological replicate M-An-3 (97.75%), and the lowest Q30 value was in the biological replicate M-An-3 (93.20%), both of which were above 89%.

Table 1.
The summary data of antennal transcriptome of H. cunea adults.
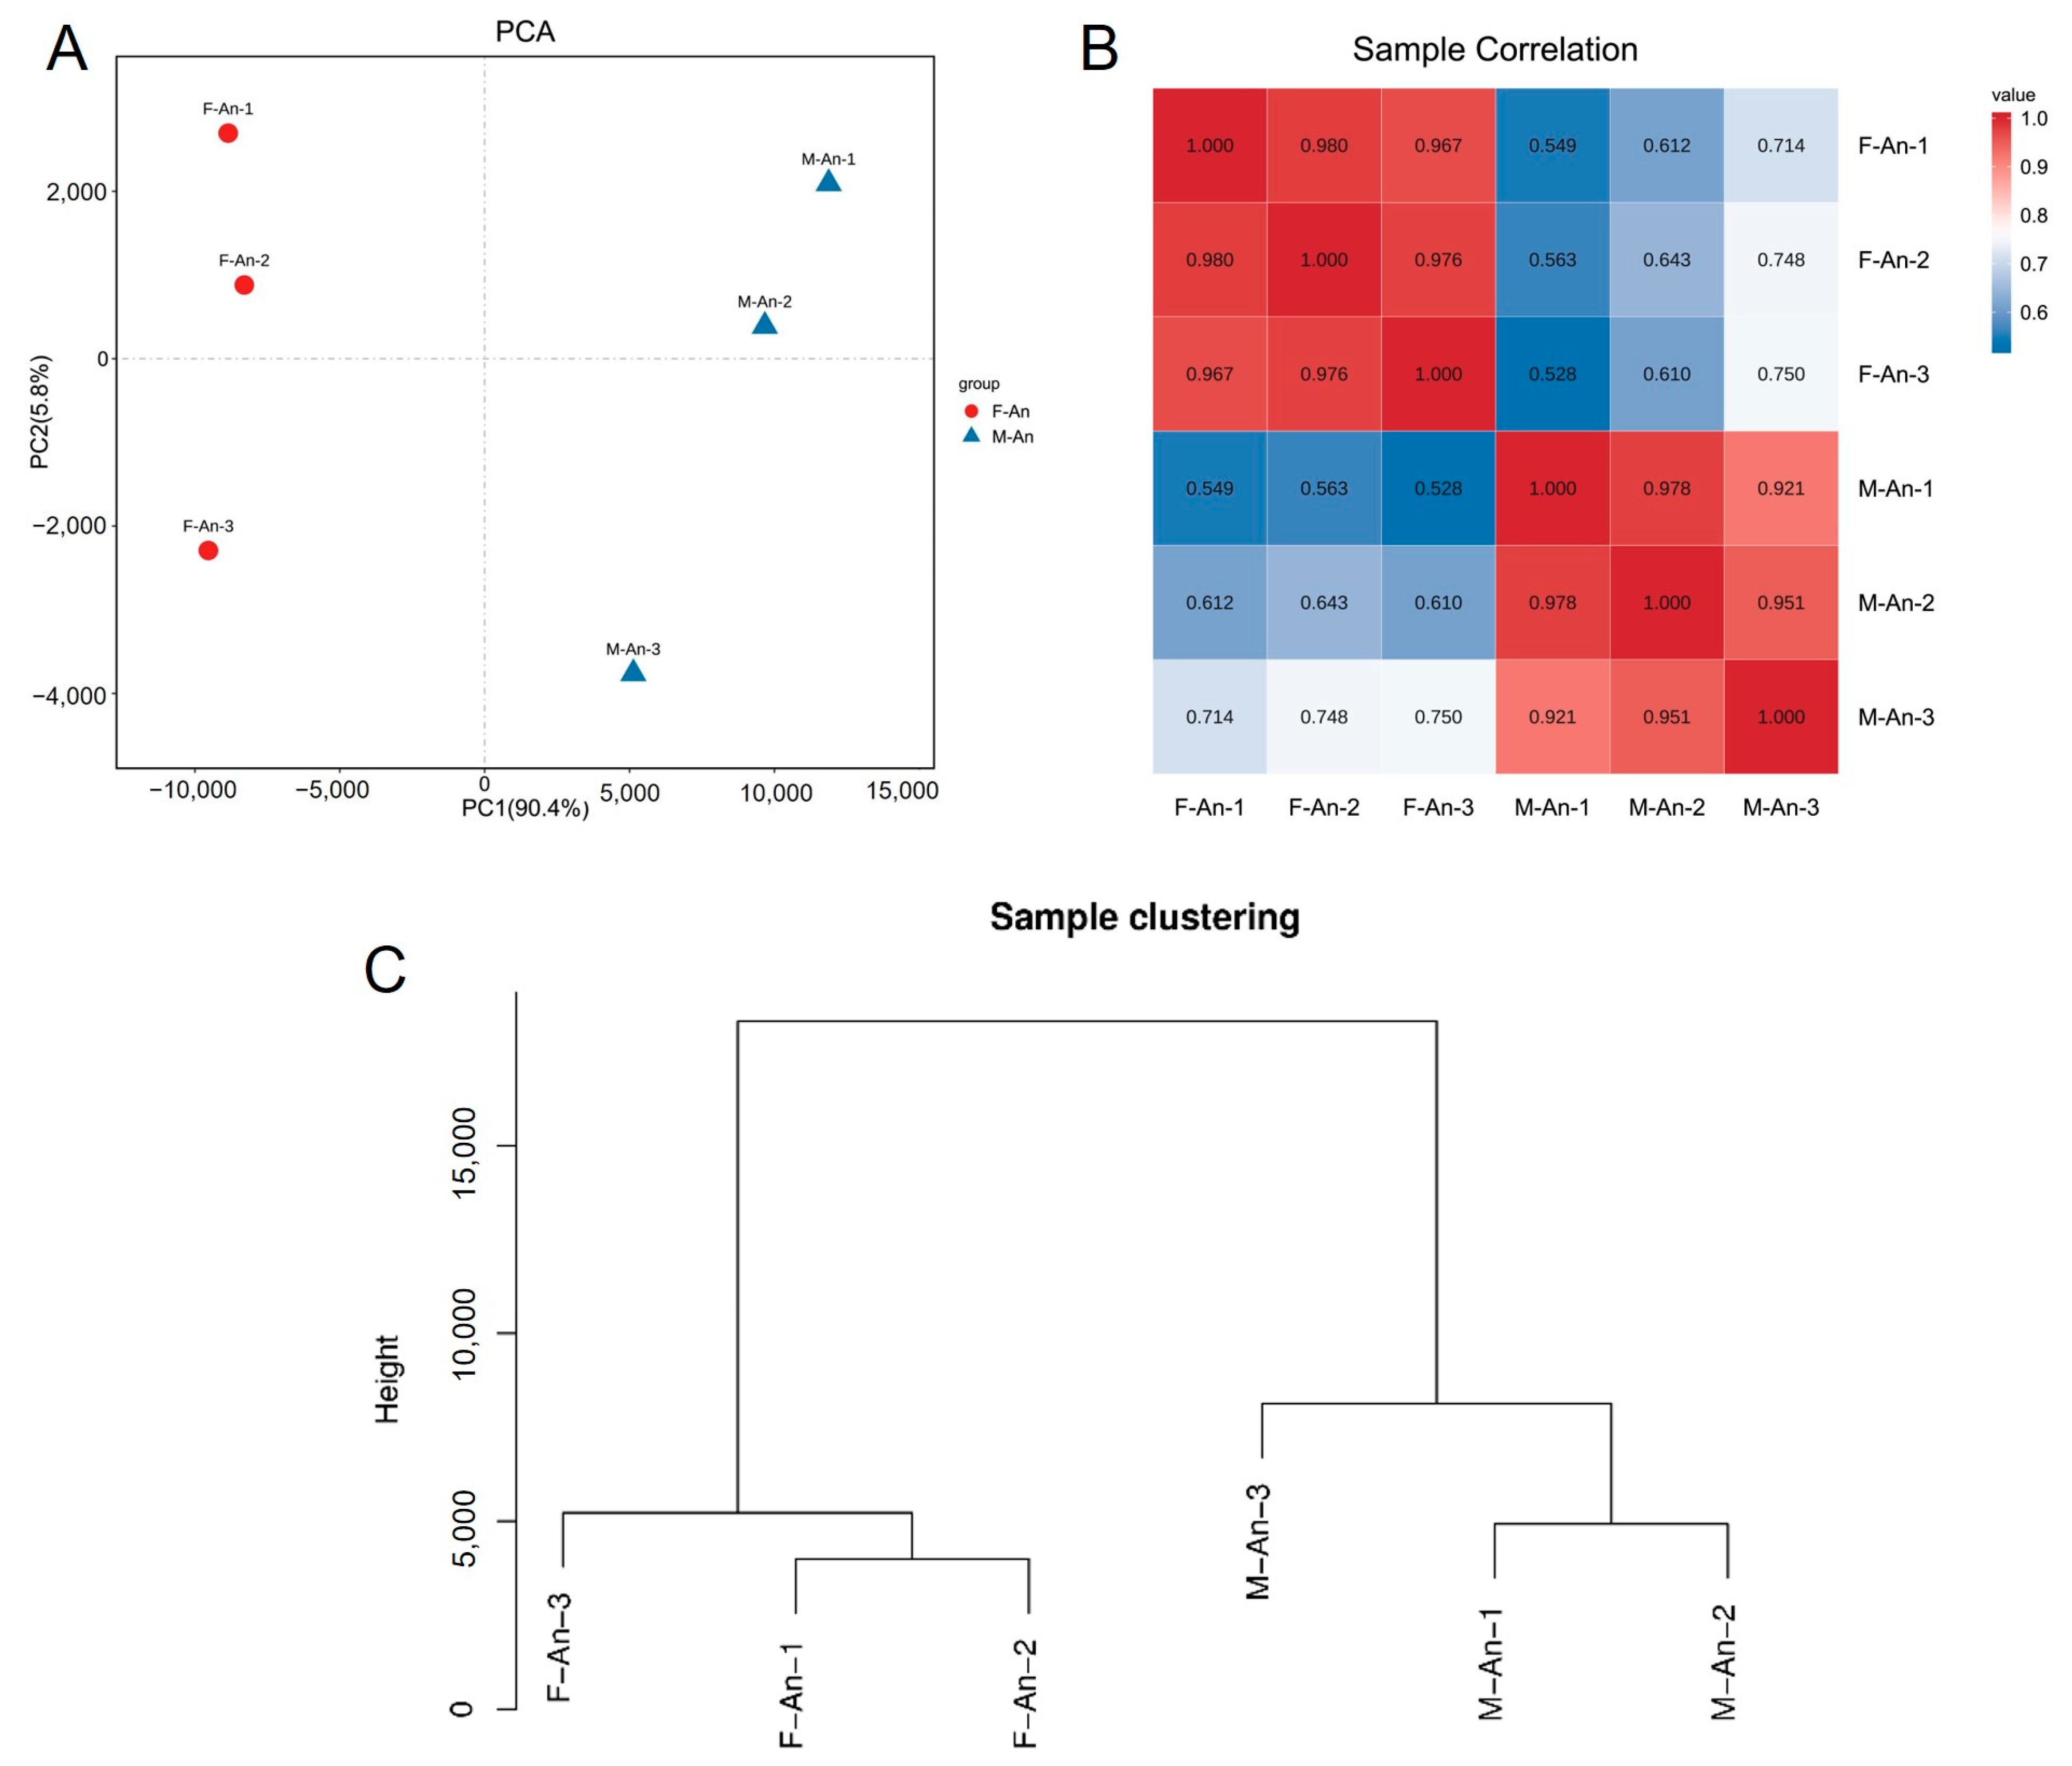
2.2. Sample Relationship Analysis
The results of the principal component analysis (PCA) are shown in Figure 1A; male and female samples are clearly separated by PC1 (x-axis) which accounts for 90.4% of the variation, indicating small differences between the biological replicates of each group and good reproducibility. Considering the PCA values of each group’s biological replicates, it was evident that the reproducibility of the three female biological replicates was better than that of the male group (Figure 1A). Referring to the filtered read length (reads) and base-derived data, it was apparent that the M-An-3 deviated from the M-An-1 and M-An-2 groups. Taking the expression levels of any two groups, the Pearson correlation coefficient between each pair of samples was calculated. The lowest correlation coefficient in the female (F-An-X) group was between the F-An-1 and F-An-3 groups, with a coefficient of 0.967, while in the male (M-An-X) group, it was between the M-An-1 and M-An-3 groups, with a coefficient of 0.921. This indicated that the samples in the female group had a higher correlation, and overall, the samples within each group exhibited high correlation and good reproducibility (Figure 1B). In the sample clustering analysis, all gene expression levels of the samples were analyzed to cluster the relationships between the samples. The Euclidean distance was represented on the y-axis, where a lower position indicated smaller differences between samples. The results indicated that the female and male samples clustered on two separate branches, with M-An-1 and M-An-2 samples showing smaller differences between biological replicates and the F-An-1 and F-An-2 samples being more similar. Additionally, the reproducibility between the female samples was higher than that of the male samples (Figure 1C).

Figure 1.
Sample relationship analysis. (A) Principal component analysis between female and male antennae samples; (B) correlation analysis of individual biological replicates in males and females; (C) hierarchical clustering between biological replicates of male and female antennae tissues.
2.3. Analysis of Annotation Results
According to the results of functional annotation using the NR, Swiss-Prot, KOG, KEGG, and GO databases for the transcriptome of the adult antennae of H. cunea, as shown in Table 2, there were a total of 50,158 unigenes. Among these, 41,287 genes (82.31%) were successfully annotated in at least one database. The highest number of annotated genes was found in the NR database, with 41,271 genes (82.28%) for both female and male adult antennae transcriptomes. By contrast, the GO database had the lowest number of annotated genes, with 8287 genes (17.69%). Additionally, there were 8871 genes (17.69%) that were not annotated in any of the databases.
Table 2.
The results of unigene annotation of the antennal transcriptome of H. cunea.
2.4. Overall Statistics of Differential Genes
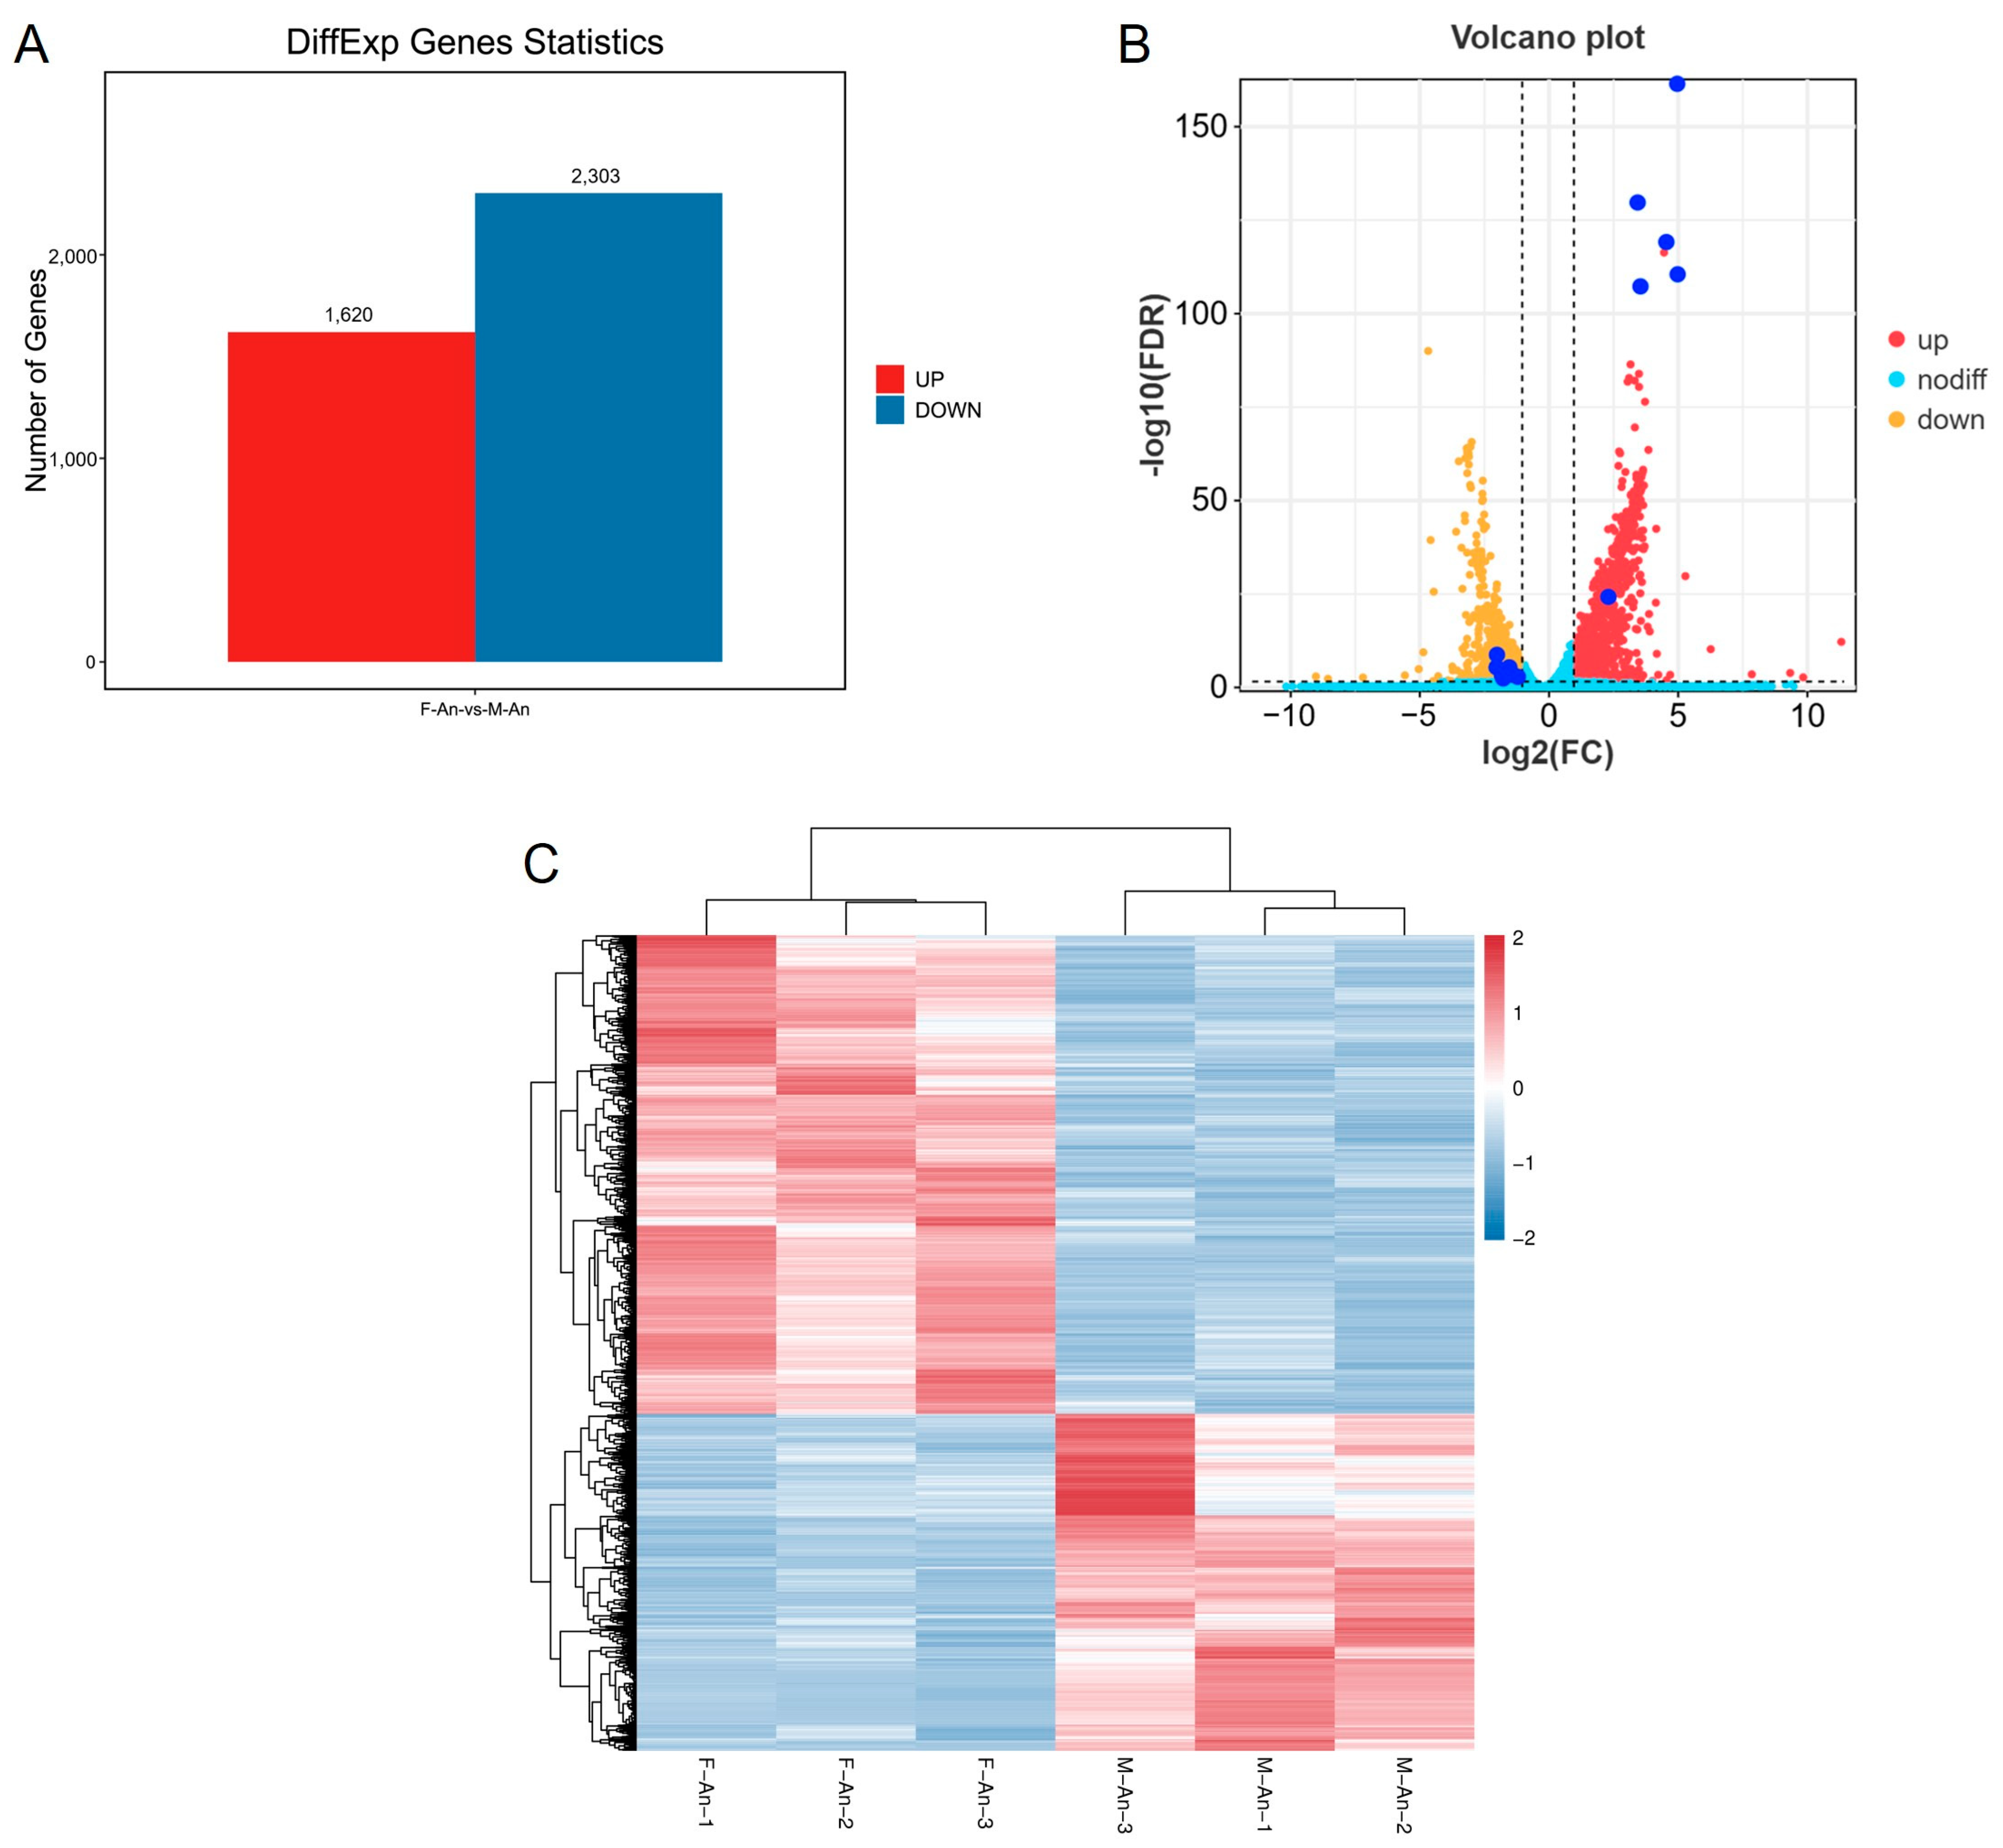
According to the differential analysis results, genes with FDR < 0.05 and |log2FC| > 1 were selected as significantly differentially expressed genes. A total of 3923 genes were identified as significantly differentially expressed in the antennae of female and male adults. Among these, 1620 genes were upregulated in female moths compared with male moths, while 2303 genes were downregulated (Figure 2).

Figure 2.
(A) Differential gene statistical map. (B) The volcano map of genes for sex difference of H. cunea (female vs. male); the dark blue dots are OR genes with significant DGE. The dashed lines mean FDR < 0.05 or |log2FC| > 1. (C) DGE heat map for gene expression clustering.
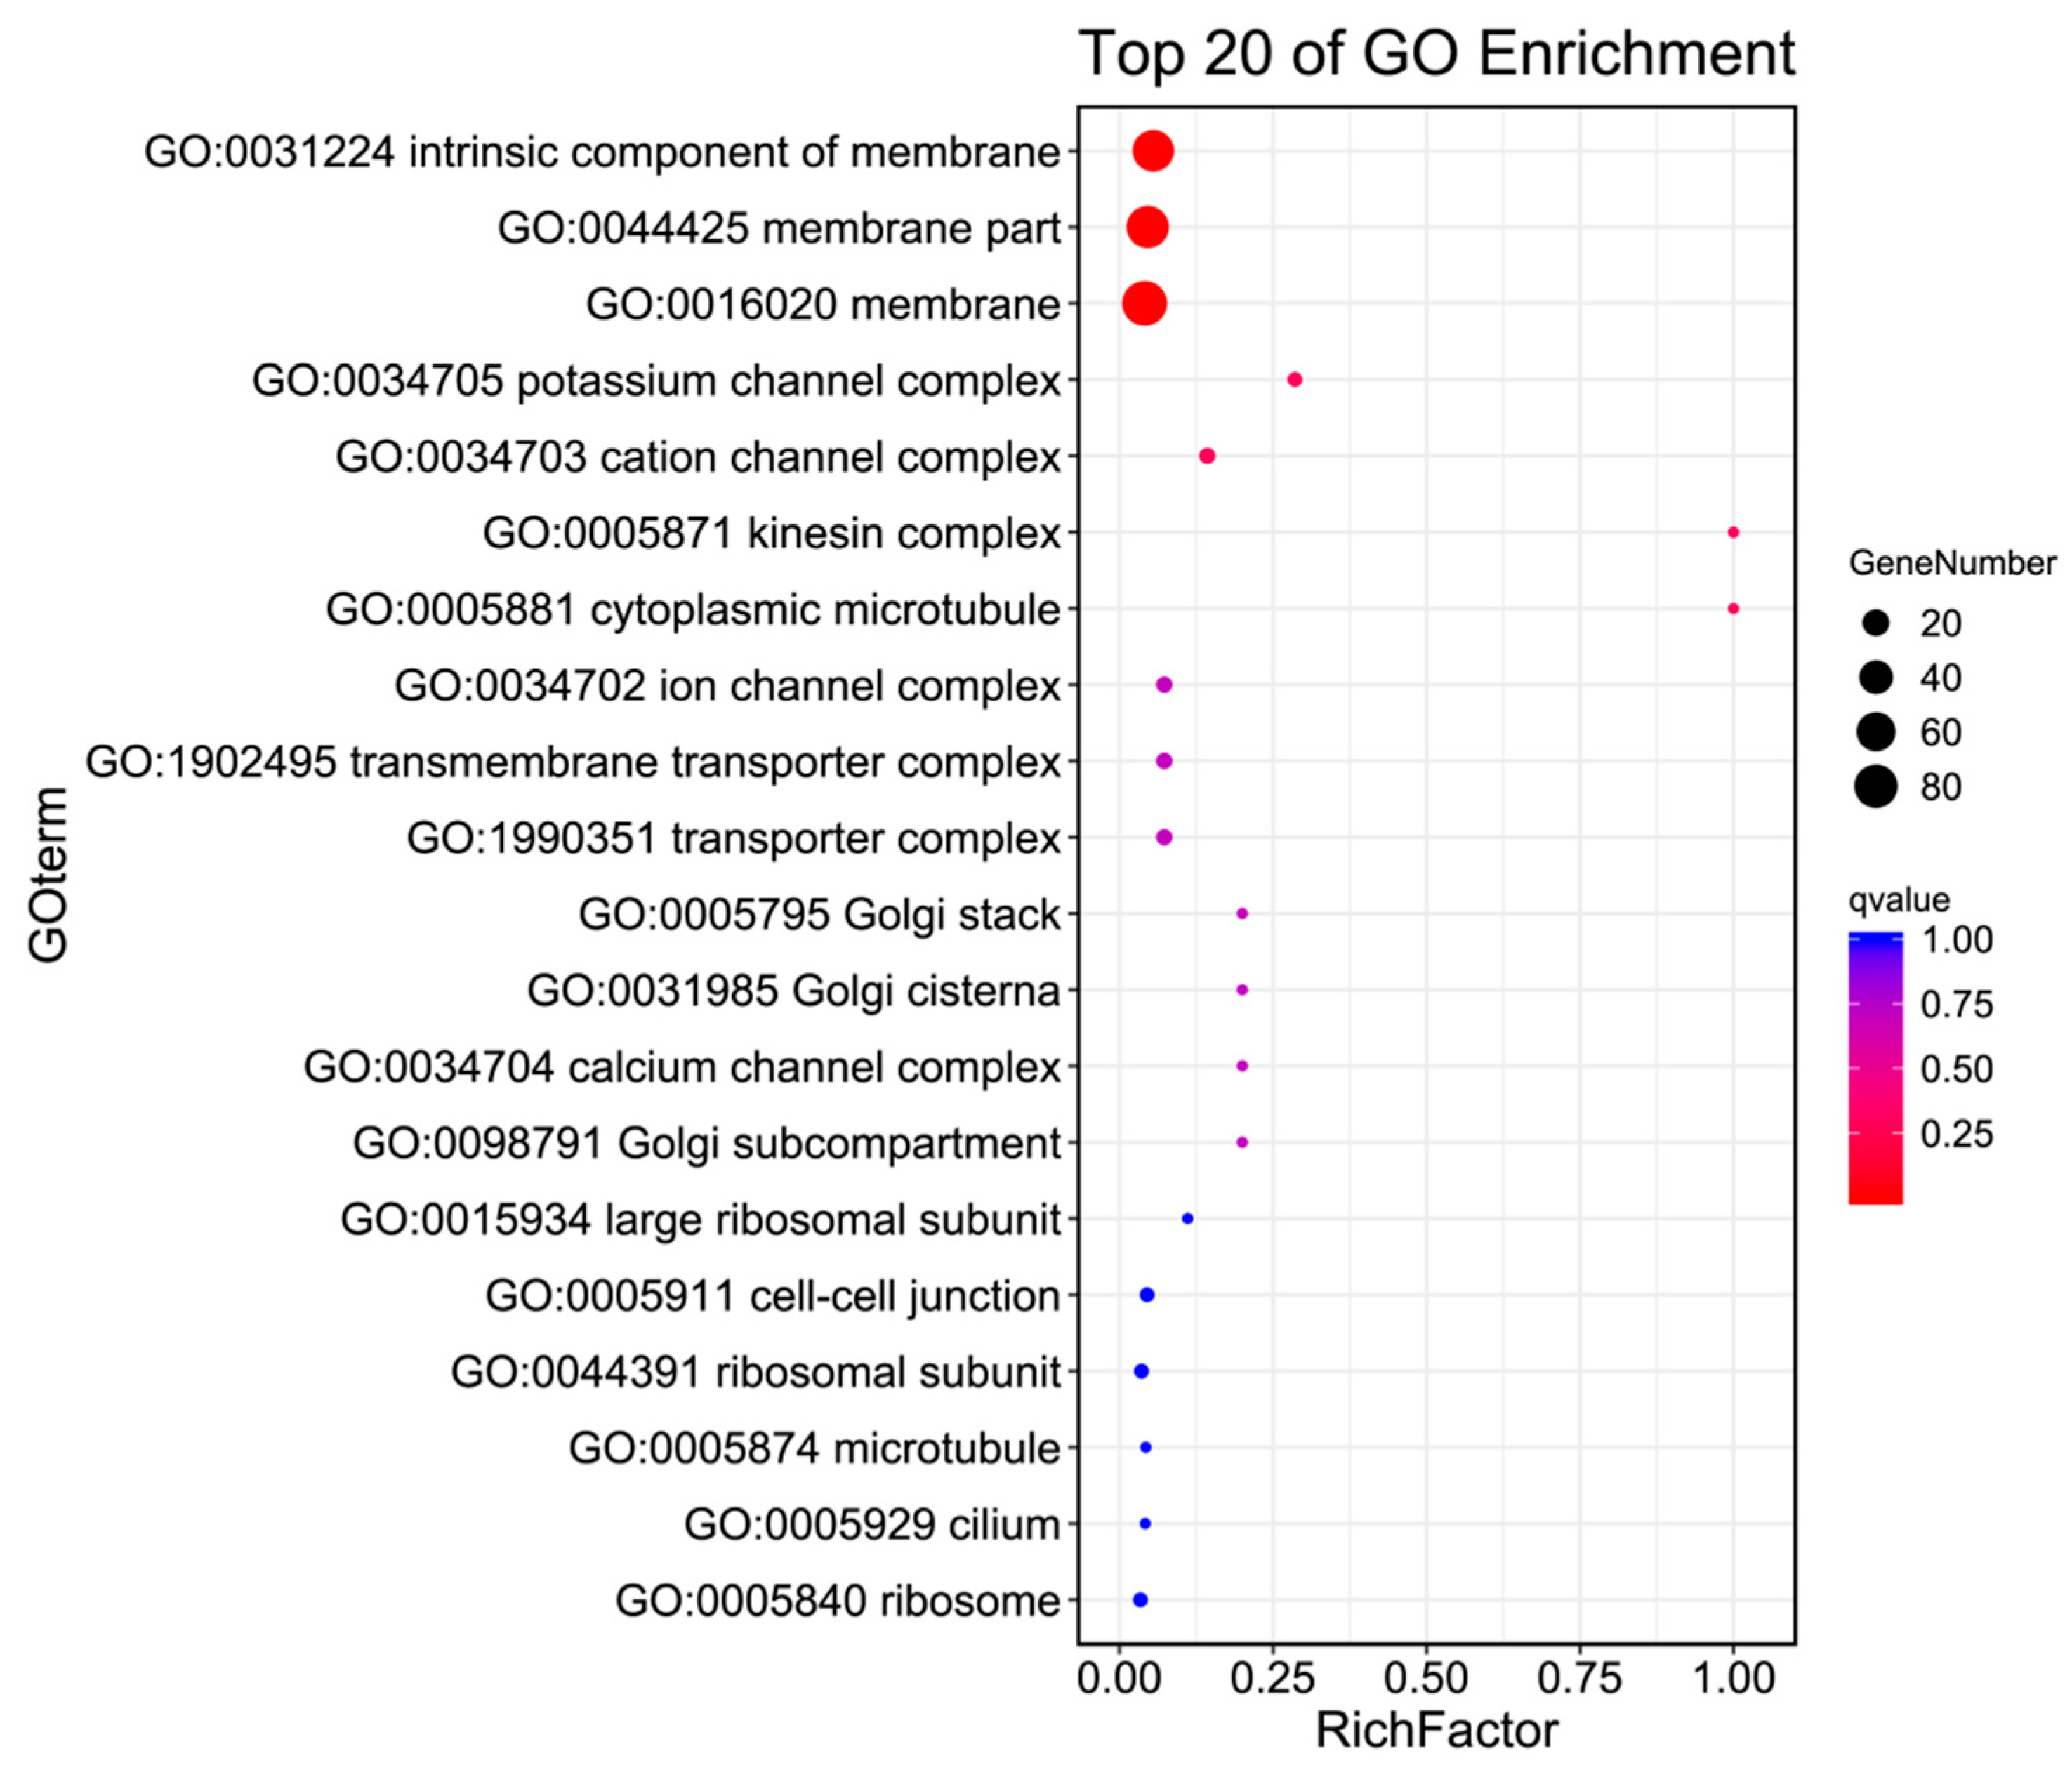
2.5. GO Enrichment
The GO annotation of the antennal transcriptome of H. cunea included three main categories and 41 subcategories(as shown in Figure 3 and Table 3). In Biological Processes, there were 19 subcategories, including localization, reproductive processes, multicellular organismal processes, reproduction, and single-organism processes. Compared with males, females had 77 upregulated and 45 downregulated genes in the localization subcategory. In the single-organism process subcategory, females had 63 upregulated and 81 downregulated genes relative to males. In Molecular Function, there were 10 subcategories, including transporter activity, nucleic acid binding transcription factor activity, molecular transducer activity, electron carrier activity, and catalytic activity. Compared with males, females had 59 upregulated and 92 downregulated genes in the catalytic activity subcategory. In Cellular Component, there were 12 subcategories, including membrane part, membrane, extracellular matrix, supramolecular fiber, and cell junction. In these subcategories, compared with males, females had 50 upregulated and 38 downregulated genes in the membrane subcategory in the female category.
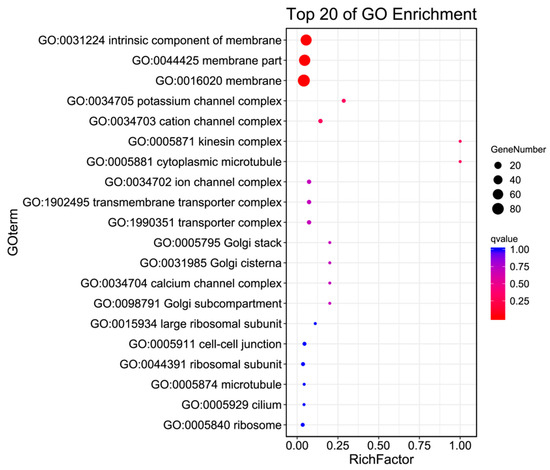
Figure 3.
GO enrichment bubble plot of the antennal transcriptome of H. cunea (females vs. males).
Table 3.
GO enrichment analysis (F-An vs. M-An).
2.6. KO Enrichment
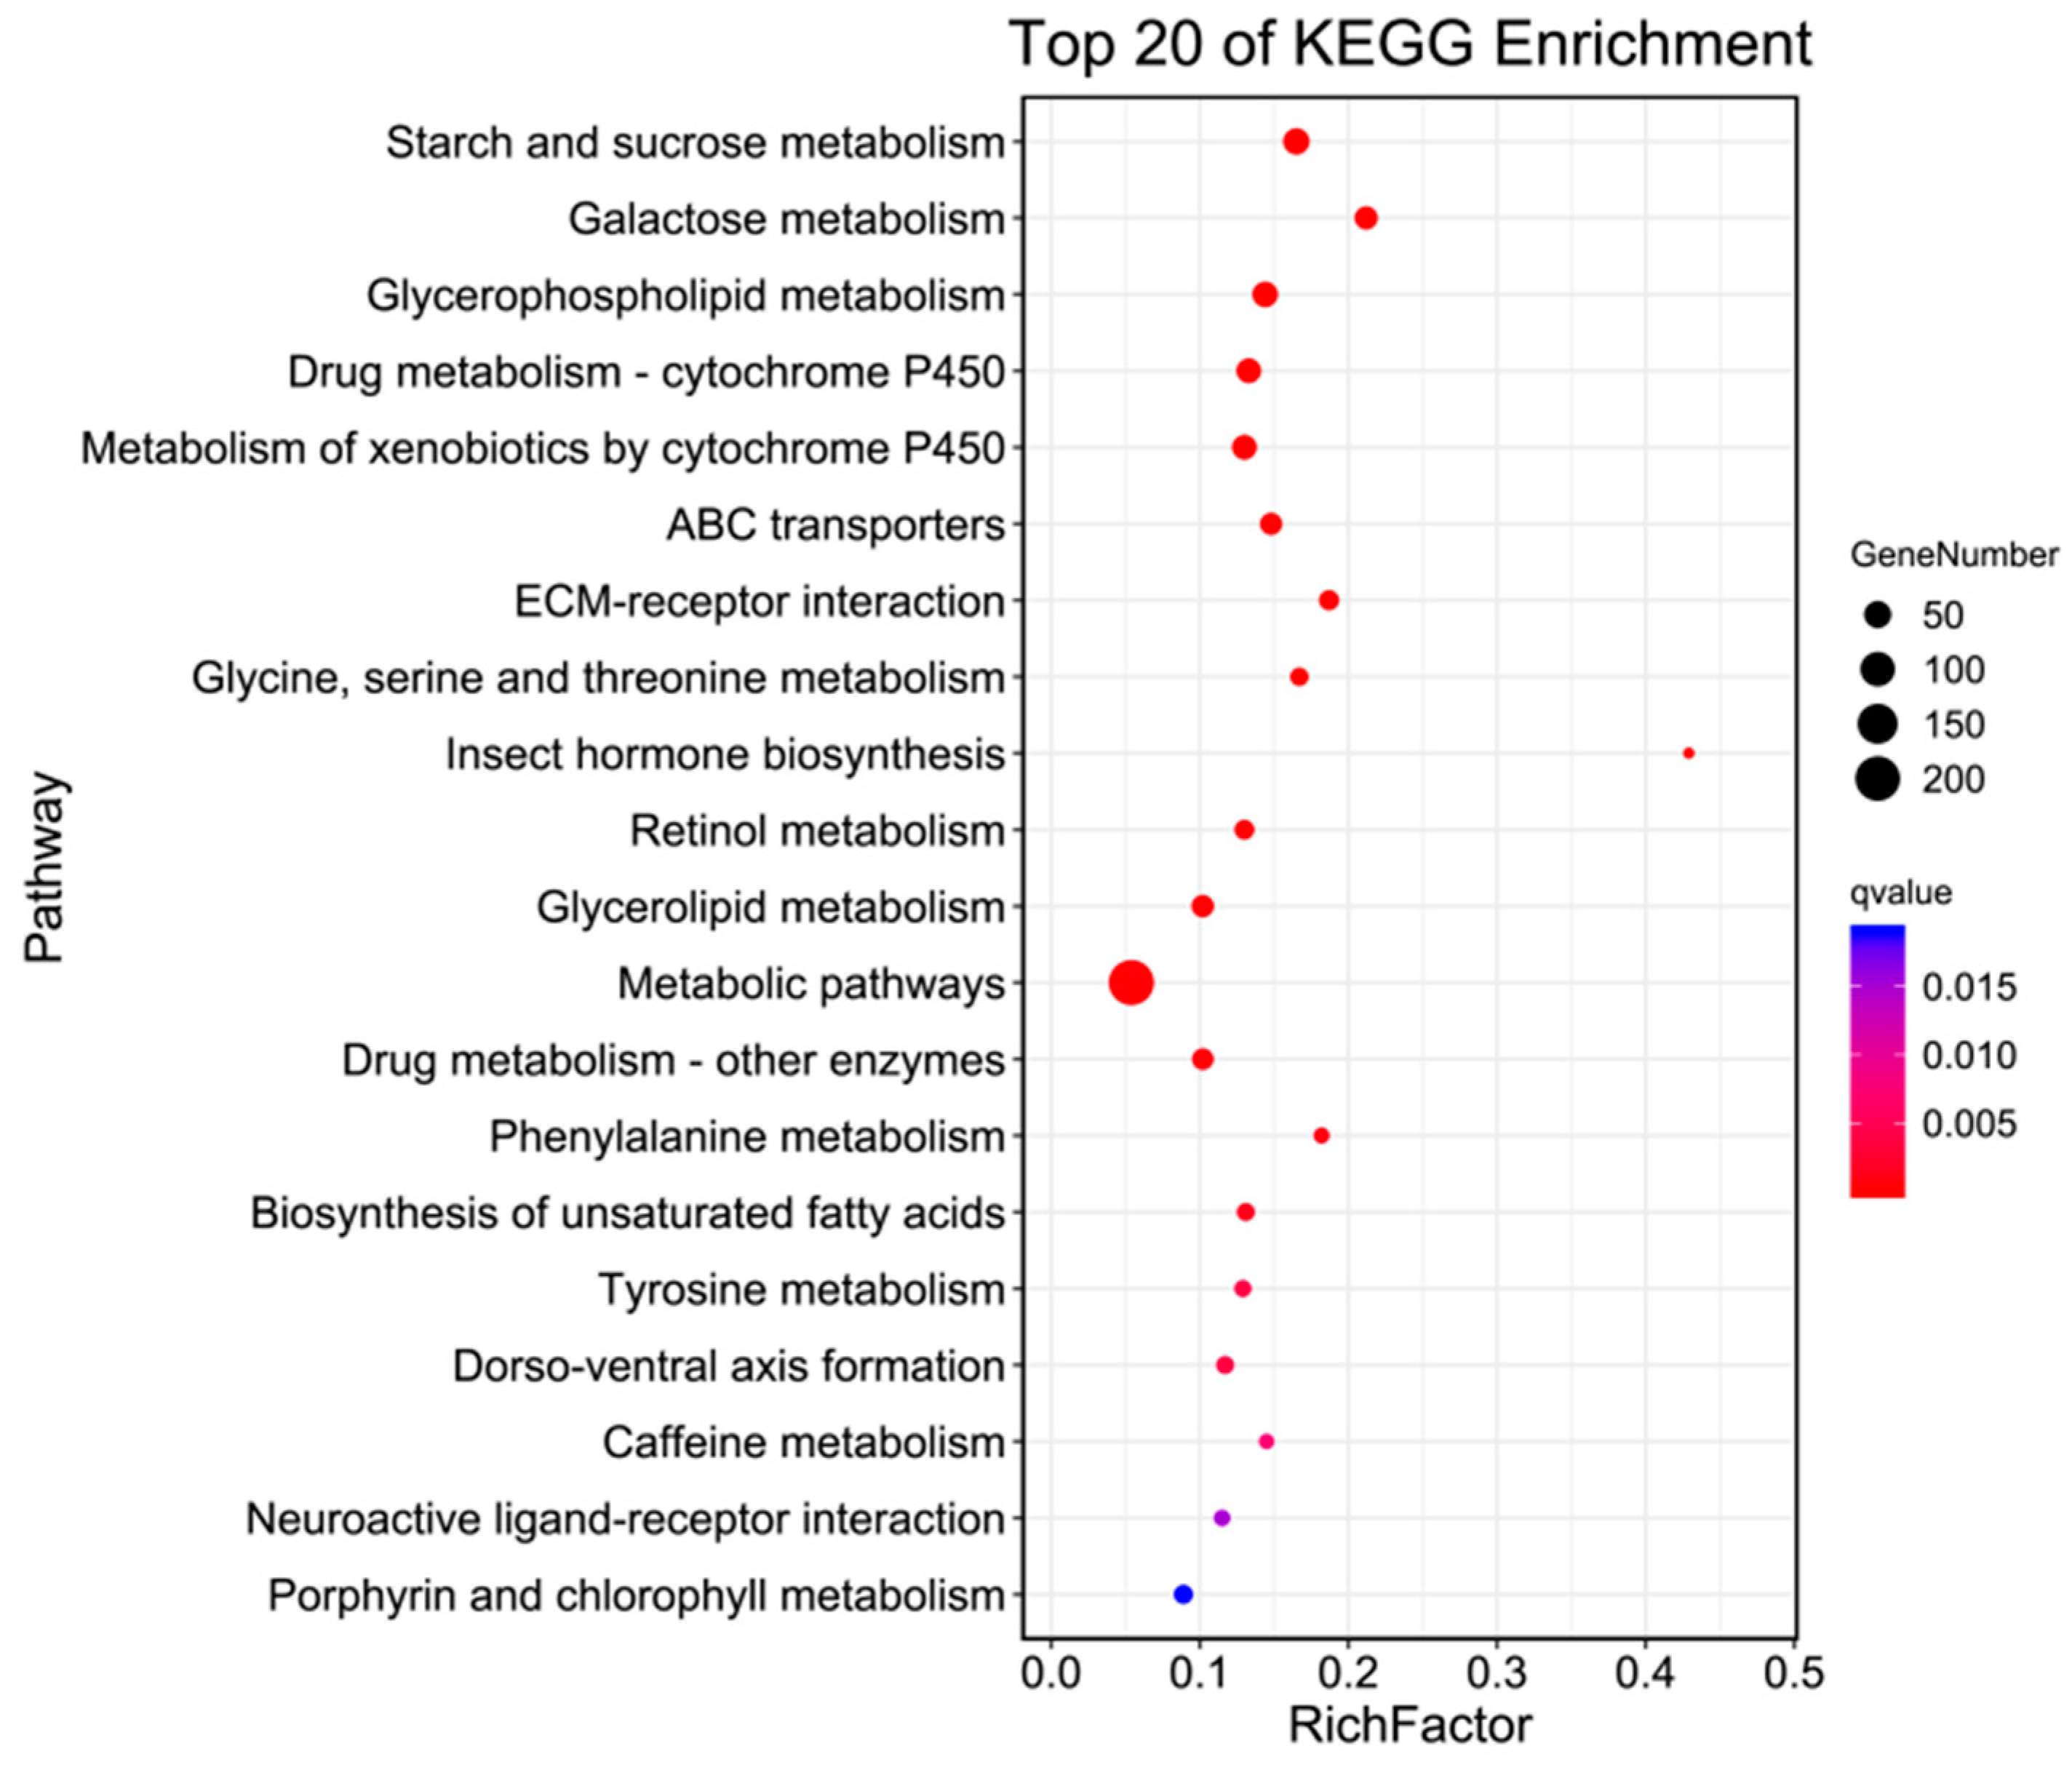
In living organisms, different genes coordinate with each other to carry out their biological functions. Pathway analysis, based on KEGG, a major public database for pathways, helped to further elucidate the biological functions of the genes. The enrichment circle presents the top 20 pathways (as shown in Figure 4), which were divided into three major categories: Metabolism, Environmental Information Processing, and Organismal Systems. Under Metabolism, there were 16 categories, including Starch and sucrose metabolism, Galactose metabolism, Glycerophospholipid metabolism, and Metabolism of xenobiotics by cytochrome P450, with 46, 31, 32, and 38 differentially expressed genes annotated in H. cunea antennal transcriptome, respectively. Environmental Information Processing included ECM-receptor interaction, ABC transporters, and Neuroactive ligand–receptor interaction, with 20, 27, and 11 differentially expressed genes annotated in the H. cunea antennal transcriptome, respectively. Organismal Systems, within the top 20 pathways, contained only one category, Dorso-ventral axis formation, with 14 differentially expressed genes annotated. Additionally, KO enrichment analysis annotated a total of 11,059 genes, out of which 1255 were differentially expressed (as shown in Table 4).

Figure 4.
KO enrichment bubble plot of antennal transcriptome of H. cunea (female vs. male).
Table 4.
KO enrichment analysis (F-An vs. M-An).
2.7. Identification of Candidate Olfactory-Related Genes
Through the Omicsmart platform of Genedenovo Biotechnology Co., Ltd. (Guangzhou, China), the results of the H. cunea antennal transcriptome were annotated. By searching and analyzing various keywords related to olfactory-related genes, a total of 221 candidate olfactory-related genes with complete open reading frames were identified from the H. cunea antennal transcriptome (as shown in Table 5).
Table 5.
Olfactory-related genes in the transcriptomes of H. cunea.
The expression levels (FPKM values) of the annotated olfactory-related genes in males and females are respectively listed in Table 6 and Supplementary Tables S2–S7, along with whether there was differential expression between males and females and the length of the longest open reading frame. Among these, 26 ORs accounted for 11.76%, with a total of 13 significantly differentially expressed genes. Among these 13 significantly differentially expressed genes, 7 showed female-biased expression and 6 showed male-biased expression (Table 6. In addition, the DGE heat map for OR gene expression clustering is shown in Figure S1. There were 77 OBPs, accounting for 34.84%, with 48 significantly differentially expressed genes, 16 of which showed female-biased expression and 32 of which showed male-biased expression. There were 46 chemosensory protein genes CSPs, accounting for 20.81%, with a total of 7 significantly differentially expressed genes, 5 of which showed female-biased expression and 2 of which showed male-biased expression. Additionally, there were 3 GRs, accounting for 1.36%, with 2 significantly differentially expressed genes, both showing female-biased expression. Furthermore, there were 40 IRs, accounting for 18.10%, with a total of 10 significantly differentially expressed genes, 8 of which showed female-biased expression and 2 of which showed male-biased expression. There were 11 SNMPs, accounting for 4.98%, with 10 significantly differentially expressed genes, all showing male-biased expression. There were 18 ODEs, accounting for 8.14%, with a total of 6 significantly differentially expressed genes, all showing male-biased expression.
Table 6.
Identification and differential expression analysis of odorant receptors in H. cunea.
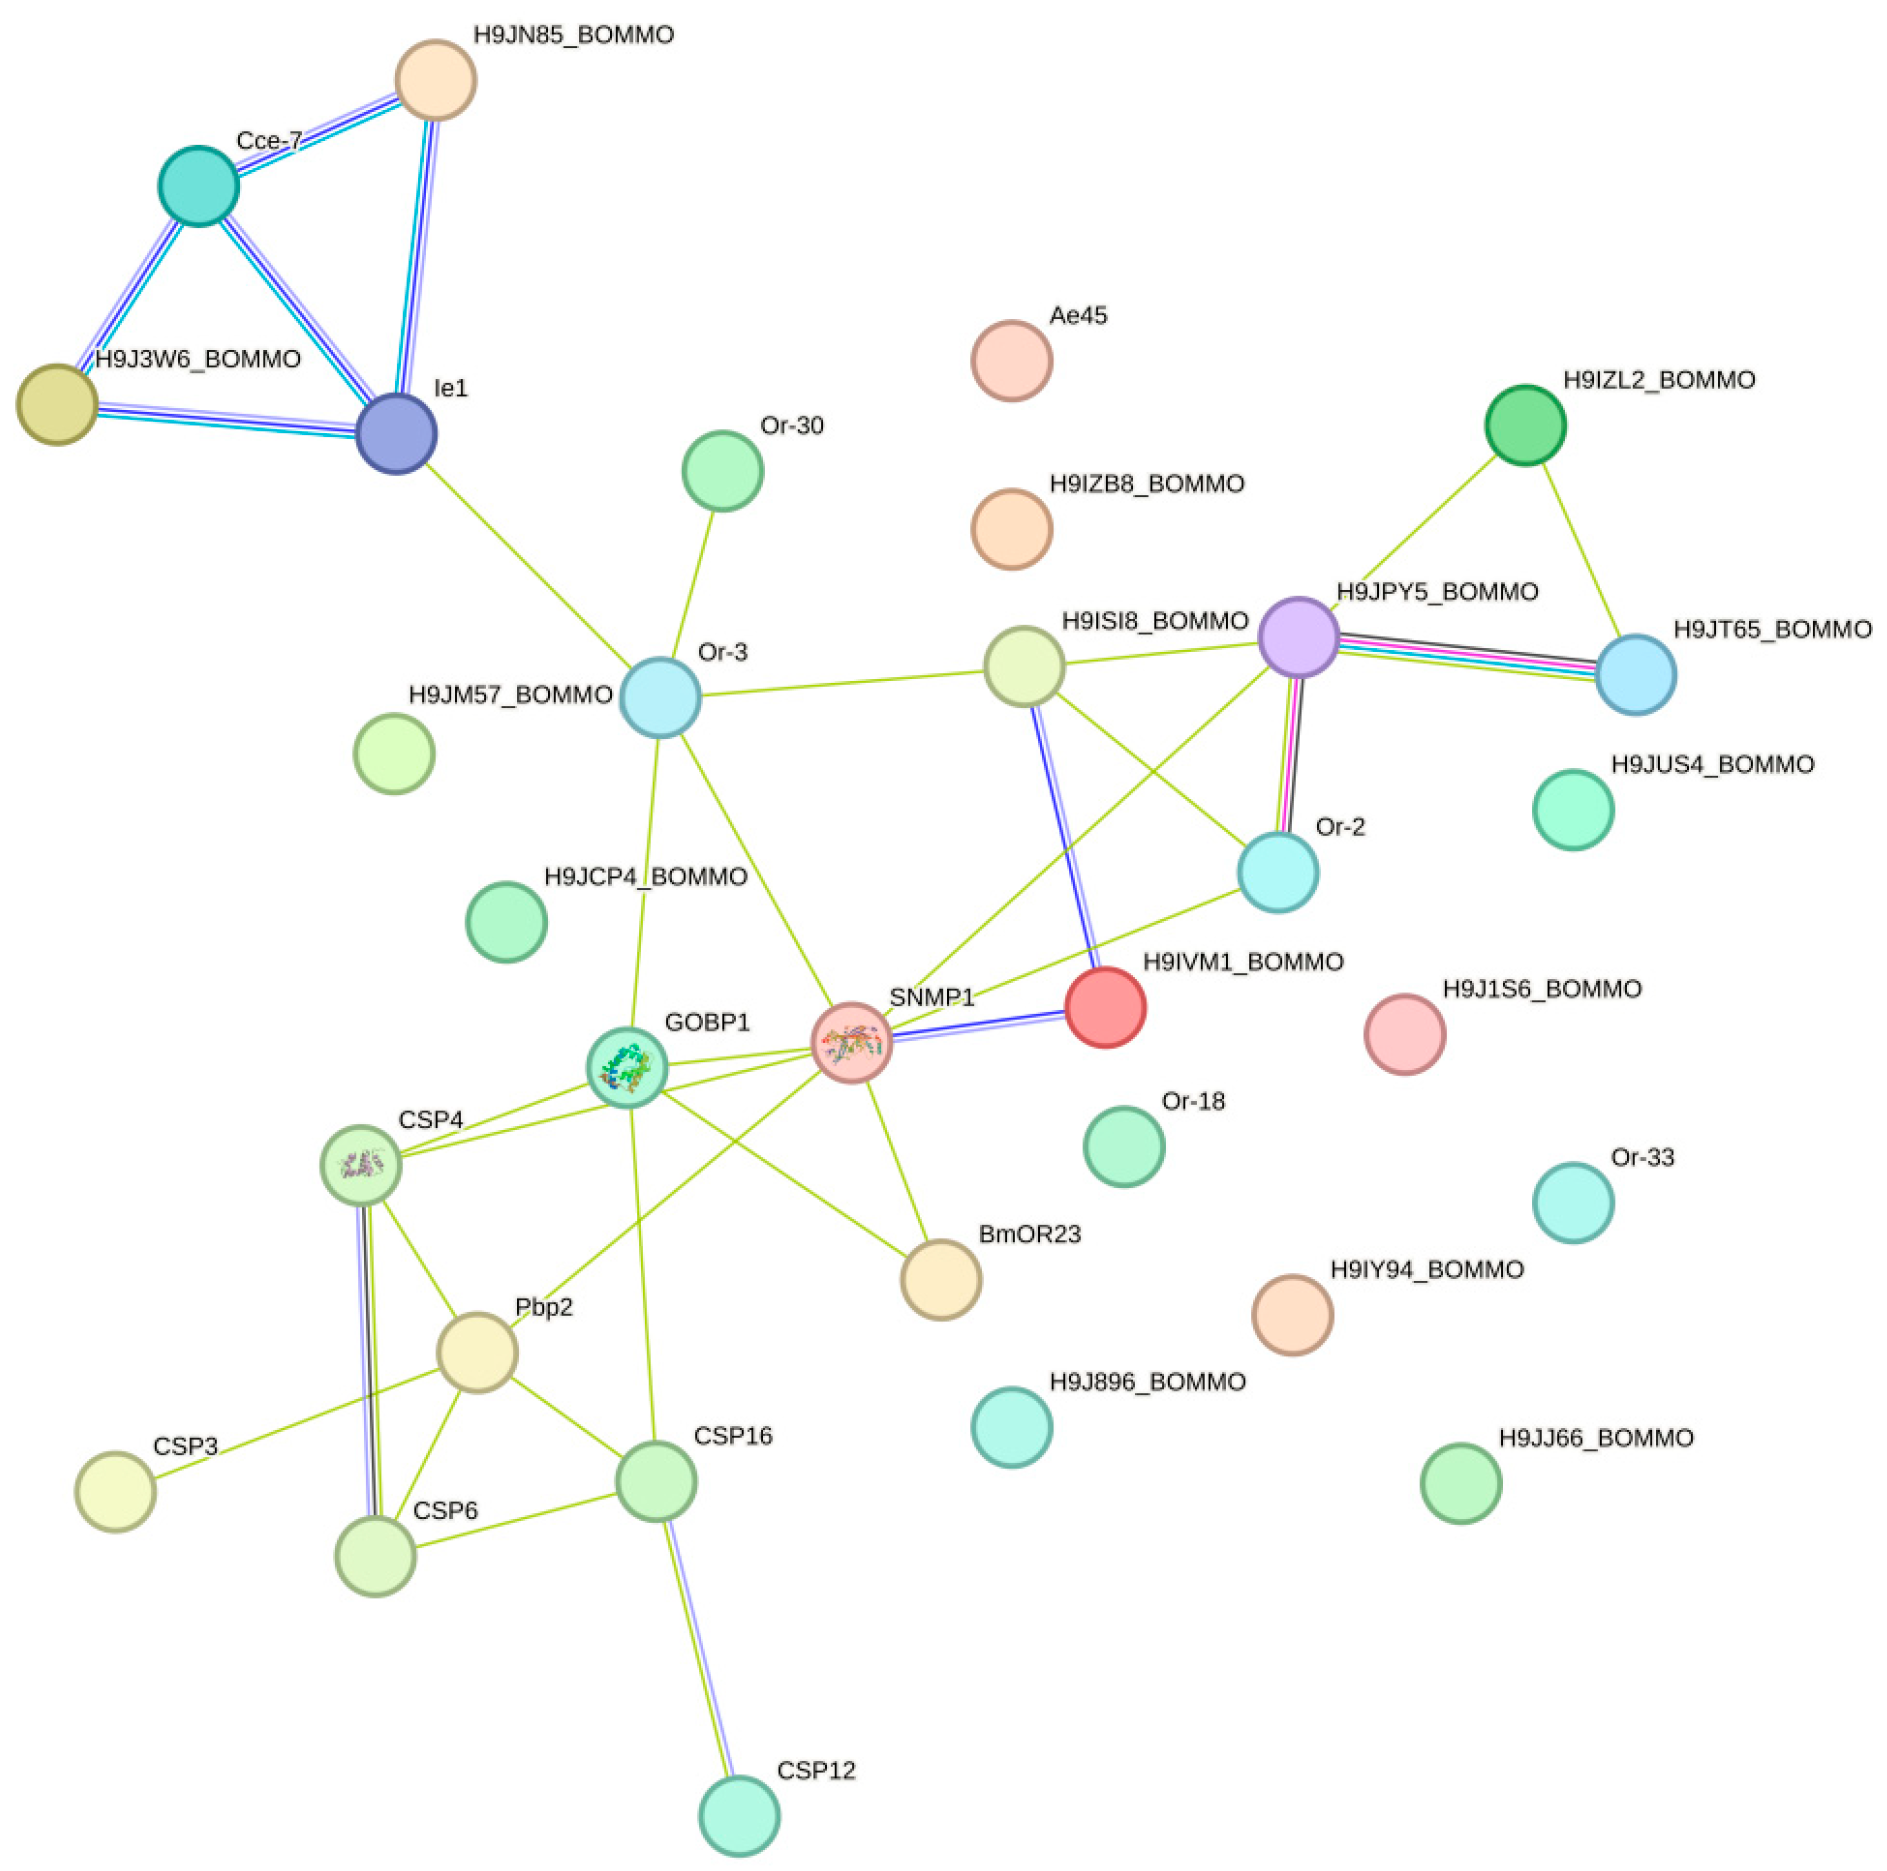
2.8. Protein–Protein Interaction Network Analysis
A protein–protein interaction network analysis of 96 DGE olfactory receptor genes was performed using STRING (https://cn.string-db.org/ accessed on 6 August 2024). As H. cunea did not exist in the STRING database, there was only one option to use homologous proteins to map the interaction network. After comparing Bombyx mori, Drosophila melanogaster, and Heliothis virescens, B. mori was chosen as a reference and mapped protein interaction network. According to network statistical analysis shown in Figure 5, the network comprised 32 nodes, with an expected number of edges of 1, while the actual number of edges was 34. The protein–protein interaction (PPI) enrichment p-value was less than 1.0 × 10⁻¹⁶, indicating that the interactions among these proteins significantly exceeded random expectations. The average node degree of the network was 2.12, and the average local clustering coefficient was 0.386, suggesting the presence of a certain degree of locally dense connections within the network. SNMP1 served as a central node, interacting with multiple proteins, including GobP1, CSP4, Pbp2, CSP16, and CSP6, which might play important roles in signaling or sensory processes. CSP4, CSP8, CSP16, and CSP6 formed a tight cluster, demonstrating strong interactions between them, implying that they might collectively participate in sensory or defense mechanisms. Ie1 interacted with several proteins, including Cce-7 and H9J1W6_BOMMO, indicating a relatively active interaction profile within the network. Qrt8 interacted with Qrt2, Qrt30, GobP1, and other proteins of unknown function (such as H9J5Z_BOMMO), forming a larger subnet that suggests potential collaborative roles in a common biological process. In addition to its interaction with SNMP1, GOBP1 also interacted with proteins such as Qrt8 and Qrt2, which might be involved in sensory perception and signaling pathways.
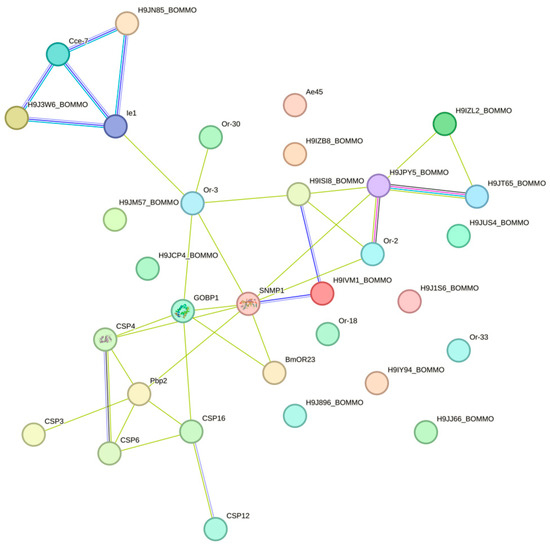
Figure 5.
PPI network of DGE olfactory receptor genes.
2.9. Expression Levels of HcunOR Genes by RT-qPCR
On the basis of the transcriptome data annotation of 21 general odorant receptor genes in the antennae of H. cunea [13], quantitative real-time PCR (qRT-PCR) primers were designed to investigate the expression profiles of these 21 general odorant receptors in the antennae of both female and male moths. As shown in Figure 6, the expression patterns of these 21 odorant receptors in the female and male antennae were analyzed. Through independent sample t-tests, it was found that HcunOR4 (p = 0.004 < 0.01), HcunOR5 (p = 0.016 < 0.05), and HcunOR6 (p = 0.002 < 0.01) were female-biased, while HcunOR48 (p = 0.001 < 0.01), HcunOR49 (p = 0.000 < 0.01), and HcunOR50 (p = 0.000 < 0.01) were male-biased. The results were consistent with the differential expression analysis of the second-generation transcriptome data. For HunOR4, the average FPKM value in female antennae (F-An) was 1.23 ± 0.29, while in male antennae (M-An), it was 0.37 ± 0.11, with a p-value of 0.001. For HcunOR5, the average FPKM value in female antennae was 5.64 ± 1.23, and in male antennae, it was 1.42 ± 0.14, with a p-value of 3.44 × 10⁻⁷. For HcunOR6, the average FPKM value in female antennae was 1.58 ± 0.17, and in male antennae, it was 0.83 ± 0.18, showing higher expression in females, but the difference was not significant. For HcunOR48, the average FPKM value in female antennae (F-An) was 1.01 ± 0.04, while in male antennae (M-An), it was 32.72 ± 2.75, with a p-value of 6.56 × 10−115. For HcunOR50, the average FPKM value in female antennae (F-An) was 3 ± 0.29, and in male antennae (M-An), it was 71.85 ± 7.29, with a p-value of 9.18 × 10−124. For HcunOR49, the average FPKM value in female antennae (F-An) was 4.65 ± 0.51, and in male antennae (M-An), it was 149.07 ± 13.5, with a p-value of 1.47 × 10−166. In summary, the qRT-PCR results were consistent with the differential expression analysis of the transcriptome data. HcunOR4 and HcunOR5 were female-biased, while HcunOR48, HcunOR49, and HcunOR50 were male-biased. HcunOR6 did not show significant differential expression between the sexes in the transcriptome data.
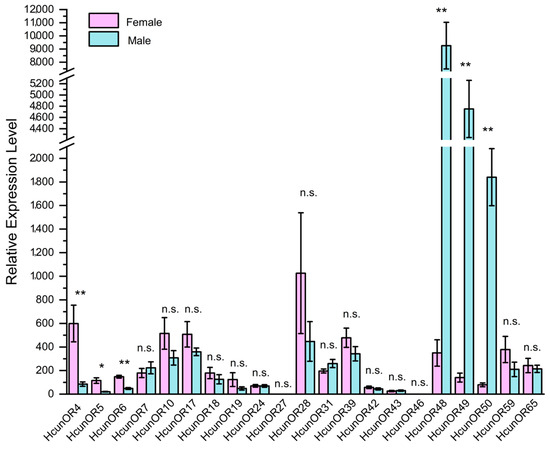
Figure 6.
Expression profiles of general odorant receptors in the antennae of male and female H. cunea by qRT-PCR. **: p < 0.01, *: p < 0.05, n.s.: no significant difference.
3. Discussion
H. cunea is a polyphagous pest that seriously threatens the growth of forest trees. Conducting chemical ecology research on the H. cunea provides a theoretical basis for the scientific control of this pest. Although Zhang et al. published the transcriptome of H. cunea antennae in 2016, their analysis was based on second-generation transcriptome sequencing of mixed samples from male and female antennae [10]. As a result, the olfactory differences between male and female H. cunea remain unclear.
As high-throughput sequencing technology and bioinformatics technology have developed, transcriptome sequencing has become an important means of research in insect chemical ecology, and it is the basis for studying the molecular mechanism of insect olfaction [17,18]. In data quality control, the percentage of bases with a sequencing quality value of Q20 or higher (clean bases) in the raw data was at least 97.64%, and the percentage of bases with a sequencing quality value of Q30 or higher was at least 93.07%. Both were greater than 89%, indicating that the sequencing quality was good and the base composition was balanced with high quality. In the sample correlation analysis, the PCA analysis showed that the biological replicates of the female and male groups were separately clustered on both sides of the PC1 axis, and the cluster analysis of the sample relationships showed that the female and male samples were separately clustered on two branches; the lowest Pearson correlation coefficient between the two samples within each group was 0.921, indicating that the differences between the biological replicates within each group were small and the reproducibility was good [19].
Using GO enrichment analysis and KEGG enrichment analysis, the differentially expressed genes in the antennae of male and female H. cunea were enriched in specific GO categories or KEGG pathways to elucidate the differences in metabolism and gene functional classification in the adult H. cunea antennae. In the GO enrichment analysis, the differentially expressed genes in the antennae of male and female H. cunea were mainly enriched in the biological process category. Among them, 353 genes were female-biased and 406 genes were male-biased, indicating that the antenna function of males may be more complex. This was consistent with the appearance that the male H. cunea antennae were more complex and had more sensillum than the female antennae [20]. In the KEGG metabolic pathway enrichment analysis, a total of 977 differentially expressed genes were enriched in the metabolism category, followed by 127 differentially expressed genes enriched in the environmental information processing category. In the environmental information processing category, the main metabolic pathway subcategory was signal transduction (69 differentially expressed genes), which was consistent with the function of the antennae in converting chemical signals such as odors into electrical signals transmitted to the central nervous system [21,22,23]. This also indicated that there were differences in the function of the male and female antennae.
This study identified a total of 221 olfactory-related genes with complete open reading frames, including 26 odor receptor genes, 77 odorant binding protein genes, 46 chemosensory protein genes, 3 gustatory receptor genes, 40 ionotropic receptor genes, 11 neuronal membrane protein genes, and 18 odorant-degrading enzyme genes. In terms of total numbers, the quantity of olfactory-related genes identified in this study was similar to the results of antennal transcriptome annotation of other Lepidoptera insects, such as 238 candidate olfactory-related genes identified in the antennal transcriptome of the tea pest Agriophara rhombata [24], 142 genes identified in Micromelalopha troglodyta [25], and 217 genes identified in Spodoptera litura [26]. The number of odorant receptors was much lower than the 47 ORs identified by Zhang [10], and we inferred that this might be related to the depth of the third-generation transcriptome sequencing. This study was based on the third-generation sequencing data of our project team supplemented with second-generation transcriptome data, so it is possible that the depth was not sufficient and that some fragments were lost. In addition, this study, in combination with the genome of H. cunea, obtained 22 full-length odor receptor genes (about 400 amino acids), which was basically consistent with the approximately 400 amino acid odor receptor quantity (23 genes) reported by Zhang [10]. This study only identified three gustatory receptor genes, and it was speculated that this was related to the fact that the antennae are not the main taste organs. Several reports have indicated that gustatory receptors are mainly expressed in the mouthparts of insects [27]. There was a total of 96 differentially expressed olfactory-related genes, accounting for 43.24%, indicating differences in olfaction between male and female H. cunea. Olfactory binding protein and neuronal membrane protein genes with significantly differential expression were both male-biased in expression. Males rely on airborne sex pheromones to locate females when seeking mates, and accurate and sensitive localization requires the timely deactivation of each odor molecule [28]. Odor-degrading enzymes and sensory neuron membrane proteins both had the function of degrading odor molecules [29], and the overexpression of these two proteins in males could explain the above phenomenon.
In the published transcriptome paper on the antennae of H. cunea, Zhang used both semi-quantitative and relative quantitative methods to analyze the expression differences of 27 odorant-binding proteins and 17 chemosensory proteins between the two sexes. However, the expression differences of odorant receptors in the antennae of adult males and females were not analyzed. Therefore, this study used quantitative real-time PCR technology to verify the expression levels of the 21 annotated general odorant receptor genes in the two antennal tissues of males and females. Among them, six genes showed significant differential expression, with HcunOR4, HcunOR5, and HcunOR6 preferentially expressed in females and HcunOR48, HcunOR49, and HcunOR50 preferentially expressed in males. Among the eight DGE OR genes in the transcriptome results, the quantitative results of HcunOR4, HcunOR5, HcunOR48, HcunOR49, and HcunOR50 were consistent with the transcriptome differential analysis results. Three genes were inconsistent with the DGE results in the transcriptome. Although the transcriptome showed that HcunOR6 was expressed at a higher level in females than in males, the difference was not significant, which might be related to the use of distinct biological replicates for transcriptome sequencing and quantitative analysis, sequencing errors, and variations in the methods used for differential significance analysis. Since the antennal transcriptome of H. cunea was reported, the functions of sex pheromone receptors in H. cunea have not been reported until now. The sex pheromones of H. cunea belong to the relatively rare type II sex pheromones in moths, with low structural similarity to the common type I sex pheromones. On the basis of the principle of receptor-ligand similarity [13,30], it was inferred that the odorant receptors for recognizing the sex pheromone of H. cunea might not belong to the traditional sex pheromone receptor evolutionary branch. The sex pheromones of Ectropis grisescens and E. obliqua were both type II pheromones of moths. The olfactory transcriptomes of these two moths were analyzed, and a possible type II pheromone receptor evolutionary branch was reported by analyzing the expression differences and evolutionary analysis of OR in the antennae of male and female adults, including four odorant receptors separately—EgriOR24, 31, 37, 44 and EoblOR24, 31, 37, 44—that were highly expressed in the antennae of males [31,32]. In this research, HcunO48, 49, and 50 were also highly expressed in male antennae and clustered together. Therefore, the screening of the overexpressed odorant receptors in male H. cunea could provide a basis for the screening of candidate sex pheromone receptors. The researchers successfully identified the sex pheromone receptors by screening the overexpressed odorant receptor genes in male Spodoptera litura and Epiphyas postvittana, and further verifying them through heterologous expression [33,34].
4. Materials and Methods
4.1. Insect Rearing and Tissue Collection
The H. cunea larvae were reared until pupation, and the pupae were sexed. Adult males and females aged 1–3 days post-eclosion were selected. Using fine forceps, antennae were excised from the base and placed in RNase-free centrifuge tubes. Three biological replicates were performed for both males and females, with 50 pairs of antennae in each replicate, and stored at −80 °C.
4.2. RNA Extraction and cDNA Library Construction
The preparation of transcriptome RNA samples involved extracting total RNA from the antennae of H. cunea using the Trizol (Invitrogen, Carlsbad, CA, USA) method. RNA quality was assessed on an Agilent 2100 Bioanalyzer (Agilent Technologies, Palo Alto, CA, USA) and checked using RNase-free agarose gel electrophoresis. Subsequently, poly(A)-containing eukaryotic mRNA was enriched using magnetic beads with oligo(dT) probes, while prokaryotic mRNA was enriched by removing rRNA with the Ribo-ZeroTM Magnetic Kit (Epicentre, Madison, WI, USA). Using the fragmented mRNA as a template and random oligonucleotides as primers, the first-strand cDNA was synthesized in the presence of M-MuLV reverse transcriptase. This was followed by the degradation of the RNA strand using RNase H and the synthesis of the second cDNA strand using DNA Polymerase I and dNTPs. Then, the cDNA fragments were purified with a QiaQuick PCR extraction kit (Qiagen, Venlo, The Netherlands), end-repaired, poly(A)-added, and ligated to Illumina sequencing adapters. The ligation products were size-selected by agarose gel electrophoresis, PCR-amplified, and sequenced using Illumina HiSeqTM 4000 by Gene Denovo Biotechnology Co. (Guangzhou, China).
4.3. Data Quality Control
To ensure data quality, a series of filtering steps was performed on the raw data prior to information analysis to reduce potential interference from invalid data. Initially, fastp was used to conduct quality control on the raw reads, resulting in the extraction of clean reads by filtering out low-quality data [35]. This included the removal of reads containing adapters, those with an N ratio exceeding 10%, reads composed entirely of A bases, and low-quality reads (where bases with a quality value Q ≤ 20 accounted for over 50% of the entire read). Following data filtration, an analysis of the composition and quality distribution of bases before and after filtering was conducted to visually demonstrate the data’s quality status.
To objectively analyze the transcriptome differences between the antennae tissues of male and female H. cunea, with each group comprising 3 biological replicates and each replicate consisting of antennae tissues from 50 individuals, a principal component analysis (PCA) was conducted using R (http://www.r-project.org/, accessed on 2 October 2020) on the basis of expression level information. The Pearson correlation coefficient was calculated to analyze the correlation and sample clustering between the samples, clarifying the repeatability between sample groups and assisting in the identification of outlier samples. The higher the similarity between samples within each group, the greater the repeatability and reliability of the data. This approach utilized the concept of dimensionality reduction to study the distance relationships between the samples. By calculating the Pearson correlation coefficient for the expression levels between any two samples, the correlation between any pair of samples was visually displayed in the form of a heatmap, providing an intuitive representation of the relationships between any two samples. This analysis helped in understanding the relationships and similarities between the samples, aiding in the identification of patterns and clusters within the dataset.
4.4. Annotation
The third-generation transcriptome from this project team was used as the reference genome, and paired-end clean reads were mapped to the reference genome using HISAT2 2.1.0 [36] and other parameters set as a default. The mapped reads of each sample were assembled by using StringTie v1.3.1 [37,38] in a reference-based approach. To annotate the isoforms, isoforms were BLAST-analyzed against the NCBI non-redundant protein (Nr) database (http://www.ncbi.nlm.nih.gov, accessed on 11 October 2020), the Swiss-Prot protein database (http://www.expasy.ch/sprot, accessed on 11 October 2020), the Kyoto Encyclopedia of Genes and Genomes (KEGG) database (http://www.genome.jp/kegg, accessed on 12 October 2020), and the COG/KOG database (http://www.ncbi.nlm.nih.gov/COG, accessed on 12 October 2020) with the BLASTx program (http://www.ncbi.nlm.nih.gov/BLAST/, accessed on 13 October 2020) at an E-value threshold of 1 × 10⁻⁵ to evaluate sequence similarity with genes of other species. Gene Ontology (GO) annotation was analyzed by Blast2GO software (https://www.blast2go.com/, accessed on 14 October 2020) [39] with Nr annotation results of isoforms. Isoforms that were ranked among those with the top 20 highest scores and were no shorter than 33 HSPs (high-scoring segment pairs) were selected to conduct the Blast2GO analysis. Then, functional classification of isoforms was performed using WEGO software (https://wego.genomics.cn/, accessed on 14 October 2020).
4.5. Expression Statistics and Differential Expression Analysis
For each transcription region, an FPKM (fragment per kilobase of transcript per million mapped reads) value was calculated to quantify its expression abundance and variations using RSEM software (http://deweylab.github.io/RSEM/, accessed on 20 October 2020) [40]. The differential expression analysis was performed using DESeq2 software (https://bioconductor.org/packages/release/bioc/html/DESeq2.html, accessed on 5 November 2020) to analyze the read count data obtained from the analysis of gene expression levels [41]. The analysis mainly consisted of the following three parts: (1) normalizing the read count data, (2) calculating the probability (p-value) of hypothesis testing on the basis of the model, and (3) performing multiple hypothesis testing correction to obtain the false discovery rate (FDR) value. On the basis of the differential analysis results, genes with FDR < 0.05 and |log2FC| > 1 were selected as significantly differentially expressed genes.
4.6. GO and KO Enrichment Analysis
GO Enrichment Analysis involved mapping differentially significant genes to various terms in the Gene Ontology (GO) (http://www.geneontology.org/, accessed on 25 November 2020) database and calculating the number of differentially expressed genes associated with each term. This helped in obtaining a statistical summary of the number of differentially expressed genes linked to a specific GO function. By employing hypergeometric testing, one can filter out GO terms that are significantly enriched in the set of differentially expressed genes compared with the entire genomic background.
In KO (KEGG Orthology) enrichment analysis, the approach is similar, but it focuses on KEGG pathways [42]. By using hypergeometric testing, one can identify significantly enriched pathways in the set of differentially expressed genes compared with the entire genomic background. This process helps in determining the principal biochemical metabolic pathways and signaling pathways in which the genes are differentially expressed. The GO and KO enrichment bubble plots were drawn by R (http://www.r-project.org/, accessed on 3 December 2020).
4.7. Protein–Protein Interaction Network
The protein–protein interaction network was identified using STRING (https://cn.string-db.org/, accessed on 6 August 2024), which determined genes as nodes and interactions as lines in a network. First, the amino acid sequences of 96 differentially expressed olfactory receptors were utilized to perform a homology search against the STRING database for homologous proteins from B. mori. Using the codes of the homologous proteins from B. mori, the protein–protein interaction network diagram was constructed, in which the minimum required interaction score was 0.150.
4.8. RT-qPCR Validation
Total RNA was extracted from the antennal tissues, and the first-strand cDNA was synthesized using the TOYOBO ReverTra Ace qPCR RT Master Mix with the gDNA Remover Kit to remove genomic DNA (gDNA) and perform reverse transcription. The fluorescence quantitative PCR (qRT-PCR) primers were designed using the Prime Premier 5 software. The qRT-PCR reaction system (20 μL) included 10 μL of qPCR Mix, 0.4 μL of reverse primer (10 μM), 0.4 μL of forward primer (10 μM), 1 μL of cDNA, and 8.2 μL of nuclease-free water. The qRT-PCR program was set as follows: 98 °C for 2 min, followed by 40 cycles of 98 °C for 10 s, 60 °C for 10 s, and 68 °C for 1.5 min. Actin (NCBI accession number: MH678709) was used as the reference gene [43], and the relative expression levels of the target receptor genes in the antennal tissues of the two sexes were calculated using the 2−ΔΔCt method. The primer sequences of all genes are shown in Table S8. Each group had 3 biological replicates, and each biological replicate had 3 technical replicates. The relative quantification of gene expression was performed using the 2−ΔΔCT method, and an independent sample T-test was conducted using SPSS 26 software to analyze the differences in the relative expression levels of each gene between males and females.
5. Conclusions
In this study, the second-generation transcriptome of female and male antennal tissues of H. cunea was determined by high-throughput sequencing technology; the olfactory-related genes were annotated, and the differences between females and males were analyzed. Data quality control and analysis of inter-sample relationships showed that the transcriptome quality was good. A total of 221 olfactory-related genes were annotated, and a total of 96 sex-differentiated olfactory-related genes were identified in differential analysis, indicating that there were differences in the olfactory senses between male and female H. cunea. The relative expression levels of 21 general odorant receptor genes in male and female antennae were verified by qPCR, which was consistent with the results of differential analysis of the transcriptome. The identification of the male-biased odorant receptor gene of H. cunea may provide a basis for the analysis of the molecular mechanism of the recognition sex pheromone of H. cunea.
Supplementary Materials
The following supporting information can be downloaded at: https://www.mdpi.com/article/10.3390/ijms25169070/s1.
Author Contributions
Conceptualization, W.M.; methodology, W.M., Y.L.; software, W.M., Y.L.; validation, W.M., Y.L., L.Y.; formal analysis, W.M., Y.L., L.Y.; investigation, W.M., Y.L.; resources, W.M.; data curation, W.M.; writing—original draft preparation, W.M.; writing—review and editing, S.Y.; visualization, W.M.; supervision, S.Y.; project administration, S.Y.; funding acquisition, S.Y. All authors have read and agreed to the published version of the manuscript.
Funding
This research was funded by the National Natural Science Foundation of China, grant number 32171793.
Institutional Review Board Statement
The ethics review was approved by the Science and Technology Ethics Committee of Northeast Forestry University. The ethic approval code was 2024076.
Informed Consent Statement
Not applicable.
Data Availability Statement
Data are contained within the article and Supplementary Materials.
Conflicts of Interest
The authors declare no conflicts of interest.
References
- Ha, T.S.; Smith, D.P. Recent insights into insect olfactory receptors and odorant-binding proteins. Insects 2022, 13, 926. [Google Scholar] [CrossRef] [PubMed]
- Zhao, X.C.; Berg, B.G.; Wang, G. Recent advances in insect olfaction: Characterization of neural circuits from sensory input to motor output. Front. Cell. Neurosci. 2023, 5, 1282499. [Google Scholar]
- Suh, E.; Bohbot, J.; Zwiebel, L.J. Peripheral olfactory signaling in insects. Curr. Opin. Insect Sci. 2014, 1, 86–92. [Google Scholar]
- Liu, Y.; Liu, C.; Lin, K.; Wang, G. Functional specificity of sex pheromone receptors in the cotton bollworm Helicoverpa armigera. PLoS ONE 2013, 8, e62094. [Google Scholar]
- Du, L.X.; Liu, Y.; Wang, G.R. Molecular mechanisms of signal transduction in the peripheral olfactory system of insects. Sci. Sin. Vitae 2016, 46, 573–583. [Google Scholar]
- Dikmen, F.; Dabak, T.; Özgişi, B.D.; Özenirler, Ç.; Kuralay, S.C.; Çay, S.B.; Çınar, Y.U.; Obut, O.; Balcı, M.A.; Akbaba, P.; et al. Transcriptome-wide analysis uncovers regulatory elements of the antennal transcriptome repertoire of bumblebee at different life stages. Insect Biochem. Mol. Biol. 2024, 27. [Google Scholar] [CrossRef]
- Jia, X.J.; Wang, H.X.; Yan, Z.G.; Zhang, M.Z.; Wei, C.H.; Qin, X.C.; Ji, W.R.; Falabella, P.; Du, Y.L. Antennal transcriptome and differential expression of olfactory genes in the yellow peach moth, Conogethes punctiferalis (Lepidoptera: Crambidae). Sci. Rep. 2016, 1, 29067. [Google Scholar]
- Yuan, L.; Li, T.; Huang, Y.; Zhang, A.; Yan, S.; Jiang, D. Identification and potential application of key insecticidal metabolites in Tilia amurensis, a low-preference host of Hyphantria cunea. Pestic. Biochem. Physiol. 2024, 199, 105796. [Google Scholar]
- Zhao, S.; Liu, Y.; Li, H.; Li, Z.; Hao, D. Spatiotemporal patterns of five small heat shock protein genes in Hyphantria cunea in response to thermal stress. Int. J. Mol. Sci. 2023, 24, 15176. [Google Scholar] [CrossRef]
- Zhang, L.W.; Kang, K.; Jiang, S.C.; Zhang, Y.N.; Wang, T.T.; Zhang, J.; Sun, L.; Yang, Y.Q.; Huang, C.C.; Jiang, L.Y.; et al. Analysis of the antennal transcriptome and insights into olfactory genes in Hyphantria cunea (Drury). PLoS ONE 2016, 11, e0164729. [Google Scholar]
- Zhang, X.; Purba, E.R.; Sun, J.; Zhang, Q.H.; Dong, S.L.; Zhang, Y.N.; He, P.; Mang, D.; Zhang, L. Functional differentiation of two general-odorant binding proteins in Hyphantria cunea (Drury) (Lepidoptera: Erebidae). Pest Manag. Sci. 2023, 79, 3312–3325. [Google Scholar] [PubMed]
- Zhang, X.Q.; Mang, D.Z.; Liao, H.; Ye, J.; Qian, J.L.; Dong, S.L.; Zhang, Y.N.; He, P.; Zhang, Q.H.; Purba, E.R.; et al. Functional disparity of three pheromone-binding proteins to different sex pheromone components in Hyphantria cunea (Drury). J. Agric. Food Chem. 2021, 69, 55–66. [Google Scholar]
- Ma, W.C.; Wang, Z.; Yang, Q.M.; Qin, G.X.; Wang, G.R.; Jiang, D.; Yan, S.C. An odorant receptor-derived peptide biosensor for monitoring the occurrence of Hyphantria cunea larvae by recognizing herbivore-induced plant volatile. Sens. Actuators B Chem. 2023, 381, 133432. [Google Scholar]
- Kiyota, R.; Arakawa, M.; Yamakawa, R.; Yasmin, A.; Ando, T. Biosynthetic pathways of the sex pheromone components and substrate selectivity of the oxidation enzymes working in pheromone glands of the fall webworm, Hyphantria cunea. Insect Biochem. Mol. Biol. 2011, 41, 362–369. [Google Scholar] [PubMed]
- Matsumoto, S.; Hull, J.J.; Ohnishi, A.; Moto, K.; Fónagy, A. Molecular mechanisms underlying sex pheromone production in the silkmoth, Bombyx mori: Characterization of the molecular components involved in bombykol biosynthesis. J. Insect Physiol. 2007, 53, 752–759. [Google Scholar]
- Jiang, X.J.; Guo, H.; Di, C.; Yu, S.; Zhu, L.; Huang, L.Q.; Wang, C.Z. Sequence similarity and functional comparisons of pheromone receptor orthologs in two closely related Helicoverpa species. Insect. Biochem. Mol. Biol. 2014, 48, 63–74. [Google Scholar]
- Tian, Z.; Sun, L.; Li, Y.; Quan, L.; Zhang, H.; Yan, W.; Yue, Q.; Qiu, G. Antennal transcriptome analysis of the chemosensory gene families in Carposina sasakii (Lepidoptera: Carposinidae). BMC Genom. 2018, 19, 544. [Google Scholar]
- Mitchell, R.F.; Doucet, D.; Bowman, S.; Bouwer, M.C.; Allison, J.D. Prediction of a conserved pheromone receptor lineage from antennal transcriptomes of the pine sawyer genus Monochamus (Coleoptera: Cerambycidae). J. Comp. Physiol. A 2022, 208, 615–625. [Google Scholar]
- Wang, X.C.; Tan, H.L.; Chen, Z.; Meng, L.Z.; Wang, W.B.; Fan, S.C. Assembly and characterization of the transcriptome and development of SSR markers in forsythia suspensa based on RNA-Seq technology. Sci. Sin. (Vitae) 2015, 45, 301–310. [Google Scholar]
- Zhang, J.; Fu, L.B.; Cheng, B.; Sun, S.H. Morphological Characteristics of Antennal Sensilla in Hyphantria cunea (Drury) (Lepidoptera: Erebidae). Trans. Am. Entomol. Soc. 2019, 145, 421–434. [Google Scholar]
- Kanaujia, S.; Kaissling, K.E. Interactions of pheromone with moth antennae: Adsorption, desorption and transport. J. Insect Physiol. 1985, 31, 71–81. [Google Scholar]
- Pophof, B. Pheromone-binding proteins contribute to the activation of olfactory receptor neurons in the silkmoths Antheraea polyphemus and Bombyx mori. Chem. Senses 2004, 29, 117–125. [Google Scholar]
- Laughlin, J.D.; Ha, T.S.; Jones, D.N. Activation of pheromone-sensitive neurons is mediated by conformational activation of pheromone-binding protein. Cell 2008, 133, 1255–1265. [Google Scholar]
- Long, Y.Q.; Luo, Z.W.; Wang, X.S.; Long, L.X.; Yu, X.S.; Li, J.L.; Qu, H.; Wang, Y.G.; Chen, L.B. Analysis of the antennal transcriptome and olfactory-related genes in the Agriophara rhombata. J. Tea Sci. 2021, 41, 553–563. [Google Scholar]
- Zhang, Y.; Feng, K.; Mei, R.; Li, W.; Tang, F. Analysis of the antennal transcriptome and identification of tissue-specific expression of olfactory-related genes in Micromelalopha troglodyte (Lepidoptera: Notodontidae). J. Insect Sci. 2022, 22, 8. [Google Scholar] [PubMed]
- Huang, J.H.; Zhang, M.Q.; Feng, Q.L.; Cui, Y.; Xiang, H. Comparison of olfactory and gustatory genes between Spodoptera frugiperda and Spodoptera litura. J. Environ. Entomol. 2019, 41, 937–94631. [Google Scholar]
- Xu, W.; Anderson, A. Carbon dioxide receptor genes in cotton bollworm Helicoverpa armigera. Sci. Nat. 2015, 102, 11. [Google Scholar]
- Pregitzer, P.; Greschista, M.; Breer, H.; Krieger, J. The sensory neurone membrane protein SNMP1 contributes to the sensitivity of a pheromone detection system. Insect Mol. Biol. 2014, 23, 733–742. [Google Scholar]
- Ishida, Y.; Leal, W.S. Chiral discrimination of the Japanese beetle sex pheromone and a behavioral antagonist by a pheromone-degrading enzyme. Proc. Natl. Acad. Sci. USA 2008, 105, 9076–9080. [Google Scholar]
- Li, R.T.; Huang, L.Q.; Dong, J.F.; Wang, C.Z. A moth odorant receptor highly expressed in the ovipositor is involved in detecting host-plant volatiles. Elife 2020, 9, e53706. [Google Scholar] [PubMed]
- Li, Z.Q.; Luo, Z.X.; Cai, X.M.; Bian, L.; Xin, Z.J.; Liu, Y.; Chu, B.; Chen, Z.M. Chemosensory gene families in Ectropis grisescens and candidates for detection of Type-II Sex pheromones. Front. Physiol. 2017, 8, 953. [Google Scholar]
- Li, Z.Q.; Cai, X.M.; Luo, Z.X.; Bian, L.; Xin, Z.J.; Chu, B.; Liu, Y.; Chen, Z.M. Comparison of olfactory genes in two Ectropis Species: Emphasis on candidates involved in the detection of Type-II sex pheromones. Front. Physiol. 2018, 9, 1602. [Google Scholar]
- Lin, X.; Zhang, Q.; Wu, Z.; Du, Y. Identification and Differential Expression of a Candidate Sex Pheromone Receptor in Natural Populations of Spodoptera litura. PLoS ONE 2015, 10, e0131407. [Google Scholar]
- Yuvaraj, J.K.; Jordan, M.D.; Zhang, D.D.; Andersson, M.N.; Löfstedt, C.; Newcomb, R.D.; Corcoran, J.A. Sex pheromone receptors of the light brown apple moth, Epiphyas postvittana, support a second major pheromone receptor clade within the Lepidoptera. Insect Biochem. Mol. Biol. 2022, 141, 103708. [Google Scholar]
- Chen, S.; Zhou, Y.; Chen, Y.; Gu, J. fastp: An ultra-fast all-in-one FASTQ preprocessor. Bioinformatics 2018, 34, i884–i890. [Google Scholar]
- Kim, D.; Langmead, B.; Salzberg, S.L. HISAT: A fast spliced aligner with low memory requirements. Nat. Methods 2015, 12, 357. [Google Scholar]
- Pertea, M.; Pertea, G.M.; Antonescu, C.M.; Chang, T.C.; Mendell, J.T.; Salzberg, S.L. StringTie enables improved reconstruction of a transcriptome from RNA-seq reads. Nat. Biotechnol. 2015, 33, 290–295. [Google Scholar]
- Pertea, M.; Kim, D.; Pertea, G.M.; Leek, J.T.; Salzberg, S.L. Transcript-level expression analysis of RNA-seq experiments with HISAT, StringTie and Ballgown. Nat. Protoc. 2016, 11, 1650. [Google Scholar]
- Conesa, A.; Götz, S.; García-Gómez, J.M.; Terol, J.; Talón, M.; Robles, M. Blast2GO: A universal tool for annotation, visualization and analysis in functional genomics research. Bioinformatics 2005, 21, 3674–3676. [Google Scholar] [PubMed]
- Li, B.; Dewey, C.N. RSEM: Accurate transcript quantification from RNA-Seq data with or without a reference genome. BMC Bioinform. 2011, 12, 323. [Google Scholar]
- Love, M.I.; Huber, W.; Anders, S. Moderated estimation of fold change and dispersion for RNAseq data with DESeq2. Genomebiology 2014, 15, 550. [Google Scholar]
- Kanehisa, M.; Goto, S. KEGG: Kyoto encyclopedia of genes and genomes. Nucleic Acids Res. 2000, 28, 27–30. [Google Scholar] [PubMed]
- Tao, R.; Li, H.; Sun, Y.H.; Yu, X.H.; Zhu, H.; Hao, D.J. Identification and screening of internal references genes of Hyphantria cunea (Lepidoptera: Arctiidae). Sci. Silvae Sin. 2019, 55, 111–120. [Google Scholar]

Disclaimer/Publisher’s Note: The statements, opinions and data contained in all publications are solely those of the individual author(s) and contributor(s) and not of MDPI and/or the editor(s). MDPI and/or the editor(s) disclaim responsibility for any injury to people or property resulting from any ideas, methods, instructions or products referred to in the content. |
© 2024 by the authors. Licensee MDPI, Basel, Switzerland. This article is an open access article distributed under the terms and conditions of the Creative Commons Attribution (CC BY) license (https://creativecommons.org/licenses/by/4.0/).