


Anterior Chamber Flare as a Non-Invasive Assessment of Intraocular Immune Status and Ocular Complications in Proliferative Diabetic Retinopathy


Abstract
:1. Introduction
2. Results
2.1. Demographic and Clinical Characteristics
2.2. Anterior Chamber Flare Intensity and Intraocular Cytokine Levels
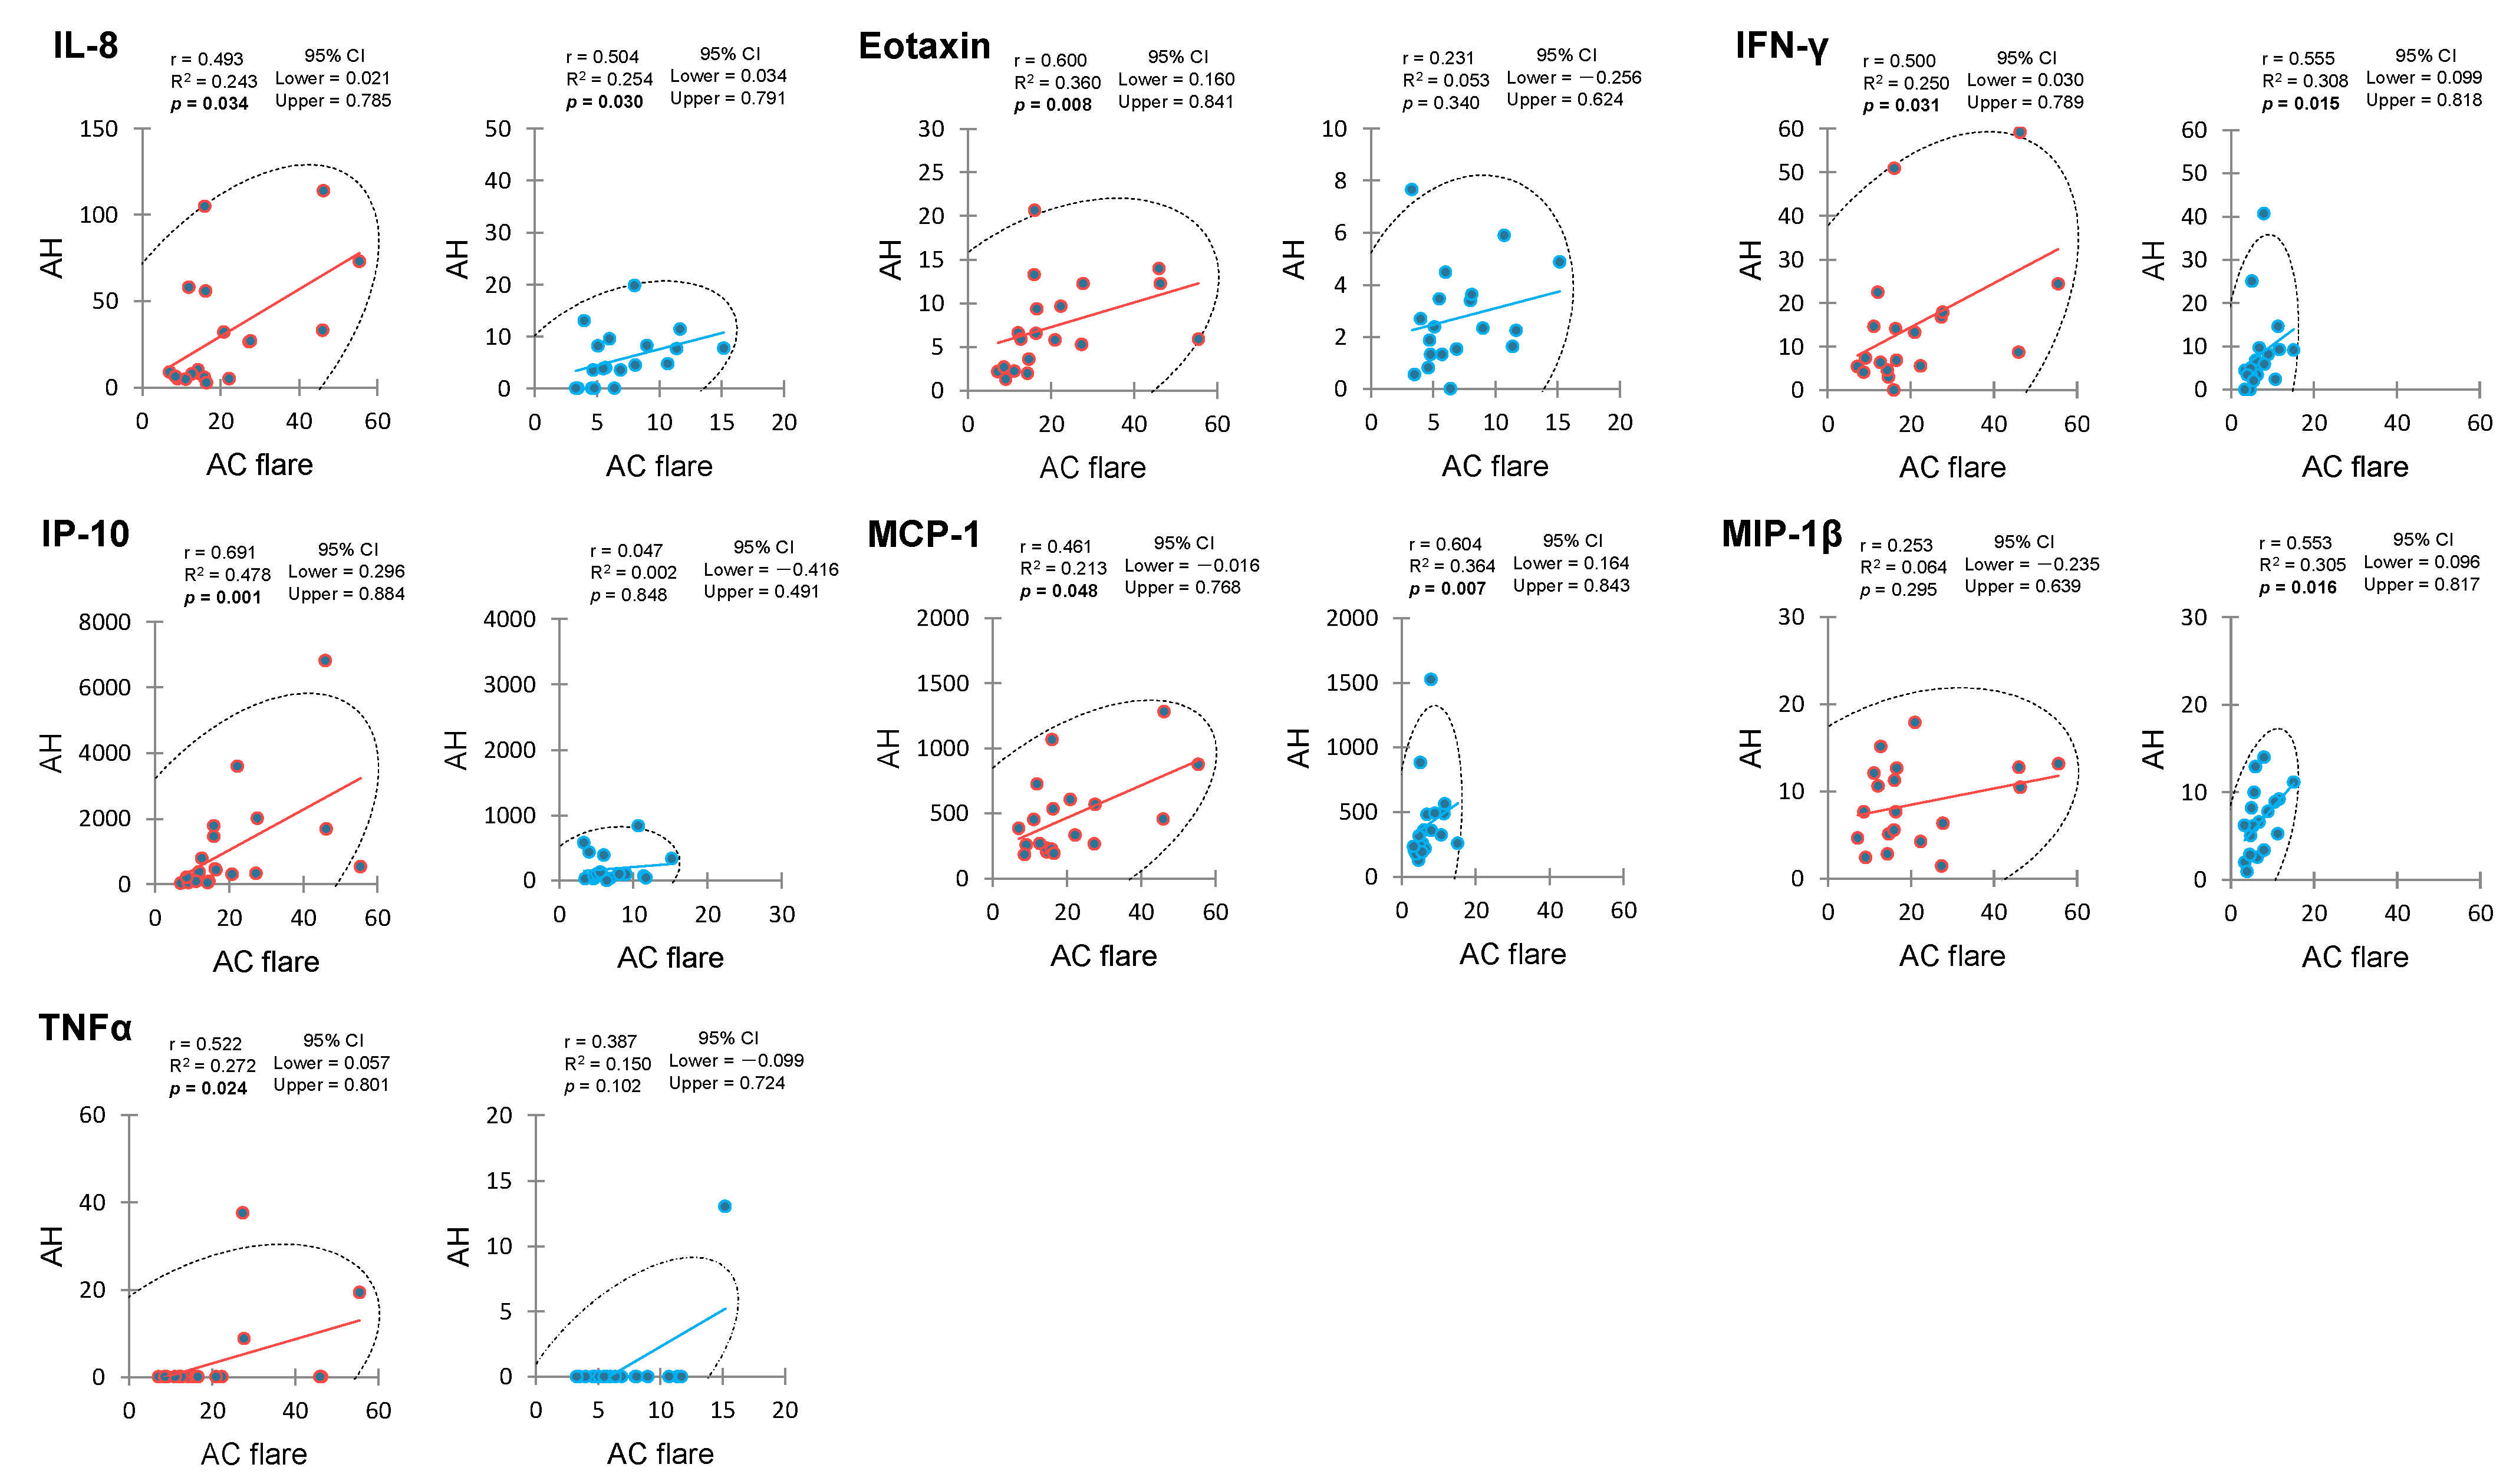
2.3. Correlation between Anterior Chamber Flare and Aqueous Humor Cytokines
2.4. Aqueous Humor Cytokines with Causal Relationship to Anterior Chamber Flare
2.5. Correlation between Anterior Chamber Flare and Vitreous Fluid Cytokines
2.6. Correlation between Aqueous Humor and Vitreous Fluid Cytokines
2.7. Predictive Biomarkers for Complications of Diabetic Macular Edema, Traction Retinal Detachment, and Vitreous Hemorrhage
3. Discussion
4. Materials and Methods
4.1. Subjects
4.2. Diagnostics
4.3. Measurement of Anterior Chamber Flare
4.4. Intraocular Fluid Collection
4.5. Cytokine Measurements
4.6. Statistical Analysis
5. Conclusions
Supplementary Materials
Author Contributions
Funding
Institutional Review Board Statement
Informed Consent Statement
Data Availability Statement
Acknowledgments
Conflicts of Interest
References
- Kempen, J.H.; O’colmain, B.J.; Leske, M.C.; Haffner, S.M.; Klein, R.; Moss, S.E.; Taylor, H.R.; Hamman, R.F. Eye Diseases Prevalence Research Group. The prevalence of diabetic retinopathy among adults in the United States. Arch. Ophthalmol. 2004, 122, 552–563. [Google Scholar] [PubMed]
- Kawasaki, R.; Tanaka, S.; Tanaka, S.; Yamamoto, T.; Sone, H.; Ohashi, Y.; Akanuma, Y.; Yamada, N.; Yamashita, H.; Japan Diabetes Complications Study Group. Incidence and progression of diabetic retinopathy in Japanese adults with type 2 diabetes: 8 year follow-up study of the Japan Diabetes Complications Study (JDCS). Diabetologia 2011, 54, 2288–2294. [Google Scholar] [CrossRef] [PubMed]
- Yau, J.W.Y.; Rogers, S.L.; Kawasaki, R.; Lamoureux, E.L.; Kowalski, J.W.; Bek, T.; Chen, S.-J.; Dekker, J.M.; Fletcher, A.; Grauslund, J.; et al. Global prevalence and major risk factors of diabetic retinopathy. Diabetes Care 2012, 35, 556–564. [Google Scholar] [CrossRef]
- Takeuchi, M.; Sato, T.; Tanaka, A.; Muraoka, T.; Taguchi, M.; Sakurai, Y.; Karasawa, Y.; Ito, M. Elevated levels of cytokines associated with Th2 and Th17 cells in vitreous fluid of proliferative diabetic retinopathy patients. PLoS ONE 2015, 10, e0137358. [Google Scholar] [CrossRef] [PubMed]
- Gologorsky, D.; Thanos, A.; Vavvas, D. Therapeutic interventions against inflammatory and angiogenic mediators in proliferative diabetic retinopathy. Mediat. Inflamm. 2012, 2012, 629452. [Google Scholar] [CrossRef]
- Gustavsson, C.; Agardh, C.-D.; Agardh, E. Profile of intraocular tumour necrosis factor-α and interleukin-6 in diabetic subjects with different degrees of diabetic retinopathy. Acta Ophthalmol. 2013, 91, 445–552. [Google Scholar] [CrossRef]
- Dong, N.; Xu, B.; Wang, B.; Chu, L. Study of 27 aqueous humor cytokines in patients with type 2 diabetes with or without retinopathy. Mol. Vis. 2013, 19, 1734–1746. [Google Scholar]
- Tugal-Tutkun, I.; Herbort, C.P. Laser flare photometry: A noninvasive, objective, and quantitative method to measure intraocular inflammation. Int. Ophthalmol. 2010, 30, 453–464. [Google Scholar] [CrossRef] [PubMed]
- Shah, S.M.; Spalton, D.J.; Taylor, J.C. Correlations between laser flare measurements and anterior chamber protein concentrations. Invest. Ophthalmol. Vis. Sci. 1992, 33, 2878–2884. [Google Scholar]
- Sawa, M.; Tsurimaki, Y.; Tsuru, T.; Shimizu, H. New quantitative method to determine protein concentration and cell number in aqueous in vivo. Jpn. J. Ophthalmol. 1988, 32, 132–142. [Google Scholar]
- Liu, X.; McNally, T.W.; Beese, S.; Downie, L.E.; Solebo, A.L.; Faes, L.; Husain, S.; Keane, P.A.; Moore, D.J.; Denniston, A.K. Non-invasive instrument-based tests for quantifying anterior chamber flare in uveitis: A systematic review. Ocul. Immunol. Inflamm. 2021, 29, 982–990. [Google Scholar] [CrossRef]
- Küchle, M.; Nguyen, N.X.; Martus, P.; Freissler, K.; Schalnus, R. Aqueous flare in retinitis pigmentosa. Graefes Arch. Clin. Exp. Ophthalmol. 1998, 236, 426–433. [Google Scholar] [CrossRef] [PubMed]
- Fujiwara, K.; Ikeda, Y.; Murakami, Y.; Nakatake, S.; Tachibana, T.; Yoshida, N.; Nakao, S.; Hisatomi, T.; Yoshida, S.; Yoshitomi, T.; et al. Association between aqueous flare and epiretinal membrane in retinitis pigmentosa. Invest. Ophthalmol. Vis. Sci. 2016, 57, 4282–4286. [Google Scholar] [CrossRef] [PubMed]
- Kubota, T.; Motomatsu, K.; Sakamoto, M.; Honda, T.; Ishibashi, T. Aqueous flare in eyes with senile disciform macular degeneration: Correlation with clinical stage and area of neovascular membrane. Graefes Arch. Clin. Exp. Ophthalmol. 1996, 234, 285–287. [Google Scholar] [CrossRef]
- Nguyen, N.X.; Schönherr, U.; Küchle, M. Aqueous flare and retinal capillary changes in eyes with diabetic retinopathy. Ophthalmologica 1995, 209, 145–148. [Google Scholar] [CrossRef]
- Oshika, T.; Kato, S.; Funatsu, H. Quantitative assessment of aqueous flare intensity in diabetes. Graefes Arch. Clin. Exp. Ophthalmol. 1989, 227, 518–520. [Google Scholar] [CrossRef]
- Nguyen, N.; Küchle, M. Aqueous flare and cells in eyes with retinal vein occlusion—Correlation with retinal fluorescein angiographic findings. Br. J. Ophthalmol. 1993, 77, 280–283. [Google Scholar] [CrossRef]
- Schröder, S.; Muether, P.S.; Caramoy, A.; Hahn, M.; Abdel-Salam, M.; Diestelhorst, M.; Kirchhof, B.; Fauser, S. Anterior chamber aqueous flare is a strong predictor for proliferative vitreoretinopathy in patients with rhegmatogenous retinal detachment. Retina 2012, 32, 38–42. [Google Scholar] [CrossRef] [PubMed]
- Rubio-Perez, J.M.; Morillas-Ruiz, J.M. A review: Inflammatory process in Alzheimer’s disease, role of cytokines. ScientificWorldJournal 2012, 2012, 756357. [Google Scholar] [CrossRef]
- Takeuchi, M.; Sato, T.; Sakurai, Y.; Taguchi, M.; Harimoto, K.; Karasawa, Y.; Ito, M. Association between aqueous humor and vitreous fluid levels of Th17 cell-related cytokines in patients with proliferative diabetic retinopathy. PLoS ONE 2017, 12, e0178230. [Google Scholar] [CrossRef]
- Wu, F.; Lamy, R.; Ma, D.; Laotaweerungsawat, S.; Chen, Y.; Zhao, T.; Ma, W.; Zhang, F.; Psaras, C.; Stewart, J.M. Correlation of aqueous, vitreous, and plasma cytokine levels in patients with proliferative diabetic retinopathy. Invest. Ophthalmol. Vis. Sci. 2020, 61, 26. [Google Scholar] [CrossRef] [PubMed]
- Bentler, P.M. Multivariate analysis with latent variables: Causal modeling. Ann. Rev. Psychol. 1980, 31, 419–456. [Google Scholar] [CrossRef]
- Yang, H.; Song, H.; Mei, X.; Li, L.; Fu, X.; Zhang, M.; Liu, Z. Experimental research on intraocular aqueous flow by PIV method. Biomed. Eng. Online 2013, 12, 108. [Google Scholar] [CrossRef] [PubMed]
- He, Y.; Li, X.; Zeng, Y. Ocular biofluid mechanics and transport. J. Med. Biomech. 2007, 22, 220–225. [Google Scholar]
- Bill, A. Blood circulation and fluid dynamics in the eye. Physiol. Rev. 1975, 55, 383–417. [Google Scholar] [CrossRef]
- Goel, M.; Picciani, R.G.; Lee, R.K.; Bhattacharya, S.K. Aqueous humor dynamics: A review. Open Ophthalmol. J. 2010, 4, 52–59. [Google Scholar] [CrossRef]
- Kinsey, V.E. Comparative chemistry of aqueous humor in posterior and anterior chambers of rabbit eye, its physiologic significance. AMA Arch. Ophthalmol. 1953, 50, 401–417. [Google Scholar] [CrossRef]
- Bill, A. Some aspects of aqueous humour drainage. Eye 1993, 7, 14–19. [Google Scholar] [CrossRef]
- Sato, T.; Takeuchi, M.; Karasawa, Y.; Takayama, K.; Enoki, T. Comprehensive expression patterns of inflammatory cytokines in aqueous humor of patients with neovascular age-related macular degeneration. Sci. Rep. 2019, 9, 19447. [Google Scholar] [CrossRef]
- Sato, T.; Enoki, T.; Karasawa, Y.; Someya, H.; Taguchi, M.; Harimoto, K.; Takayama, K.; Kanda, T.; Ito, M.; Takeuchi, M. Inflammatory factors of macular atrophy in eyes with neovascular age-related macular degeneration treated with aflibercept. Front. Immunol. 2021, 12, 738521. [Google Scholar] [CrossRef]
- Noma, H.; Funatsu, H.; Yamasaki, M.; Tsukamoto, H.; Mimura, T.; Sone, T.; Hirayama, T.; Tamura, H.; Yamashita, H.; Minamoto, A.; et al. Aqueous humour levels of cytokines are correlated to vitreous levels and severity of macular oedema in branch retinal vein occlusion. Eye 2008, 22, 42–48. [Google Scholar] [CrossRef]
- Lu, B.; Yin, H.; Tang, Q.; Wang, W.; Luo, C.; Chen, X.; Zhang, X.; Kairan Lai, K.; Jingjie Xu, J.; Chen, X.; et al. Multiple cytokine analyses of aqueous humor from the patients with retinitis pigmentosa. Cytokine 2020, 127, 154943. [Google Scholar] [CrossRef]
- Ashton, N. Vascular basement membrane changes in diabetic retinopathy. Montgomery lecture, 1973. Br. J. Ophthalmol. 1974, 58, 344–366. [Google Scholar] [CrossRef]
- Cunha-Vaz, J.G. Pathophysiology of diabetic retinopathy. Br. J. Ophthalmol. 1978, 62, 351–355. [Google Scholar] [CrossRef]
- Kohner, E.M. The evolution and natural history of diabetic retinopathy. Int. Ophthalmol. Clin. 1978, 18, 1–16. [Google Scholar]
- Morone, G.; Tazzi, A.; Carella, G.; Ghisolfi, A.; Colombo, R. Angiomorphology of the ciliary body in diabetic disease. J. Fr. Ophtalmol. 1985, 8, 555–558. [Google Scholar]
- Laatikainen, L. Development and classification of rubeosis iridis in diabetic eye disease. Br. J. Ophthalmol. 1979, 63, 150–156. [Google Scholar] [CrossRef]
- Sato, T.; Okazawa, R.; Nagura, K.; Someya, H.; Nishio, Y.; Enoki, T.; Ito, M.; Takeuchi, M. Association between systemic factors and vitreous fluid cytokines in proliferative diabetic retinopathy. J. Clin. Med. 2023, 12, 2354. [Google Scholar] [CrossRef]
- Saxena, S.; Lai, T.Y.; Koizumi, H.; Farah, M.E.; Ferrara, D.; Pelayes, D.; Sato, T.; Meyer, C.H.; Murray, T.; International Pharmacokinetic Collaboration. Anterior chamber paracentesis during intravitreal injections in observational trials: Effectiveness and safety and effects. Int. J. Retin. Vitr. 2019, 5, 8. [Google Scholar] [CrossRef] [PubMed]
- Klein, S.; Marré, E.; Zenker, H.J.; Koza, K.D. Correlation of diabetic irido- and retinopathy. Fortschr. Ophthalmol. 1983, 79, 428–430. [Google Scholar] [PubMed]
- Yoshida, A.; Ishiko, S.; Kojima, M.; Ogasawara, H. Permeability of the blood-ocular barrier in adolescent and adult diabetic patients. Br. J. Ophthalmol. 1993, 77, 158–161. [Google Scholar] [CrossRef]
- Moriarty, A.P.; Spalton, D.J.; Moriarty, B.J.; Shilling, J.S.; Ffytche, T.J.; Bulsara, M. Studies of the blood-aqueous barrier in diabetes mellitus. Am. J. Ophthalmol. 1994, 117, 768–771. [Google Scholar] [CrossRef] [PubMed]
- Küchle, M.; Schönherr, U.; Nguyen, N.X.; Steinhäuser, B.; Naumann, G.O. Quantitative measurement of aqueous flare and aqueous "cells" in eyes with diabetic retinopathy. Ger. J. Ophthalmol. 1992, 1, 164–169. [Google Scholar]
- Canataroglu, H.; Varinli, I.; Ozcan, A.A.; Canataroglu, A.; Doran, F.; Varinli, S. Interleukin (IL)-6, interleukin (IL)-8 levels and cellular composition of the vitreous humor in proliferative diabetic retinopathy, proliferative vitreoretinopathy, and traumatic proliferative vitreoretinopathy. Ocul. Immunol. Inflamm. 2005, 13, 375–381. [Google Scholar] [CrossRef]
- Kakehashi, A.; Inoda, S.; Mameuda, C.; Kuroki, M.; Jono, T.; Nagai, R.; Horiuchi, S.; Kawakami, M.; Kanazawa, Y. Relationship among VEGF, VEGF receptor, AGEs, and macrophages in proliferative diabetic retinopathy. Diabetes Res. Clin. Pract. 2008, 79, 438–445. [Google Scholar] [CrossRef] [PubMed]
- Funatsu, H.; Yamashita, H.; Noma, H.; Mimura, T.; Nakamura, S.; Sakata, K.; Hori, S. Aqueous humor levels of cytokines are related to vitreous levels and progression of diabetic retinopathy in diabetic patients. Graefes Arch. Clin. Exp. Ophthalmol. 2005, 243, 3–8. [Google Scholar] [CrossRef] [PubMed]
- Cheung, C.M.; Vania, M.; Ang, M.; Chee, S.P.; Li, J. Comparison of aqueous humor cytokine and chemokine levels in diabetic patients with and without retinopathy. Mol. Vis. 2012, 18, 830–837. [Google Scholar]
- Hillier, R.J.; Ojaimi, E.; Wong, D.T.; Mak, M.Y.; Berger, A.R.; Kohly, R.P.; Kertes, P.J.; Forooghian, F.; Boyd, S.R.; Eng, K.; et al. Aqueous humor cytokine levels as biomarkers of disease severity in diabetic macular edema. Retina 2017, 37, 761–769. [Google Scholar] [CrossRef] [PubMed]
- Nguyen, Q.D.; Brown, D.M.; Marcus, D.M.; Boyer, D.S.; Patel, S.; Feiner, L.; Gibson, A.; Sy, J.; Rundle, A.C.; Hopkins, J.J.; et al. Ranibizumab for diabetic macular edema: Results from 2 phase III randomized trials: RISE and RIDE. Ophthalmology 2012, 119, 789–801. [Google Scholar] [CrossRef]
- Martidis, A.; Duker, J.S.; Greenberg, P.B.; Rogers, A.H.; Puliafito, C.A.; Reichel, E.; Baumal, C. Intravitreal triamcinolone for refractory diabetic macular edema. Ophthalmology 2002, 109, 920–927. [Google Scholar] [CrossRef]
- Bakri, S.J.; Kaiser, P.K. Posterior subtenon triamcinolone acetonide for refractory diabetic macular edema. Am. J. Ophthalmol. 2005, 139, 290–294. [Google Scholar] [CrossRef]
- Tomita, Y.; Lee, D.; Tsubota, K.; Negishi, K.; Kurihara, T. Updates on the current treatments for diabetic retinopathy and possibility of future oral therapy. J. Clin. Med. 2021, 10, 4666. [Google Scholar] [CrossRef] [PubMed]
- Zaczek, A.; Hallnäs, K.; Zetterström, C. Aqueous flare intensity in relation to different stages of diabetic retinopathy. Eur. J. Ophthalmol. 1999, 9, 158–164. [Google Scholar] [CrossRef] [PubMed]
- Shiraya, T.; Kure, K.; Araki, F.; Kato, S.; Kaiya, T. Correlation between anterior chamber flare changes and diabetic macular edema after intravitreal injection of ranibizumab and aflibercept. Jpn. J. Ophthalmol. 2020, 64, 250–256. [Google Scholar] [CrossRef]
- Hazra, A.; Gogtay, N. Biostatistics Series module 6: Correlation and linear regression. Indian. J. Dermatol. 2016, 61, 593–601. [Google Scholar] [CrossRef]
- Funatsu, H.; Yamashita, H.; Ikeda, T.; Mimura, T.; Eguchi, S.; Hori, S. Vitreous levels of interleukin-6 and vascular endothelial growth factor are related to diabetic macular edema. Ophthalmology 2003, 110, 1690–1696. [Google Scholar] [CrossRef]
- Funatsu, H.; Noma, H.; Mimura, T.; Eguchi, S.; Hori, S. Association of vitreous inflammatory factors with diabetic macular edema. Ophthalmology 2009, 116, 73–79. [Google Scholar] [CrossRef] [PubMed]
- Yenihayat, F.; Özkan, B.; Kasap, M.; Karabaş, V.L.; Güzel, N.; Akpınar, G.; Pirhan, D. Vitreous IL-8 and VEGF levels in diabetic macular edema with or without subretinal fluid. Int. Ophthalmol. 2019, 39, 821–828. [Google Scholar] [CrossRef]
- Jenkins, A.J.; Joglekar, M.V.; Hardikar, A.A.; Keech, A.C.; O’Neal, D.N.; Januszewski, A.S. Biomarkers in diabetic retinopathy. Rev. Diabet. Stud. 2015, 12, 159–195. [Google Scholar] [CrossRef]
- Wilkinson, C.P.; Ferris, F.L., 3rd; Klein, R.E.; Lee, P.P.; Agardh, C.D.; Davis, M.; Dills, D.; Kampik, A.; Pararajasegaram, R.; Juan, T.; et al. Proposed international clinical diabetic retinopathy and diabetic macular edema disease severity scales. Ophthalmology 2003, 110, 1677–1682. [Google Scholar] [CrossRef]
- Group ETDRSR. Photocoagulation for diabetic macular edema: Early Treatment Diabetic Retinopathy Study report no. 4. Int. Ophthalmol. Clin. 1987, 27, 265–272. [Google Scholar] [CrossRef] [PubMed]
- Cohen, J. A power primer. Psychol. Bull. 1992, 112, 155–159. [Google Scholar] [CrossRef] [PubMed]
- Sato, T.; Takeuchi, M.; Karasawa, Y.; Ito, M. Profiles of cytokines secreted by ARPE-19 cells exposed to light and incubated with anti-VEGF antibody. Biomedicines 2021, 9, 1333. [Google Scholar] [CrossRef]
- Grover, S.; Fishman, G.A.; Anderson, R.J.; Tozatti, M.S.; Heckenlively, J.R.; Weleber, R.G.; Edwards, A.O.; Brown, J., Jr. Visual acuity impairment in patients with retinitis pigmentosa at age 45 years or older. Ophthalmology 1999, 106, 1780–1785. [Google Scholar] [CrossRef] [PubMed]
- Schulze-Bonsel, K.; Feltgen, N.; Burau, H.; Hansen, L.; Bach, M. Visual acuities “hand motion” and “counting fingers” can be quantified with the Freiburg visual acuity test. Invest. Ophthalmol. Vis. Sci. 2006, 47, 1236–1240. [Google Scholar] [CrossRef] [PubMed]
- Agawa, T.; Usui, Y.; Wakabayashi, Y.; Okunuki, Y.; Juan, M.; Umazume, K.; Kezuka, T.; Takeuchi, M.; Yamauchi, Y.; Hiroshi Goto, H. Profile of intraocular immune mediators in patients with age-related macular degeneration and the effect of intravitreal bevacizumab injection. Retina 2014, 34, 1811–1818. [Google Scholar] [CrossRef]


| Category | PDR | Control | p Value | Unit | Reference Range | ||
|---|---|---|---|---|---|---|---|
| n | 19 | 19 | |||||
| Detectable | Mean ± SD | Detectable | Mean ± SD | ||||
| n (%) | n (%) | ||||||
| Age | 19 (100) | 61.5 ± 10.4 | 19 (100) | 66.1 ± 9.42 | 0.194 | year | |
| Gender (M/F) | 13 (68.4)/6 | 8 (42.1)/11 | 0.192 | ||||
| Laterality (R/L) | 8 (42.1)/11 | 8 (42.1)/11 | 0.742 | ||||
| logMAR VA | 19 (100) | 1.87 ± 0.66 | 19 (100) | 0.46 ± 0.33 | 5.55 × 10⁻⁵ | ||
| IOP | 19 (100) | 13.7 ± 3.72 | 19 (100) | 14.6 ± 2.72 | 0.202 | mmHg | 10 to 21 |
| CRT | 6 (31.6) | 361.7 ± 118.8 | 19 (100) | 458.6 ± 97.6 | 0.085 | μm | |
| Subgroup | |||||||
| PRP (+/−) | 8 (42.1)/11 | – | |||||
| Focal PC (+/−) | 0 (0)/19 | – | |||||
| DME (+/−) | 9 (47.4)/11 | – | |||||
| TRD (+/−) | 3 (15.8)/16 | – | |||||
| VH (+/−) | 17 (89.5)/2 | – | |||||
| IVB (+/−) | 0 (0)/19 | – | |||||
| NVG (+/−) | 0 (0)/19 | – | |||||
| MH/ERM | – | 8/11 | |||||
| Category | PDR | 95% Confidence Interval | Control | 95% Confidence Interval | p Value | Detection Range | ||||||
|---|---|---|---|---|---|---|---|---|---|---|---|---|
| n | 19 | 19 | ||||||||||
| Detectable | Mean ± SD | Lower | Upper | Detectable | Mean ± SD | Lower | Upper | |||||
| n (%) | n (%) | |||||||||||
| AC flare intensity | 19 (100) | 21.1 ± 13.9 | 14.4 | 27.7 | 19 (100) | 7.08 ± 3.23 | 5.53 | 8.64 | 4.64 × 10⁻⁵ | 1.00 | to | 500.0 |
| Aqueous humor | ||||||||||||
| PDGF-BB | nd | 0 | 0 | 0 | nd | 0 | 0 | 0 | – | 1.00 | to | 67,187 |
| IL-1β | nd | 0 | 0 | 0 | nd | 0 | 0 | 0 | – | 0.06 | to | 4598 |
| IL-1ra | 14 (73.7) | 33.4 ± 40.0 | 14.1 | 52.6 | 15 (78.9) | 61.9 ± 110.3 | 8.77 | 115.1 | 0.531 | 2.52 | to | 247,147 |
| IL-2 | nd | 0 | 0 | 0 | 0 (0) | 0 | 0 | 0 | – | 0.54 | to | 26,397 |
| IL-4 | 4 (21.1) | 0.12 ± 0.27 | −0.01 | 0.25 | 3 (15.8) | 0.04 ± 0.10 | −0.01 | 0.09 | 0.524 | 0.08 | to | 4035 |
| IL-5 | 1 (5.26) | 0.94 ± 4.11 | −1.04 | 2.93 | 2 (10.5) | 0.68 ± 2.05 | −0.30 | 1.67 | 0.536 | 3.53 | to | 81,206 |
| IL-6 | 18 (94.7) | 260.6 ± 429.3 | 53.7 | 467.5 | 17 (89.5) | 129.6 ± 197.6 | 34.4 | 224.9 | 0.380 | 0.37 | to | 21,699 |
| IL-7 | 7 (36.8) | 3.23 ± 5.59 | 0.54 | 5.93 | 10 (52.6) | 2.76 ± 3.01 | 1.31 | 4.21 | 0.529 | 0.49 | to | 41,077 |
| IL-8 | 19 (100) | 31.1 ± 34.6 | 14.4 | 47.8 | 14 (73.7) | 5.76 ± 5.27 | 3.22 | 8.30 | 0.003 | 0.75 | to | 27,477 |
| IL-9 | 4 (21.1) | 3.44 ± 7.71 | −0.27 | 7.16 | 1 (5.26) | 0.24 ± 1.06 | −0.27 | 0.75 | 0.395 | 0.92 | to | 45,633 |
| IL-10 | nd | 0 | 0 | 0 | nd | 0 | 0 | 0 | – | 0.74 | to | 27,194 |
| IL-12 | nd | 0 | 0 | 0 | nd | 0 | 0 | 0 | – | 1.17 | to | 21,022 |
| IL-13 | 1 (5.26) | 0.08 ± 0.35 | −0.09 | 0.25 | nd | 0 | 0 | 0 | 0.534 | 0.29 | to | 9203 |
| IL-15 | nd | 0 | 0 | 0 | 1 (5.26) | 0.54 ± 2.34 | −0.59 | 1.67 | 0.534 | 1.62 | to | 251,038 |
| IL-17A | 1 (5.26) | 0.56 ± 2.46 | −0.62 | 1.75 | nd | 0 | 0 | 0 | 0.534 | 1.69 | to | 41,194 |
| Eotaxin | 19 (100) | 7.41 ± 5.17 | 4.92 | 9.90 | 18 (94.7) | 2.73 ± 1.93 | 1.80 | 3.67 | 0.003 | 0.07 | to | 7488 |
| bFGF | nd | 0 | 0 | 0 | nd | 0 | 0 | 0 | – | 3.02 | to | 63,088 |
| G-CSF | 3 (15.8) | 8.63 ± 29.5 | −5.57 | 22.8 | 2 (10.5) | 3.35 ± 12.0 | −2.44 | 9.15 | 0.534 | 1.67 | to | 13,8193 |
| GM-CSF | nd | 0 | 0 | 0 | nd | 0 | 0 | 0 | – | 0.38 | to | 10,559 |
| IFN-γ | 18 (94.7) | 15.0 ± 15.7 | 7.44 | 22.5 | 17 (89.5) | 8.26 ± 9.73 | 3.57 | 13.0 | 0.076 | 0.35 | to | 20,941 |
| IP-10 | 19 (100) | 1108.7 ± 1664.5 | 306.5 | 1911.0 | 18 (94.7) | 183.4 ± 226.4 | 74.3 | 292.5 | 0.012 | 2.75 | to | 48,834 |
| MCP-1 | 19 (100) | 479.4 ± 314.3 | 327.9 | 630.9 | 19 (100) | 404.3 ± 324.5 | 247.9 | 560.7 | 0.294 | 0.44 | to | 11,213 |
| MIP-1α | 14 (73.7) | 0.45 ± 0.38 | 0.26 | 0.63 | 9 (47.4) | 0.19 ± 0.25 | 0.07 | 0.31 | 0.0495 | 0.04 | to | 1045 |
| MIP-1β | 19 (100) | 8.60 ± 4.69 | 6.34 | 10.9 | 19 (100) | 6.62 ± 3.77 | 4.80 | 8.44 | 0.242 | 0.29 | to | 8095 |
| RANTES | 4 (21.1) | 6.00 ± 15.5 | −1.46 | 13.5 | nd | 0 | 0 | 0 | 0.277 | 1.41 | to | 51,984 |
| TNFα | 3 (15.8) | 3.46 ± 9.54 | −1.14 | 8.06 | 1 (5.26) | 0.69 ± 2.99 | −0.76 | 2.13 | 0.509 | 2.73 | to | 63,996 |
| VEGF-A | 4 (21.1) | 19.0 ± 40.1 | −0.37 | 38.3 | 3 (15.8) | 12.3 ± 36.2 | −5.09 | 29.8 | 0.531 | 2.42 | to | 209,528 |
| Category | PDR | 95% Confidence Interval | Control | 95% Confidence Interval | p Value | Detection Range | ||||||
|---|---|---|---|---|---|---|---|---|---|---|---|---|
| n | 19 | 19 | ||||||||||
| Detectable | Mean ± SD | Lower | Upper | Detectable | Mean ± SD | Lower | Upper | |||||
| Rate (%) | Rate (%) | |||||||||||
| AC Flare | 19 (100) | 21.1 ± 13.9 | 14.4 | 27.7 | 19 (100) | 7.08 ± 3.23 | 5.53 | 8.64 | 4.64 × 10⁻⁵ | 1.00 | to | 500.0 |
| Vitreous fluid | ||||||||||||
| PDGF-BB | 5 (26.3) | 15.2 ± 43.4 | −5.71 | 36.1 | nd | 0 | 0 | 0 | 0.178 | 1.00 | to | 67,187 |
| IL-1β | 3 (15.8) | 0.07 ± 0.19 | −0.02 | 0.17 | nd | 0 | 0 | 0 | 0.411 | 0.06 | to | 4598 |
| IL-1ra | 16 (84.2) | 28.6 ± 20.6 | 18.7 | 38.5 | 15 (78.9) | 16.2 ± 14.0 | 9.43 | 22.9 | 0.060 | 2.52 | to | 247,147 |
| IL-2 | 1 (5.26) | 0.10 ± 0.43 | −0.11 | 0.31 | nd | 0 | 0 | 0 | 0.534 | 0.54 | to | 26,397 |
| IL-4 | 6 (31.6) | 0.20 ± 0.37 | 0.03 | 0.38 | 4 (21.1) | 0.02 ± 0.05 | ≈0 | 0.05 | 0.373 | 0.08 | to | 4035 |
| IL-5 | 2 (10.5) | 1.33 ± 4.57 | −0.87 | 3.54 | nd | 0 | 0 | 0 | 0.511 | 3.53 | to | 81,206 |
| IL-6 | 13 (68.4) | 57.5 ± 106.0 | 6.44 | 108.7 | 8 (42.1) | 7.81 ± 24.9 | −4.17 | 19.8 | 0.041 | 0.37 | to | 21,699 |
| IL-7 | 17 (89.5) | 18.3 ± 10.5 | 13.2 | 23.3 | 18 (94.7) | 15.1 ± 9.34 | 10.6 | 19.6 | 0.271 | 0.49 | to | 41,077 |
| IL-8 | 19 (100) | 102.3 ± 133.2 | 38.1 | 166.5 | 14 (73.7) | 3.87 ± 3.65 | 2.11 | 5.63 | 1.25 × 10⁻⁵ | 0.75 | to | 27,477 |
| IL-9 | 6 (31.6) | 3.42 ± 6.50 | 0.28 | 6.55 | nd | 0 | 0 | 0 | 0.106 | 0.92 | to | 45,633 |
| IL-10 | 2 (10.5) | 0.25 ± 0.85 | −0.15 | 0.66 | nd | 0 | 0 | 0 | 0.511 | 0.74 | to | 27,194 |
| IL-12 | nd | 0 | 0 | 0 | nd | 0 | 0 | 0 | – | 1.17 | to | 21,022 |
| IL-13 | 4 (21.1) | 0.71 ± 1.82 | −0.17 | 1.59 | 4 (21.1) | 0.35 ± 0.72 | 0.01 | 0.70 | 0.545 | 0.29 | to | 9203 |
| IL-15 | nd | 0 | 0 | 0 | nd | 0 | 0 | 0 | – | 1.62 | to | 251,038 |
| IL-17A | 3 (15.8) | 0.91 ± 2.19 | −0.14 | 1.97 | nd | 0 | 0 | 0 | 0.411 | 1.69 | to | 41,194 |
| Eotaxin | 19 (100) | 12.1 ± 8.01 | 8.23 | 16.0 | 19 (100) | 3.88 ± 1.72 | 3.05 | 4.71 | 3.40 × 10⁻⁵ | 0.07 | to | 7488 |
| bFGF | 1 (5.26) | 0.25 ± 1.07 | −0.27 | 0.76 | nd | 0 | 0 | 0 | 0.534 | 3.02 | to | 63,088 |
| G-CSF | 5 (26.3) | 15.5 ± 37.0 | −2.34 | 33.3 | 3 (15.8) | 1.70 ± 4.08 | −0.27 | 3.67 | 0.463 | 1.67 | to | 138,193 |
| GM-CSF | 1 (5.26) | 0.06 ± 0.25 | −0.06 | 0.18 | nd | 0 | 0 | 0 | 0.534 | 0.38 | to | 10,559 |
| IFN-γ | 19 (100) | 34.3 ± 32.4 | 18.7 | 49.9 | 15 (78.9) | 4.35 ± 3.90 | 2.47 | 6.23 | 1.74 × 10⁻⁴ | 0.35 | to | 20,941 |
| IP-10 | 19 (100) | 3033.2 ± 5035.2 | 606.4 | 5460.1 | 18 (94.7) | 467.3 ± 378.0 | 285.1 | 649.5 | 7.56 × 10⁻⁴ | 2.75 | to | 48,834 |
| MCP-1 | 19 (100) | 789.2 ± 605.8 | 497.2 | 1081.2 | 19 (100) | 247.9 ± 82.0 | 208.4 | 287.4 | 1.93 × 10⁻⁴ | 0.44 | to | 11,213 |
| MIP-1α | 18 (94.7) | 1.21 ± 1.29 | 0.58 | 1.83 | 5 (26.3) | 0.06 ± 0.11 | 0.01 | 0.11 | 2.62 × 10⁻⁵ | 0.04 | to | 1045 |
| MIP-1β | 18 (94.7) | 8.33 ± 7.21 | 4.86 | 11.8 | 19 (100) | 2.61 ± 2.13 | 1.59 | 3.64 | 0.004 | 0.29 | to | 8095 |
| RANTES | 10 (52.6) | 11.9 ± 20.4 | 2.07 | 21.7 | nd | 0 | 0 | 0 | 0.009 | 1.41 | to | 51,984 |
| TNFα | 9 (47.4) | 19.5 ± 39.3 | 0.58 | 38.4 | 2 (10.5) | 1.73 ± 5.61 | −0.97 | 4.44 | 0.0495 | 2.73 | to | 63,996 |
| VEGF-A | 6 (31.6) | 228.6 ± 661.5 | −90.3 | 547.4 | 1 (5.26) | 0.26 ± 1.12 | −0.28 | 0.80 | 0.155 | 2.42 | to | 209,528 |
| PDR | |||||||||||||||||||||
| AC Flare | IL-1ra | IL-4 | IL-5 | IL-6 | IL-7 | IL-8 | IL-9 | IL-13 | IL-17A | Eotaxin | G-CSF | IFN-γ | IP-10 | MCP-1 | MIP-1α | MIP-1β | RANTES | TNFα | VEGF-A | ||
| AC Flare | - | 0.326 | 0.459 | 0.286 | 0.403 | 0.786 | 0.032 | 0.560 | 0.376 | 0.376 | 0.007 | 0.814 | 0.029 | 0.001 | 0.047 | 0.466 | 0.297 | 0.143 | 0.022 | 0.920 | |
| IL-1ra | - | 0.769 | 0.145 | 0.735 | 0.513 | 0.553 | 0.094 | N/A | N/A | 0.175 | 0.181 | 0.243 | 0.139 | 0.374 | 0.148 | 0.292 | 0.245 | 0.807 | 0.392 | ||
| IL-4 | - | 0.016 | 0.004 | 0.110 | 0.295 | 0.065 | 0.622 | 0.622 | 0.357 | 0.862 | 0.516 | 0.325 | 0.968 | 0.667 | 0.212 | 0.135 | 0.708 | 0.295 | |||
| IL-5 | - | 0.101 | 0.476 | 0.149 | 0.016 | 0.821 | 0.821 | 0.286 | 0.679 | 0.598 | 0.376 | 0.861 | 0.595 | 0.481 | 0.072 | 0.679 | 0.623 | ||||
| IL-6 | - | 0.015 | 0.904 | 0.123 | 0.101 | 0.101 | 0.283 | 0.888 | 0.304 | 0.185 | 0.098 | 0.444 | 0.008 | 0.425 | 0.814 | 0.437 | |||||
| IL-7 | - | 0.795 | 0.449 | 0.055 | 0.055 | 0.016 | 0.184 | 0.707 | 0.027 | 0.415 | 0.429 | 0.112 | 0.111 | 0.216 | 0.111 | ||||||
| IL-8 | - | 0.056 | 0.861 | 0.861 | 0.099 | 0.814 | 0.002 | 0.154 | 3.66 × 10⁻⁵ | 0.004 | 0.260 | 0.013 | 0.283 | 0.952 | |||||||
| IL-9 | - | 0.623 | 0.623 | 0.602 | 0.060 | 0.952 | 0.602 | 0.637 | 0.550 | 0.008 | 1.34 × 10⁻⁴ | 0.364 | 0.955 | ||||||||
| IL-13 | - | N/A# | 0.598 | 0.679 | 0.481 | 0.726 | 0.598 | 0.206 | 0.101 | 0.623 | 0.006 | 0.623 | |||||||||
| IL-17A | - | 0.598 | 0.679 | 0.481 | 0.726 | 0.598 | 0.206 | 0.101 | 0.623 | 0.006 | 0.623 | ||||||||||
| Eotaxin | - | 0.166 | 0.149 | 1.86 × 10⁻⁸ | 0.077 | 0.219 | 0.132 | 0.520 | 0.911 | 0.193 | |||||||||||
| G-CSF | - | 0.665 | 0.297 | 0.973 | 0.120 | 0.078 | 0.025 | 0.446 | 0.033 | ||||||||||||
| IFN-γ | - | 0.119 | 3.89 × 10⁻⁶ | 0.009 | 0.141 | 0.408 | 0.076 | 0.637 | |||||||||||||
| IP-10 | - | 0.067 | 0.294 | 0.152 | 0.659 | 0.516 | 0.368 | ||||||||||||||
| MCP-1 | - | 0.005 | 0.065 | 0.085 | 0.435 | 0.764 | |||||||||||||||
| MIP-1α | - | 5.88 × 10⁻⁴ | 0.770 | 0.494 | 0.427 | ||||||||||||||||
| MIP-1β | - | 0.083 | 0.612 | 0.652 | |||||||||||||||||
| RANTES | - | 0.364 | 0.229 | ||||||||||||||||||
| TNFα | - | 0.759 | |||||||||||||||||||
| VEGF-A | - | ||||||||||||||||||||
| Control | |||||||||||||||||||||
| AC Flare | IL-1ra | IL-4 | IL-5 | IL-6 | IL-7 | IL-8 | IL-9 | IL-15 | Eotaxin | G-CSF | IFN-γ | IP-10 | MCP-1 | MIP-1α | MIP-1β | TNFα | VEGF-A | ||||
| AC Flare | - | 0.443 | 0.727 | 0.658 | 0.052 | 0.419 | 0.028 | 0.598 | 0.598 | 0.342 | 0.658 | 0.014 | 0.847 | 0.006 | 0.195 | 0.014 | 0.101 | 0.727 | |||
| IL-1ra | - | 0.225 | 0.706 | 0.341 | 0.182 | 0.281 | 0.208 | 0.860 | 0.563 | 0.706 | 0.353 | 0.409 | 0.298 | 0.949 | 0.698 | 0.479 | 0.225 | 0.75~1 | |||
| IL-4 | - | 2.85 × 10⁻⁴ | 0.014 | 0.383 | 0.169 | 0.679 | 0.017 | 0.596 | 2.85 × 10⁻⁴ | 0.064 | 0.524 | 0.078 | 0.028 | 0.275 | 0.679 | N/A# | 0.50~0.75 | ||||
| IL-5 | - | 0.085 | 0.047 | 0.429 | 0.743 | 4.27 × 10⁻⁴ | 0.820 | N/A# | 0.042 | 0.925 | 0.080 | 0.137 | 0.872 | 0.743 | 2.85 × 10⁻⁴ | 0.25~0.50 | |||||
| IL-6 | - | 0.510 | 0.011 | 0.101 | 0.285 | 0.145 | 0.085 | 0.003 | 0.134 | 1.91 × 10⁻⁴ | 0.002 | 9.10 × 10⁻⁵ | N/A | 0.014 | 0~0.25 | ||||||
| IL-7 | - | 0.125 | 0.348 | 0.257 | 0.457 | 0.047 | 0.274 | 0.506 | 0.838 | 0.722 | 0.474 | 0.183 | 0.383 | −0.25~0 | |||||||
| IL-8 | - | 0.098 | 0.477 | 0.046 | 0.429 | 0.003 | 0.032 | 0.006 | 0.012 | 0.015 | 0.595 | 0.169 | −0.50~−0.25 | ||||||||
| IL-9 | - | 0.821 | 0.598 | 0.743 | 0.101 | 0.598 | 0.101 | 0.503 | 0.101 | 0.821 | 0.679 | −0.75~−0.50 | |||||||||
| IL-15 | - | 0.861 | 4.27 × 10⁻⁴ | 0.149 | 0.726 | 0.149 | 0.073 | 0.598 | 0.821 | 0.017 | −1~−0.75 | ||||||||||
| Eotaxin | - | 0.820 | 0.899 | 1.73 × 10⁻⁷ | 0.399 | 0.142 | 0.039 | 0.210 | 0.596 | ||||||||||||
| G-CSF | - | 0.042 | 0.925 | 0.080 | 0.137 | 0.872 | 0.743 | 2.85 × 10⁻⁴ | |||||||||||||
| IFN-γ | - | 0.819 | 4.30 × 10⁻⁶ | 0.016 | 0.036 | 0.481 | 0.064 | ||||||||||||||
| IP-10 | - | 0.753 | 0.142 | 0.055 | 0.376 | 0.524 | |||||||||||||||
| MCP-1 | - | 0.007 | 0.003 | 0.726 | 0.078 | ||||||||||||||||
| MIP-1α | - | 4.50 × 10⁻⁴ | 0.245 | 0.028 | |||||||||||||||||
| MIP-1β | - | 0.210 | 0.275 | ||||||||||||||||||
| TNFα | - | 0.679 | |||||||||||||||||||
| VEGF-A | - |
| PDR | |||||||
| R | Corrected R | R2 | Corrected R2 | Durbin–Watson Ratio | AIC | p Value | |
| 0.767 | 0.712 | 0.589 | 0.506 | 2.366 | 90.00 | 0.003 | |
| AC Flare | PRC | SE | Standard PRC | 95% Confidence Interval | t Value | p Value | |
| Lower | Upper | ||||||
| IL-7 | 0.843 | 0.444 | 0.340 | −0.104 | 1.790 | 1.896 | 0.077 |
| IP-10 | 0.005 | 0.001 | 0.541 | 0.001 | 0.008 | 3.090 | 0.007 |
| MCP-1 | 0.024 | 0.008 | 0.551 | 0.008 | 0.040 | 3.208 | 0.006 |
| Control | |||||||
| R | Corrected R | R2 | Corrected R2 | Durbin–Watson Ratio | AIC | p Value | |
| 0.634 | 0.572 | 0.402 | 0.327 | 2.524 | 39.80 | 0.016 | |
| AC Flare | PRC | SE | Standard PRC | 95% Confidence Interval | t Value | p Value | |
| Lower | Upper | ||||||
| IL-7 | 0.468 | 0.214 | 0.436 | 0.016 | 0.921 | 2.193 | 0.043 |
| MIP-1β | 0.493 | 0.171 | 0.574 | 0.131 | 0.855 | 2.887 | 0.011 |
| PDR | ||||||||||||||||||||||||||
| AC Flare | PDGF-BB | IL-1β | IL-1ra | IL-2 | IL-4 | IL-5 | IL-6 | IL-7 | IL-8 | IL-9 | IL-10 | IL-13 | IL-17A | Eotaxin | bFGF | G-CSF | GM-CSF | IFN-γ | IP-10 | MCP-1 | MIP-1α | MIP-1β | RANTES | TNFα | VEGF-A | |
| AC Flare | – | 0.019 | 0.052 | 0.030 | 0.286 | 0.039 | 0.289 | 0.169 | 0.509 | 0.047 | 0.387 | 0.086 | 0.224 | 0.299 | 0.047 | 0.286 | 0.971 | 0.101 | 0.016 | 0.024 | 0.003 | 0.021 | 0.154 | 0.415 | 0.014 | 0.585 |
| PDGF-BB | – | 0.019 | 0.053 | 0.029 | 6.11 × 10⁻⁴ | 0.010 | 0.162 | 0.156 | 0.024 | 0.151 | 0.001 | 0.371 | 0.700 | 0.028 | 0.029 | 0.265 | 0.571 | 0.039 | 0.027 | 0.051 | 0.015 | 0.019 | 0.153 | 0.088 | 5.26 × 10⁻⁴ | |
| IL-1β | – | 0.434 | 0.006 | 4.13 × 10⁻⁴ | 0.093 | 0.003 | 0.116 | 0.835 | 0.177 | 7.06 × 10⁻⁶ | 0.553 | 0.406 | 0.005 | 0.006 | 0.470 | 0.679 | 0.217 | 0.004 | 0.431 | 0.185 | 0.079 | 0.022 | 0.214 | 0.035 | ||
| IL-1ra | – | 0.209 | 0.578 | 0.563 | 0.577 | 0.483 | 0.004 | 0.215 | 0.143 | 0.114 | 0.043 | 0.853 | 0.209 | 0.879 | 0.598 | 0.011 | 0.518 | 0.001 | 0.018 | 0.066 | 0.859 | 0.013 | 0.608 | |||
| IL-2 | – | 0.042 | 4.27 × 10⁻⁴ | 0.203 | 0.101 | 0.598 | 0.075 | 4.27 × 10⁻⁴ | 0.072 | 0.040 | 0.101 | N/A# | 0.029 | 0.821 | 0.286 | 0.210 | 0.481 | 0.598 | 0.149 | 0.082 | 0.247 | 0.043 | ||||
| IL-4 | – | 0.013 | 0.005 | 0.348 | 0.289 | 0.060 | 0.003 | 0.448 | 0.822 | 2.63 × 10⁻⁴ | 0.042 | 0.112 | 0.522 | 0.097 | 0.007 | 0.293 | 0.096 | 0.111 | 0.032 | 0.279 | 0.004 | |||||
| IL-5 | – | 0.275 | 0.040 | 0.601 | 0.018 | 0.029 | 0.010 | 0.223 | 0.104 | 4.27 × 10⁻⁴ | 0.001 | 0.743 | 0.454 | 0.229 | 0.591 | 0.601 | 0.107 | 0.029 | 0.778 | 0.006 | ||||||
| IL-6 | – | 0.908 | 0.546 | 0.686 | 0.028 | 0.503 | 0.417 | 0.020 | 0.203 | 0.137 | 0.238 | 0.755 | 0.042 | 0.839 | 0.498 | 0.019 | 0.022 | 0.950 | 0.022 | |||||||
| IL-7 | – | 0.833 | 0.842 | 0.329 | 0.462 | 0.766 | 0.369 | 0.101 | 0.503 | 0.286 | 0.889 | 0.115 | 0.889 | 0.657 | 0.389 | 0.549 | 0.781 | 0.665 | ||||||||
| IL-8 | – | 0.098 | 0.372 | 0.120 | 0.114 | 0.562 | 0.598 | 0.369 | 0.376 | 1.10 × 10⁻⁴ | 0.221 | 9.60 × 10⁻⁵ | 3.19 × 10⁻⁵ | 0.087 | 0.748 | 0.002 | 0.481 | |||||||||
| IL-9 | – | 0.046 | 3.01 × 10⁻⁶ | 1.40 × 10⁻⁴ | 0.202 | 0.075 | 0.109 | 0.124 | 0.129 | 0.275 | 0.244 | 0.117 | 0.143 | 0.001 | 0.052 | 0.024 | ||||||||||
| IL-10 | – | 0.323 | 0.223 | 0.019 | 4.27 × 10⁻⁴ | 0.234 | 0.743 | 0.289 | 0.030 | 0.434 | 0.203 | 0.059 | 0.012 | 0.197 | 0.003 | |||||||||||
| IL-13 | – | 3.47 × 10⁻⁷ | 0.520 | 0.072 | 0.223 | 0.016 | 0.081 | 0.419 | 0.089 | 0.186 | 0.305 | 0.020 | 0.021 | 0.364 | ||||||||||||
| IL-17A | – | 0.681 | 0.040 | 0.700 | 0.010 | 0.056 | 0.501 | 0.069 | 0.183 | 0.441 | 0.067 | 0.002 | 0.822 | |||||||||||||
| Eotaxin | – | 0.101 | 0.342 | 0.861 | 0.113 | 9.23 × 10⁻⁴ | 0.209 | 0.110 | 0.085 | 0.004 | 0.067 | 0.040 | ||||||||||||||
| bFGF | – | 0.029 | 0.821 | 0.286 | 0.210 | 0.481 | 0.598 | 0.149 | 0.082 | 0.247 | 0.043 | |||||||||||||||
| G-CSF | – | 0.571 | 0.290 | 0.172 | 0.573 | 0.280 | 0.023 | 0.181 | 0.978 | 0.047 | ||||||||||||||||
| GM-CSF | – | 0.210 | 0.861 | 0.210 | 0.481 | 0.598 | 0.515 | 0.074 | 0.522 | |||||||||||||||||
| IFN-γ | – | 0.002 | 8.39 × 10⁻¹⁰ | 1.61 × 10⁻⁷ | 0.016 | 0.583 | 2.30 × 10⁻⁵ | 0.603 | ||||||||||||||||||
| IP-10 | – | 0.005 | 6.81 × 10⁻⁴ | 9.23 × 10⁻⁴ | 0.020 | 0.006 | 0.271 | |||||||||||||||||||
| MCP-1 | – | 3.50 × 10⁻⁷ | 0.009 | 0.694 | 1.15 × 10⁻⁵ | 0.911 | ||||||||||||||||||||
| MIP-1α | – | 3.71 × 10⁻⁴ | 0.435 | 6.55 × 10⁻⁵ | 0.322 | |||||||||||||||||||||
| MIP-1β | – | 0.034 | 0.016 | 0.042 | ||||||||||||||||||||||
| RANTES | – | 0.214 | 0.006 | |||||||||||||||||||||||
| TNFα | – | 0.852 | ||||||||||||||||||||||||
| VEGF-A | – | |||||||||||||||||||||||||
| Control | ||||||||||||||||||||||||||
| AC Flare | IL-1ra | IL-4 | IL-6 | IL-7 | IL-8 | IL-13 | Eotaxin | G-CSF | IFN-γ | IP-10 | MCP-1 | MIP-1α | MIP-1β | TNFα | VEGF-A | |||||||||||
| AC Flare | – | 0.191 | 0.900 | 0.830 | 0.002 | 0.038 | 0.944 | 0.013 | 0.491 | 0.388 | 0.318 | 0.379 | 0.389 | 0.273 | 0.019 | 0.210 | ||||||||||
| IL-1ra | – | 0.500 | 0.616 | 0.492 | 0.757 | 0.365 | 0.501 | 0.879 | 0.762 | 0.008 | 0.194 | 0.333 | 0.476 | 0.767 | 0.373 | 0.75~1 | ||||||||||
| IL-4 | – | 2.60 × 10⁻⁴ | 0.344 | 0.229 | 0.278 | 0.678 | 1.04 × 10⁻⁴ | 0.035 | 0.189 | 0.381 | 1.74 × 10⁻⁷ | 0.226 | 0.472 | 0.036 | 0.50~0.75 | |||||||||||
| IL-6 | – | 0.654 | 0.293 | 0.315 | 0.699 | 0.007 | 0.332 | 0.275 | 0.697 | 1.24 × 10⁻⁴ | 0.437 | 0.941 | 0.065 | 0.25~0.50 | ||||||||||||
| IL-7 | – | 0.173 | 0.880 | 0.311 | 0.761 | 0.853 | 0.080 | 0.714 | 0.846 | 0.310 | 0.287 | 0.147 | 0~0.25 | |||||||||||||
| IL-8 | – | 0.976 | 0.061 | 0.923 | 0.100 | 0.422 | 0.078 | 0.572 | 0.006 | 0.117 | 0.281 | −0.25~0 | ||||||||||||||
| IL-13 | – | 0.266 | 0.364 | 0.900 | 0.567 | 0.704 | 0.722 | 0.254 | 0.427 | 0.623 | −0.50~−0.25 | |||||||||||||||
| Eotaxin | – | 0.124 | 0.497 | 0.005 | 0.590 | 0.622 | 0.116 | 0.142 | 0.123 | −0.75~−0.50 | ||||||||||||||||
| G-CSF | – | 0.005 | 0.577 | 0.143 | 1.86 × 10⁻⁵ | 0.727 | 0.546 | 0.017 | −1~−0.75 | |||||||||||||||||
| IFN-γ | – | 0.097 | 4.45 × 10⁻⁶ | 0.028 | 0.031 | 0.340 | 0.147 | |||||||||||||||||||
| IP-10 | – | 0.533 | 0.194 | 0.139 | 0.648 | 0.101 | ||||||||||||||||||||
| MCP-1 | – | 0.520 | 0.163 | 0.894 | 0.286 | |||||||||||||||||||||
| MIP-1α | – | 0.435 | 0.407 | 0.041 | ||||||||||||||||||||||
| MIP-1β | – | 0.135 | 0.376 | |||||||||||||||||||||||
| TNFα | – | 0.743 | ||||||||||||||||||||||||
| VEGF-A | – | |||||||||||||||||||||||||
| PDR | Control | ||||||||||
|---|---|---|---|---|---|---|---|---|---|---|---|
| r | R2 | 95% Confidence Interval | p Value | r | R2 | 95% Confidence Interval | p Value | ||||
| Lower | Upper | Lower | Upper | ||||||||
| IL-1ra | 0.231 | 0.053 | −0.256 | 0.624 | 0.341 | IL-1ra | 0.553 | 0.305 | 0.096 | 0.817 | 0.016 |
| IL-4 | 0.515 | 0.265 | 0.048 | 0.797 | 0.026 | IL-4 | 0.059 | 0.003 | −0.406 | 0.500 | 0.811 |
| IL-5 | −0.081 | 0.007 | −0.517 | 0.388 | 0.743 | ||||||
| IL-6 | 0.353 | 0.124 | −0.136 | 0.703 | 0.139 | IL-6 | 0.348 | 0.121 | −0.141 | 0.700 | 0.145 |
| IL-7 | 0.051 | 0.003 | −0.413 | 0.494 | 0.838 | IL-7 | −0.223 | 0.050 | −0.618 | 0.263 | 0.358 |
| IL-8 | 0.847 | 0.718 | 0.589 | 0.949 | 4.68 × 10⁻⁶ | IL-8 | 0.584 | 0.342 | 0.138 | 0.833 | 0.010 |
| IL-9 | −0.072 | 0.005 | −0.510 | 0.396 | 0.771 | ||||||
| IL-17A | −0.102 | 0.010 | −0.532 | 0.371 | 0.678 | ||||||
| Eotaxin | 0.654 | 0.428 | 0.238 | 0.867 | 0.003 | Eotaxin | 0.573 | 0.329 | 0.123 | 0.828 | 0.012 |
| G-CSF | 0.707 | 0.500 | 0.322 | 0.892 | 0.001 | G-CSF | 0.342 | 0.117 | −0.147 | 0.696 | 0.152 |
| IFN-γ | 0.719 | 0.517 | 0.341 | 0.897 | 0.001 | IFN-γ | 0.250 | 0.062 | −0.238 | 0.637 | 0.301 |
| IP-10 | 0.919 | 0.845 | 0.762 | 0.974 | 1.15 × 10⁻⁶ | IP-10 | 0.142 | 0.020 | −0.336 | 0.562 | 0.560 |
| MCP-1 | 0.830 | 0.689 | 0.551 | 0.942 | 3.22 × 10⁻⁶ | MCP-1 | 0.135 | 0.018 | −0.342 | 0.557 | 0.580 |
| MIP-1α | 0.614 | 0.378 | 0.180 | 0.848 | 0.006 | MIP-1α | −0.230 | 0.053 | −0.623 | 0.257 | 0.343 |
| MIP-1β | 0.274 | 0.075 | −0.215 | 0.653 | 0.256 | MIP-1β | 0.226 | 0.051 | −0.260 | 0.621 | 0.350 |
| RANTES | 0.315 | 0.099 | −0.174 | 0.679 | 0.189 | ||||||
| TNFα | 0.267 | 0.071 | −0.222 | 0.648 | 0.269 | TNFα | 0.726 | 0.528 | 0.354 | 0.900 | 0.001 |
| VEGF-A | 0.489 | 0.239 | 0.016 | 0.783 | 0.035 | VEGF-A | −0.102 | 0.010 | −0.532 | 0.371 | 0.678 |
| DME | AUC | SE | 95% Confidence Interval | Chi-Square Value | p Value | Cut-Off Value | TPF | FPF | Specificity | OR | PPV | NPV | |
|---|---|---|---|---|---|---|---|---|---|---|---|---|---|
| Lower | Upper | ||||||||||||
| IL-8 | 0.74 | 0.12 | 0.51 | 0.98 | 4.22 | 0.040 | 26.6 | 0.67 | 0.30 | 0.70 | 4.67 | 66.7 | 70.0 |
| TRD | |||||||||||||
| IL-1ra | 0.74 | 0.12 | 0.51 | 0.97 | 4.19 | 0.041 | 16.1 | 1.00 | 0.38 | 0.63 | – | 33.6 | 100 |
| VH | |||||||||||||
| AC flare | 0.94 | 0.06 | 0.83 | 1.06 | 56.2 | 6.38 × 10⁻¹⁴ | 11.1 | 0.94 | 0 | 1.00 | – | 100 | 66.5 |
| IL-1ra | 0.79 | 0.12 | 0.56 | 1.03 | 6.04 | 0.014 | 16.1 | 0.71 | 0 | 1.00 | – | 100 | 28.5 |
| IL-4 | 0.62 | 0.05 | 0.51 | 0.72 | 4.92 | 0.027 | 0.24 | 0.24 | 0 | 1.00 | – | 100 | 13.3 |
| IL-8 | 0.82 | 0.10 | 0.62 | 1.03 | 9.78 | 0.002 | 7.96 | 0.76 | 0 | 1.00 | – | 100 | 33.3 |
| IL-9 | 0.62 | 0.05 | 0.51 | 0.72 | 4.92 | 0.027 | 4.13 | 0.24 | 0 | 1.00 | – | 100 | 13.3 |
| Eotaxin | 0.91 | 0.10 | 0.72 | 1.11 | 16.9 | 4.02 × 10⁻⁵ | 3.55 | 0.82 | 0 | 1.00 | – | 100 | 40.0 |
| IP-10 | 0.82 | 0.10 | 0.62 | 1.03 | 9.78 | 0.002 | 306.8 | 0.76 | 0 | 1.00 | – | 100 | 33.3 |
| MCP-1 | 0.88 | 0.13 | 0.63 | 1.14 | 8.78 | 0.003 | 264.6 | 0.76 | 0 | 1.00 | – | 100 | 33.3 |
Disclaimer/Publisher’s Note: The statements, opinions and data contained in all publications are solely those of the individual author(s) and contributor(s) and not of MDPI and/or the editor(s). MDPI and/or the editor(s) disclaim responsibility for any injury to people or property resulting from any ideas, methods, instructions or products referred to in the content. |
© 2024 by the authors. Licensee MDPI, Basel, Switzerland. This article is an open access article distributed under the terms and conditions of the Creative Commons Attribution (CC BY) license (https://creativecommons.org/licenses/by/4.0/).
Share and Cite
Sato, T.; Takenaka, Y.; Nishio, Y.; Ito, M.; Takeuchi, M. Anterior Chamber Flare as a Non-Invasive Assessment of Intraocular Immune Status and Ocular Complications in Proliferative Diabetic Retinopathy. Int. J. Mol. Sci. 2024, 25, 9158. https://doi.org/10.3390/ijms25179158
Sato T, Takenaka Y, Nishio Y, Ito M, Takeuchi M. Anterior Chamber Flare as a Non-Invasive Assessment of Intraocular Immune Status and Ocular Complications in Proliferative Diabetic Retinopathy. International Journal of Molecular Sciences. 2024; 25(17):9158. https://doi.org/10.3390/ijms25179158
Chicago/Turabian StyleSato, Tomohito, Yuki Takenaka, Yoshiaki Nishio, Masataka Ito, and Masaru Takeuchi. 2024. "Anterior Chamber Flare as a Non-Invasive Assessment of Intraocular Immune Status and Ocular Complications in Proliferative Diabetic Retinopathy" International Journal of Molecular Sciences 25, no. 17: 9158. https://doi.org/10.3390/ijms25179158
APA StyleSato, T., Takenaka, Y., Nishio, Y., Ito, M., & Takeuchi, M. (2024). Anterior Chamber Flare as a Non-Invasive Assessment of Intraocular Immune Status and Ocular Complications in Proliferative Diabetic Retinopathy. International Journal of Molecular Sciences, 25(17), 9158. https://doi.org/10.3390/ijms25179158