
Characterization of TBP and TAFs in Mungbean (Vigna radiata L.) and Their Potential Involvement in Abiotic Stress Response
 , ,
, ,
Abstract
:1. Introduction
2. Results
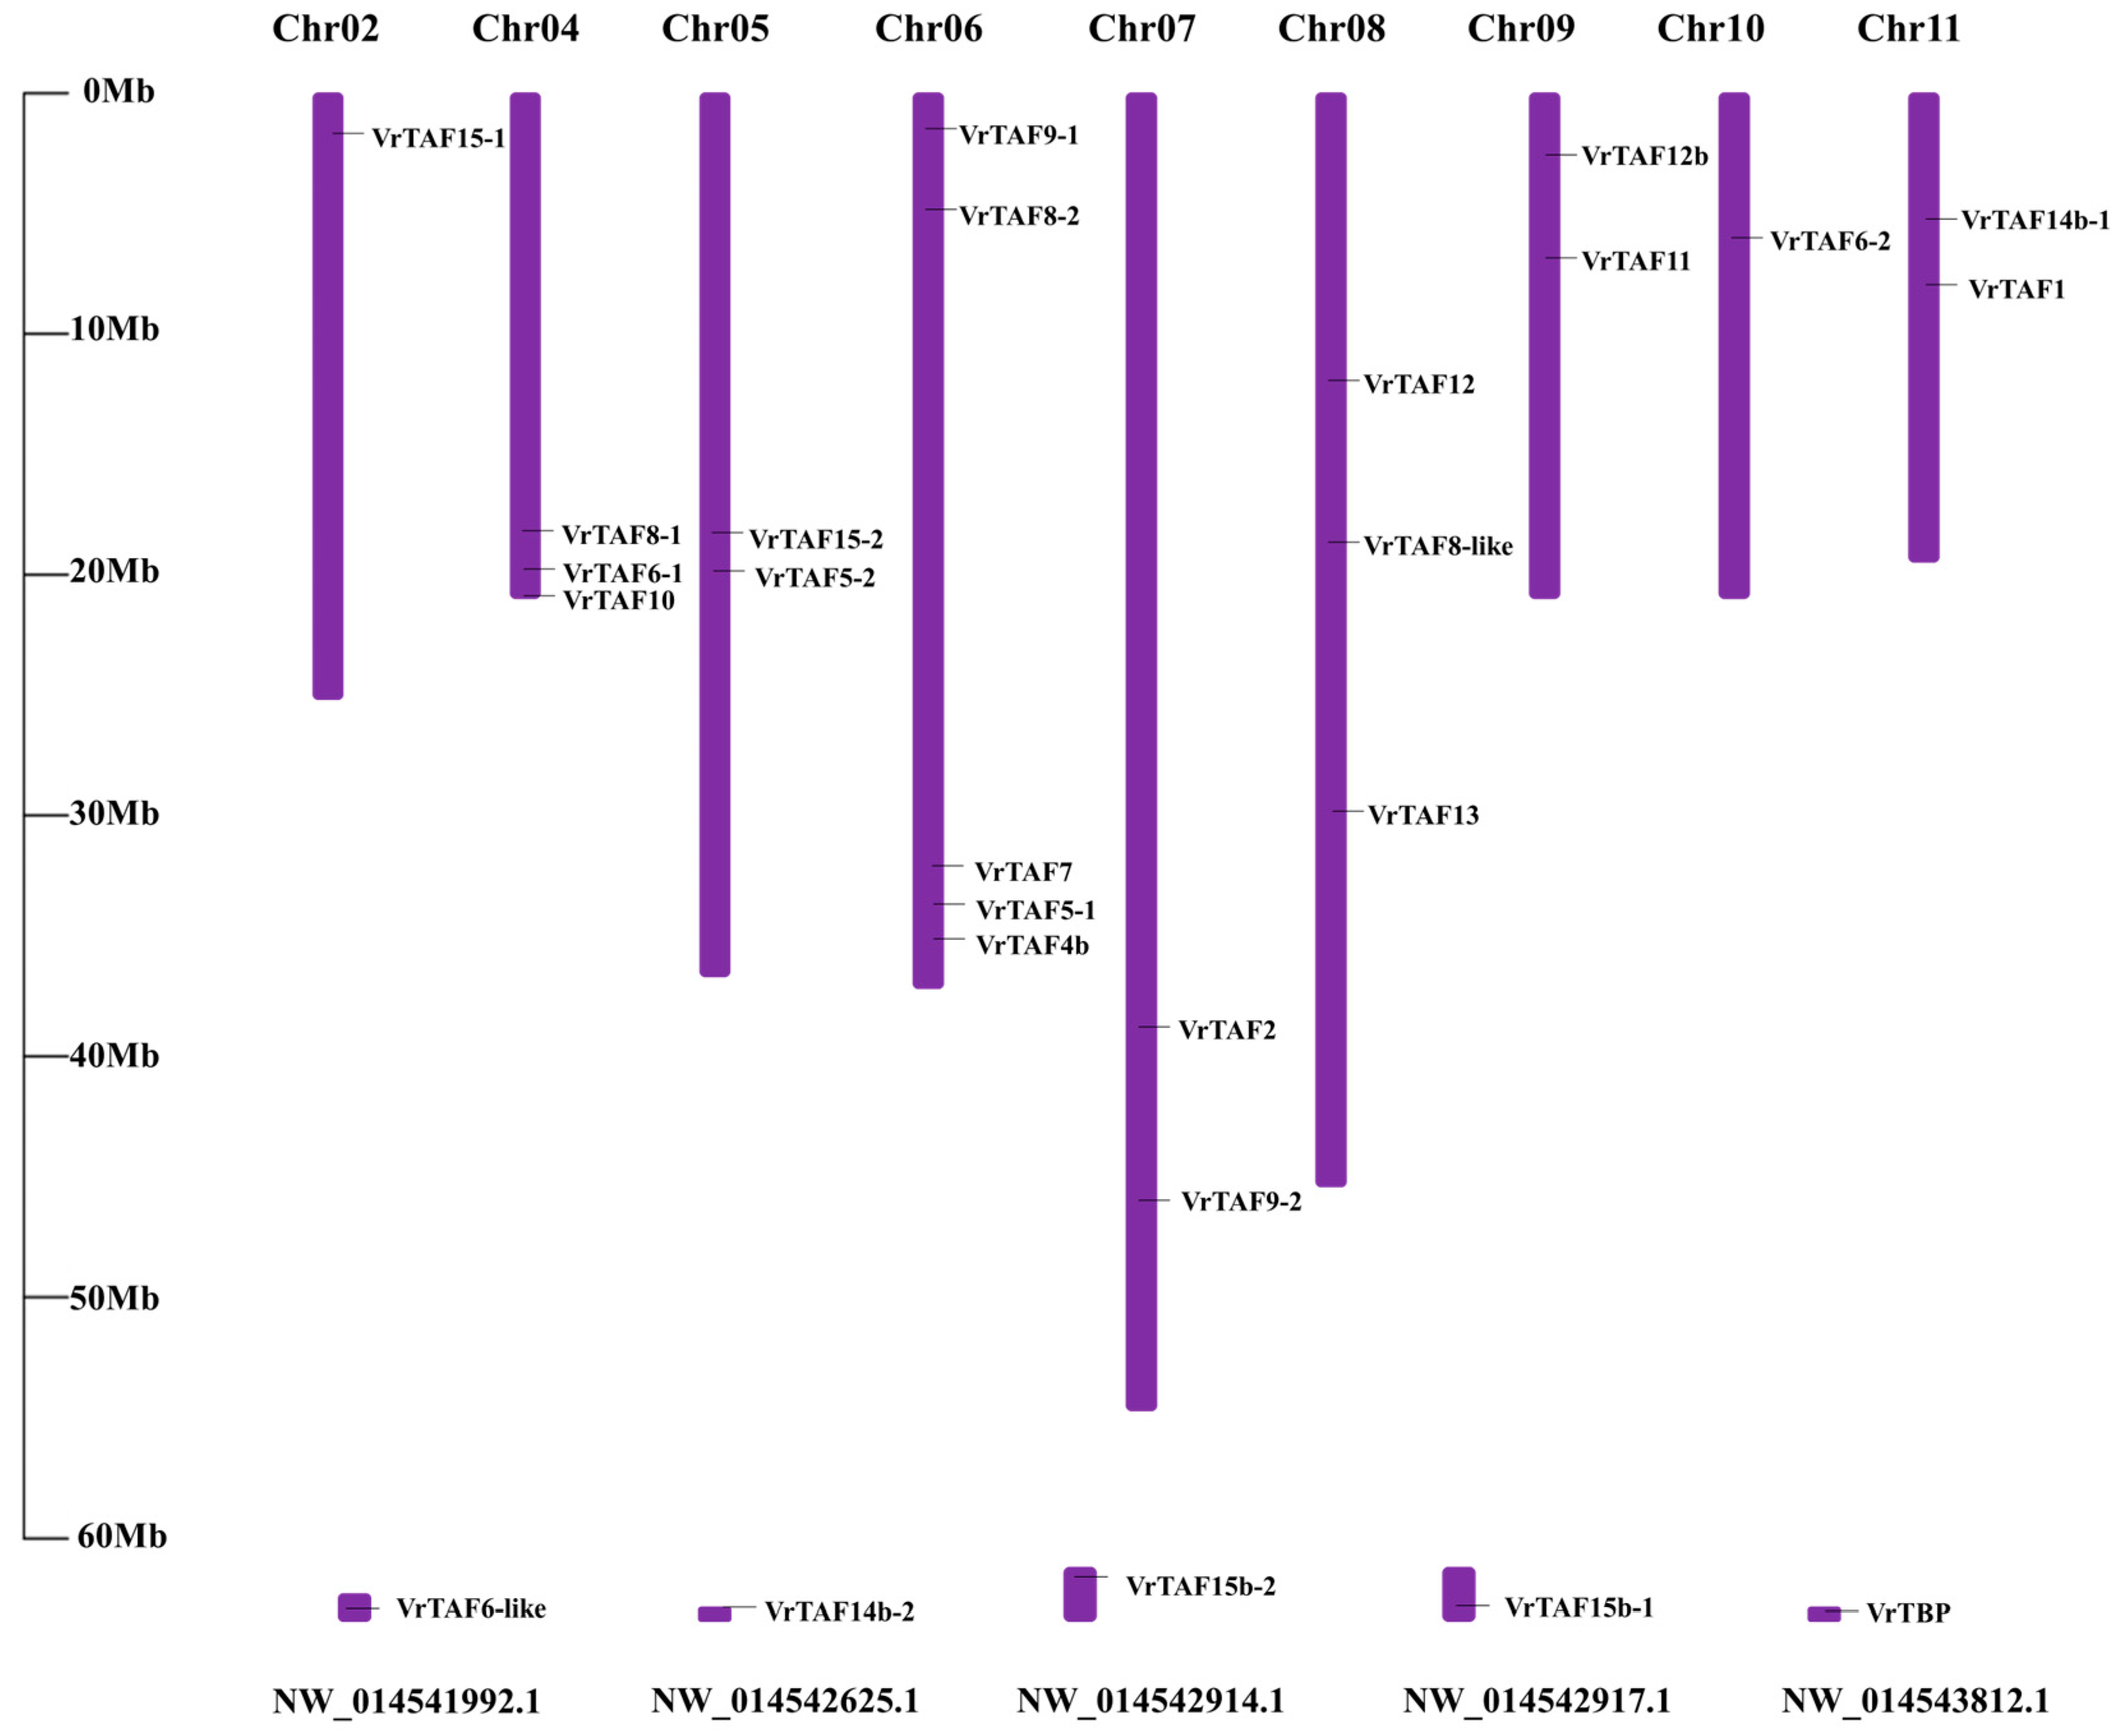
2.1. Characterization of TBP and TAF Genes in Mungbean
2.2. Systematic Analysis of Mungbean TBP and Putative TAFs
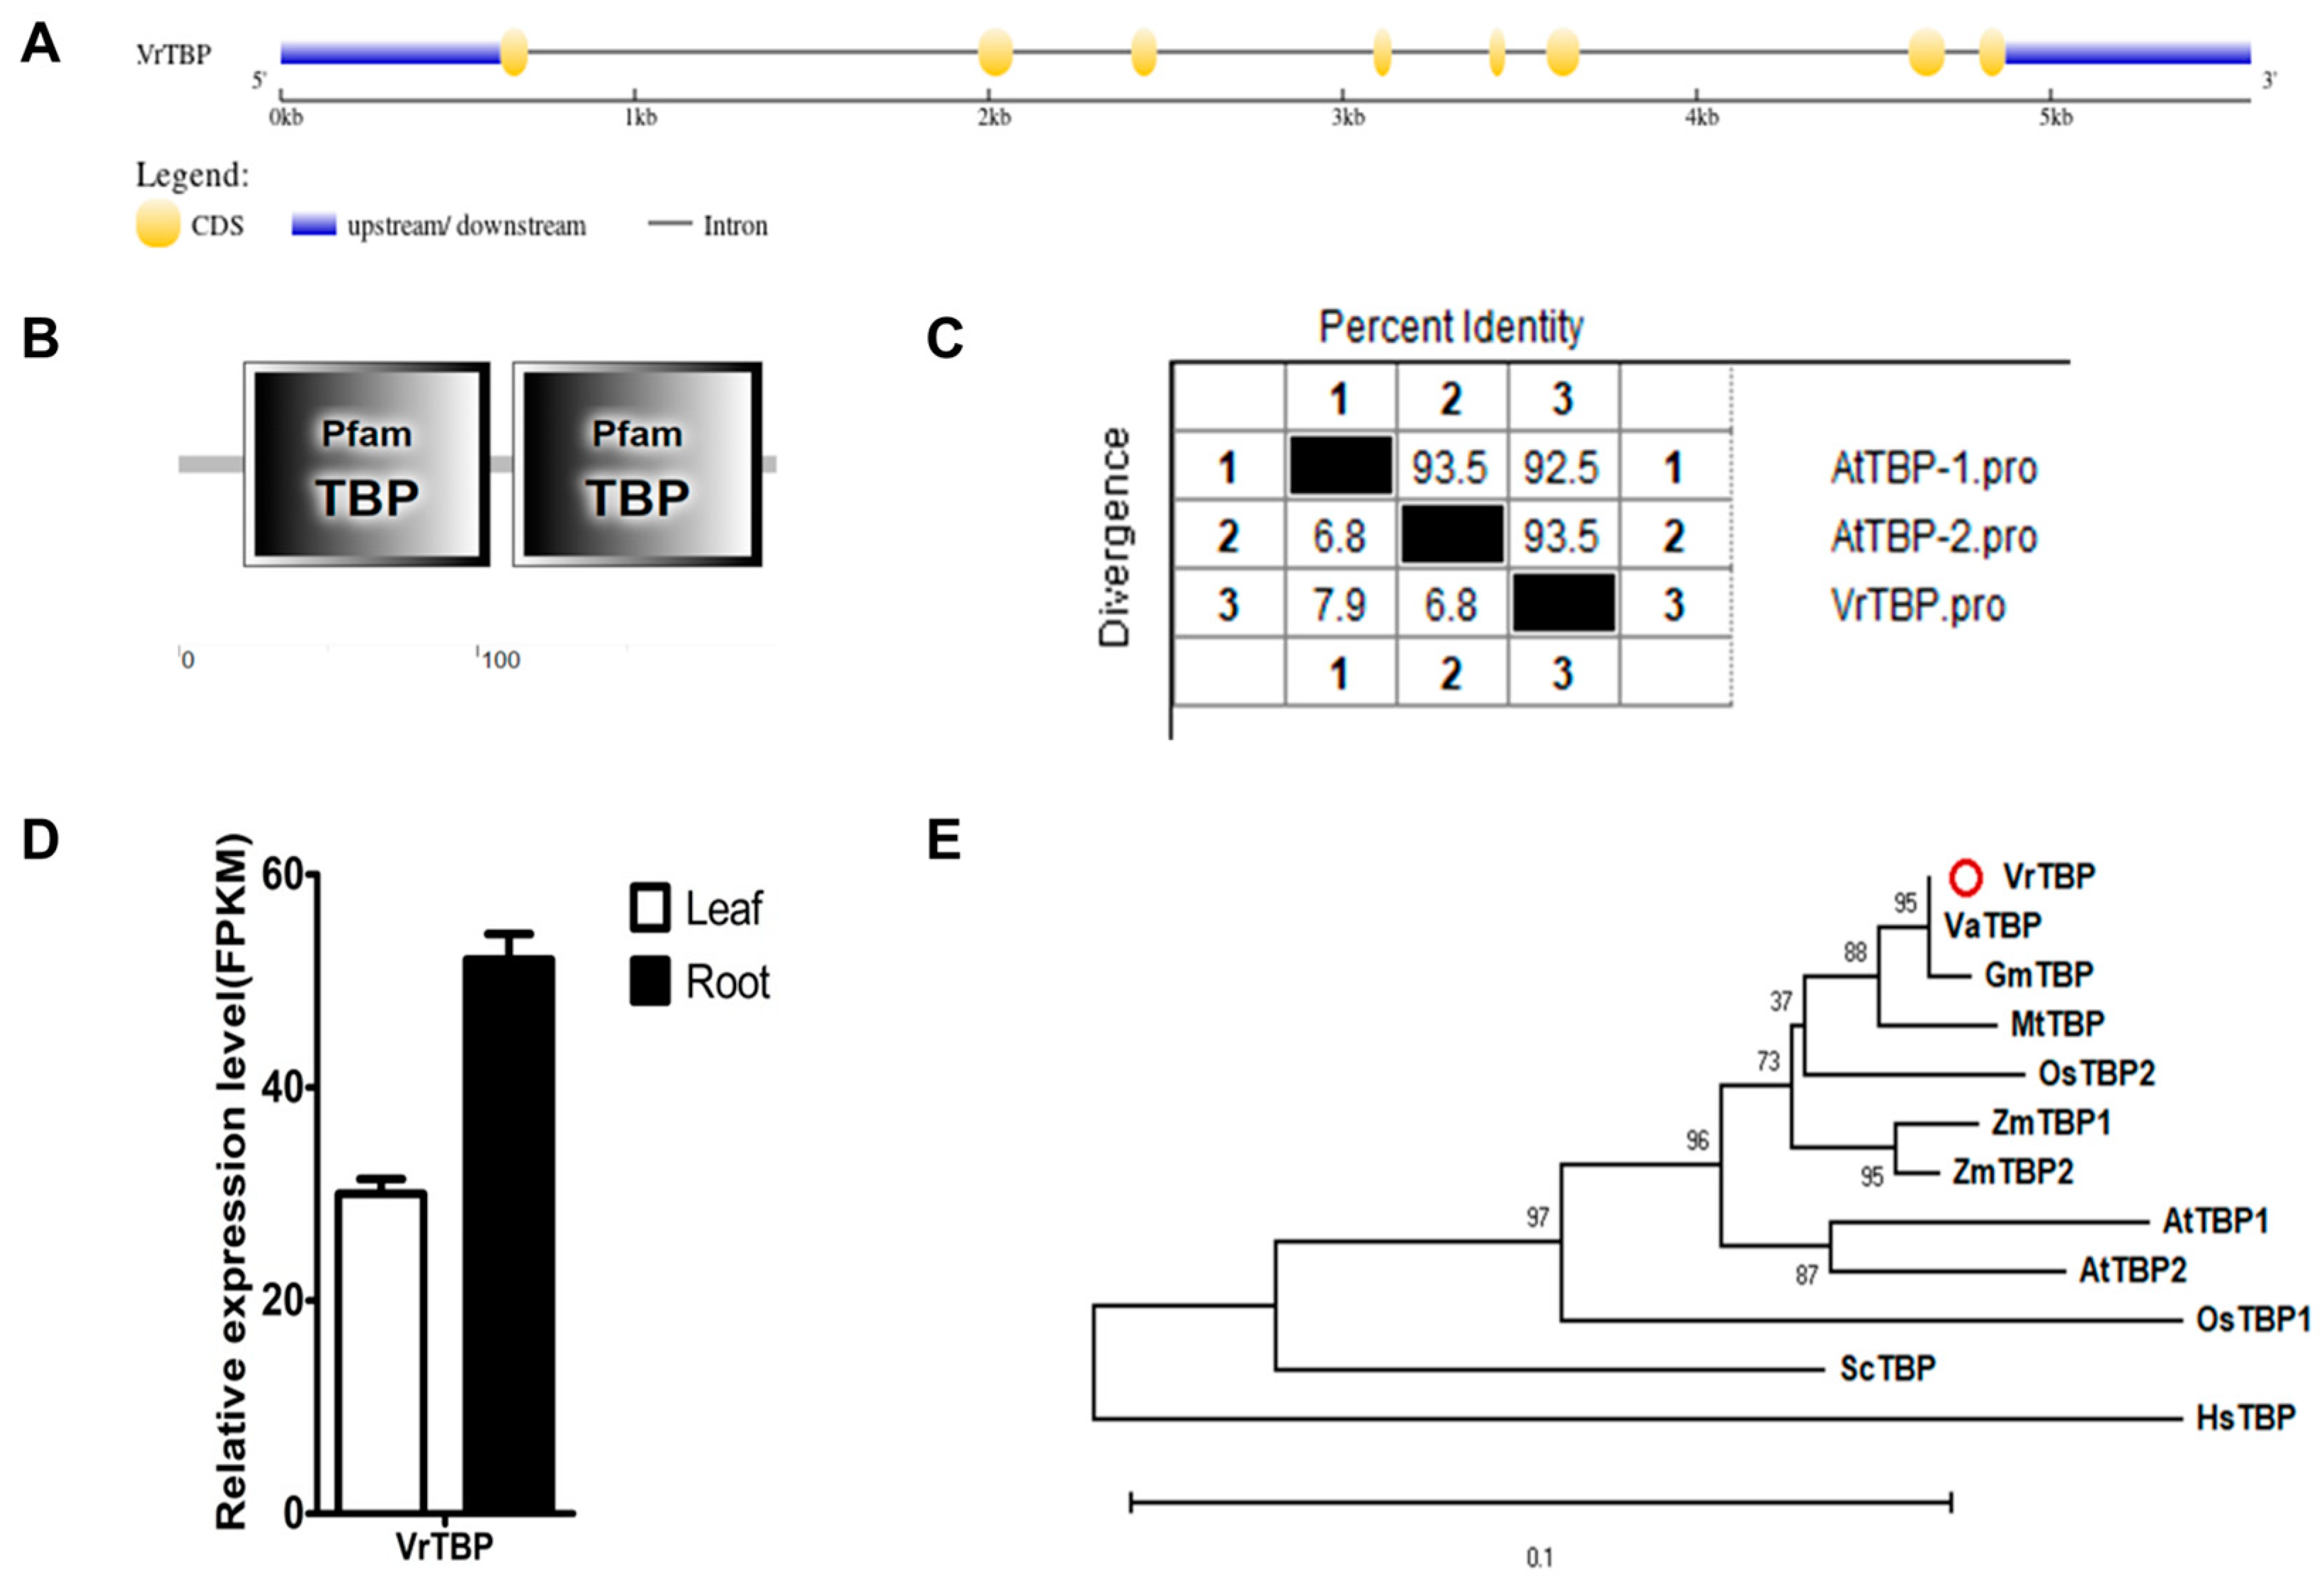
2.2.1. VrTBP
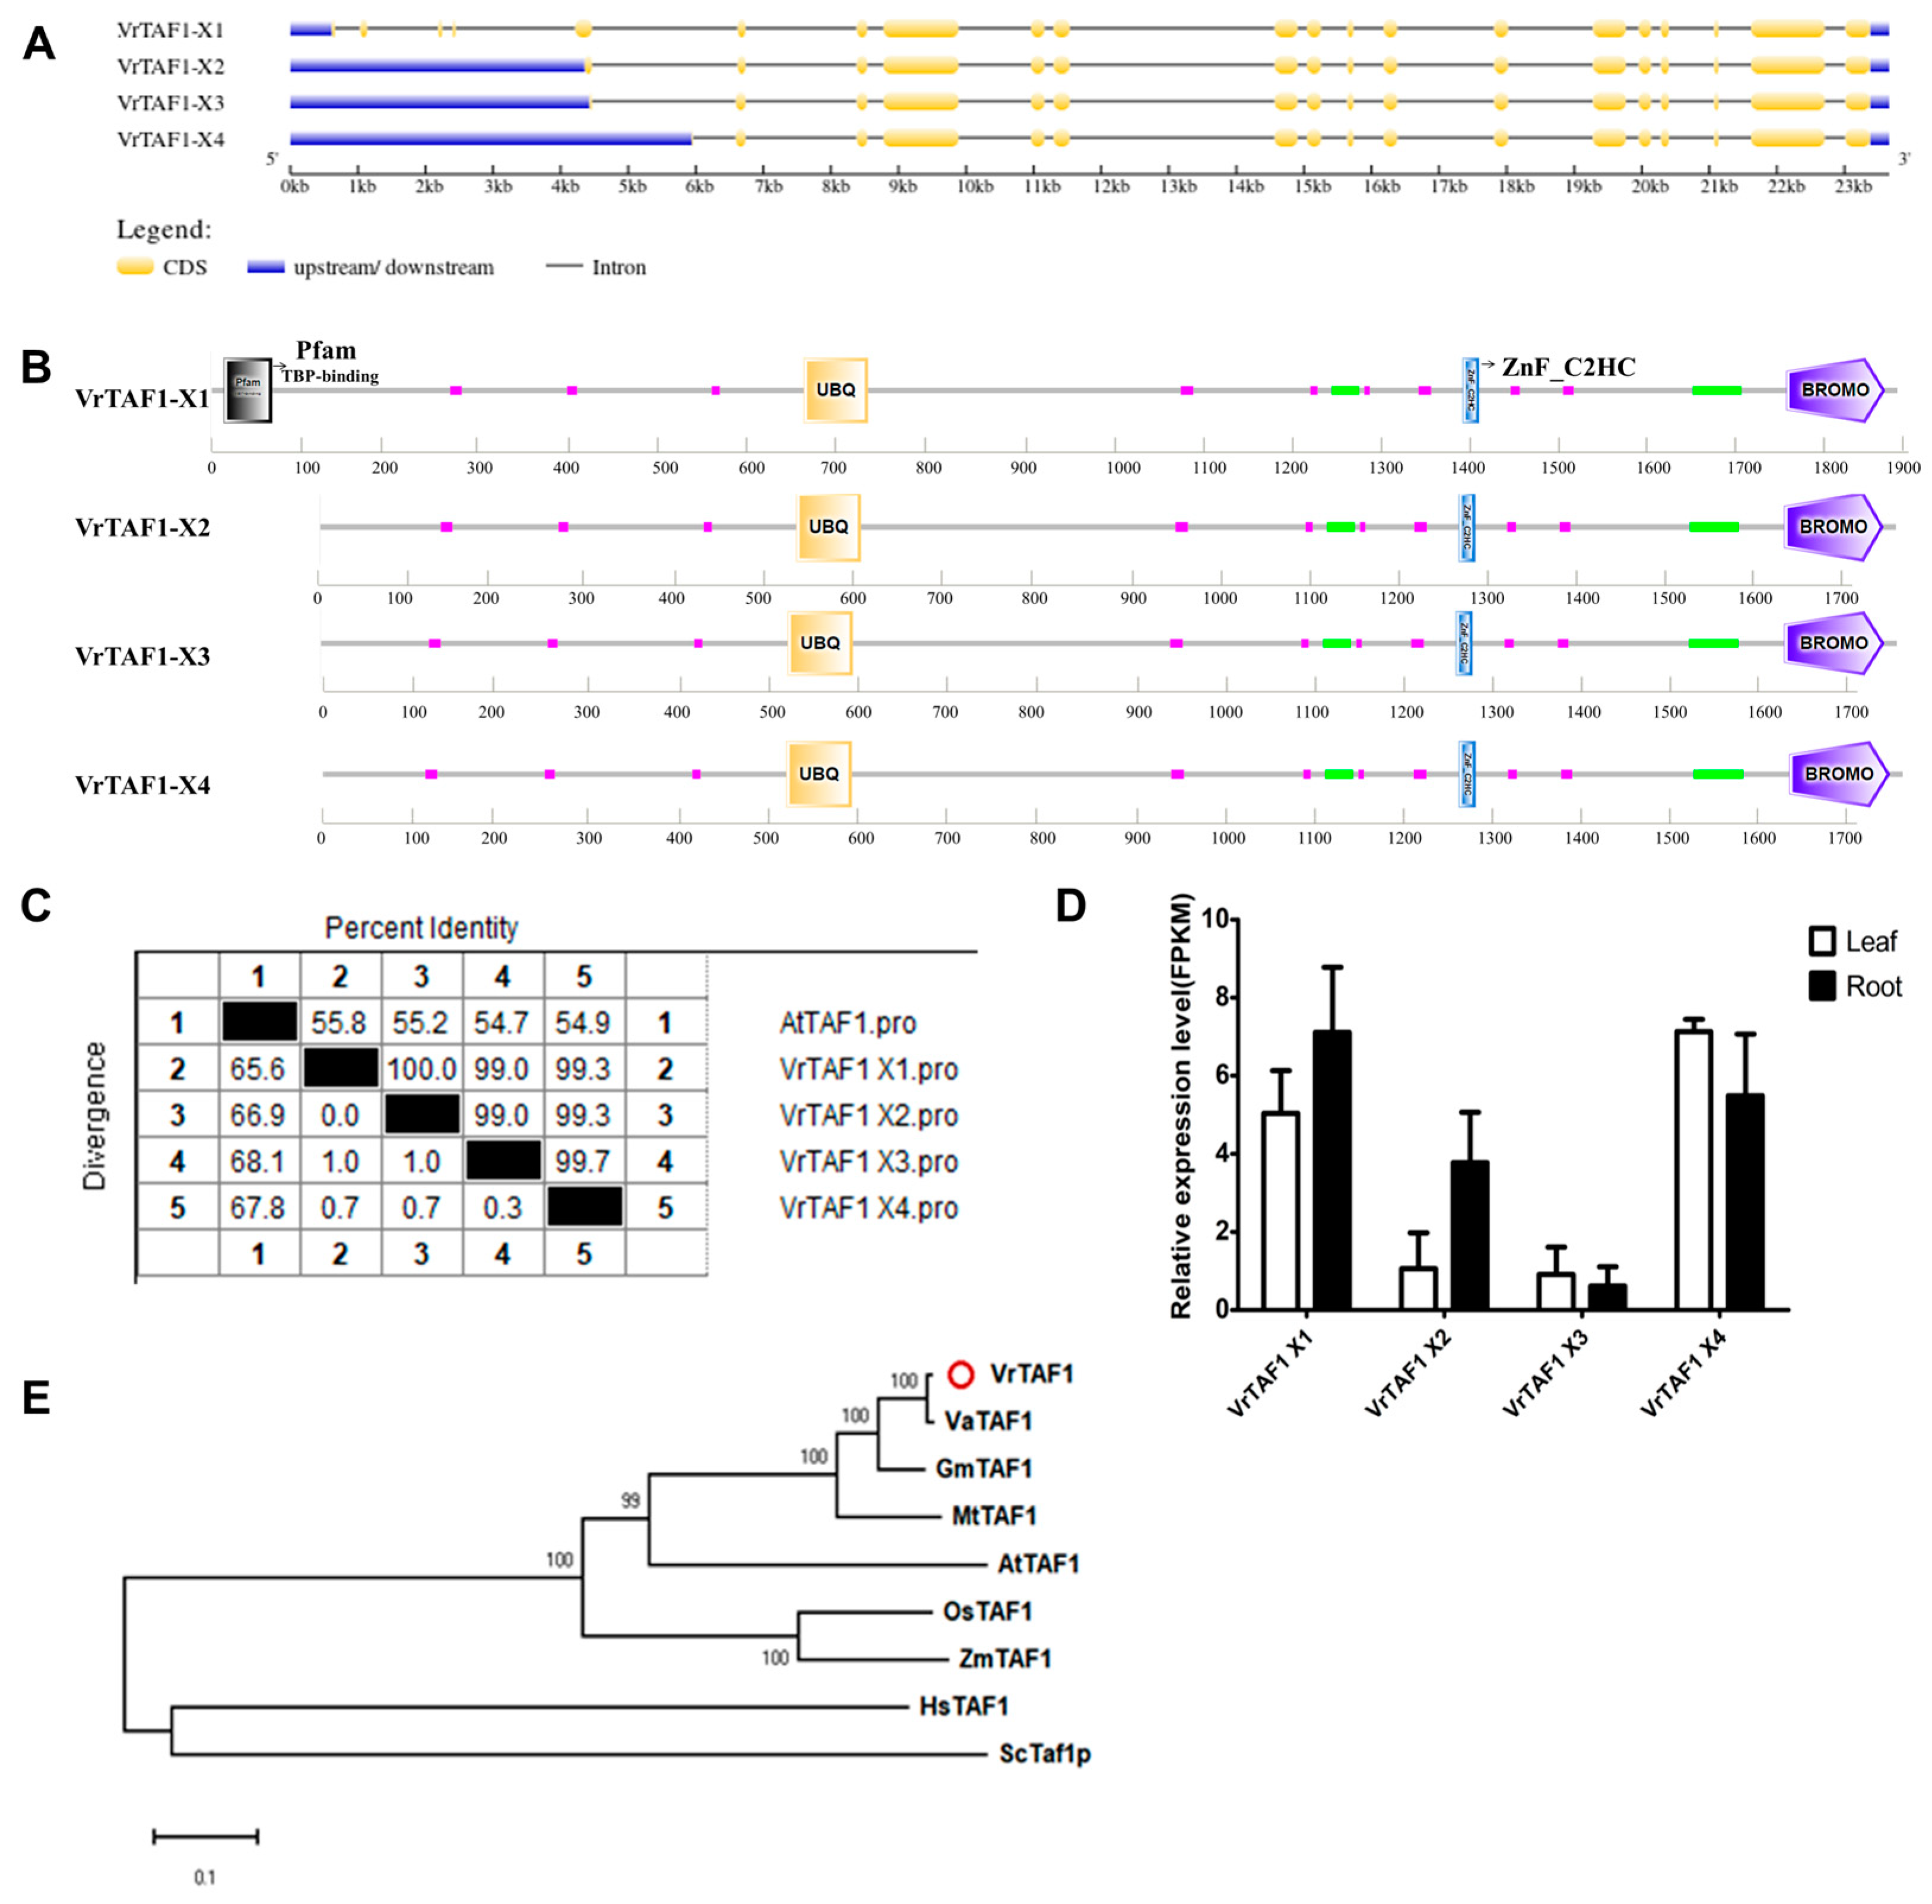
2.2.2. VrTAF1
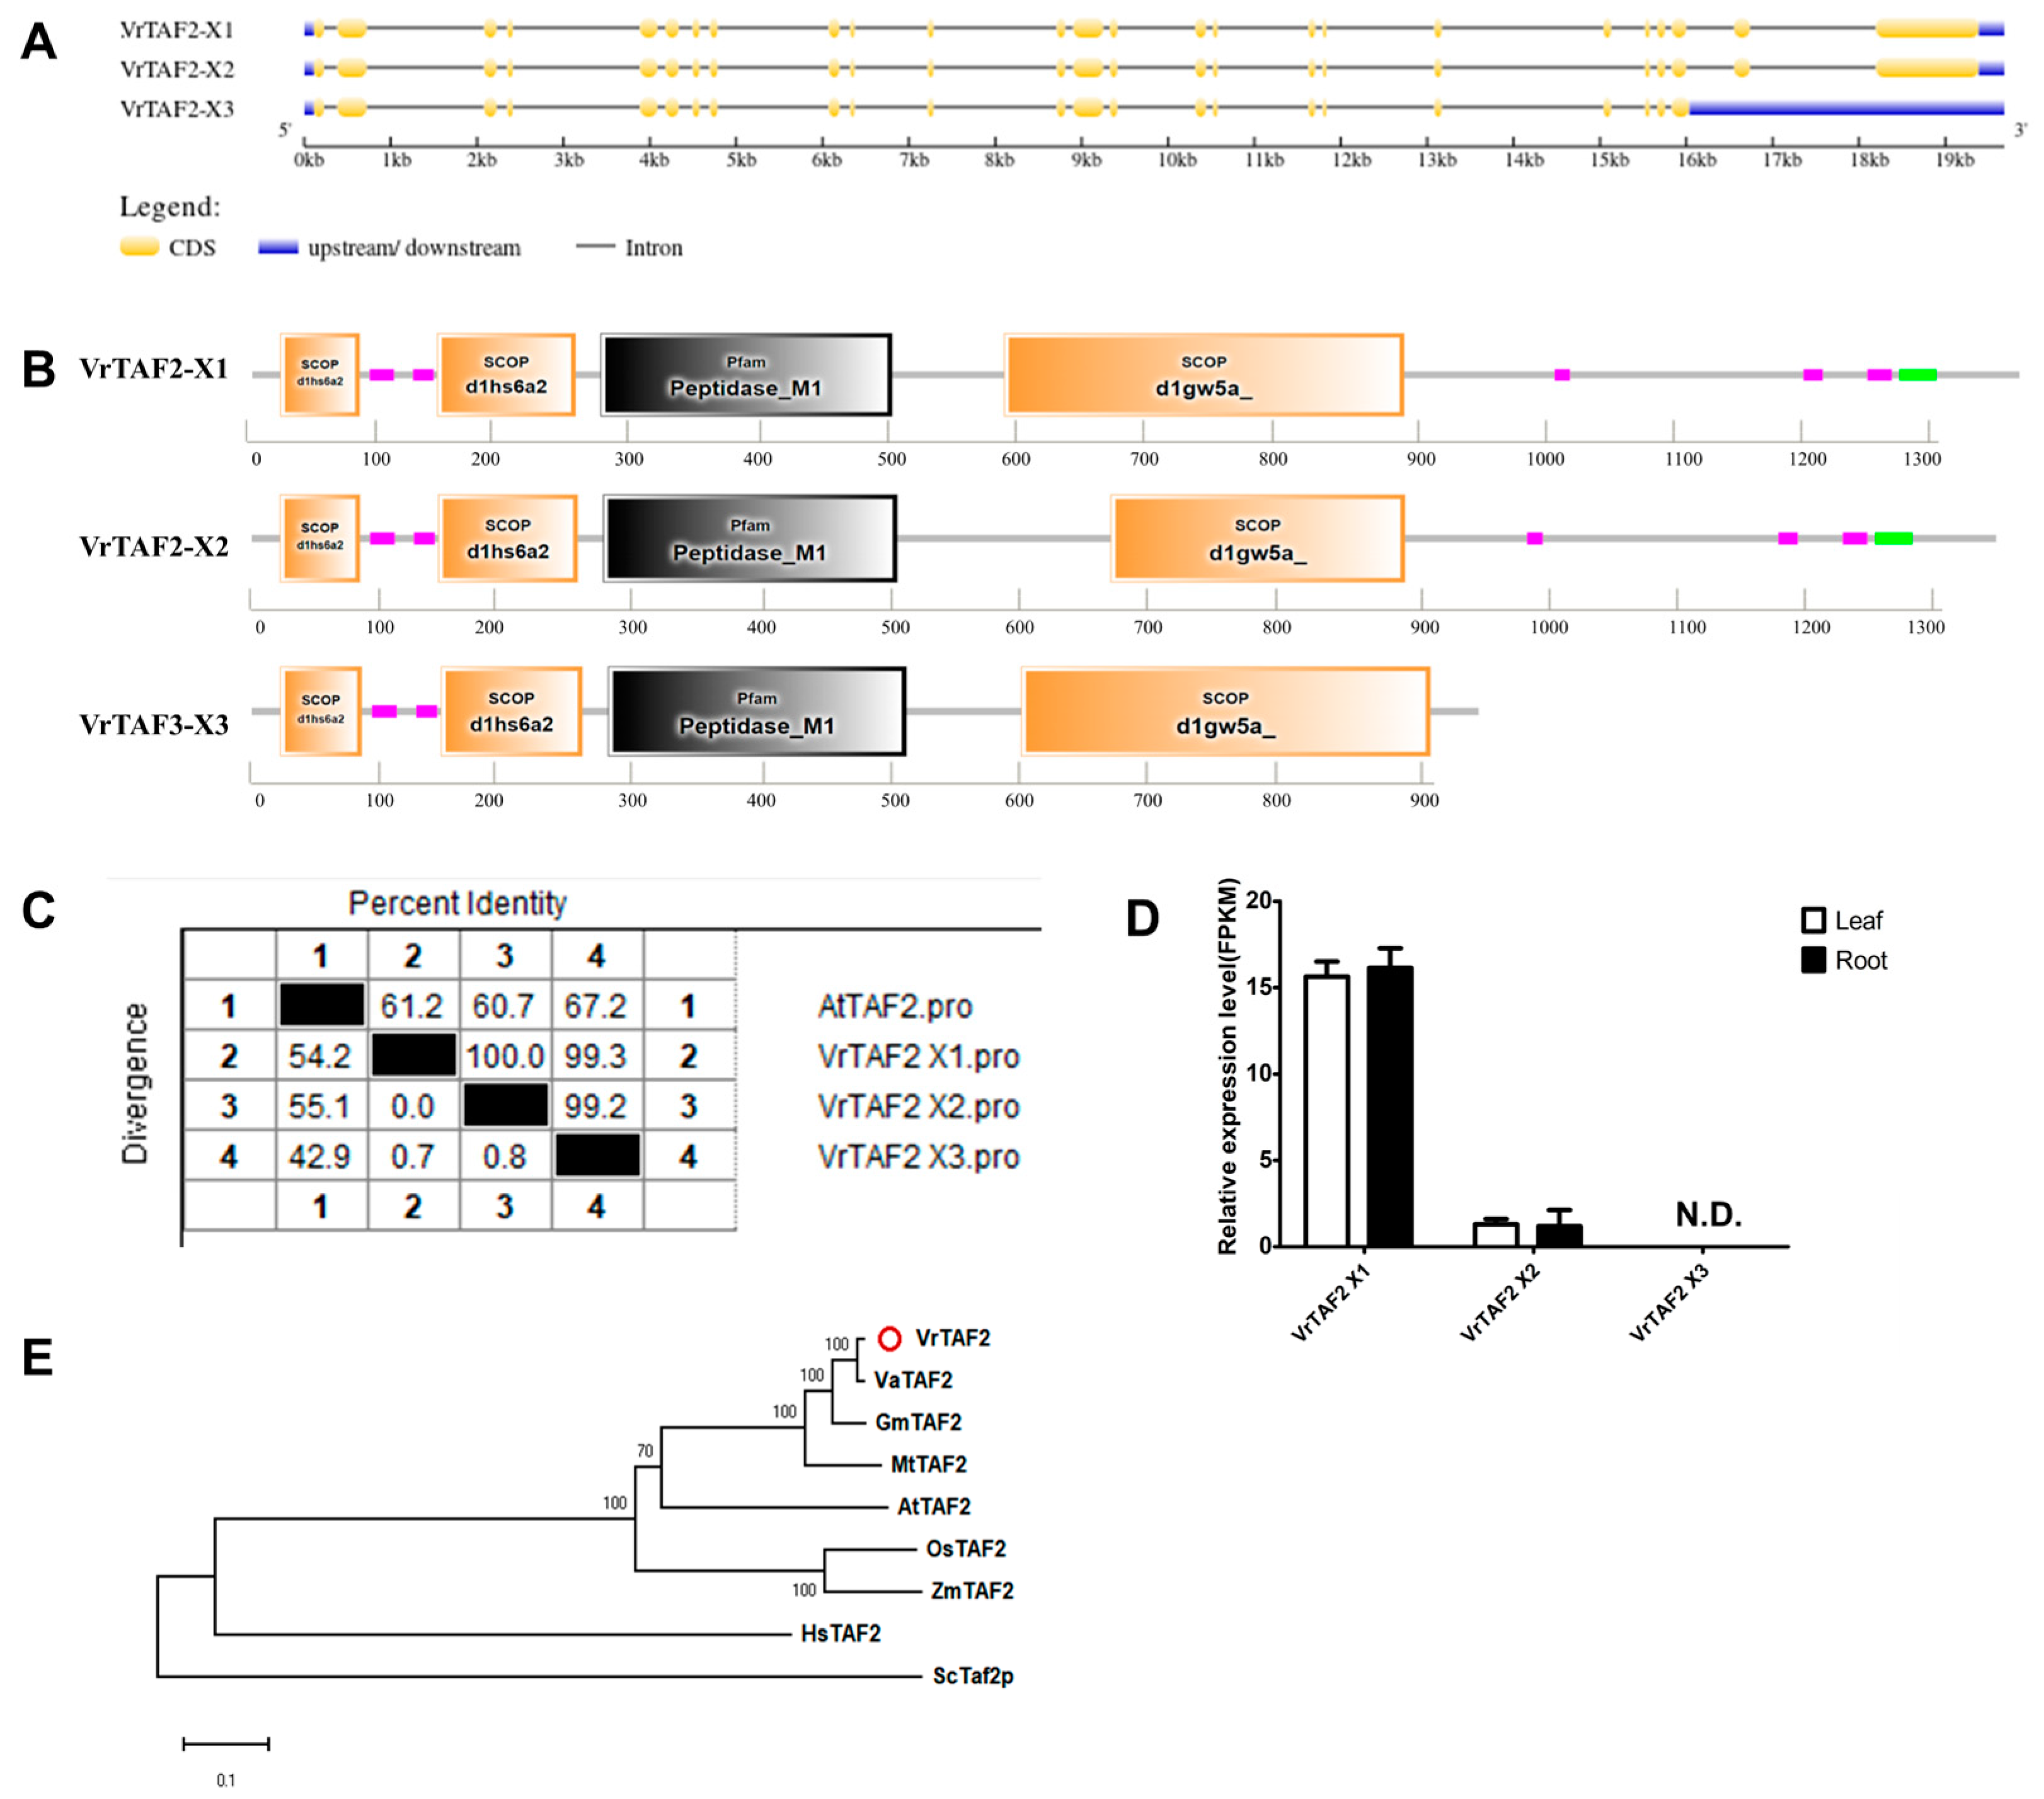
2.2.3. VrTAF2
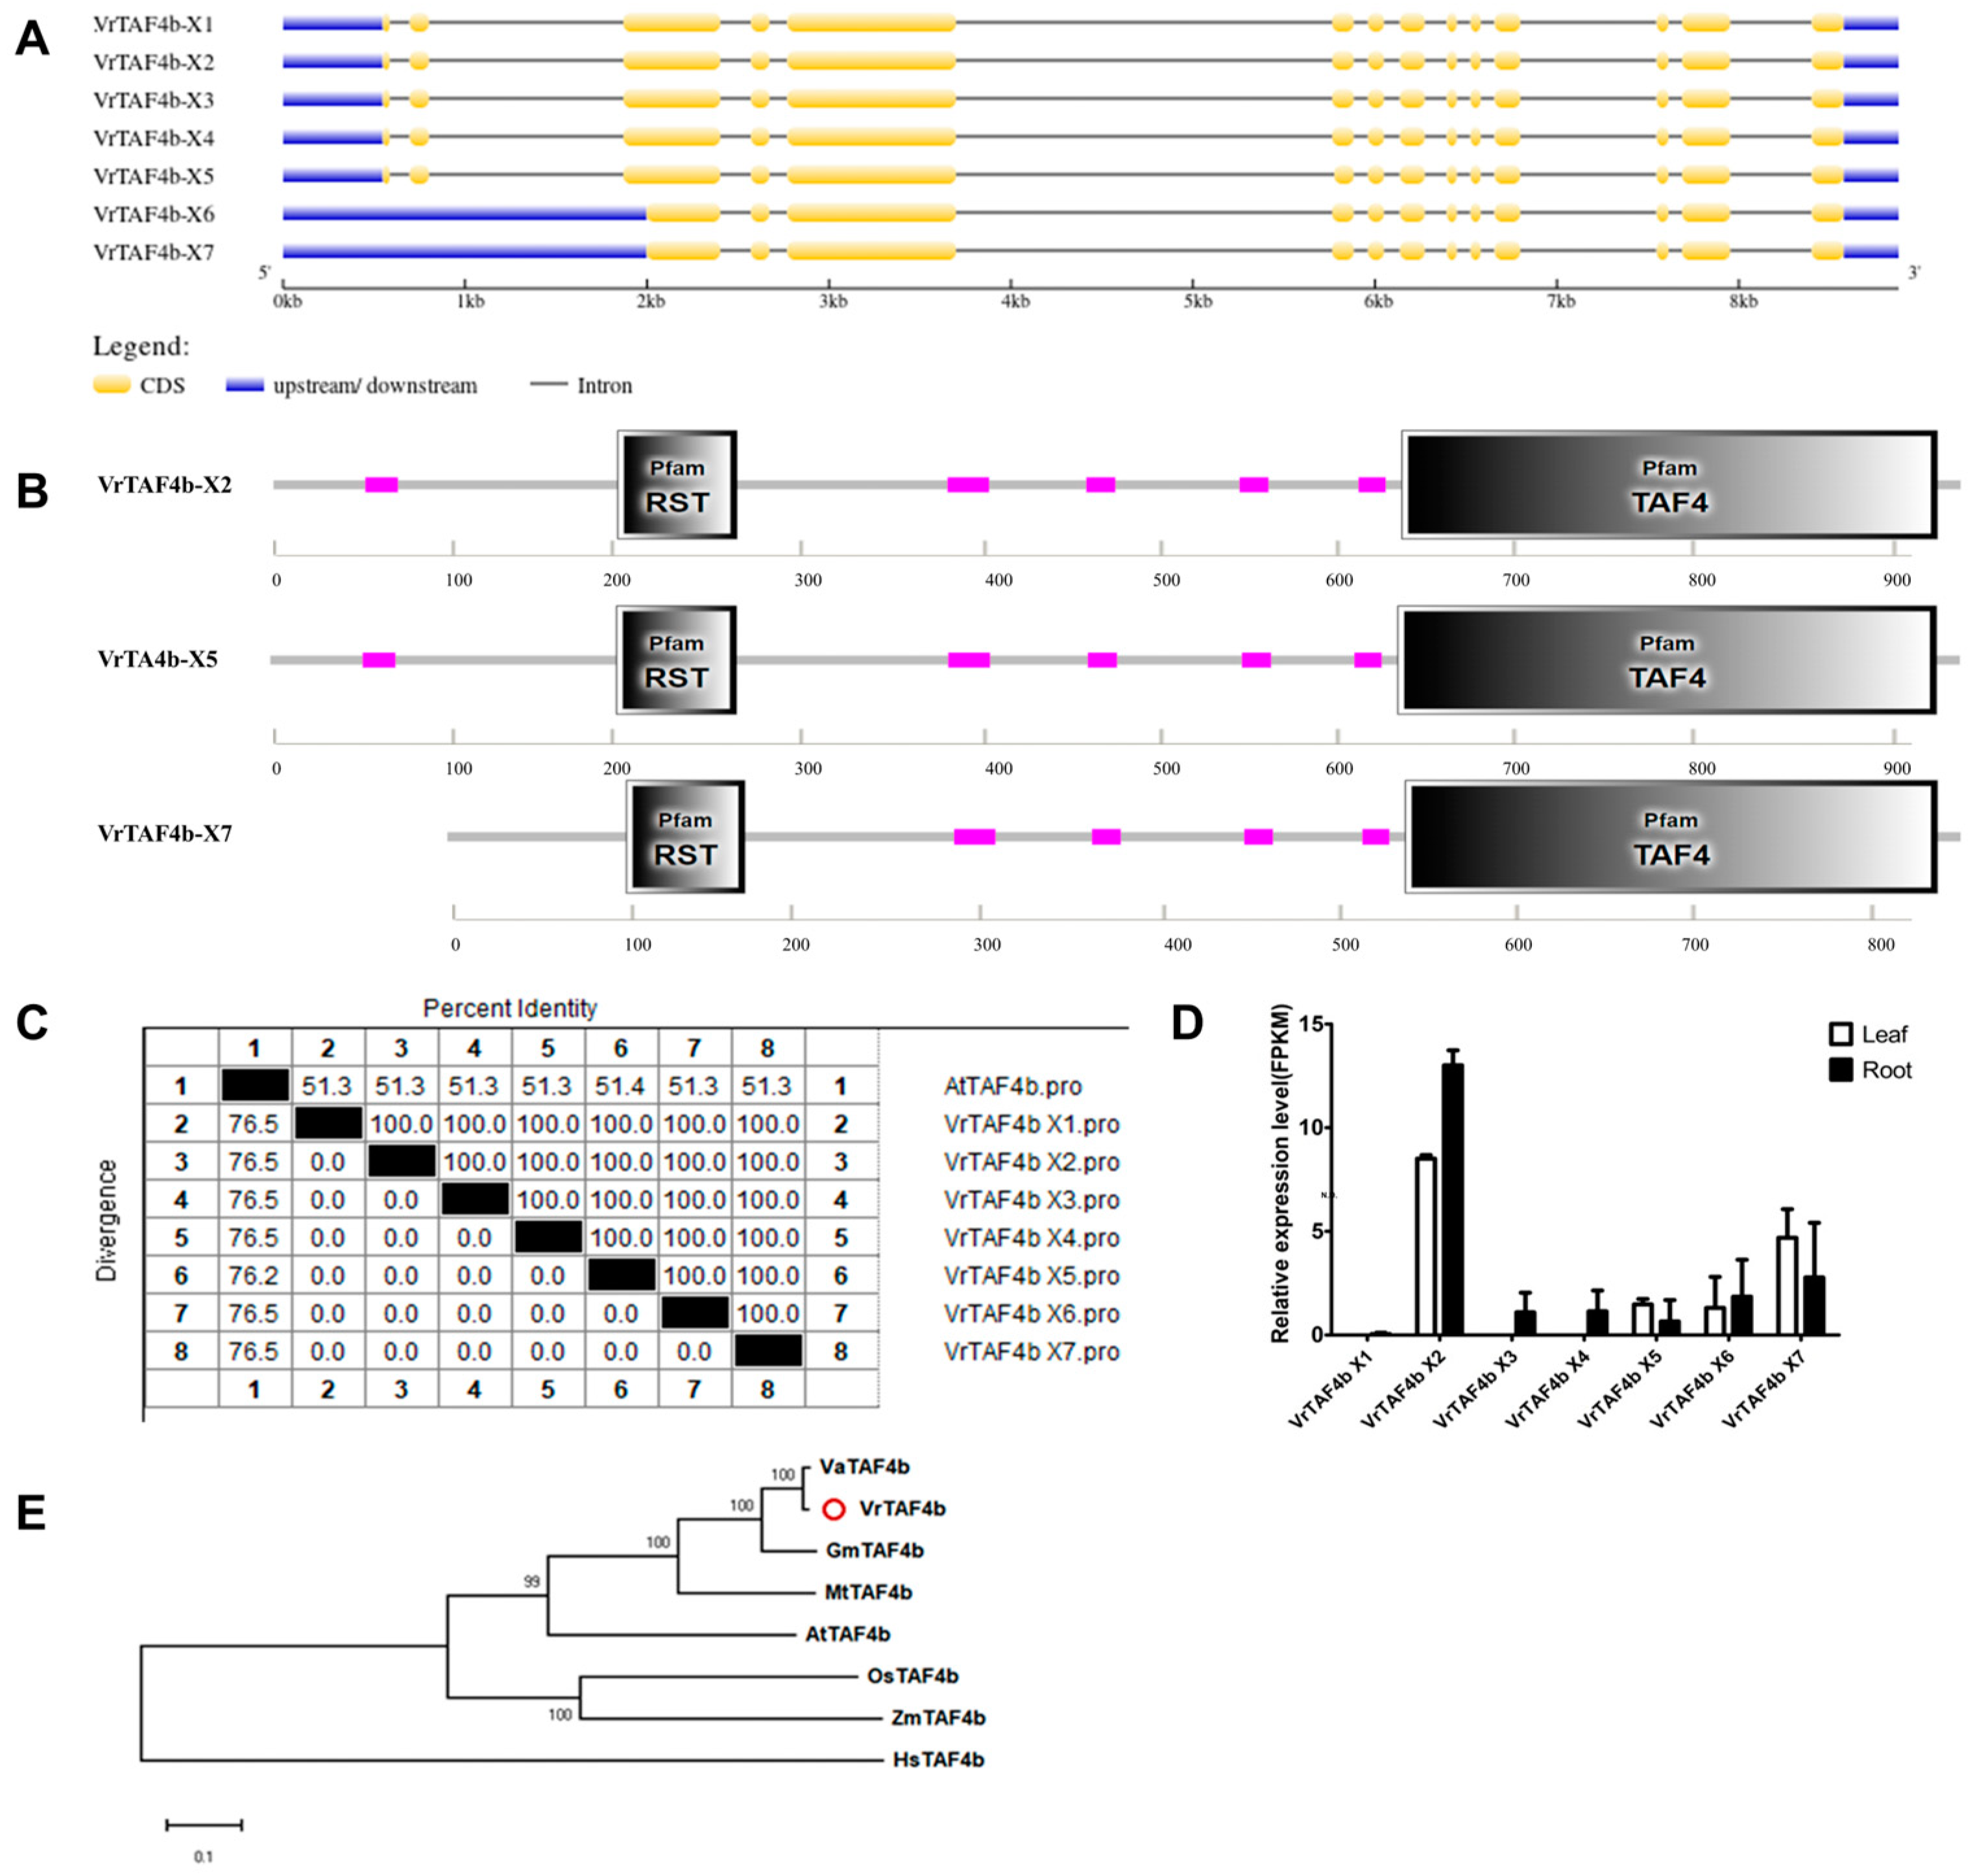
2.2.4. VrTAF4b
2.2.5. VrTAF5
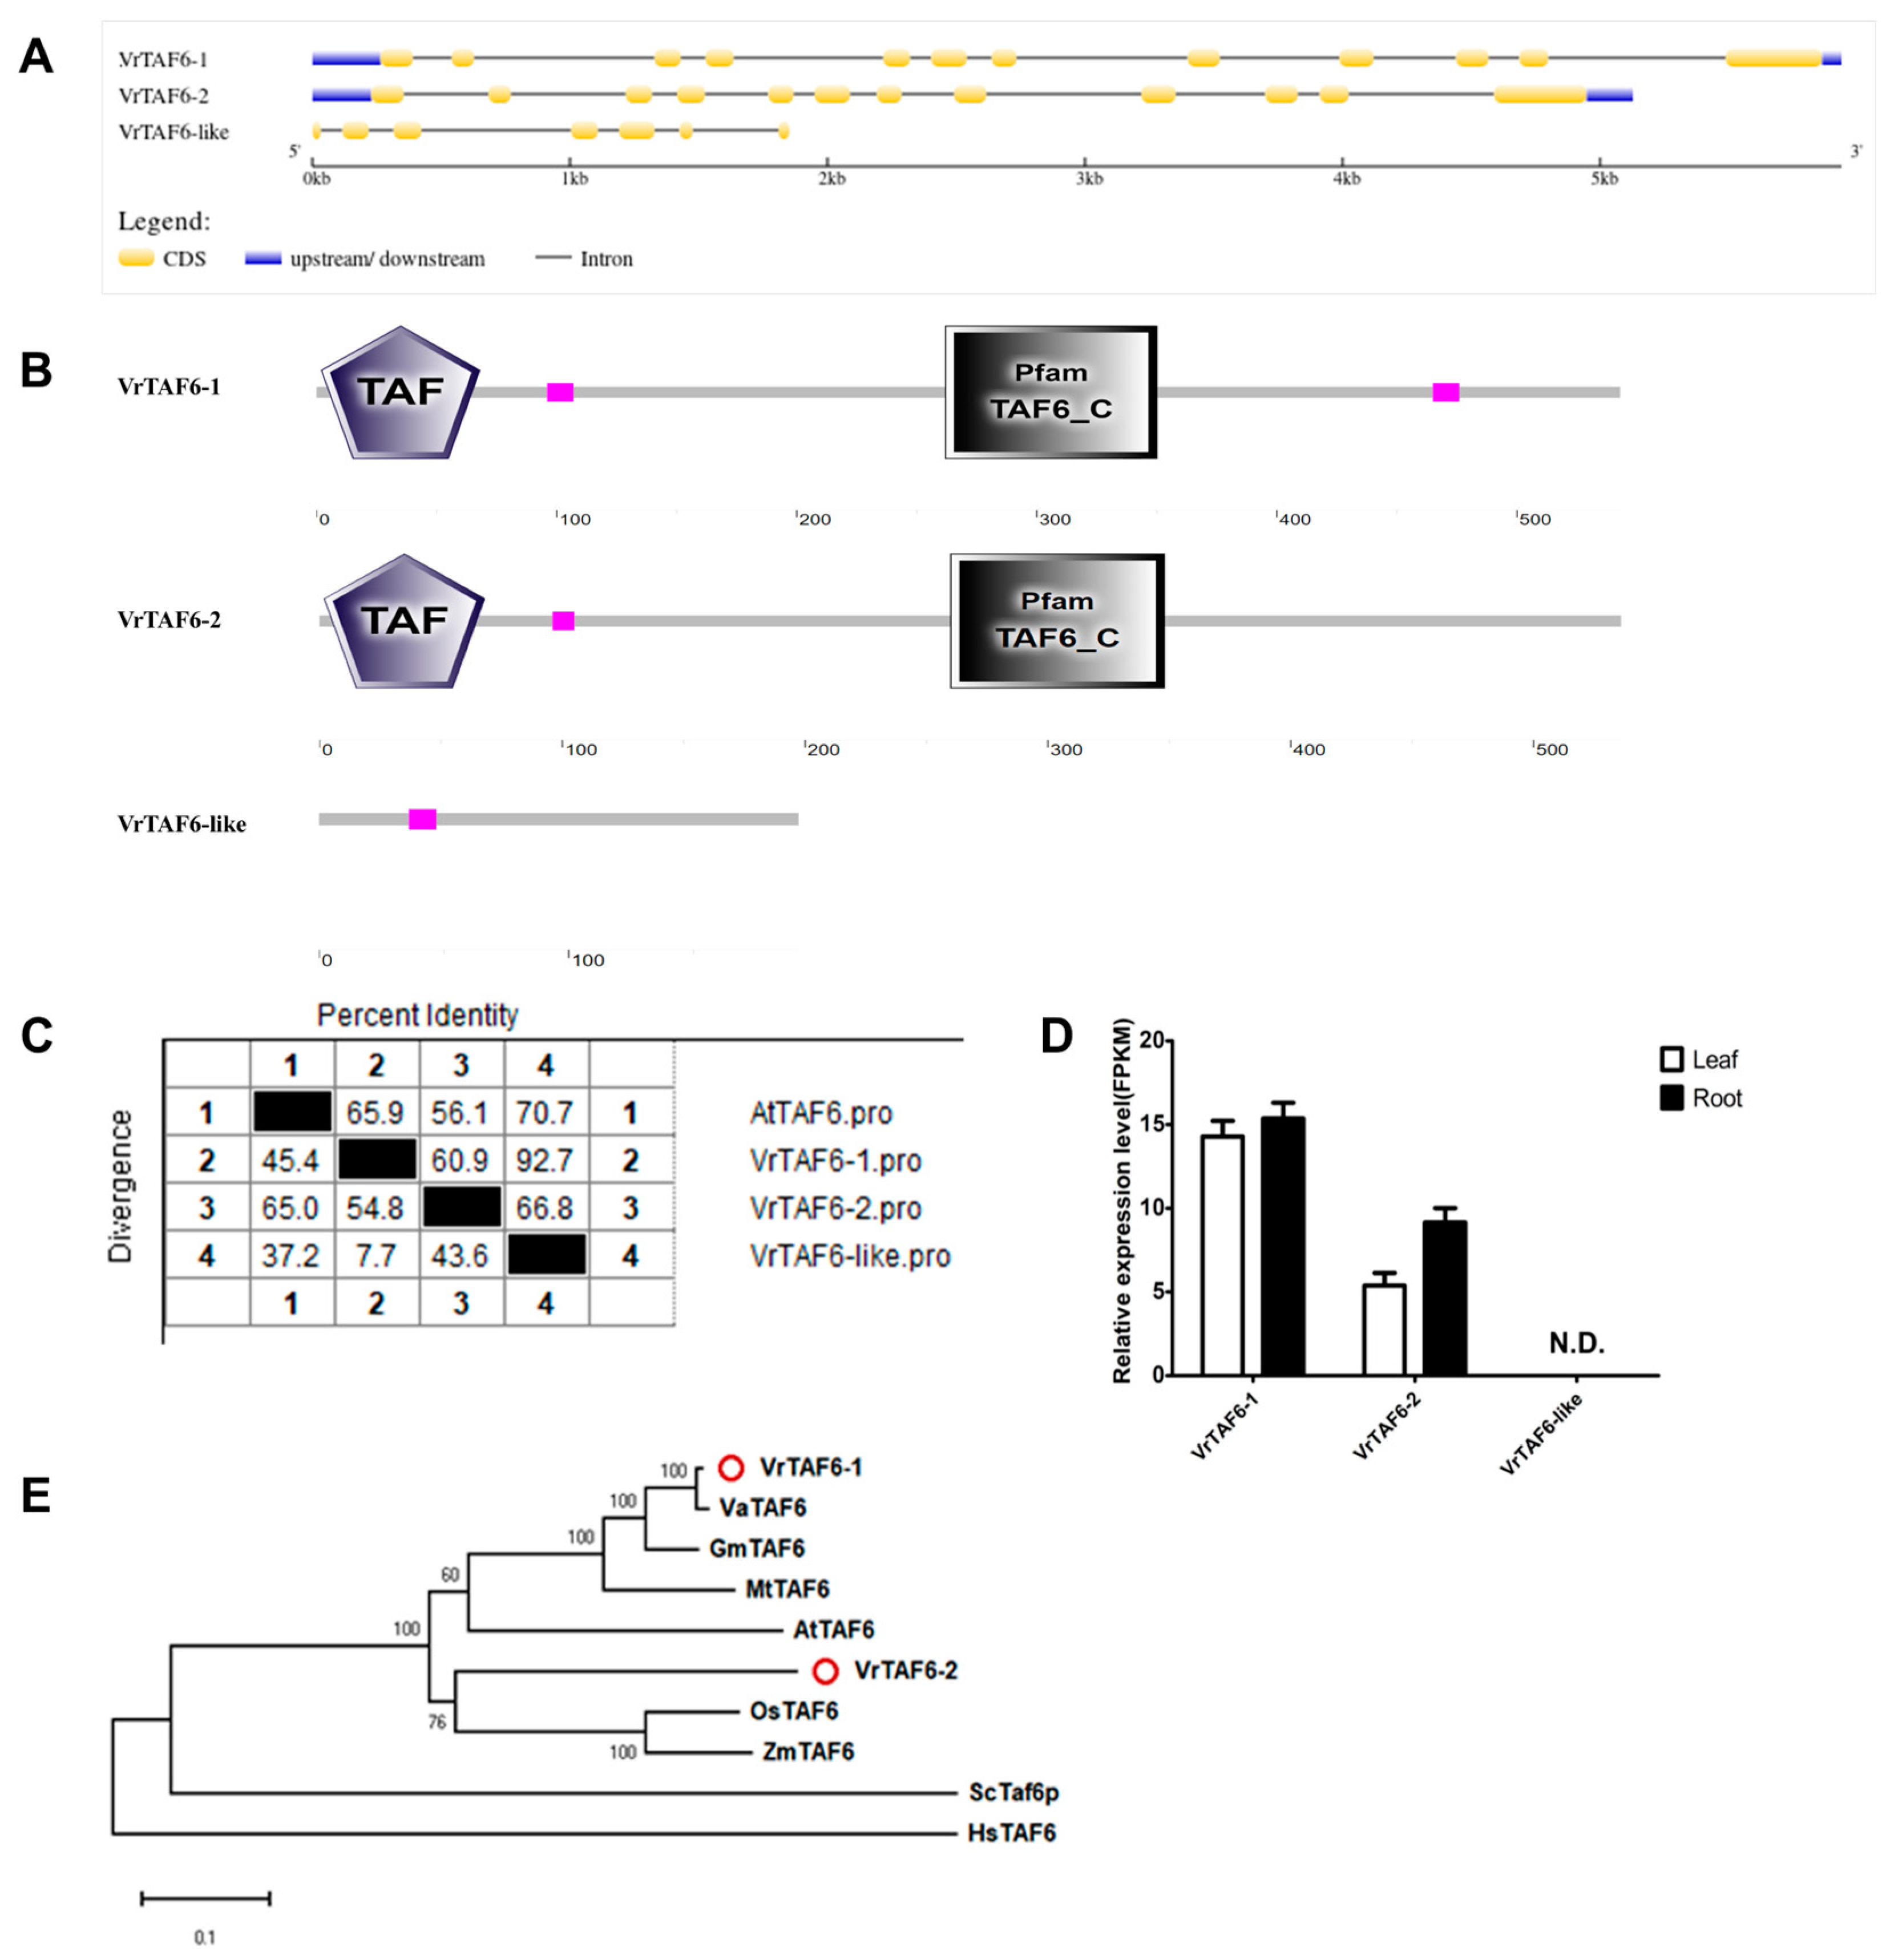
2.2.6. VrTAF6
2.2.7. VrTAF7
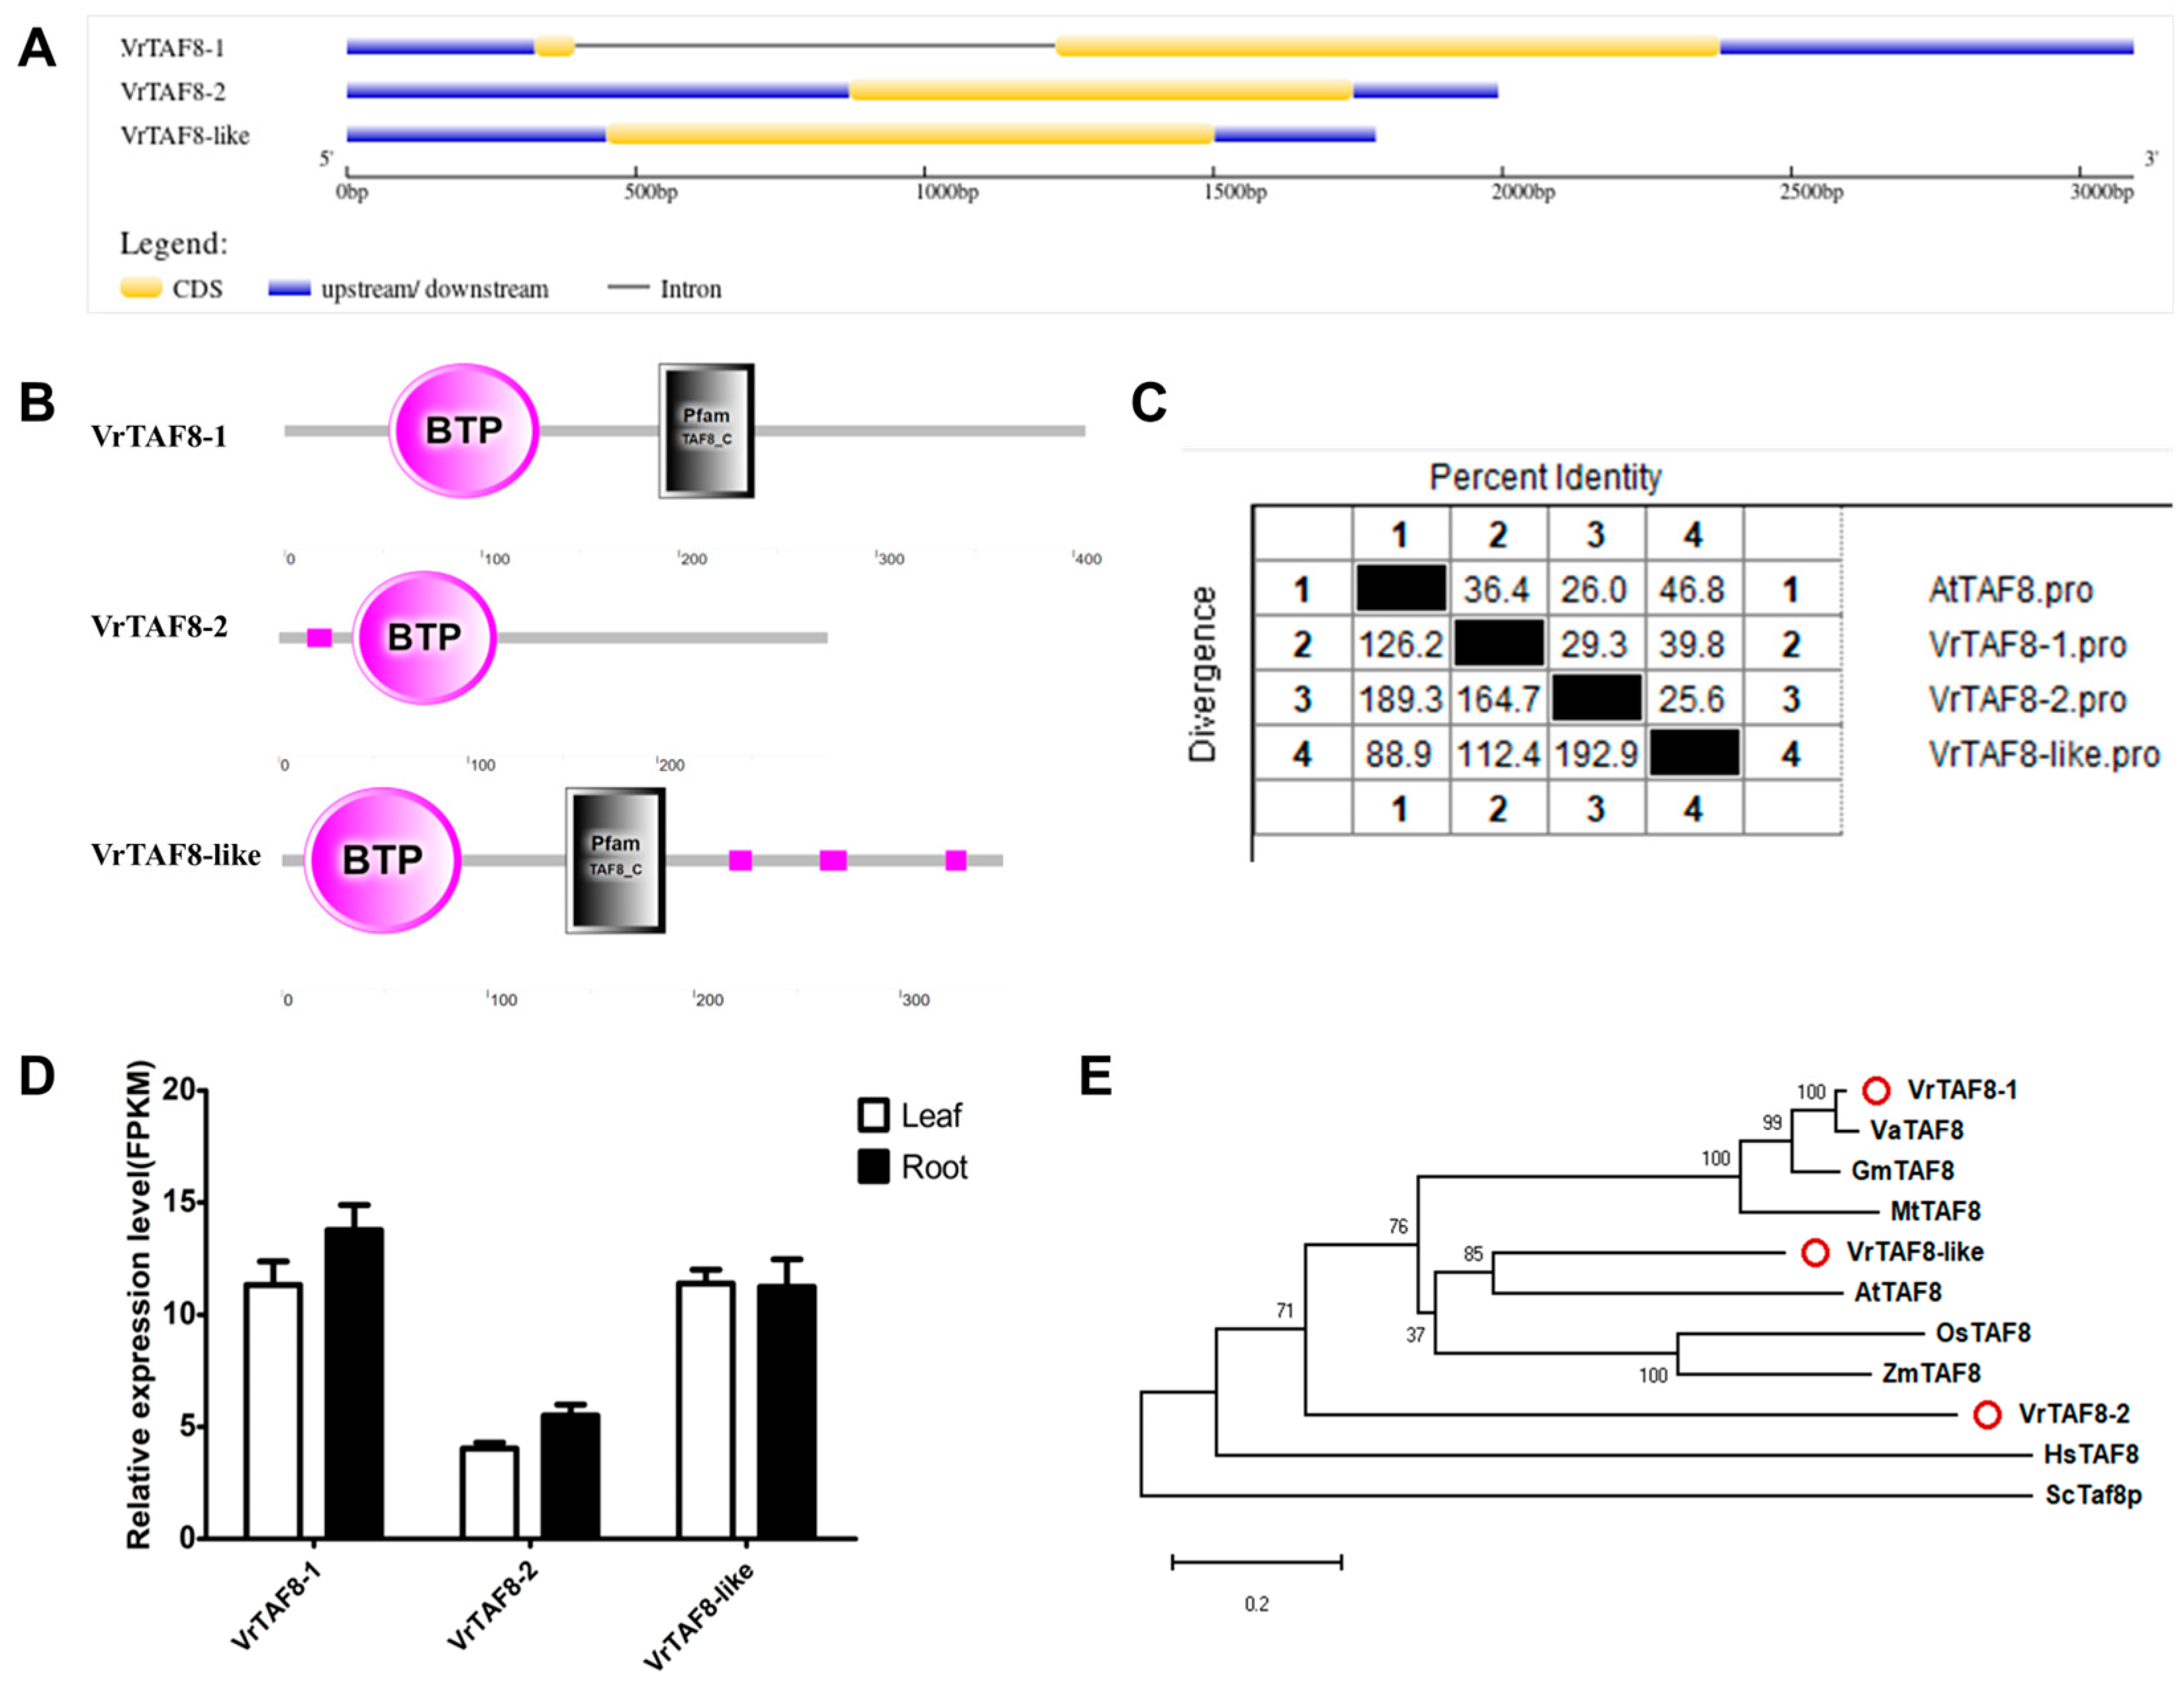
2.2.8. VrTAF8
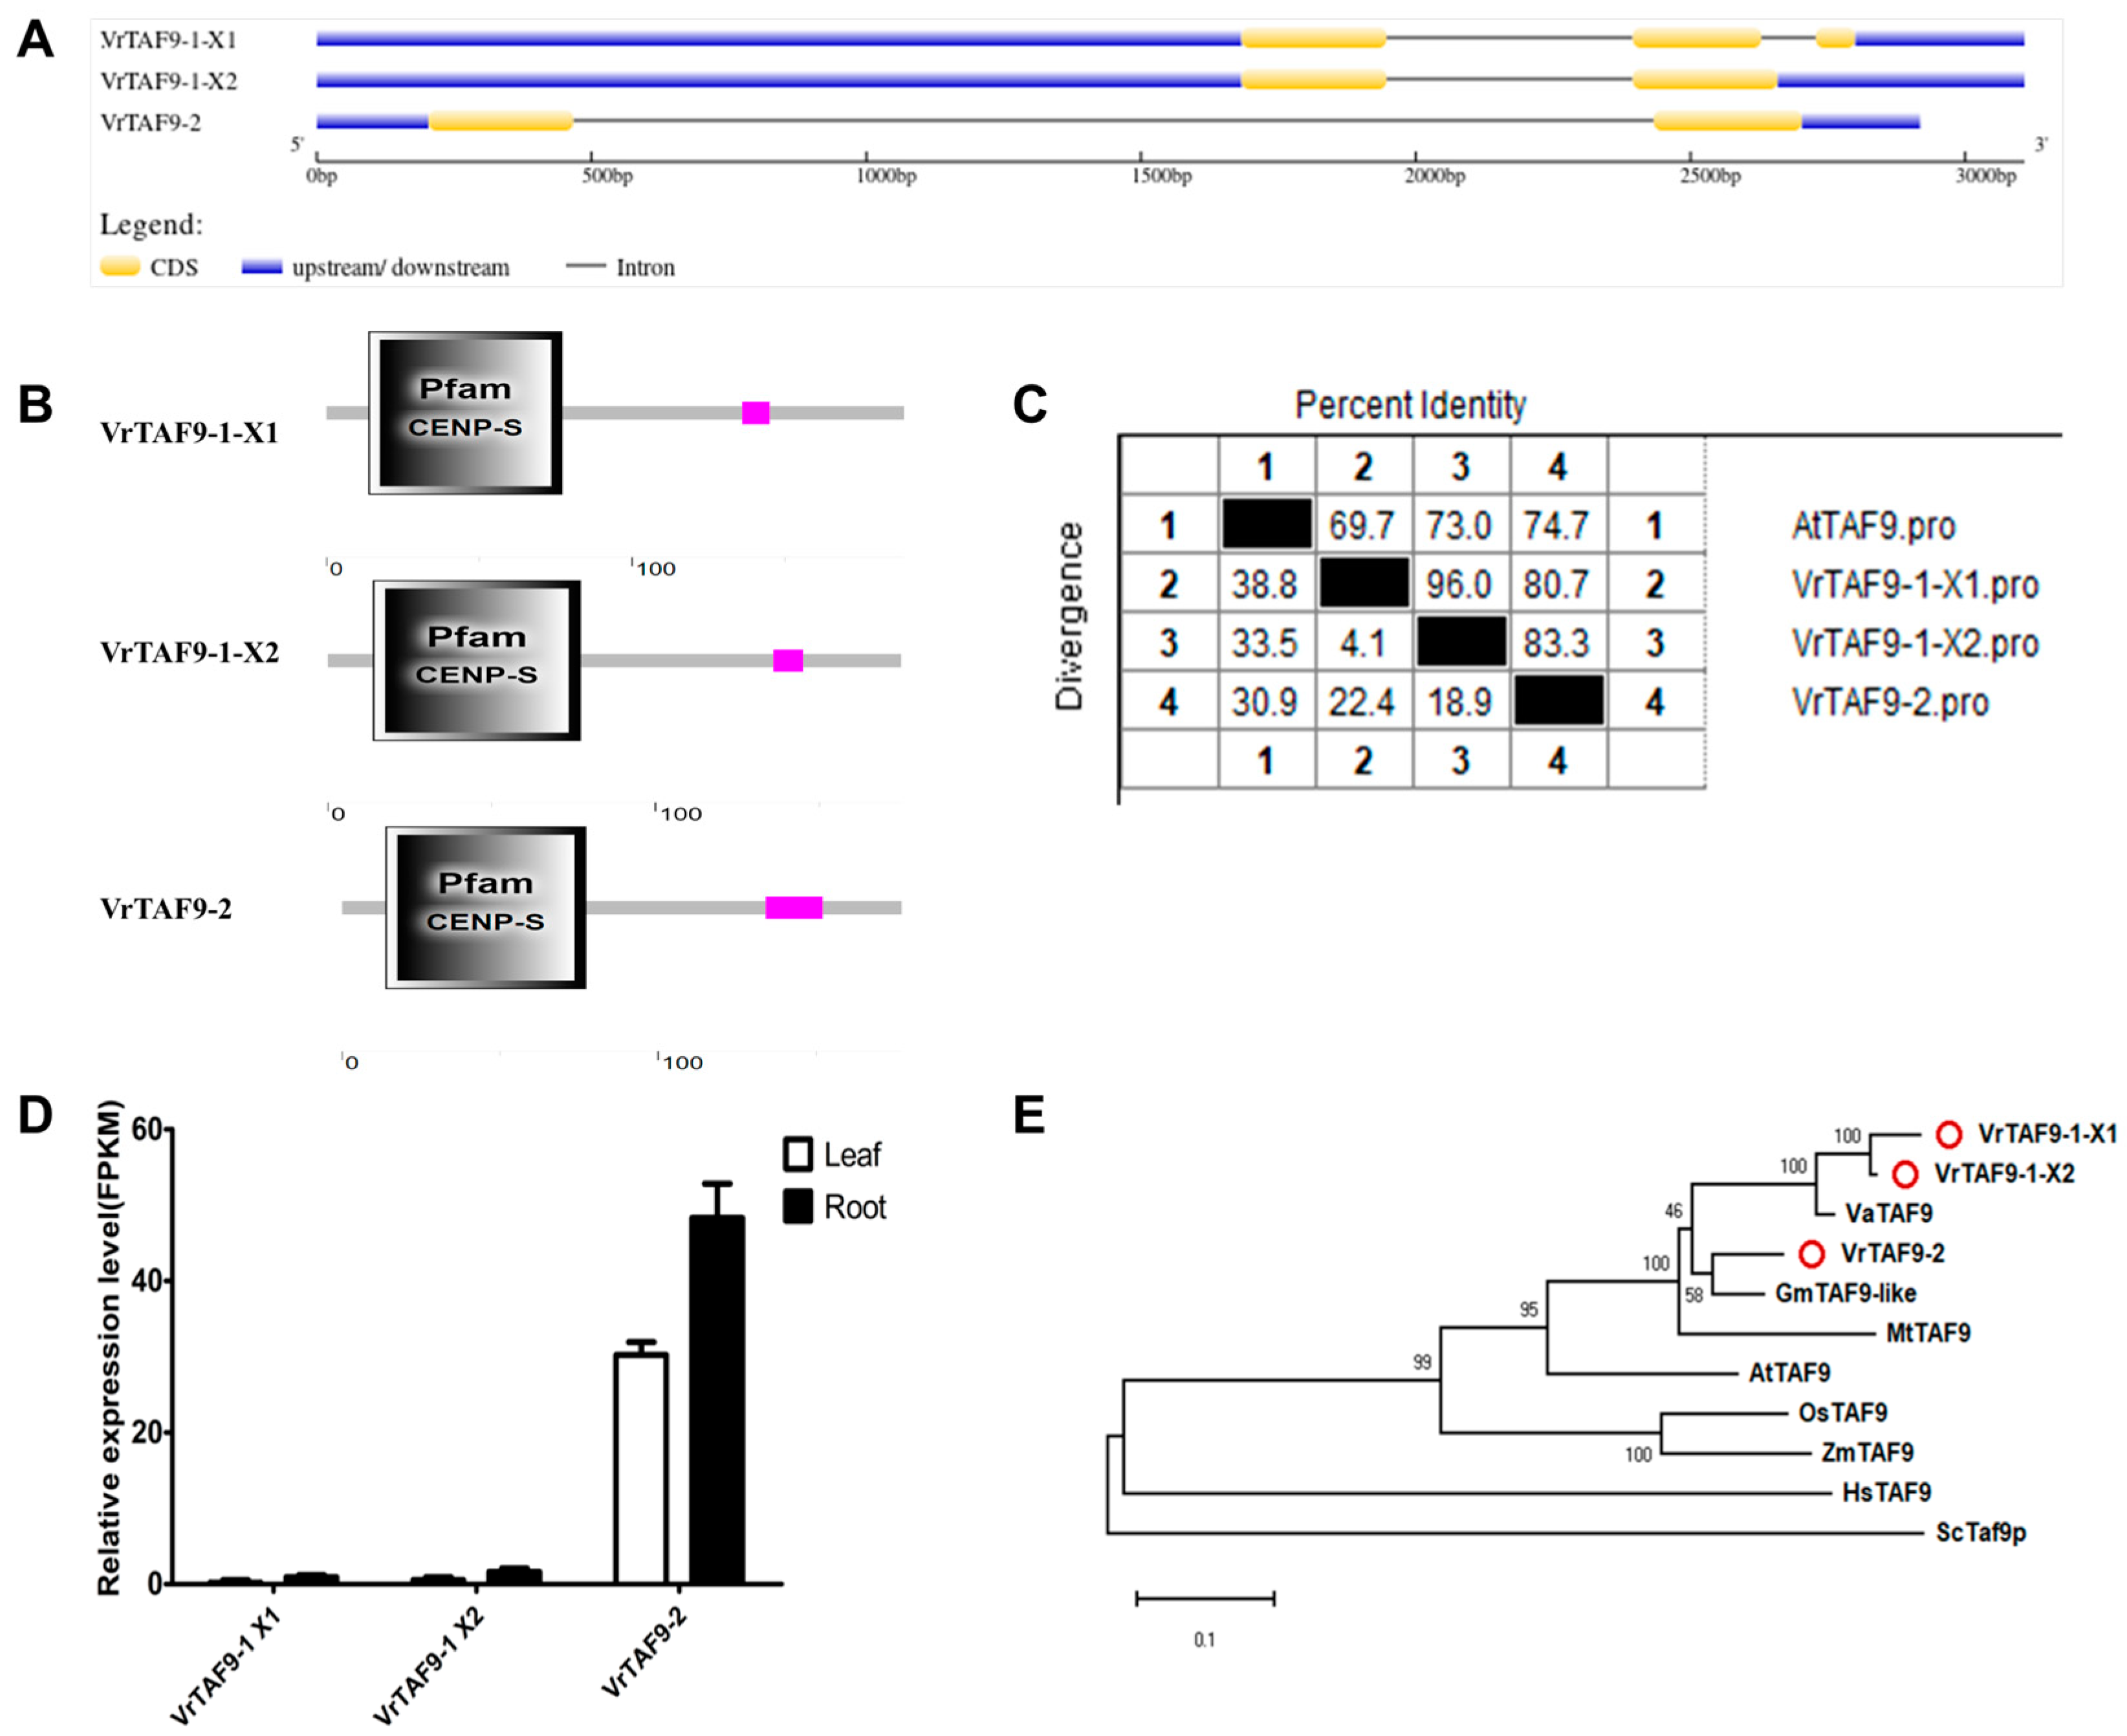
2.2.9. VrTAF9
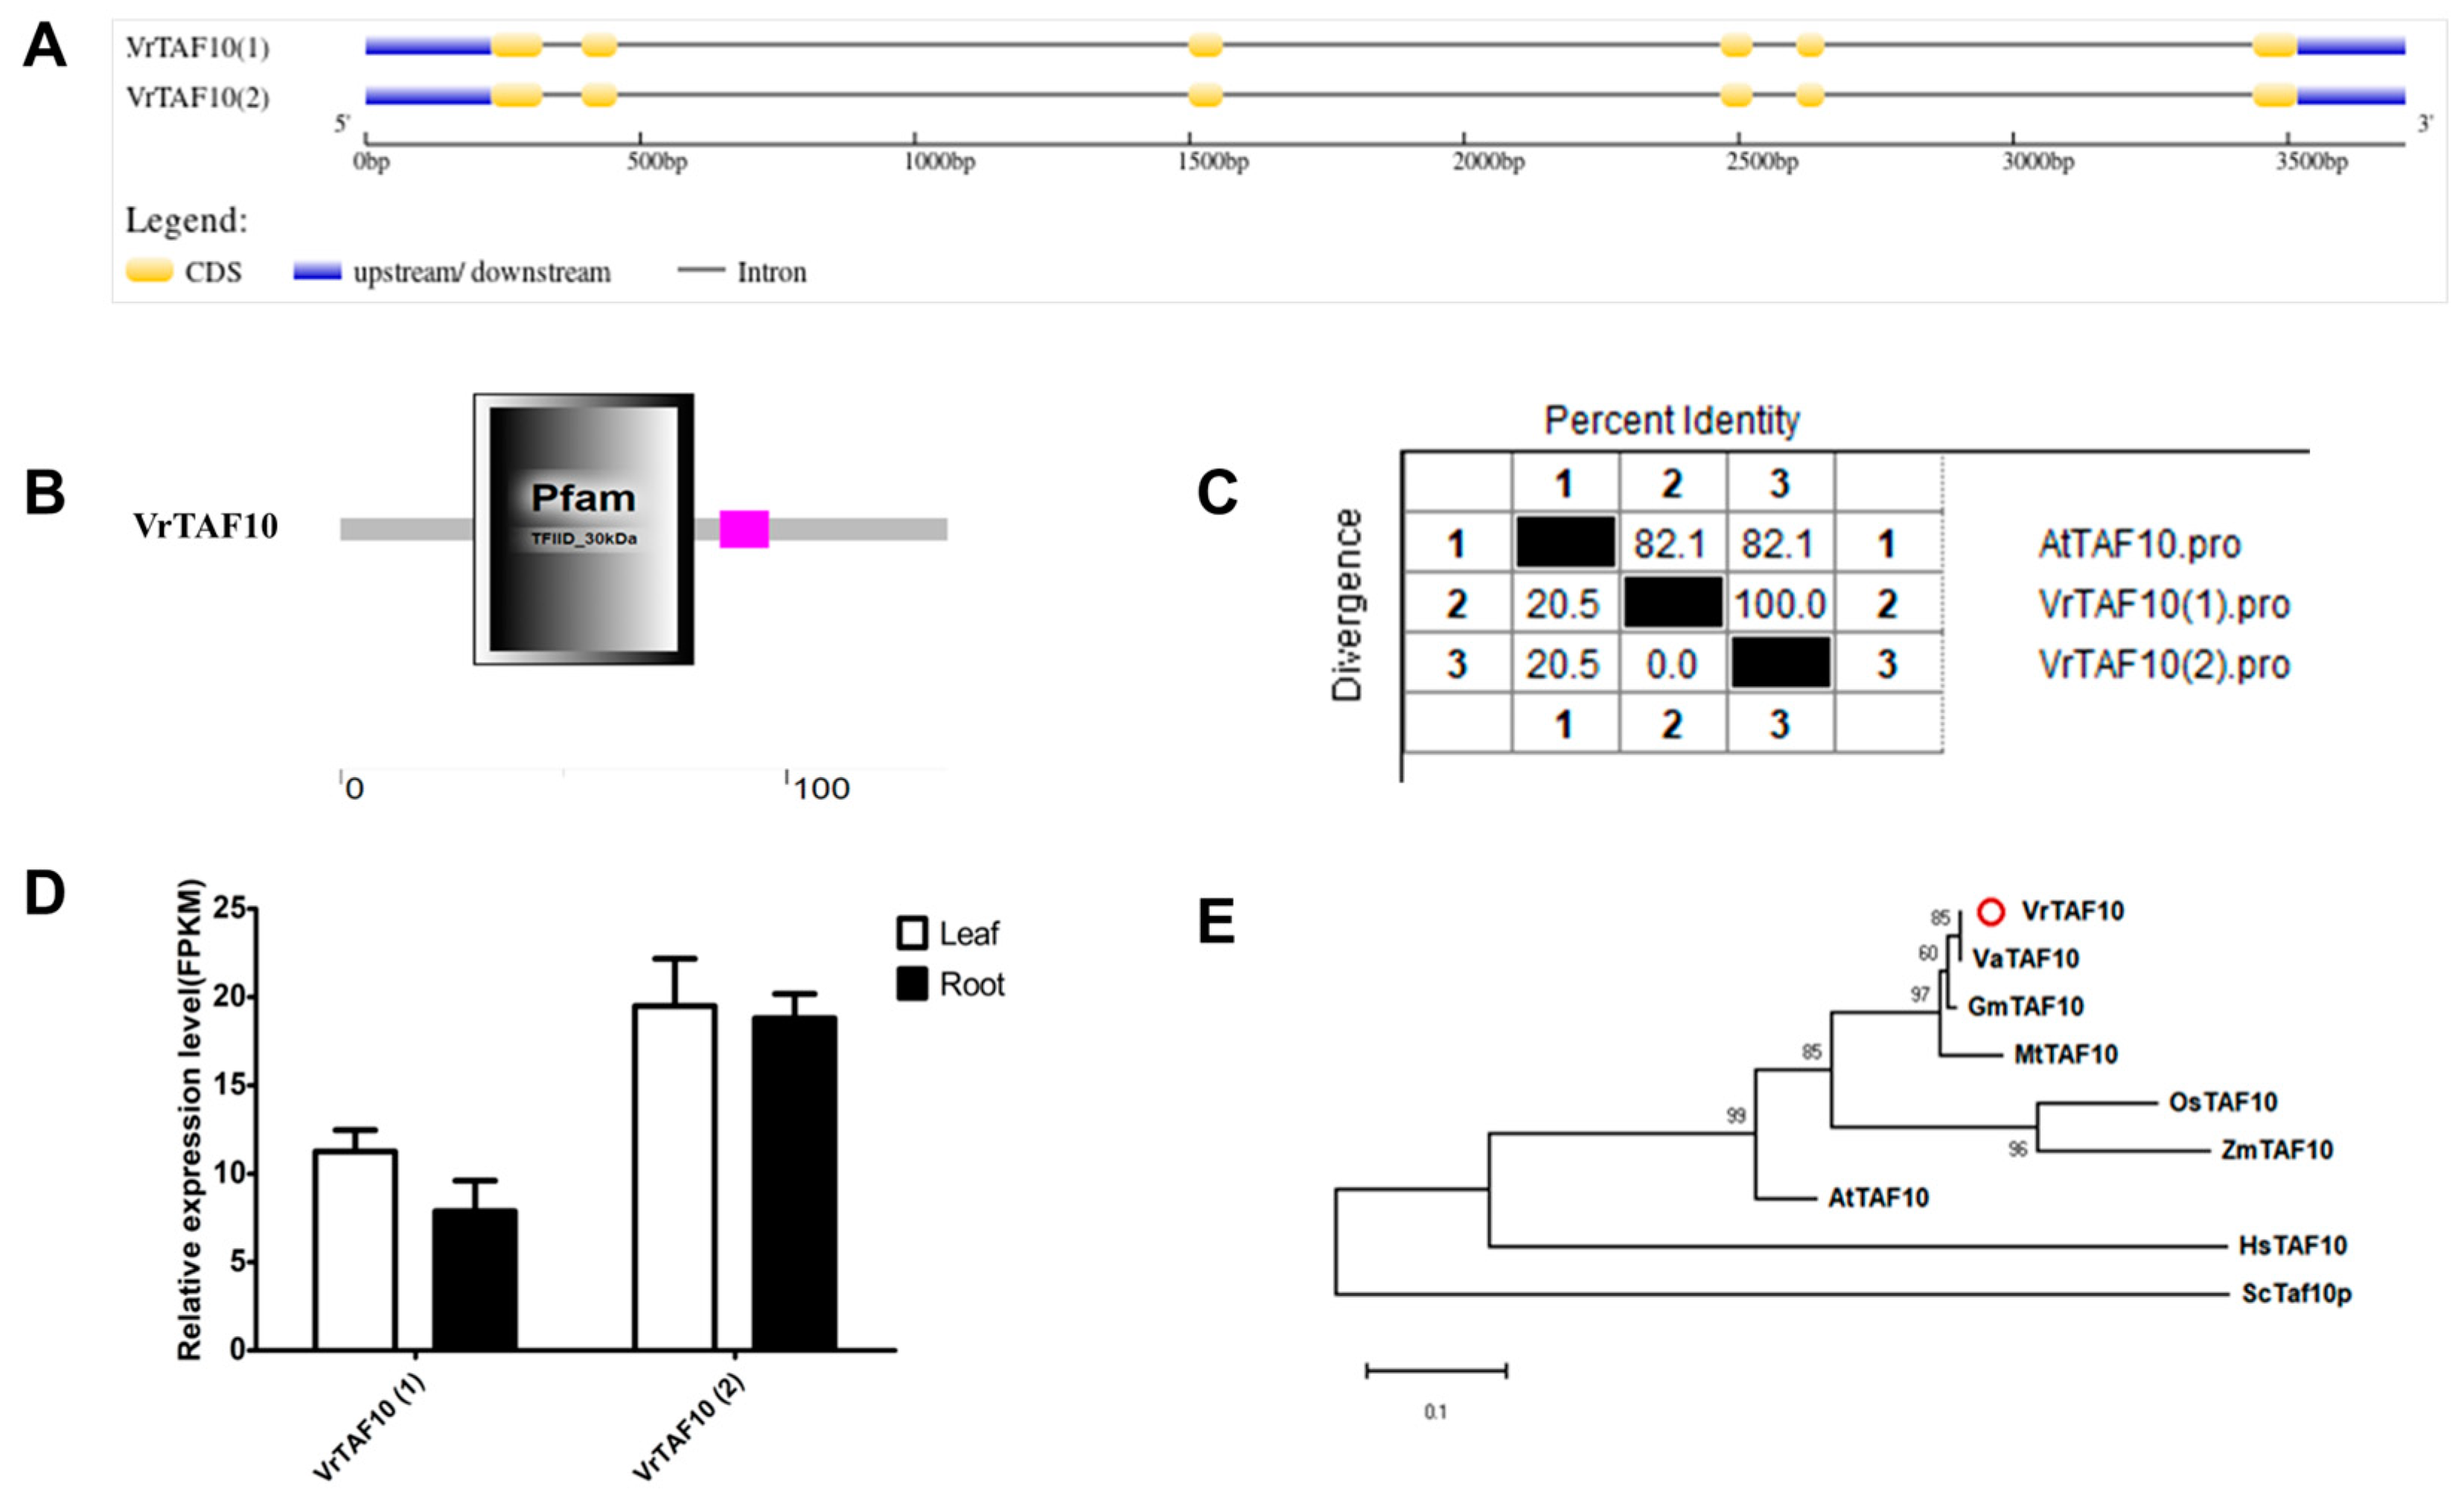
2.2.10. VrTAF10
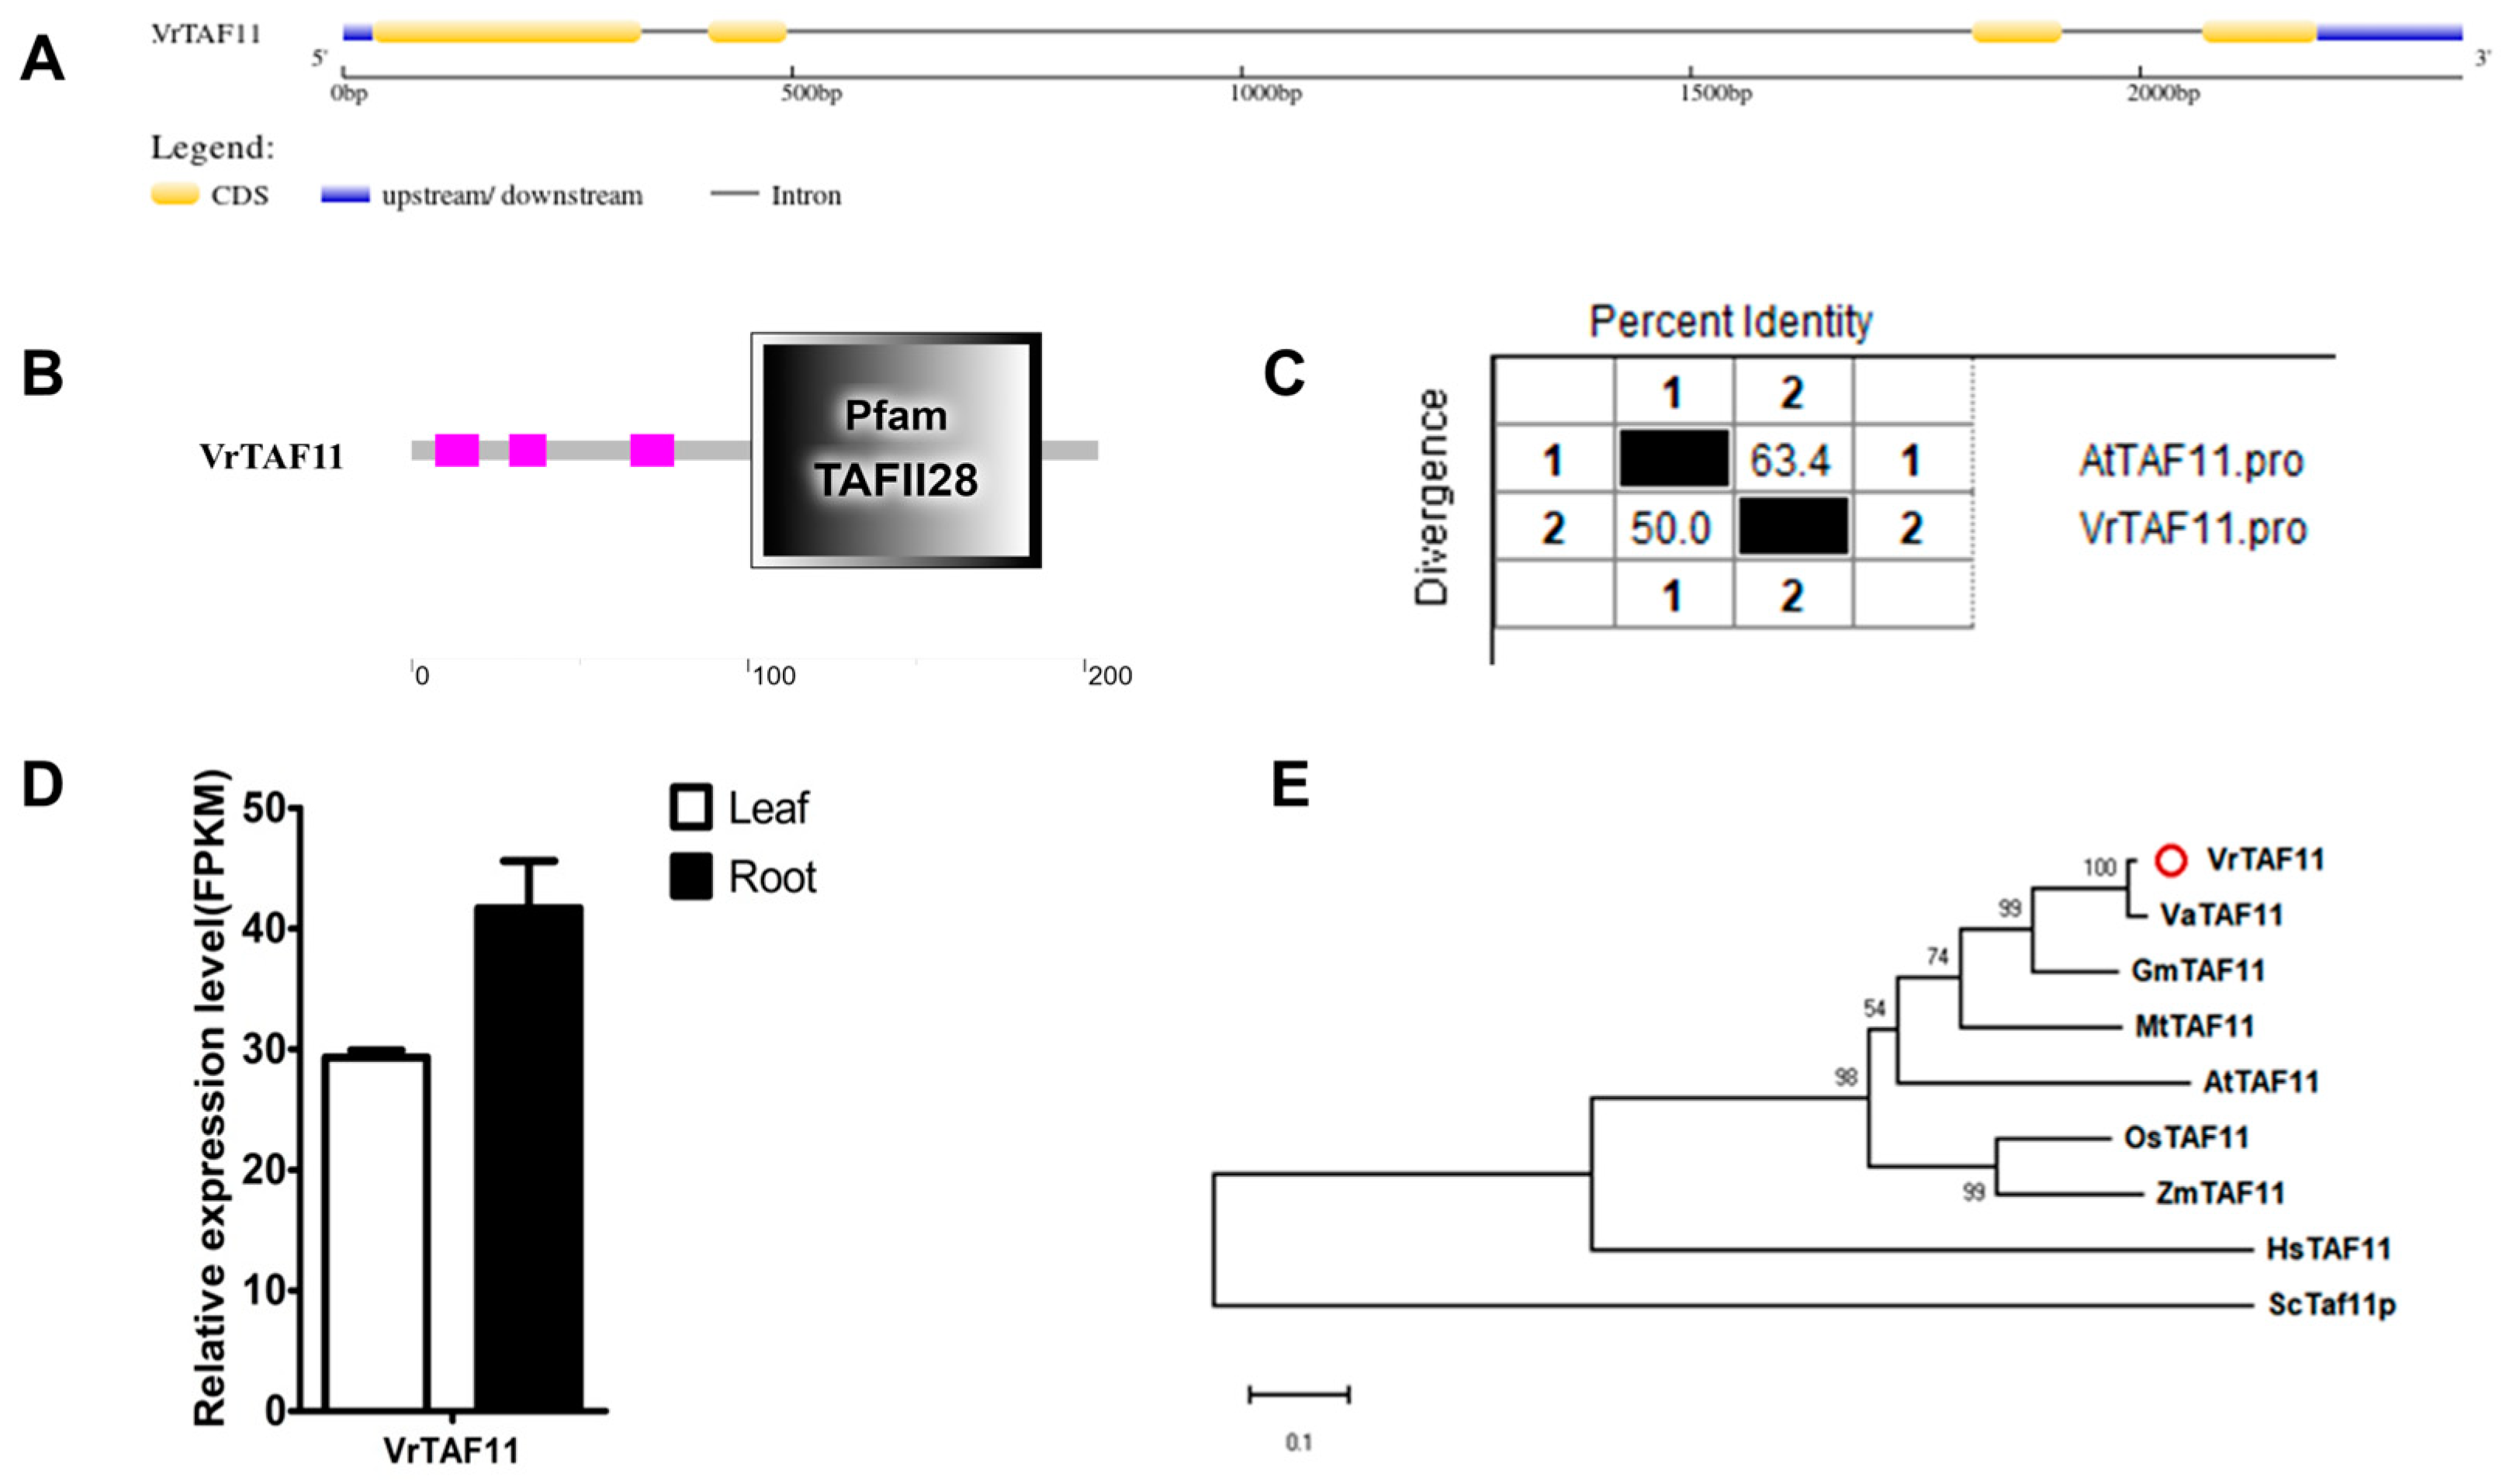
2.2.11. VrTAF11
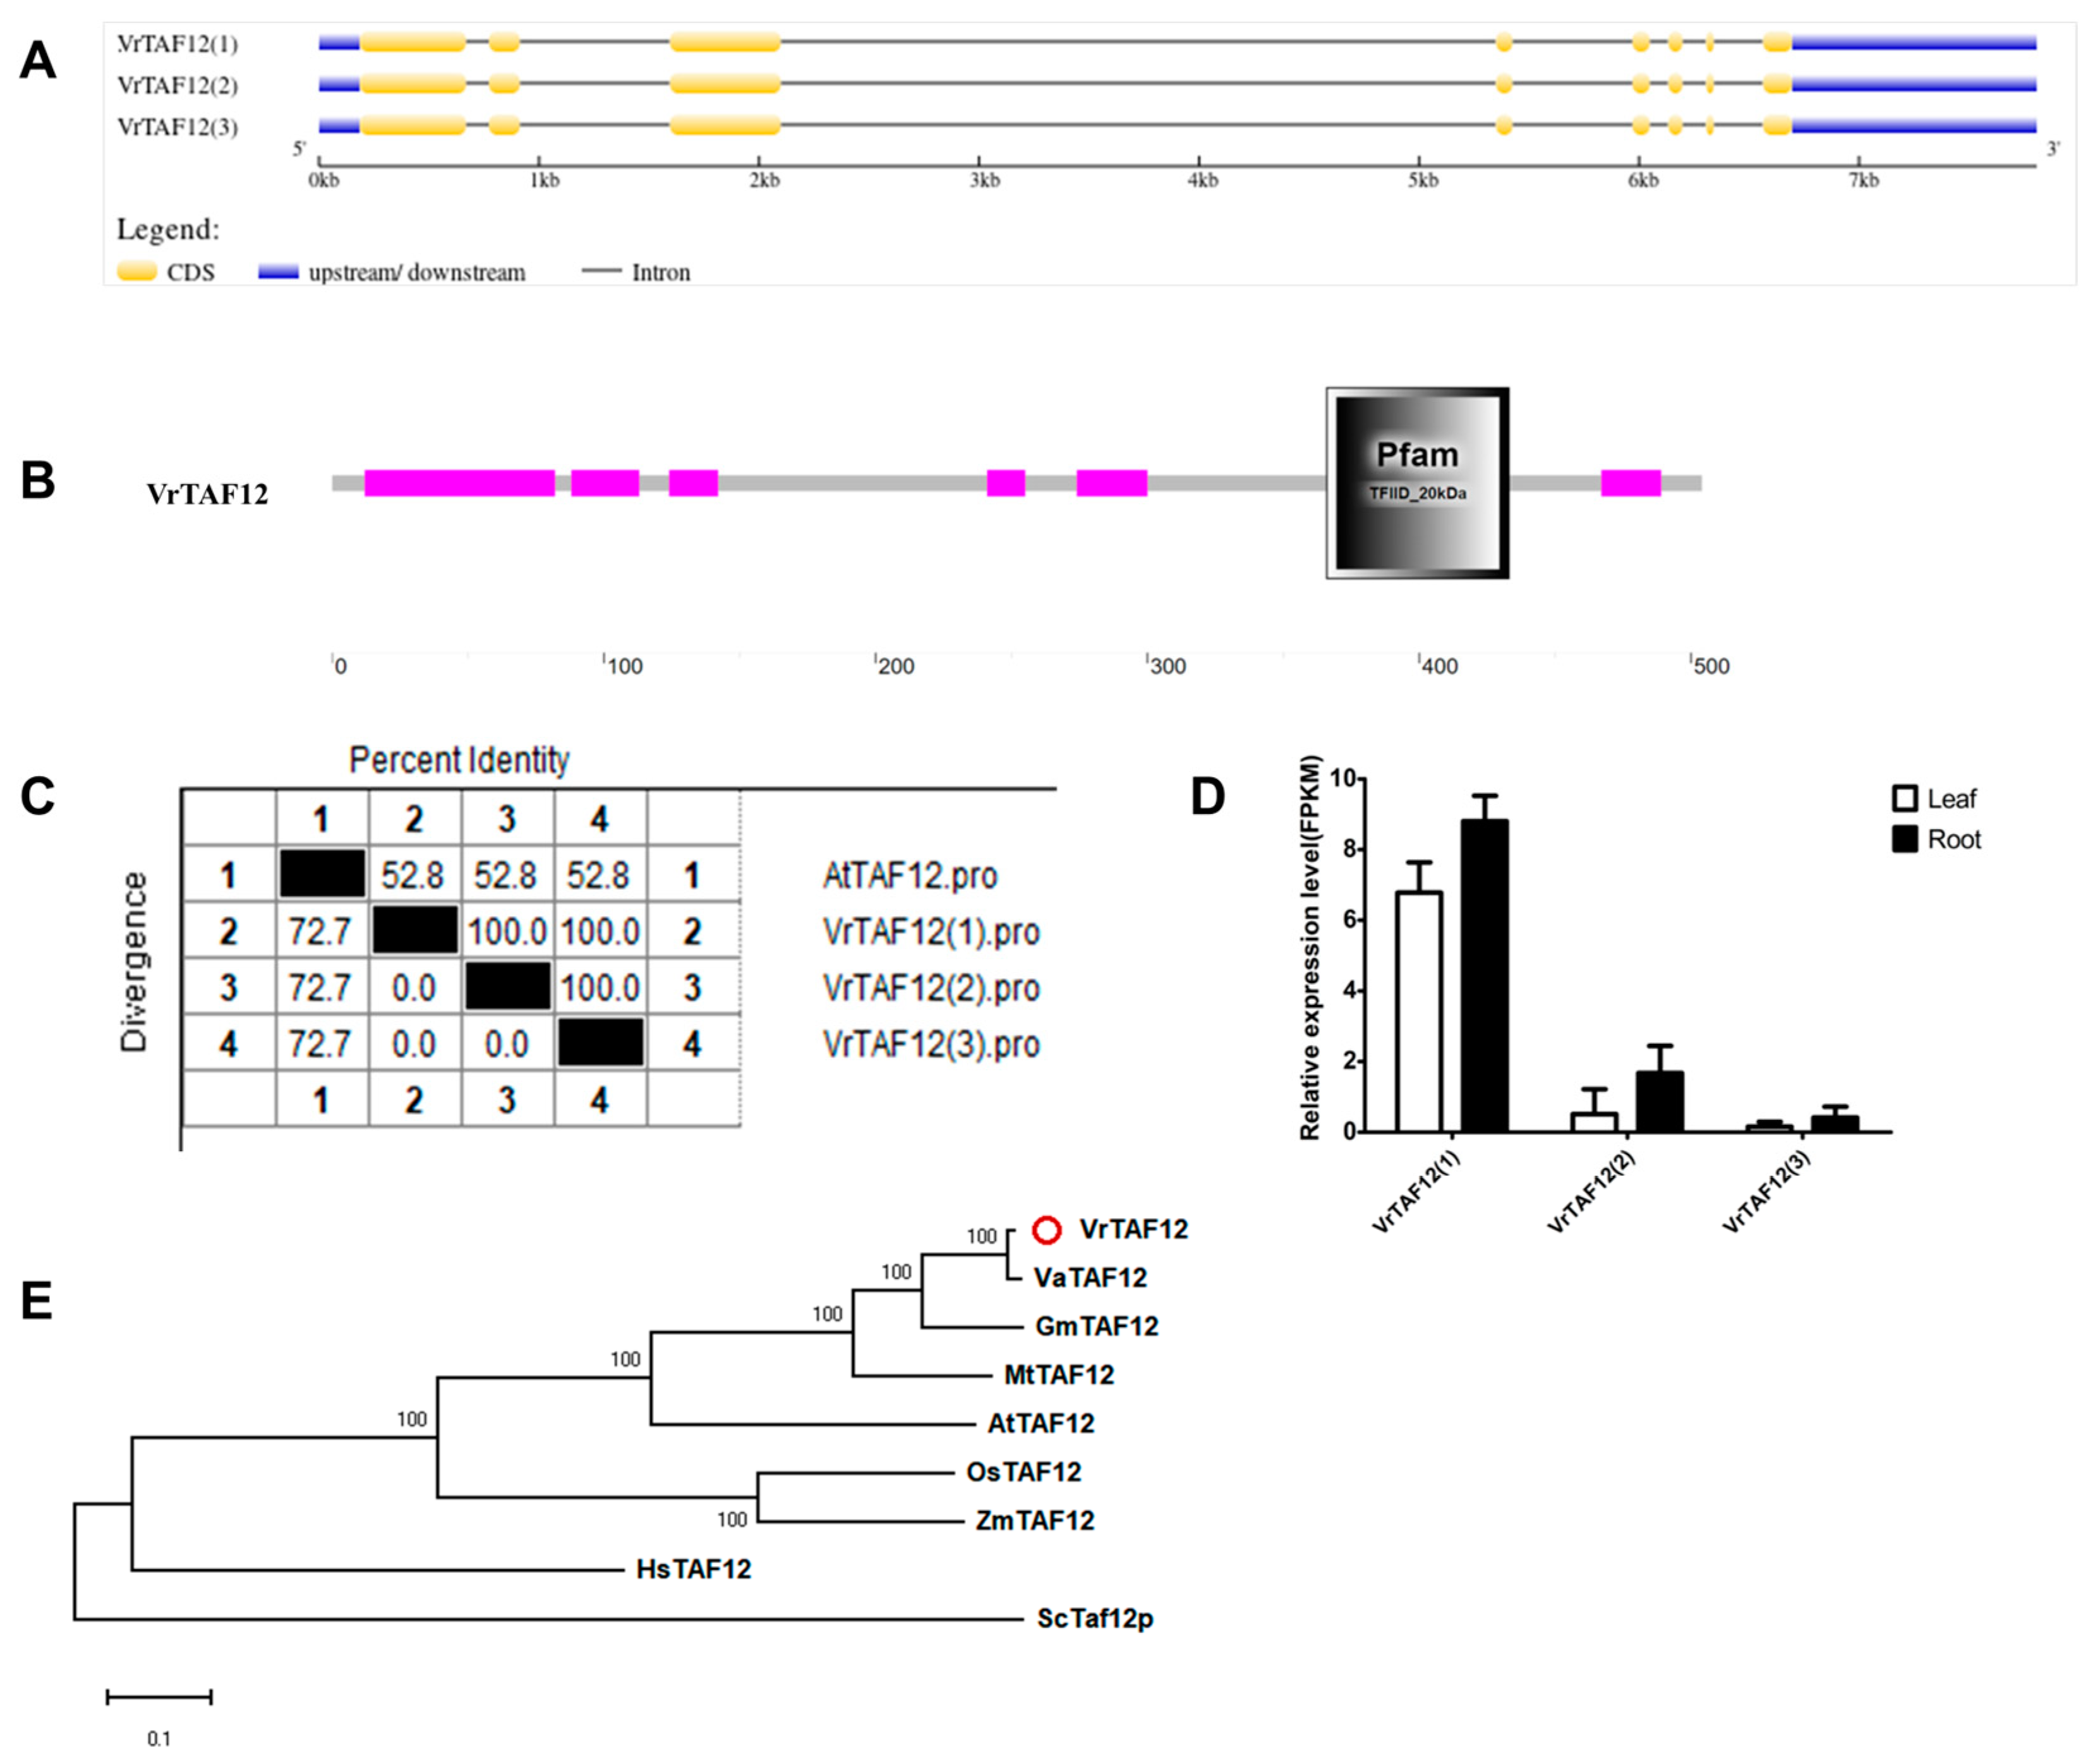
2.2.12. VrTAF12
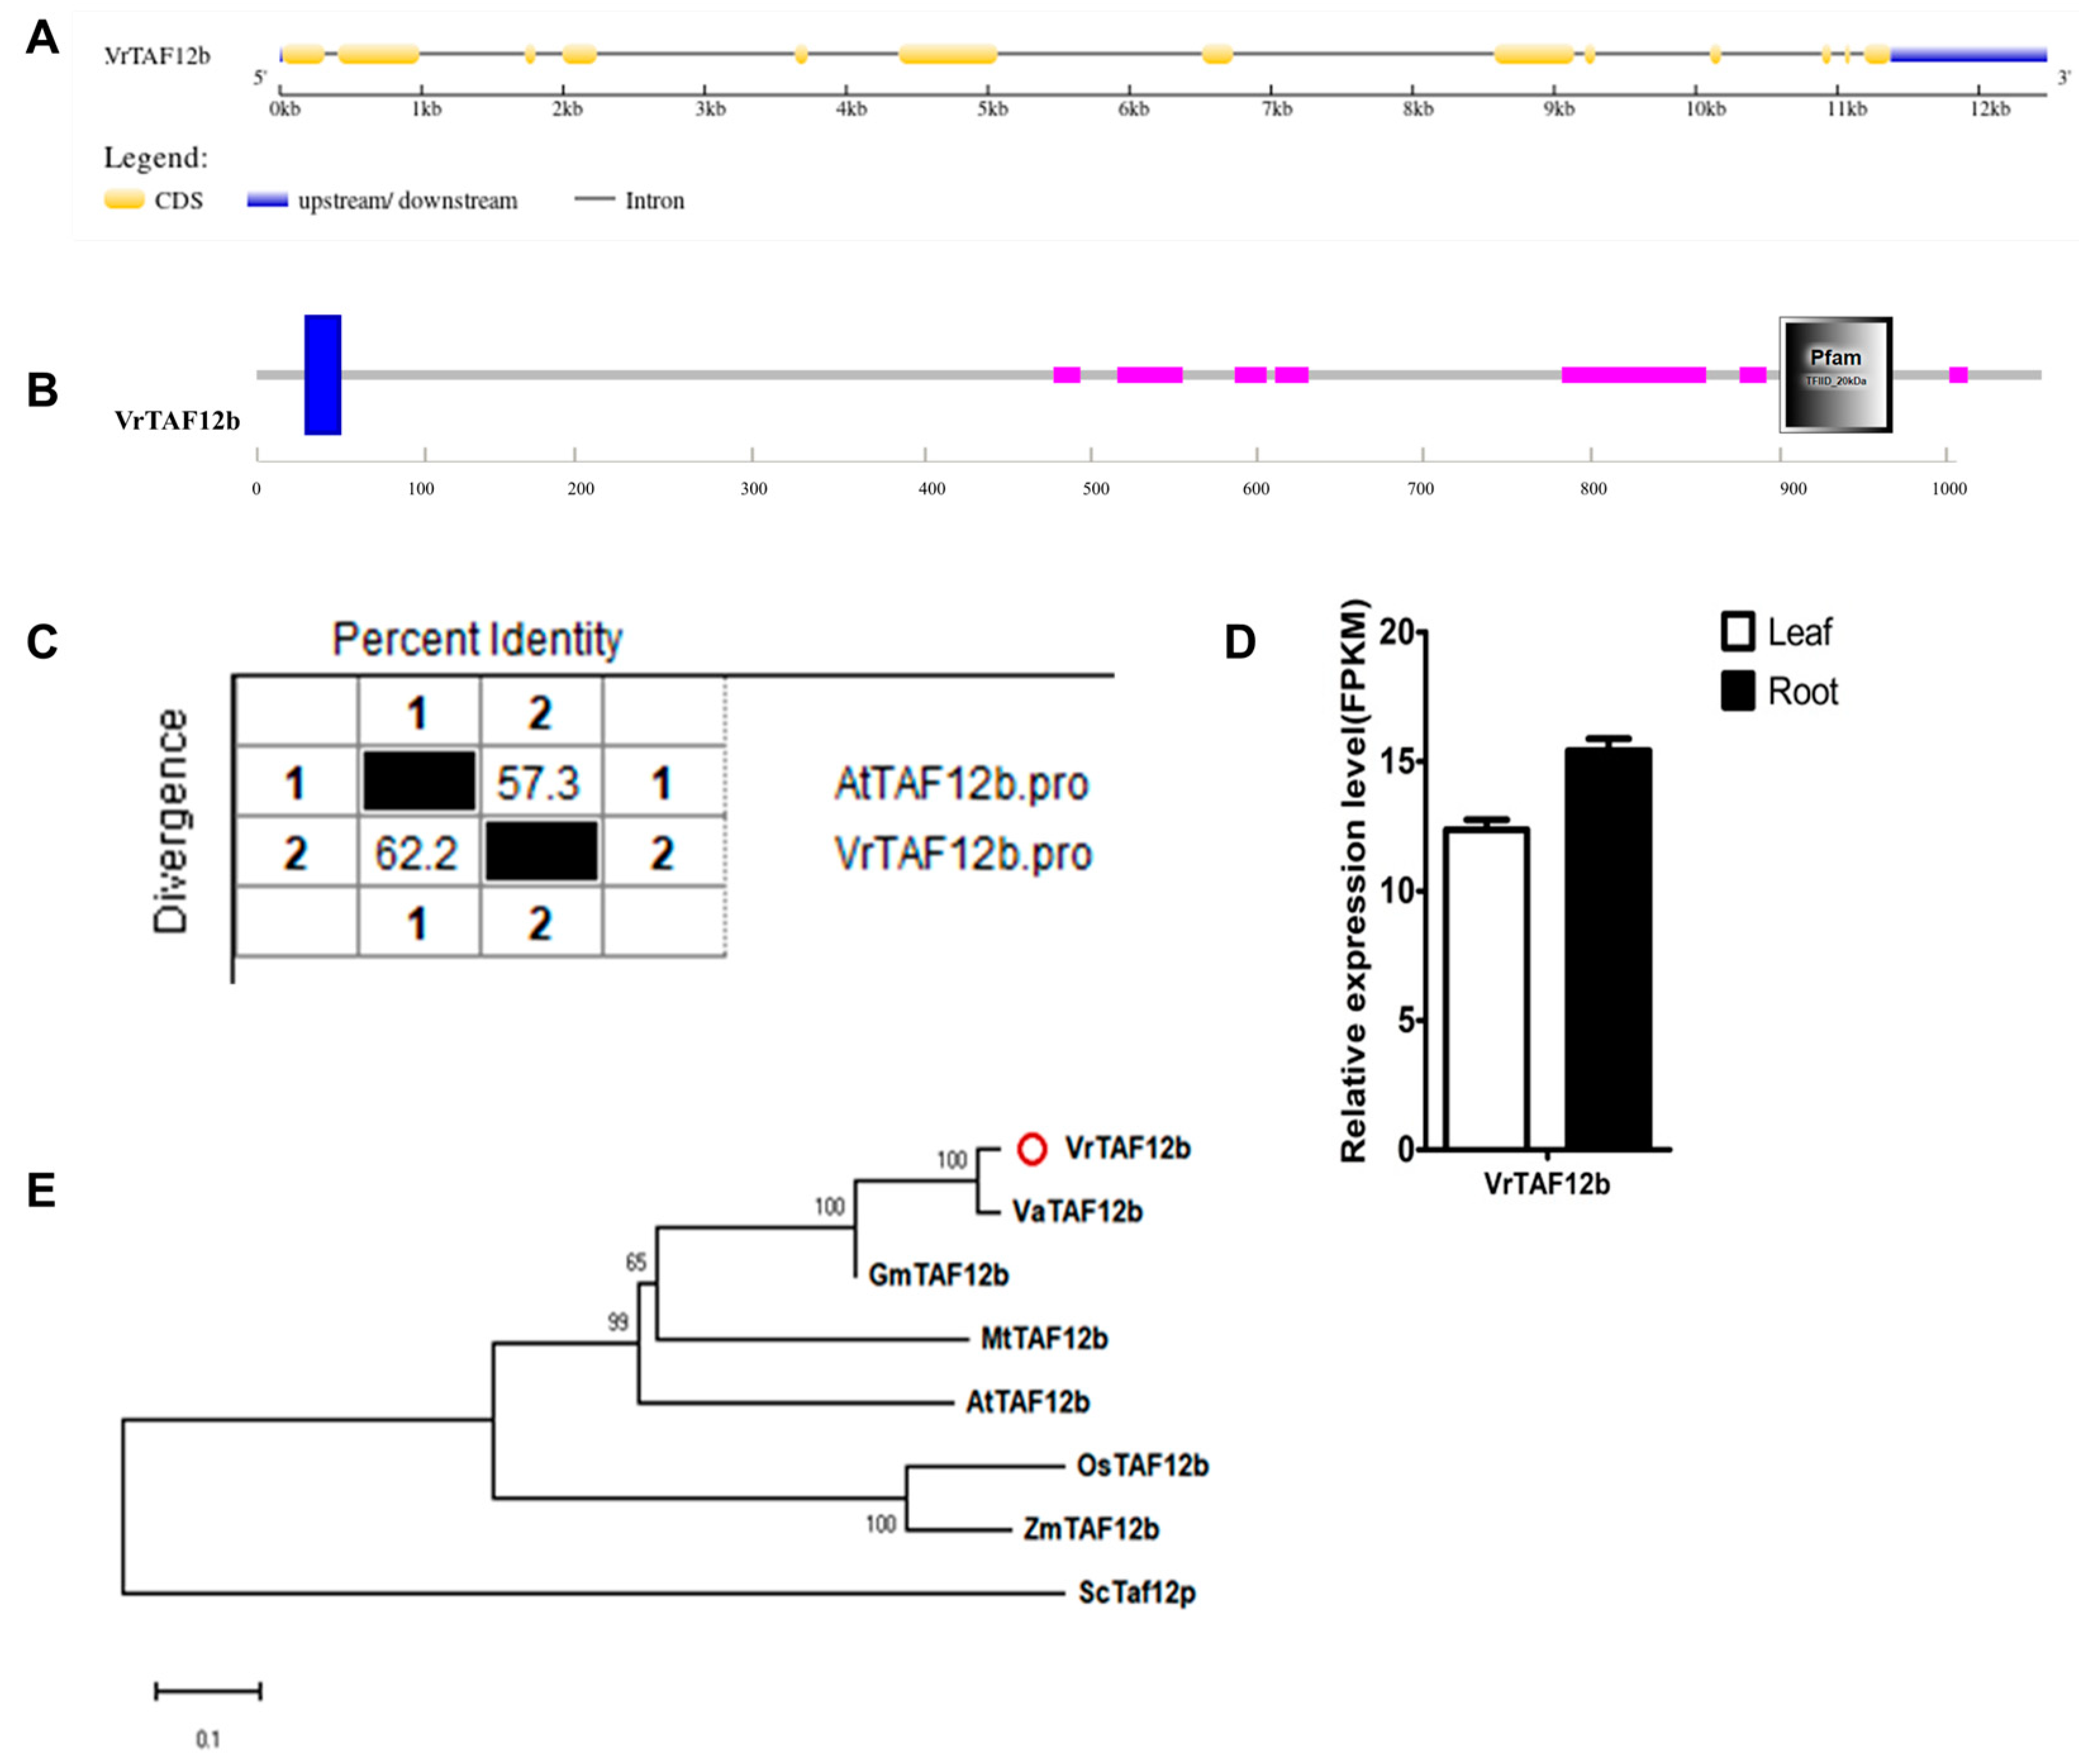
2.2.13. VrTAF12b
2.2.14. VrTAF13
2.2.15. VrTAF14b
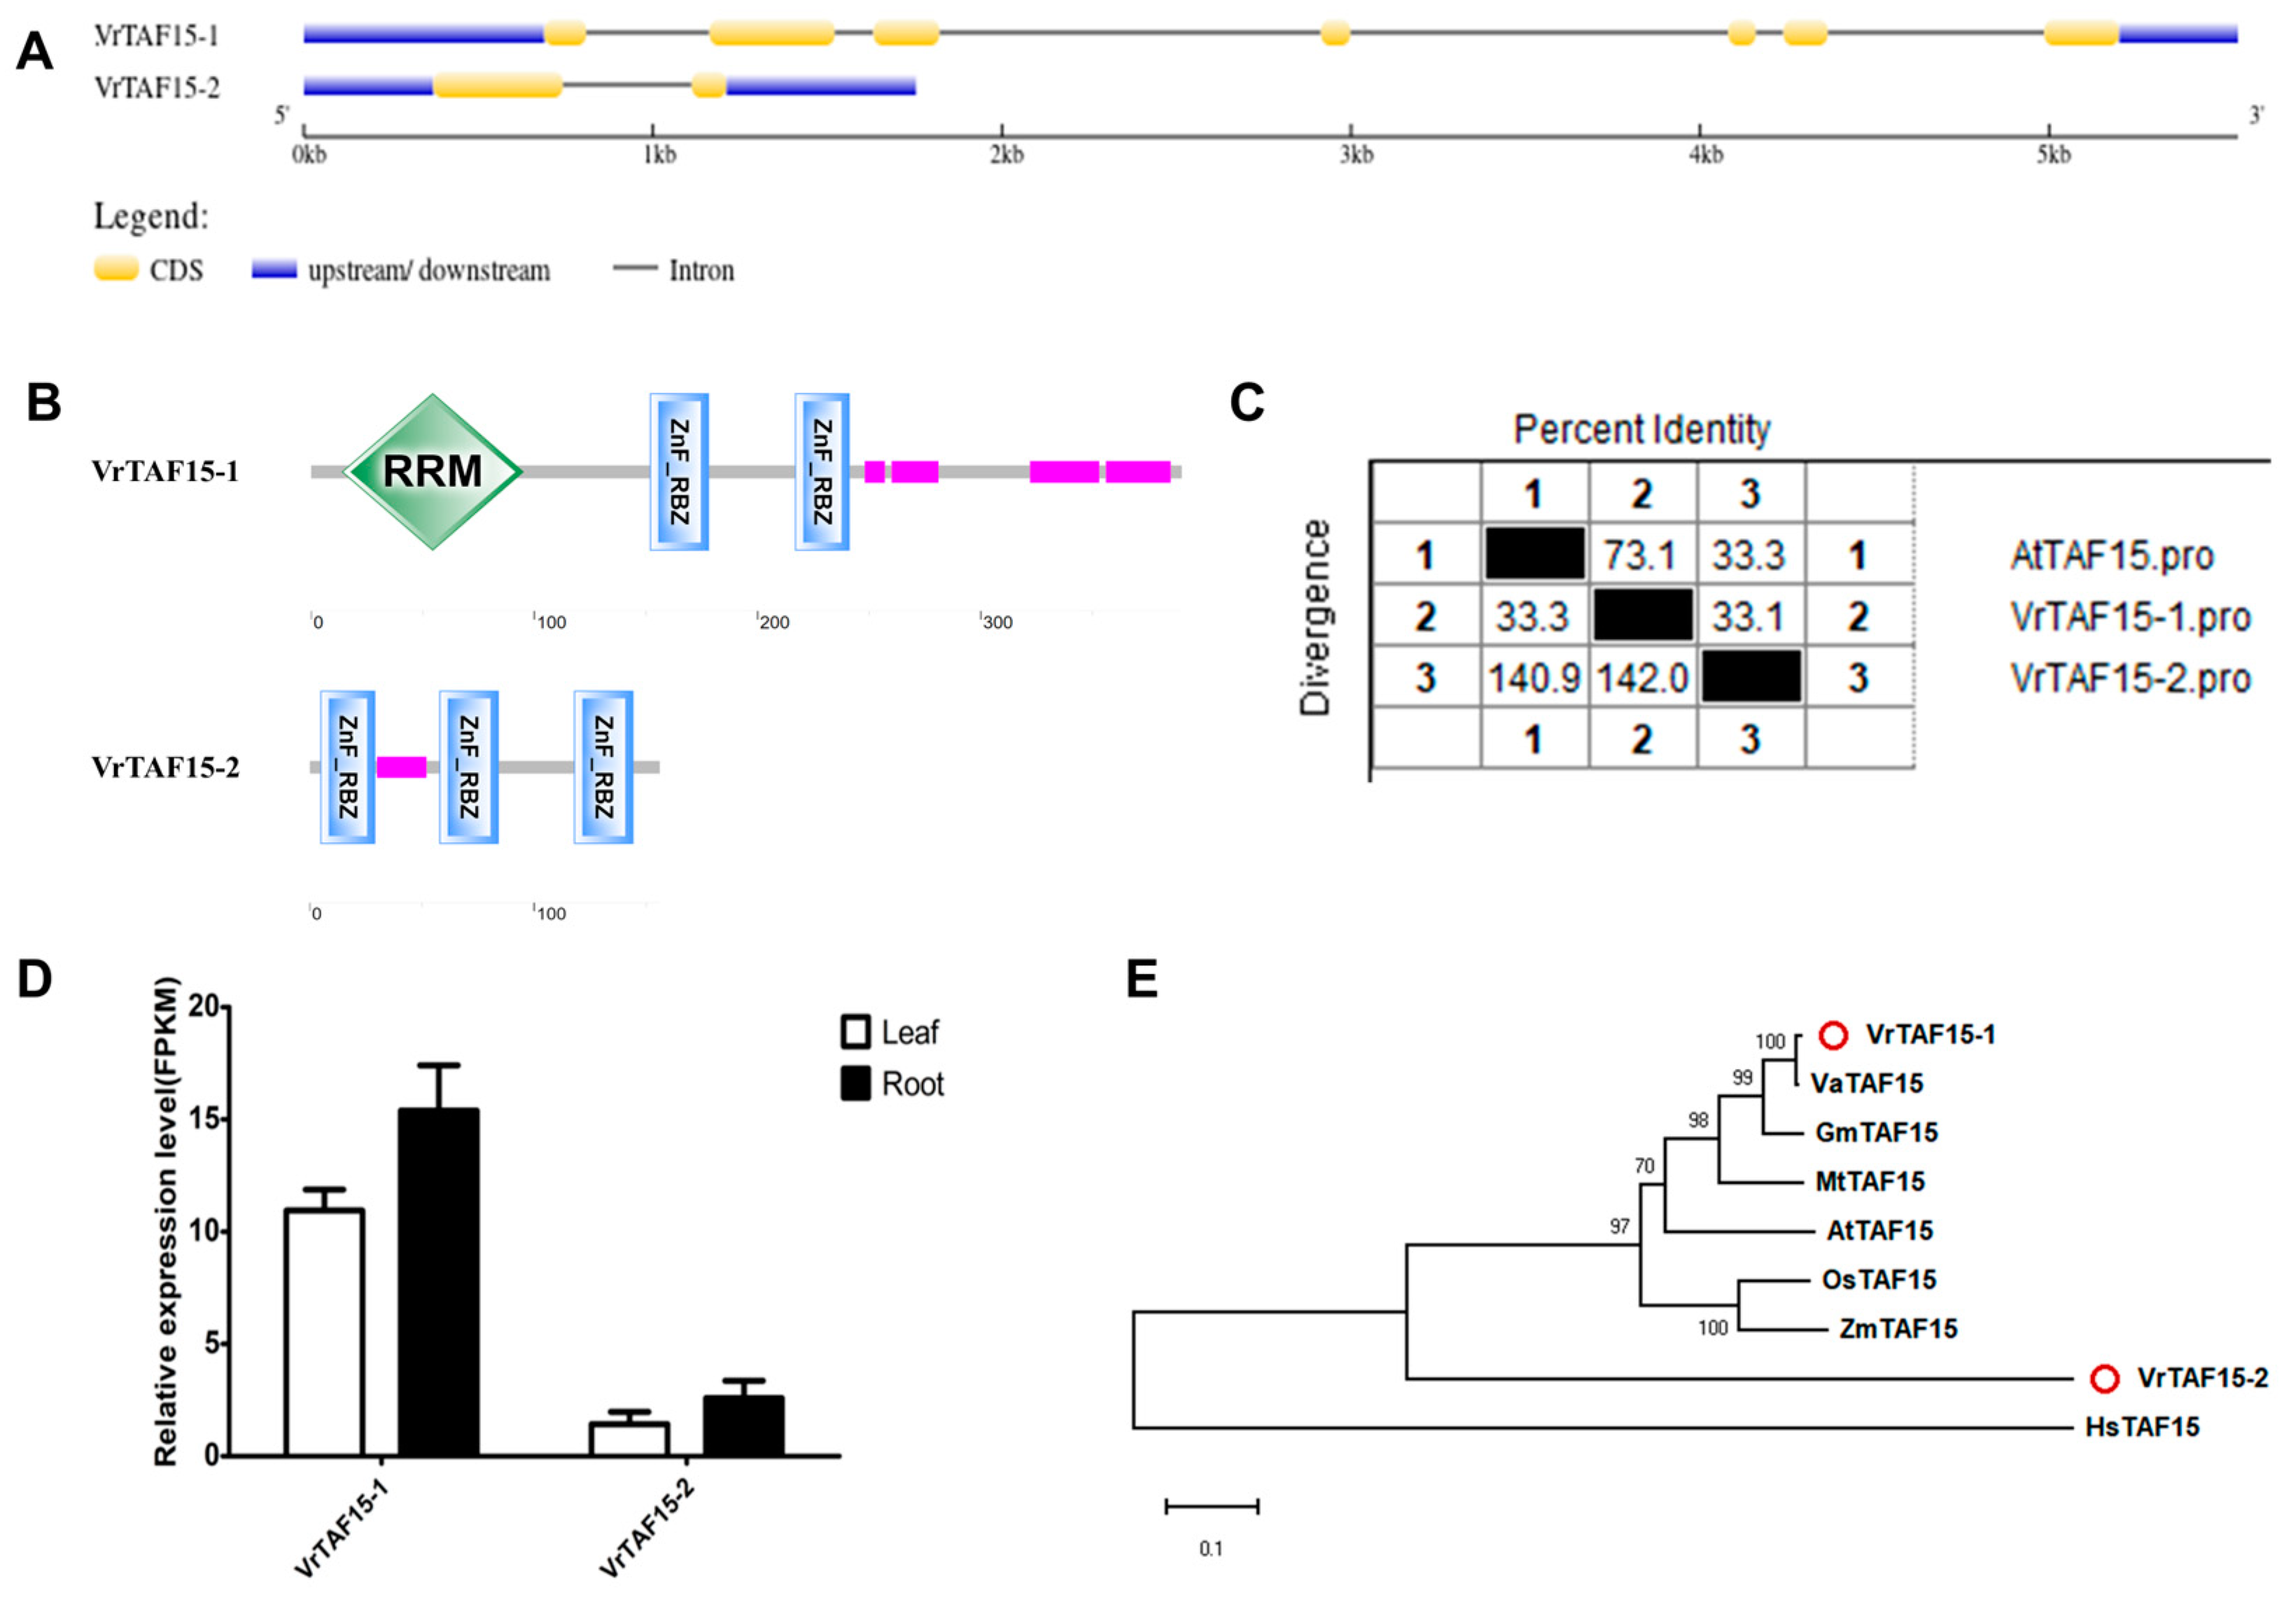
2.2.16. VrTAF15
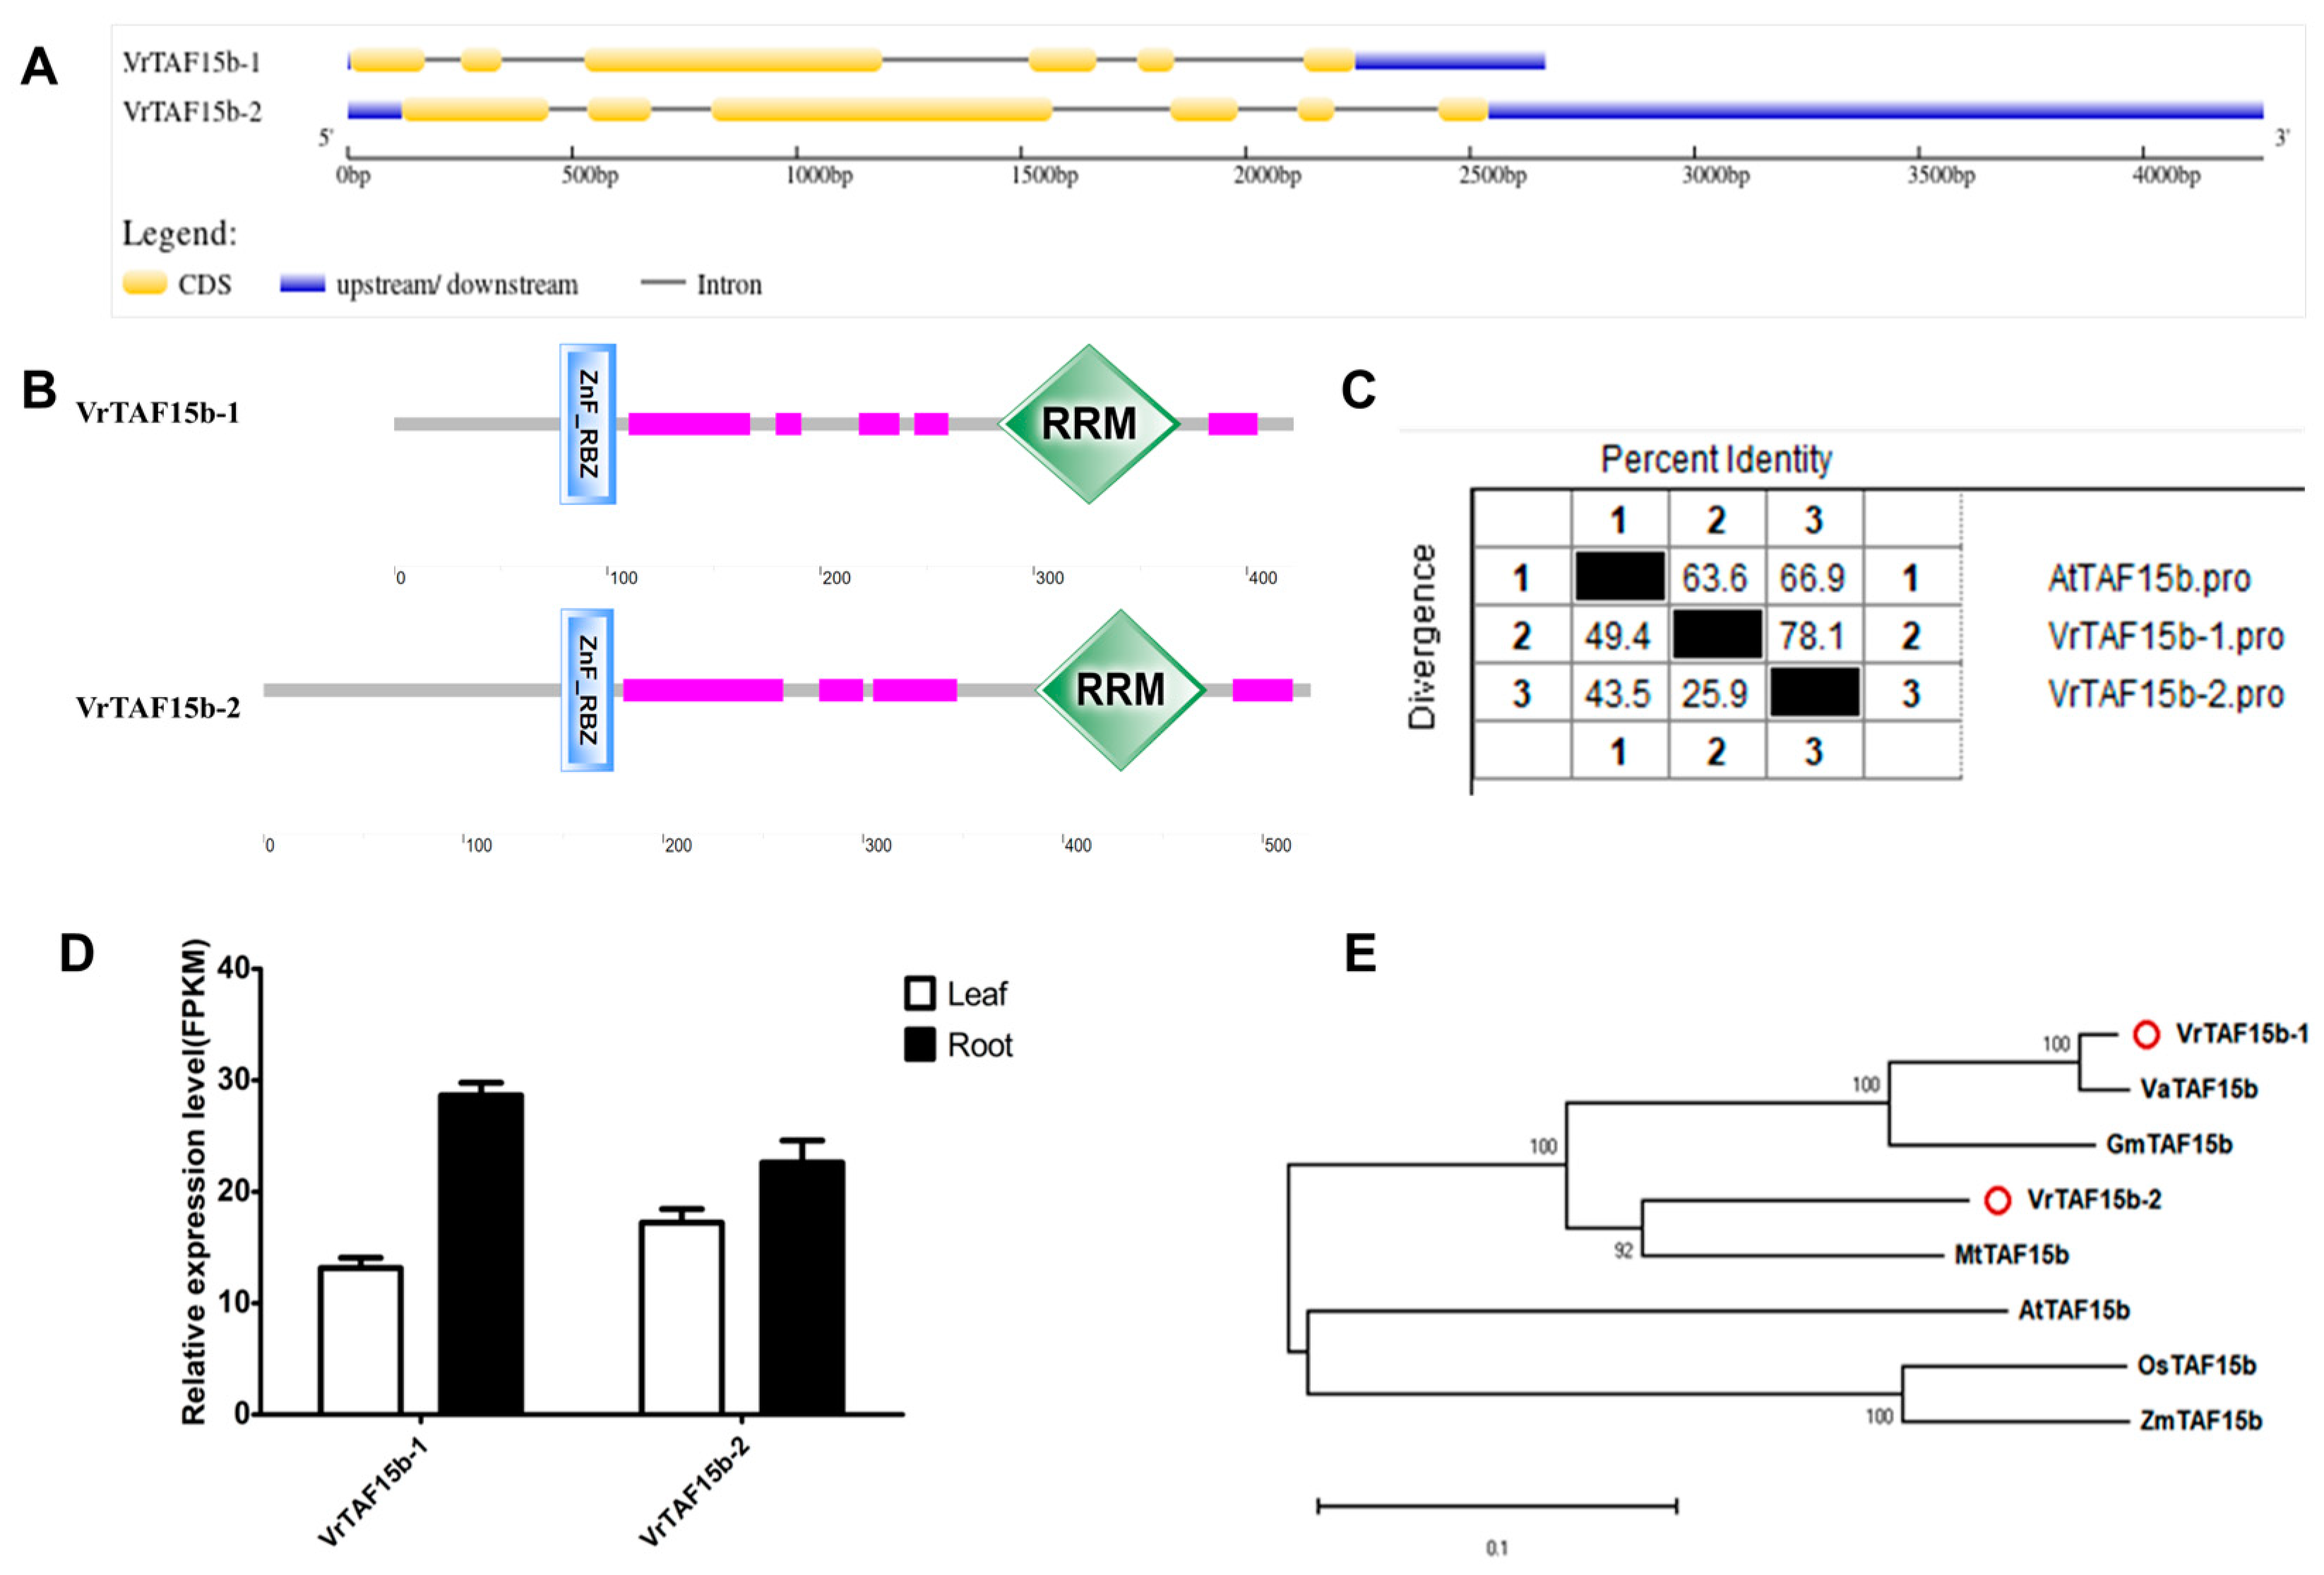
2.2.17. VrTAF15b
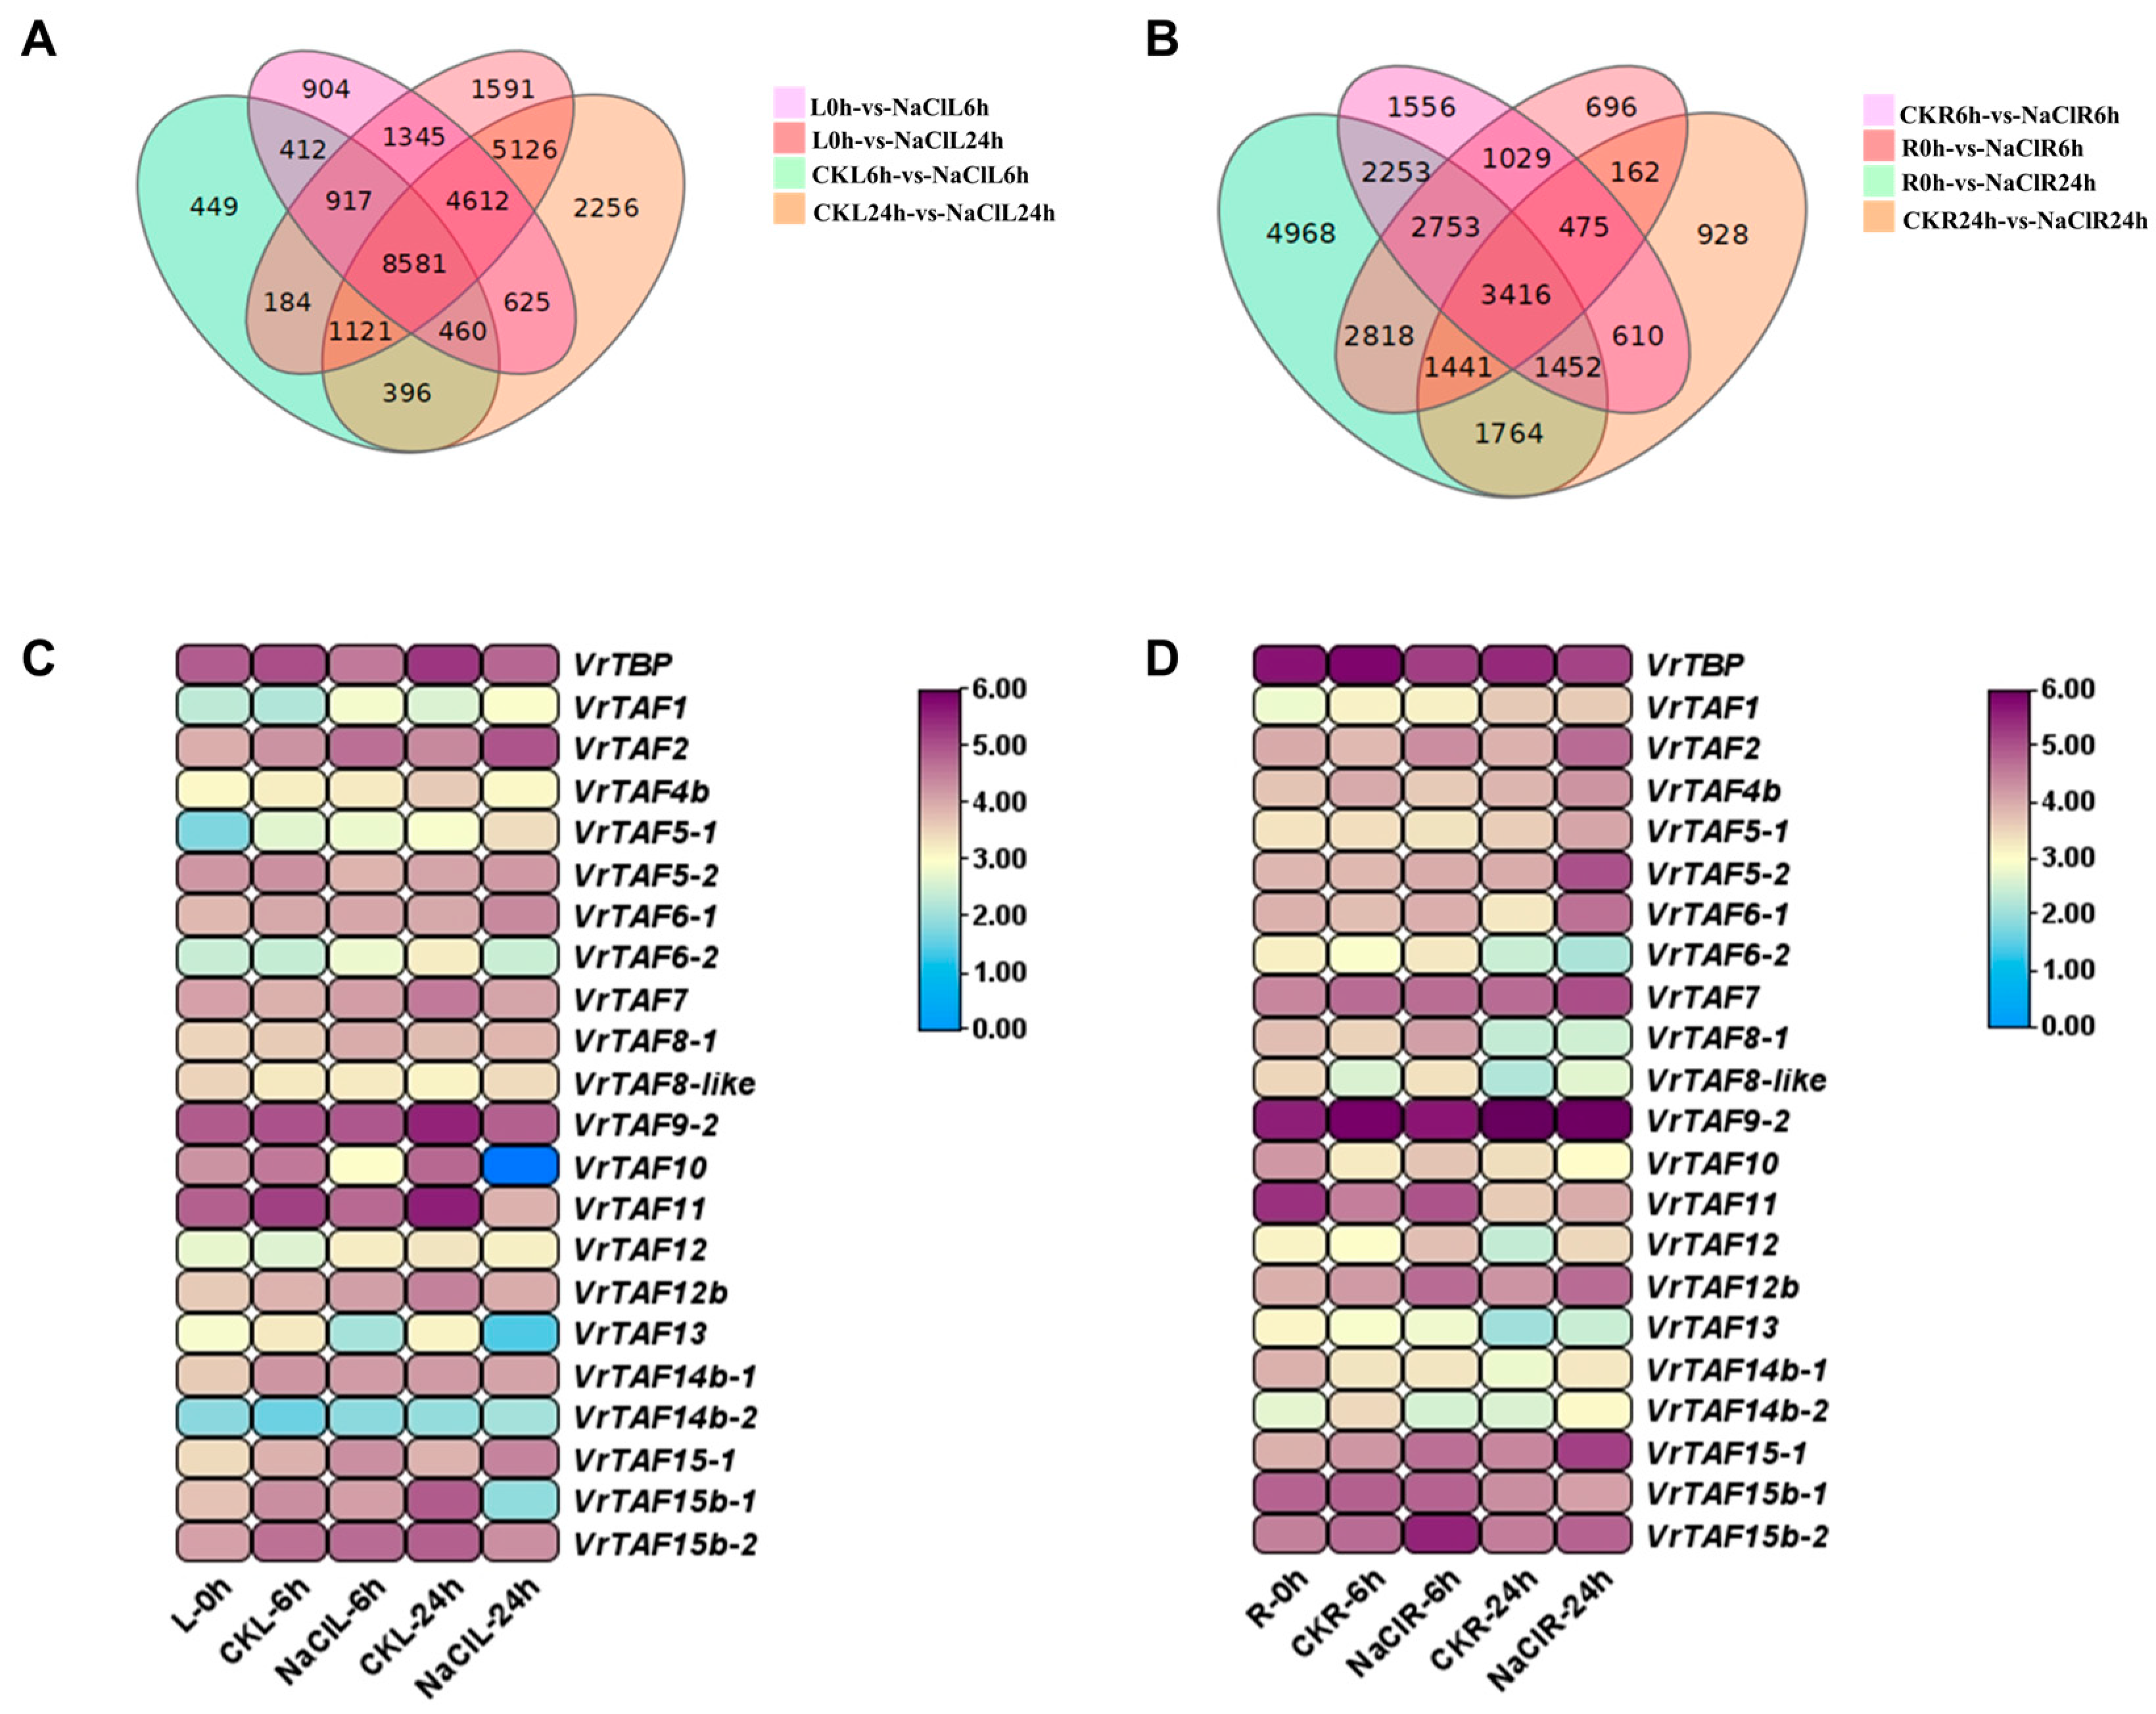
2.3. VrTBP and VrTAFs Expression in Response to Abiotic Stress Treatments
2.3.1. High-Salinity Stress
2.3.2. Water-Deficit Stress
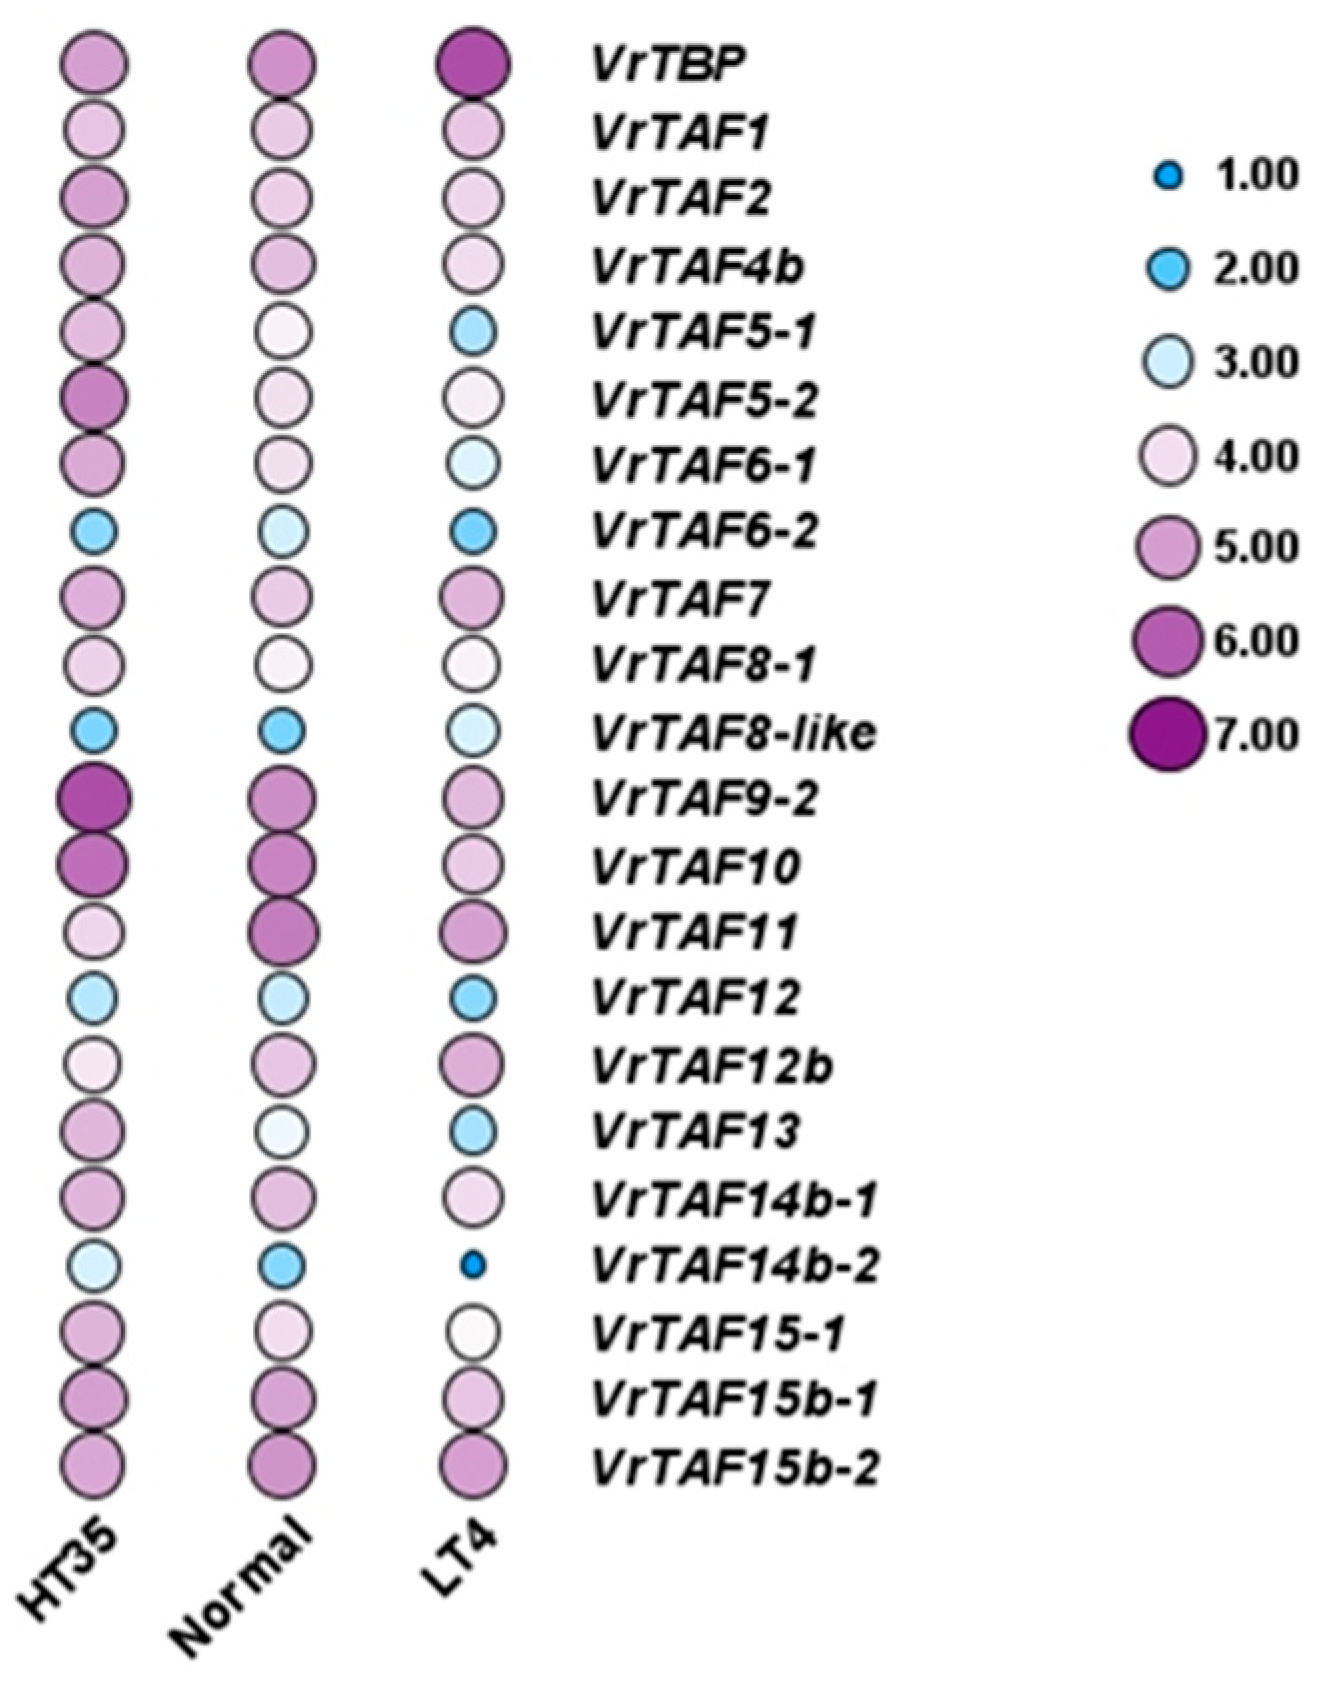
2.3.3. Heat and Cold Stress
3. Discussion
4. Materials and Methods
4.1. Identification, Structure, and Motif Analyses of VrTBP and VrTAFs
4.2. Phylogenetic Analysis of TBP and TAF Genes from Multi-Species
4.3. Plant Materials
4.4. High-Salinity Treatment
4.5. Water-Deficit Treatment
4.6. Heat and Cold Treatment
4.7. RNA-Seq, Data Statistical Analysis, and Visualization
5. Conclusions
Supplementary Materials
Author Contributions
Funding
Institutional Review Board Statement
Informed Consent Statement
Data Availability Statement
Acknowledgments
Conflicts of Interest
References
- Akhtar, W.; Veenstra, G.J. TBP-related factors: A paradigm of diversity in transcription initiation. Cell Biosci. 2011, 1, 23. [Google Scholar] [CrossRef] [PubMed]
- Roeder, R.G. 50+years of eukaryotic transcription: An expanding universe of factors and mechanisms. Nat. Struct. Mol. Biol. 2019, 26, 783–791. [Google Scholar] [CrossRef]
- Ravarani, C.N.J.; Flock, T.; Chavali, S.; Anandapadamanaban, M.; Babu, M.M.; Balaji, S. Molecular determinants underlying functional innovations of TBP and their impact on transcription initiation. Nat. Commun. 2020, 11, 2384. [Google Scholar] [CrossRef] [PubMed]
- Davidson, I. The genetics of TBP and TBP-related factors. Trends Biochem. Sci. 2003, 28, 391–398. [Google Scholar] [CrossRef] [PubMed]
- Albright, S.R.; Tjian, R. TAFs revisited: More data reveal new twists and confirm old ideas. Gene 2000, 242, 1–13. [Google Scholar] [CrossRef]
- Kramm, K.; Engel, C.; Grohmann, D. Transcription initiation factor TBP: Old friend new questions. Biochem. Soc. Trans. 2019, 47, 411–423. [Google Scholar] [CrossRef]
- Savinkova, L.K.; Sharypova, E.B.; Kolchanov, N.A. On the role of TATA boxes and TATA-binding protein in Arabidopsis thaliana. Plants 2023, 12, 1000. [Google Scholar] [CrossRef]
- Hahn, S. The role of TAFs in RNA polymerase II transcription. Cell 1998, 95, 579–582. [Google Scholar] [CrossRef] [PubMed]
- Louder, R.K.; He, Y.; Lopez-Blanco, J.R.; Fang, J.; Chacon, P.; Nogales, E. Structure of promoter-bound TFIID and model of human pre-initiation complex assembly. Nature 2016, 536, 604–609. [Google Scholar] [CrossRef]
- Patel, A.B.; Louder, R.K.; Greber, B.J.; Gruberg, S.; Luo, J.; Fang, J.; Liu, Y.T.; Banish, J.; Hahn, S.; Nogales, E. Structure of human TFIID and mechanism of TBP loading onto promoter DNA. Science 2018, 362, eaau8872. [Google Scholar] [CrossRef]
- Leurent, C.; Sanders, S.L.; Demeny, M.A.; Garbett, K.A.; Ruhlmann, C.; Weil, P.A.; Tora, L.; Schultz, P. Mapping key functional sites within yeast TFIID. Embo J. 2004, 23, 719–727. [Google Scholar] [CrossRef] [PubMed]
- Huisinga, K.L.; Pugh, B.F. A genome-wide housekeeping role for TFIID and a highly regulated stress-related role for SAGA in Saccharomyces cerevisiae. Mol. Cell 2004, 13, 573–585. [Google Scholar] [CrossRef] [PubMed]
- Timmers, H.T.M. SAGA and TFIID: Friends of TBP drifting apart. Biochim. Biophys. Acta Gene Regul. Mech. 2021, 1864, 194604. [Google Scholar] [CrossRef] [PubMed]
- Wang, H.B.; Dienemann, C.; Stutzer, A.; Urlaub, H.; Cheung, A.C.M.; Cramer, P. Structure of the transcription coactivator SAGA. Nature 2020, 577, 7792. [Google Scholar] [CrossRef] [PubMed]
- Moraga, F.; Aquea, F. Composition of the SAGA complex in plants and its role in controlling gene expression in response to abiotic stresses. Front. Plant Sci. 2015, 6, 865. [Google Scholar] [CrossRef]
- Mishal, R.; Luna-Arias, J.P. Role of the TATA-box binding protein (TBP) and associated family members in transcription regulation. Gene 2022, 833, 146581. [Google Scholar] [CrossRef]
- Levine, M. Paused RNA polymerase II as a developmental checkpoint. Cell 2011, 145, 502–511. [Google Scholar] [CrossRef]
- Zou, Y.Y.; Huang, W.; Gu, Z.L.; Gu, X. Predominant gain of promoter TATA box after gene duplication associated with stress responses. Mol. Biol. Evol. 2011, 28, 2893–2904. [Google Scholar] [CrossRef]
- Bhuiyan, T.; Timmers, H.T.M. Promoter recognition: Putting TFIID on the spot. Trends Cell Biol. 2019, 29, 752–763. [Google Scholar] [CrossRef]
- Basehoar, A.D.; Zanton, S.J.; Pugh, B.F. Identification and distinct regulation of yeast TATA box-containing genes. Cell 2004, 116, 699–709. [Google Scholar] [CrossRef]
- Luna-Arias, J.P.; Castro-Muñozledo, F. Participation of the TBP-associated factors (TAFs) in cell differentiation. J. Cell. Physiol. 2024, 239, e31167. [Google Scholar] [CrossRef]
- Ruppert, S.; Wang, E.H.; Tjian, R. Cloning and expression of human TAFII250: A TBP-associated factor implicated in cell-cycle regulation. Nature 1993, 362, 175–179. [Google Scholar] [CrossRef]
- Aoyagi, N.; Wassarman, D.A. Developmental and transcriptional consequences of mutations in Drosophila TAF(II)60. Mol. Cell Biol. 2001, 21, 6808–6819. [Google Scholar] [CrossRef] [PubMed]
- Georgieva, S.; Kirschner, D.B.; Jagla, T.; Nabirochkina, E.; Hanke, S.; Schenkel, H.; de Lorenzo, C.; Sinha, P.; Jagla, K.; Mechler, B.; et al. Two novel Drosophila TAF(II)s have homology with human TAF(II)30 and are differentially regulated during development. Mol. Cell. Biol. 2000, 20, 1639–1648. [Google Scholar] [CrossRef] [PubMed]
- Uffenbeck, S.R.; Krebs, J.E. The role of chromatin structure in regulating stress-induced transcription in Saccharomyces cerevisiae. Biochem. Cell Biol. 2006, 84, 477–489. [Google Scholar] [CrossRef] [PubMed]
- Kim, N.R.; Yang, J.; Kwon, H.; An, J.; Choi, W.; Kim, W. Mutations of the TATA-binding protein confer enhanced tolerance to hyperosmotic stress in Saccharomyces cerevisiae. Appl. Microbiol. Biotechnol. 2013, 97, 8227–8238. [Google Scholar] [CrossRef]
- Lago, C.; Clerici, E.; Mizzi, L.; Colombo, L.; Kater, M.M. TBP-associated factors in Arabidopsis. Gene 2004, 342, 231–241. [Google Scholar] [CrossRef]
- Gasch, A.; Hoffmann, A.; Horikoshi, M.; Roeder, R.G.; Chua, N.H. Arabidopsis thaliana contains two genes for TFIID. Nature 1990, 346, 390–394. [Google Scholar] [CrossRef]
- Mougiou, N.; Poulios, S.; Kaldis, A.; Vlachonasios, K.E. Arabidopsis thaliana TBP-associated factor 5 is essential for plant growth and development. Mol. Breed. 2012, 30, 355–366. [Google Scholar] [CrossRef]
- Gao, X.; Ren, F.; Lu, Y.T. The Arabidopsis mutant stg1 identifies a function for TBP-associated factor 10 in plant osmotic stress adaptation. Plant Cell Physiol. 2006, 47, 1285–1294. [Google Scholar] [CrossRef]
- Tamada, Y.; Nakamori, K.; Nakatani, H.; Matsuda, K.; Hata, S.; Furumoto, T.; Izui, K. Temporary expression of the TAF10 gene and its requirement for normal development of Arabidopsis thaliana. Plant Cell Physiol. 2007, 48, 134–146. [Google Scholar] [CrossRef] [PubMed]
- Robles, L.M.; Wampole, J.S.; Christians, M.J.; Larsen, P.B. Arabidopsis enhanced ethylene response 4 encodes an EIN3-interacting TFIID transcription factor required for proper ethylene response, including ERF1 induction. J. Exp. Bot. 2007, 58, 2627–2639. [Google Scholar] [CrossRef] [PubMed]
- Kubo, M.; Furuta, K.; Demura, T.; Fukuda, H.; Liu, Y.G.; Shibata, D.; Kakimoto, T. The CKH1/EER4 gene encoding a TAF12-Like protein negatively regulates cytokinin sensitivity in Arabidopsis thaliana. Plant Cell Physiol. 2011, 52, 629–637. [Google Scholar] [CrossRef] [PubMed]
- Kim, J.S.; Sakamoto, Y.; Takahashi, F.; Shibata, M.; Urano, K.; Matsunaga, S.; Yamaguchi-Shinozaki, K.; Shinozaki, K. Arabidopsis TBP-ASSOCIATED FACTOR 12 ortholog NOBIRO6 controls root elongation with unfolded protein response cofactor activity. Proc. Natl. Acad. Sci. USA 2022, 119, e2120219119. [Google Scholar] [CrossRef] [PubMed]
- Lindner, M.; Simonini, S.; Kooiker, M.; Gagliardini, V.; Somssich, M.; Hohenstatt, M.; Simon, R.; Grossniklaus, U.; Kater, M.M. TAF13 interacts with PRC2 members and is essential for Arabidopsis seed development. Dev. Biol. 2013, 379, 28–37. [Google Scholar] [CrossRef]
- Choi, K.; Kim, J.; Hwang, H.J.; Kim, S.; Park, C.; Kim, S.Y.; Lee, I. The FRIGIDA complex activates transcription of FLC, a strong flowering repressor in Arabidopsis, by recruiting chromatin modification factors. Plant Cell 2011, 23, 289–303. [Google Scholar] [CrossRef]
- Eom, H.; Park, S.J.; Kim, M.K.; Kim, H.; Kang, H.; Lee, I. TAF15b, involved in the autonomous pathway for flowering, represses transcription of FLOWERING LOCUS C. Plant J. 2018, 93, 79–91. [Google Scholar] [CrossRef]
- Dong, O.X.; Meteignier, L.V.; Plourde, M.B.; Ahmed, B.; Wang, M.; Jensen, C.; Jin, H.L.; Moffett, P.; Li, X.; Germain, H. Arabidopsis TAF15b localizes to RNA processing bodies and contributes to snc1-mediated autoimmunity. Mol. Plant-Microbe Interact. 2016, 29, 247–257. [Google Scholar] [CrossRef]
- Zhu, Q.; Ordiz, M.I.; Dabi, T.; Beachy, R.N.; Lamb, C. Rice TATA binding protein interacts functionally with transcription factor IIB and the RF2a bZIP transcriptional activator in an enhanced plant in vitro transcription system. Plant Cell 2002, 14, 795–803. [Google Scholar] [CrossRef]
- Zhang, Y.; Iqbal, M.F.; Wang, Y.L.; Qian, K.Y.; Xiang, J.X.; Xu, G.H.; Fan, X.R. OsTBP2.1, a TATA-binding protein, alters the ratio of OsNRT2.3b to OsNRT2.3a and improves rice grain yield. Int. J. Mol. Sci. 2022, 23, 10795. [Google Scholar] [CrossRef]
- Zhang, Y.; Zhao, L.; Xiao, H.; Chew, J.; Xiang, J.; Qian, K.; Fan, X. Knockdown of a novel gene OsTBP2.2 increases sensitivity to drought stress in rice. Genes 2020, 11, 629. [Google Scholar] [CrossRef] [PubMed]
- Zhang, L.; Wang, R.; Xing, Y.; Xu, Y.; Xiong, D.; Wang, Y.; Yao, S. Separable regulation of POW1 in grain size and leaf angle development in rice. Plant Biotechnol. J. 2021, 19, 2517–2531. [Google Scholar] [CrossRef] [PubMed]
- Jiang, L.; Jiang, N.; Hu, Z.; Sun, X.; Xiang, X.; Liu, Y.; Wu, M.; Liu, C.; Luo, X. TATA-box binding protein-associated factor 2 regulates grain size in rice. Crop J. 2022, 11, 438–446. [Google Scholar] [CrossRef]
- Parvathi, M.S.; Nataraja, K.N.; Reddy, Y.A.N.; Naika, M.B.N.; Gowda, M.V.C. Transcriptome analysis of finger millet (Eleusine coracana (L.) Gaertn.) reveals unique drought responsive genes. J. Genet. 2019, 98, 46. [Google Scholar] [CrossRef] [PubMed]
- Yundaeng, C.; Somta, P.; Chen, J.B.; Yuan, X.X.; Chankaew, S.; Chen, X. Fine mapping of QTL conferring Cercospora leaf spot disease resistance in mungbean revealed TAF5 as candidate gene for the resistance. Theor. Appl. Genet. 2021, 134, 701–714. [Google Scholar] [CrossRef]
- Lambrides, C.J.; Godwin, I.D. Mungbean. In Pulses, Sugar and Tuber Crops. Genome Mapping & Molecular Breeding in Plants; Kole, C., Ed.; Springer: Berlin/Heidelberg, Germany, 2007; pp. 69–90. [Google Scholar]
- Wu, R.R.; Zhang, Q.X.; Lin, Y.; Chen, J.B.; Somta, P.; Yan, Q.; Xue, C.C.; Liu, J.Y.; Chen, X.; Yuan, X.X. Marker-assisted backcross breeding for improving bruchid (Callosobruchus spp.) resistance in mung bean (Vigna radiata L.). Agronomy 2022, 12, 1271. [Google Scholar] [CrossRef]
- Pratap, A.; Gupta, S.; Rathore, M.; Basavaraja, T.; Singh, C.M.; Prajapati, U.; Singh, P.; Singh, Y.; Kumari, G. Mungbean. In The Beans and the Peas: From Orphan to Mainstream Crops; Pratap, A., Gupta, S., Eds.; Charlotte Cockle: Cambridge, UK, 2021; pp. 1–32. [Google Scholar]
- Wu, C.J.; Liu, Z.Z.; Wei, L.; Zhou, J.X.; Cai, X.W.; Su, Y.N.; Li, L.; Chen, S.; He, X.J. Three functionally redundant plant-specific paralogs are core subunits of the SAGA histone acetyltransferase complex in Arabidopsis. Mol. Plant 2021, 14, 1071–1087. [Google Scholar] [CrossRef]
- Hoffmann, A.; Sinn, E.; Yamamoto, T.; Wang, J.; Roy, A.; Horikoshi, M.; Roeder, R.G. Highly conserved core domain and unique N-terminus with presumptive regulatory motifs in a Human TATA Factor (TFIID). Nature 1990, 346, 387–390. [Google Scholar] [CrossRef]
- Vogel, J.M.; Roth, B.; Cigan, M.; Freeling, M. Expression of the two maize TATA binding protein genes and function of the encoded TBP proteins by complementation in yeast. Plant Cell 1993, 5, 1627–1638. [Google Scholar]
- Davidson, I.; Kobi, D.; Fadloun, A.; Mengus, G. New insights into TAFs as regulators of cell cycle and signaling pathways. Cell Cycle 2005, 4, 1486–1490. [Google Scholar] [CrossRef]
- Waterworth, W.M.; Drury, G.E.; Blundell-Hunter, G.; West, C.E. Arabidopsis TAF1 is an MRE11-interacting protein required for resistance to genotoxic stress and viability of the male gametophyte. Plant J. 2015, 84, 545–557. [Google Scholar] [CrossRef]
- Benhamed, M.; Bertrand, C.; Servet, C.; Zhou, D.X. Arabidopsis GCN5, HD1, and TAF1/HAF2 interact to regulate histone acetylation required for light-responsive gene expression. Plant Cell 2006, 18, 2893–2903. [Google Scholar] [CrossRef] [PubMed]
- Bertrand, C.; Benhamed, M.; Li, Y.F.; Ayadi, M.; Lemonnier, G.; Renou, J.P.; Delarue, M.; Zhou, D.X. Arabidopsis HAF2 gene encoding TATA-binding protein (TBP)-associated factor TAF1, is required to integrate light signals to regulate gene expression and growth. J. Biol. Chem. 2005, 280, 1465–1473. [Google Scholar] [CrossRef]
- Lawrence, E.J.; Gao, H.; Tock, A.J.; Lambing, C.; Blackwell, A.R.; Feng, X.; Henderson, I.R. Natural variation in TBP-ASSOCIATED FACTOR 4b controls meiotic crossover and germline transcription in Arabidopsis. Curr. Biol. 2019, 29, 2676–2686. [Google Scholar] [CrossRef]
- Lago, C.; Clerici, E.; Dreni, L.; Horlow, C.; Caporali, E.; Colombo, L.; Kater, M.M. The Arabidopsis TFIID factor AtTAF6 controls pollen tube growth. Dev. Biol. 2005, 285, 91–100. [Google Scholar] [CrossRef] [PubMed]
- Avendano-Borromeo, B.; Narayanasamy, R.K.; Garcia-Rivera, G.; Labra-Barrios, M.L.; Lagunes-Guillen, A.E.; Munguia-Chavez, B.; Castanon-Sanchez, C.A.; Orozco, E.; Luna-Arias, J.P. Identification of the gene encoding the TATA box-binding protein-associated factor 1 (TAF1) and its putative role in the heat shock response in the protozoan parasite Entamoeba histolytica. Parasitol. Res. 2019, 118, 517–538. [Google Scholar] [CrossRef] [PubMed]
- Parvathi, M.; Nataraja, K.N. Discovery of stress responsive TATA-box binding protein associated Factor6 (TAF6) from finger millet (Eleusine coracana (L.) Gaertn). J. Plant Biol. 2017, 60, 335–342. [Google Scholar] [CrossRef]
- Ben-Shem, A.; Papai, G.; Schultz, P. Architecture of the multi-functional SAGA complex and the molecular mechanism of holding TBP. FEBS J. 2021, 288, 3135–3147. [Google Scholar] [CrossRef] [PubMed]
- Nagy, Z.; Riss, A.; Romier, C.; le Guezennec, X.; Dongre, A.R.; Orpinell, M.; Han, J.; Stunnenberg, H.; Tora, L. The human SPT20-containing SAGA complex plays a direct role in the regulation of endoplasmic reticulum stress-induced genes. Mol. Cell. Biol. 2009, 29, 1649–1660. [Google Scholar] [CrossRef]
- Imran, M.; Shafiq, S.; Farooq, M.A.; Naeem, M.K.; Widemann, E.; Bakhsh, A.; Jensen, K.B.; Wang, R.R.C. Comparative genome-wide analysis and expression profiling of histone acetyltransferase (HAT) gene family in response to hormonal applications, metal and abiotic stresses in Cotton. Int. J. Mol. Sci. 2019, 20, 5311. [Google Scholar] [CrossRef]
- Ogata, Y.; Kimura, N.; Sano, R. Gcorn Plant: A database for retrieving functional and evolutionary traits of plant genes. Plant Physiol. 2019, 180, 732–742. [Google Scholar] [CrossRef] [PubMed]
- Kang, Y.J.; Kim, S.K.; Kim, M.Y.; Lestari, P.; Kim, K.H.; Ha, B.K.; Jun, T.H.; Hwang, W.J.; Lee, T.; Lee, J.; et al. Genome sequence of mungbean and insights into evolution within Vigna species. Nat. Commun. 2014, 5, 5543. [Google Scholar] [CrossRef] [PubMed]
- Chen, C.; Wu, Y.; Li, J.; Wang, X.; Zeng, Z.; Xu, J.; Liu, Y.; Feng, J.; Chen, H.; He, Y. TBtools-II: A “one for all, all for one” bioinformatics platform for biological big-data mining. Mol. Plant 2023, 16, 1733–1742. [Google Scholar] [CrossRef] [PubMed]


| Name | Gene | Locus ID | NCBI Protein | NCBI mRNA | Location | Length (aa) | pI | M.W. (kDa) | Predicted Cell Localizations |
|---|---|---|---|---|---|---|---|---|---|
| VrTBP | Vradi0305s00090.1 | LOC106754936 | XP_014492490.1 | XM_014637004.2 | NW_014543812.1 (24061..29626, complement) | 200 | 9.68 | 22.38 | Nucleus |
| VrTAF1 | Vradi11g07970.1 | LOC106777544 | X1:XP_014520632.1 X2:XP_014520633.1 X3:XP_014520634.1 X4:XP_022631751.1 | X1:XM_014665146.2 X2:XM_014665147.2 X3:XM_014665148.2 X4:XM_022776030.1 | Chr 11, NC_028361.1 (8353773..8377433) | 1901 1767 1752 1746 | 5.62 6.40 6.98 6.90 | 215.26 200.48 198.72 197.99 | Nucleus |
| VrTAF2 | Vradi07g18120.1 | LOC106768217 | X1:XP_014508704.1 X2:XP_022639382.1 X3:XP_022639383.1 | X1:XM_014653218.2 X2:XM_022783661.1 X3:XM_022783662.1 | Chr 7, NC_028357.1 (39566756..39586448) | 1384 1354 939 | 6.23 6.41 6.26 | 156.59 153.22 106.88 | Nucleus |
| VrTAF4b | Vradi06g14750.1 | LOC106764661 | X1:XP_014504463.1 X2:XP_014504464.1 X3:XP_014504465.1 X4:XP_014504466.1 X5:XP_014504467.1 X6:XP_014504469.1 X7:XP_022638246.1 | X1:XM_014648977.2 X2:XM_014648978.2 X3:XM_014648979.2 X4:XM_014648980.2 X5:XM_014648981.2 X6:XM_014648983.2 X7:XM_022782525.1 | Chr 6, NC_028356.1 (34643049..34655243) | 936 936 936 936 932 845 845 | 8.38 8.38 8.38 8.38 8.38 9.39 9.39 | 101.74 101.74 101.74 101.74 101.33 92.01 92.01 | Nucleus |
| VrTAF5–1 | Vradi06g13500.1 | LOC106765332 | X1:XP_022638193.1 X2:XP_014505399.1 | X1:XM_022782472.1 X2:XM_014649913.2 | Chr 6, NC_028356.1 (32613390..32624024, complement) | 659 658 | 6.37 6.37 | 72.96 72.82 | Nucleus |
| VrTAF5–2 | Vradi05g10920.1 | LOC106762344 | XP_014501696.1 | XM_014646210.2 | Chr 5, NC_028355.1 (19815499..19824598, complement) | 671 | 6.30 | 74.27 | Nucleus |
| VrTAF6–1 | Vradi04g10770.1 | LOC106758550 | XP_014496955.1 | XM_014641469.2 | Chr 4, NC_028354.1 (19764236..19770172) | 543 | 6.30 | 60.42 | Nucleus |
| VrTAF6–2 | Vradi10g02250.1 | LOC106775101 | XP_014517632.1 | XM_014662146.2 | Chr 10, NC_028360.1 (6707871..6712998) | 536 | 7.31 | 59.80 | Nucleus |
| VrTAF6–like | / | LOC111240733 | XP_022632040.1 | XM_022776319.1 | NW_014541992.1 (22204..24055) | 192 | 5.49 | 21.37 | Nucleus |
| VrTAF7 | Vradi06g12480.1 | LOC106763916 | (1)XP_014503580.1 (2)XP_022638147.1 | (1)XM_014648094.2 (2)XM_022782426.1 | Chr 6, NC_028356.1 (30127567..30130853) | 199 | 4.60 | 22.22 | Nucleus |
| VrTAF8–1 | Vradi04g09290.1 | LOC106759260 | XP_022635899.1 | XM_022780178.1 | Chr 4, NC_028354.1 (18214406..18217173) | 406 | 5.55 | 44.92 | Nucleus |
| VrTAF8–2 | Vradi06g06010.1 | LOC106764373 | XP_014504145.1 | XM_014648659.2 | Chr 6, NC_028356.1 (7592855..7594847, complement) | 290 | 9.22 | 32.59 | Nucleus |
| VrTAF8–like | Vradi08g07170.1 | LOC106769930 | XP_014511223.1 | XM_014655737.2 | Chr 8, NC_028358.1 (18416509..18418289, complement) | 350 | 5.97 | 38.49 | Nucleus |
| VrTAF9–1 | Vradi06g02960.1 | LOC106764413 | X1:XP_014504185.1 X2:XP_014504186.1 | X1:XM_014648699.2 X2:XM_014648700.2 | Chr 6, NC_028356.1 (3016606..3019713, complement) | 189 175 | 4.49 4.48 | 21.32 19.68 | Nucleus |
| VrTAF9–2 | Vradi07g24390.1 | LOC106767081 | XP_014507387.1 | XM_014651901.2 | Chr 7, NC_028357.1 (47737783..47740700, complement) | 177 | 5.08 | 20.20 | Nucleus |
| VrTAF10 | Vradi04g11480.1 | LOC106758746 | (1)XP_014497210.1 (2)XP_014497209.1 | (1)XM_014641724.2 (2)XM_014641723.2 | Chr 4, NC_028354.1 (20649254..20652967, complement) | 136 | 5.16 | 15.26 | Nucleus |
| VrTAF11 | Vradi09g05150.1 | LOC106773625 | XP_014515833.1 | XM_014660347.2 | Chr 9, NC_028359.1 (7507755..7510113) | 204 | 7.04 | 23.07 | Nucleus |
| VrTAF12 | Vradi08g05550.1 | LOC106772695 | (1)XP_014514733.1 (2)XP_014514734.1 (3)XP_022640289.1 | (1)XM_014659247.2 (2)XM_014659248.2 (3)XM_022784568.1 | Chr 8, NC_028358.1 (12062609..12070416) | 504 | 10.12 | 53.02 | Nucleus |
| VrTAF12b | Vradi09g02430.1 | LOC106774141 | XP_014516496.2 | XM_014661010.2 | Chr 9, NC_028359.1 (2520168..2532650) | 1064 | 8.58 | 116.82 | Nucleus |
| VrTAF13 | Vradi08g10630.1 | LOC106770840 | (1)XP_014512148.1 (2)XP_022640670.1 (3)XP_022640669.1 (4)XP_014512151.1 (5)XP_014512149.1 (6)XP_014512150.1 | (1)XM_014656662.2 (2)XM_022784949.1 (3)XM_022784948.1 (4)XM_014656665.2 (5)XM_014656663.2 (6)XM_014656664.2 | Chr8, NC_028358.1 (28680758..28685336, complement) | 136 | 5.31 | 15.32 | Nucleus |
| VrTAF14b–1 | Vradi11g06360.1 | LOC106777003 | XP_022631586.1 | XM_022775865.1 | Chr11, NC_028361.1 (6305127..6307465) | 279 | 6.07 | 31.27 | Chloroplast, Nucleus |
| VrTAF14b–2 | Vradi0393s00050.1 | LOC106780520 | XP_014524308.1 | XM_014668822.2 | NW_014542625.1 (46546..49945) | 273 | 7.17 | 30.73 | Nucleus |
| VrTAF15–1 | Vradi02g02560.1 | LOC106777580 | XP_014520706.1 | XM_014665220.2 | Chr2, NC_028352.1 (2396952..2402492, complement) | 390 | 8.28 | 43.21 | Nucleus |
| VrTAF15–2 | Vradi05g09940.1 | LOC106760812 | XP_014499728.1 | XM_014644242.2 | Chr5, NC_028355.1 (18244440..18246193) | 156 | 8.78 | 17.08 | Nucleus |
| VrTAF15b–1 | Vradi0153s00320.1 | LOC106752587 | XP_014489787.1 | XM_014634301.2 | NW_014542917.1 (751087..753754, complement) | 422 | 9.00 | 43.30 | Chloroplast |
| VrTAF15b–2 | Vradi0158s00270.1 | LOC106752498 | XP_022632845.1 | XM_022777124.1 | NW_014542914.1 (178992..183259) | 524 | 8.92 | 51.08 | Nucleus |
Disclaimer/Publisher’s Note: The statements, opinions and data contained in all publications are solely those of the individual author(s) and contributor(s) and not of MDPI and/or the editor(s). MDPI and/or the editor(s) disclaim responsibility for any injury to people or property resulting from any ideas, methods, instructions or products referred to in the content. |
© 2024 by the authors. Licensee MDPI, Basel, Switzerland. This article is an open access article distributed under the terms and conditions of the Creative Commons Attribution (CC BY) license (https://creativecommons.org/licenses/by/4.0/).
Share and Cite
Wu, R.; Jia, Q.; Guo, Y.; Lin, Y.; Liu, J.; Chen, J.; Yan, Q.; Yuan, N.; Xue, C.; Chen, X.; et al. Characterization of TBP and TAFs in Mungbean (Vigna radiata L.) and Their Potential Involvement in Abiotic Stress Response. Int. J. Mol. Sci. 2024, 25, 9558. https://doi.org/10.3390/ijms25179558
Wu R, Jia Q, Guo Y, Lin Y, Liu J, Chen J, Yan Q, Yuan N, Xue C, Chen X, et al. Characterization of TBP and TAFs in Mungbean (Vigna radiata L.) and Their Potential Involvement in Abiotic Stress Response. International Journal of Molecular Sciences. 2024; 25(17):9558. https://doi.org/10.3390/ijms25179558
Chicago/Turabian StyleWu, Ranran, Qiyuan Jia, Yingjian Guo, Yun Lin, Jinyang Liu, Jingbin Chen, Qiang Yan, Na Yuan, Chenchen Xue, Xin Chen, and et al. 2024. "Characterization of TBP and TAFs in Mungbean (Vigna radiata L.) and Their Potential Involvement in Abiotic Stress Response" International Journal of Molecular Sciences 25, no. 17: 9558. https://doi.org/10.3390/ijms25179558