Article

Identification of SNPs and Candidate Genes Associated with Monocyte/Lymphocyte Ratio and Neutrophil/Lymphocyte Ratio in Duroc × Erhualian F2 Population

1
Key Lab of Agricultural Animal Genetics, Breeding, and Reproduction of Ministry of Education, Huazhong Agricultural University, Wuhan 430070, China
2
The Cooperative Innovation Center for Sustainable Pig Production, Huazhong Agricultural University, Wuhan 430070, China
*
Author to whom correspondence should be addressed.
Int. J. Mol. Sci. 2024, 25(17), 9745; https://doi.org/10.3390/ijms25179745
Submission received: 22 July 2024 / Revised: 6 September 2024 / Accepted: 8 September 2024 / Published: 9 September 2024
(This article belongs to the Section Molecular Immunology)

Abstract

:
Understanding the pig immune function is crucial for disease-resistant breeding and potentially for human health research due to shared immune system features. Immune cell ratios, like monocyte/lymphocyte ratio (MLR) and neutrophil/lymphocyte ratio (NLR), offer a more comprehensive view of immune status compared to individual cell counts. However, research on pig immune cell ratios remains limited. This study investigated MLR and NLR in a Duroc × Erhualian F2 resource population. Heritability analysis revealed high values (0.649 and 0.688 for MLR and NLR, respectively), suggesting a strong genetic component. Furthermore, we employed an ensemble-like GWAS (E-GWAS) strategy and functional annotation analysis to identify 11 MLR-associated and 6 NLR-associated candidate genes. These genes were significantly enriched in immune-related biological processes. These findings provide novel genetic markers and candidate genes associated with porcine immunity, thereby providing valuable insights for addressing biosecurity and animal welfare concerns in the pig industry.

1. Introduction

The immune system, a complex network of immune organs, immune cells, and immune molecules, plays a crucial role in executing immune responses and maintaining the stability of the body’s internal environment and physiological equilibrium [1,2]. Within this system, immune cells, commonly referred to as leukocytes, serve as key players in various immunological processes [3]. These cells, including lymphocyte, monocyte, granulocyte, and other cellular components, form the cellular foundation of the immune response [4]. Immune cell parameters can serve as an immunological index for livestock, reflecting their health status [5].
The pig industry faces urgent challenges related to biosafety and animal welfare caused by various infectious diseases [6,7]. Investigating immune-cell traits in pigs contributes significantly to genetic improvements in health and immune traits, thereby promoting biological safety prevention and control and enhancing disease-resistant breeding [8]. Additionally, due to their remarkable anatomical and immunological similarities to humans, pigs are widely used as animal models in human disease research [9]. Studying immune-cell traits in pigs can therefore contribute to our understanding of human diseases.
The immune response relies on the coordinated action of various immune cells. Immune cells ratios, emerging biomarkers in recent years, can combine the immune response of various immune cells. Recent research suggests that ratios of these immune cells, rather than individual immune cell counts, offer a more comprehensive view of the immune system’s health [10,11,12,13,14]. Among these emerging biomarkers, the monocyte/lymphocyte ratio (MLR) and neutrophil/lymphocyte ratio (NLR) can capture the synergistic interplay between innate and adaptive immunity [15,16,17]. Monocytes and neutrophils are integral components of the second line of defense against pathogen invasion, playing a pivotal role in the innate immune response. Neutrophils possess the ability to phagocytize pathogens, and their chemotaxis can reflect the state of the innate immune system [18]. Monocytes possess robust phagocytic capabilities and are capable of stimulating lymphocytes and other immune cells [19]. Additionally, the involvement of lymphocytes in the immune system’s third line of defense is characterized by their ability to specifically recognize pathogens and actively participate in both cellular and humoral immune responses [20]. Therefore, the MLR and NLR can offer a more precise assessment of the overall immune system status compared to individual cell counts. Analyzing the MLR and NLR provides a more nuanced understanding of the immune system by capturing the balance between different cell types, potentially revealing subtle changes that might be missed by examining individual cell counts alone.
Genome-wide association study (GWAS) has been extensively employed in the analysis of complex traits to identify associations between molecular markers and traits [21,22]. Past GWAS success in analyzing immune traits demonstrates its potential for elucidating the genetic architecture underlying immune traits [23,24,25,26,27]. A series of GWAS models were developed based on various genetic or statistical hypotheses [28,29,30,31]. However, given the diversity in the genetic architecture of complex traits, no single GWAS model is universally applicable. Combining multiple models has become an increasingly utilized approach to analyzing complex traits [32,33,34,35].
Previous studies have identified numerous quantitative trait loci (QTL) associated with immune-cell traits in pigs (https://www.animalgenome.org/cgi-bin/QTLdb, accessed on 20 May 2024). For example, 111 QTL on chromosomes 4, 6, 12, 13, and 17 have been linked to the neutrophil count. Similarly, approximately 39 QTL have been associated with the monocyte count, and around 112 QTL with the lymphocyte count. However, research on the genetic associations of the MLR and NLR in pigs remains limited. This limitation greatly hinders our understanding of the genetic mechanism underlying immune cells in pigs.
To comprehensively understand the porcine immune response, this study conducted a GWAS analysis on two immune cell-derived traits (MLR and NLR) in a Duroc × Erhualian F2 resource population. Finally, we identified potential single-nucleotide polymorphisms (SNPs) and candidate genes associated with these immune cell ratios. This research will facilitate the genetic improvement of immune traits in pigs and offer useful information for disease-resistant breeding within the pig industry.

2. Results

2.1. MLR and NLR of Duroc × Erhualian F2 Resource Population Exhibited High Heritability

The genetic variance, residual variance, and heritability of the NLR and MLR were estimated. All estimated genetic parameters are presented in Table 1. Our analysis revealed high heritability for both MLR and NLR traits in the Duroc × Erhualian F2 resource population. The heritability estimates were 0.649 for the MLR and 0.688 for the NLR.

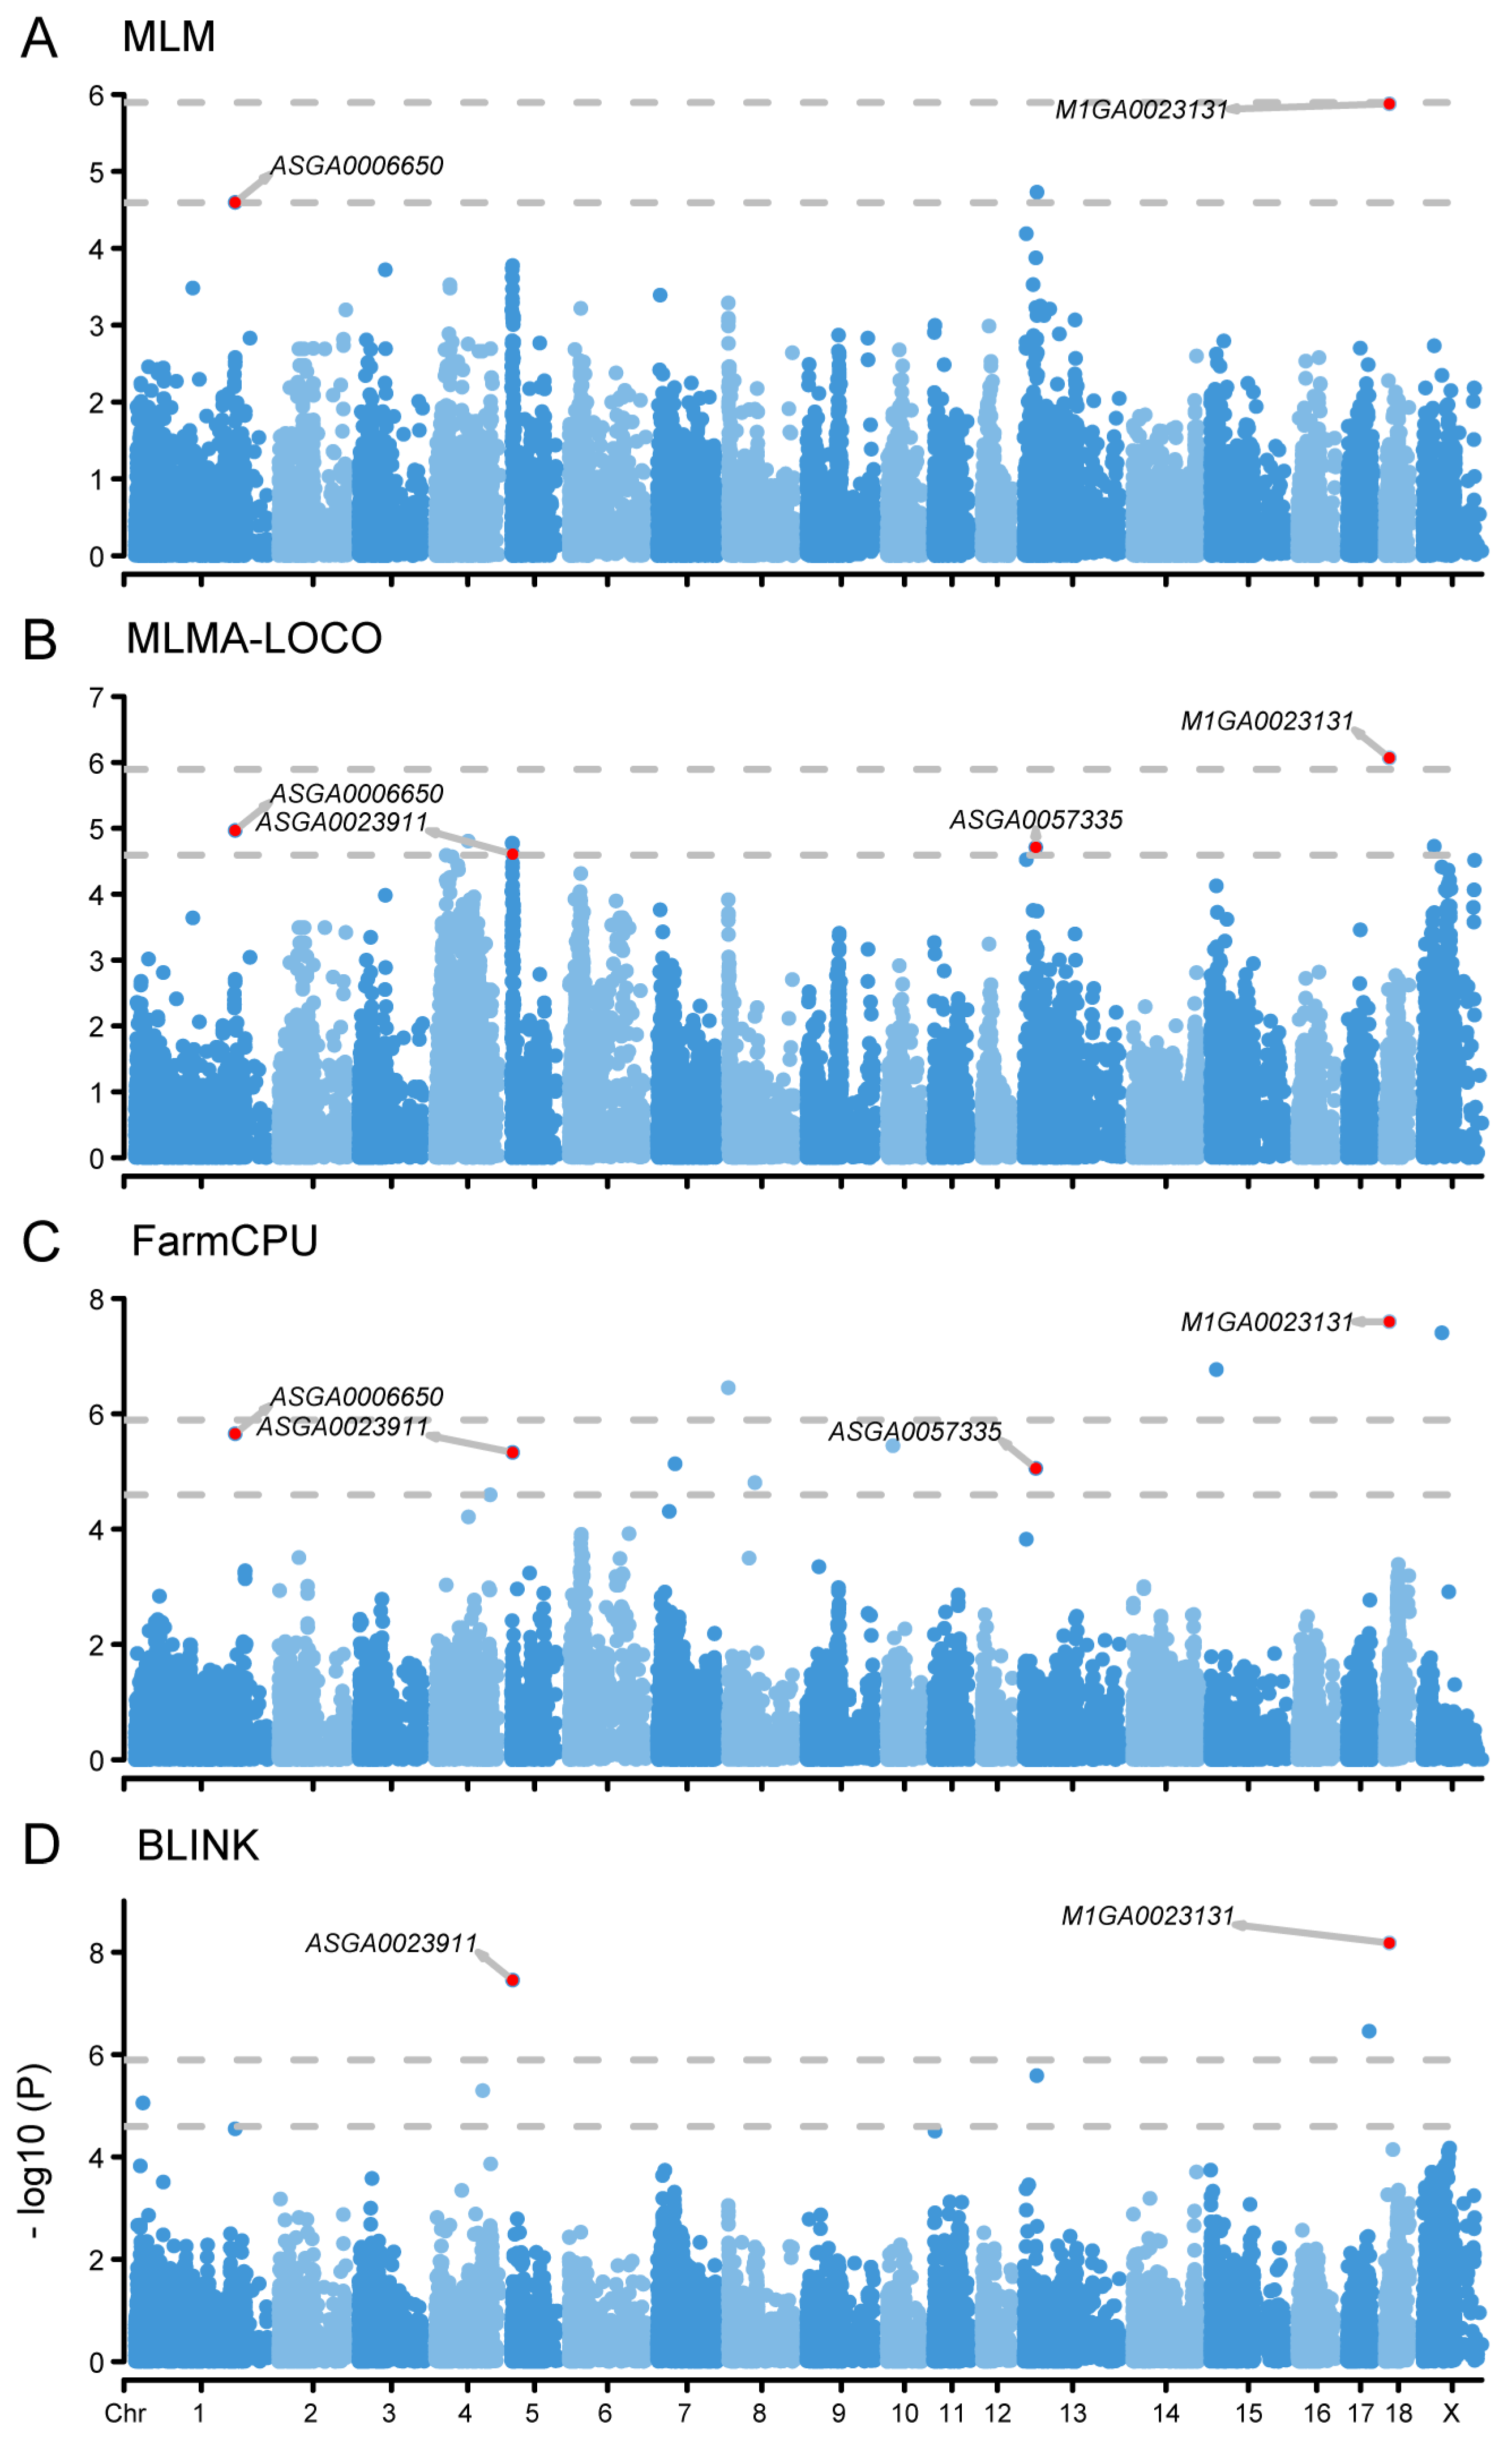
2.2. GWAS Analysis Identified Five SNPs Associated with MLR Trait

The E-GWAS analysis identified five genome-wide SNPs associated with the MLR trait (Figure 1, Table 2). The genetic marker H3GA0032308, located on chromosome 11, exceeded the significance threshold in both FarmCPU and BLINK models. Based on the gene annotation information from the Sus scrofa genome, we identified the SLIT and NTRK like family member 1 (SLITRK1) gene located close to the SNP (Table S1). The SNPs INRA0058297 on chromosome 2 and DRGA001794 on chromosome 12 surpassed the significance threshold in the BLINK model and exceeded the suggestive threshold in the MLMA-LOCO model. Notably, the DRGA001794 falls within the range of the QTL that has been reported to exhibit significant association with the trait of the monocyte count (https://www.animalgenome.org/cgi-bin/QTLdb). Further, we identified 26 and 8 genes based on the two SNPs, respectively (Table S1). INRA0058297 on chromosome 14 was determined using FarmCPU and MLMA-LOCO models, and two genes, cell division cycle associated 2 (CDCA2) and EBF transcription factor 2 (EBF2), were identified in the Sus scrofa genome (Table S1). CDCA2 is located approximately 5kb upstream of the SNP, while EBF2 is located about 246kb downstream of the SNP. We also identified ASGA0022554 on chromosome 4 using the MLM and MLMA-LOCO models, but no genes were found within a 500kb range upstream and downstream of this SNP.

2.3. GWAS Analysis Identified Four SNPs Associated with NLR Trait

The E-GWAS analysis for the NLR trait identified four associated SNPs located on chromosomes 1, 5, 13, and 18 (Figure 2, Table 3). The SNP M1GA0023131, located on chromosome 18, exhibited a significant association with the trait across all four models. The genetic variant ASGA0023911 on chromosome 5 surpassed the threshold in the BLINK model and exceeded the suggestive threshold in both MLMA-LOCO and FarmCPU models. Based on the suggestive threshold, two SNPs, ASGA0006650 and ASGA0057335, were also detected to be associated with the NLR trait. Among these, ASGA0006650 was detected in the MLM, MLMA-LOCO, and FarmCPU models, and ASGA0057335 was detected in MLMA-LOCO and FarmCPU. Within a 500kb range upstream and downstream of these four SNPs, we further identified 3, 5, 3, and 8 genes, respectively (Table S2).

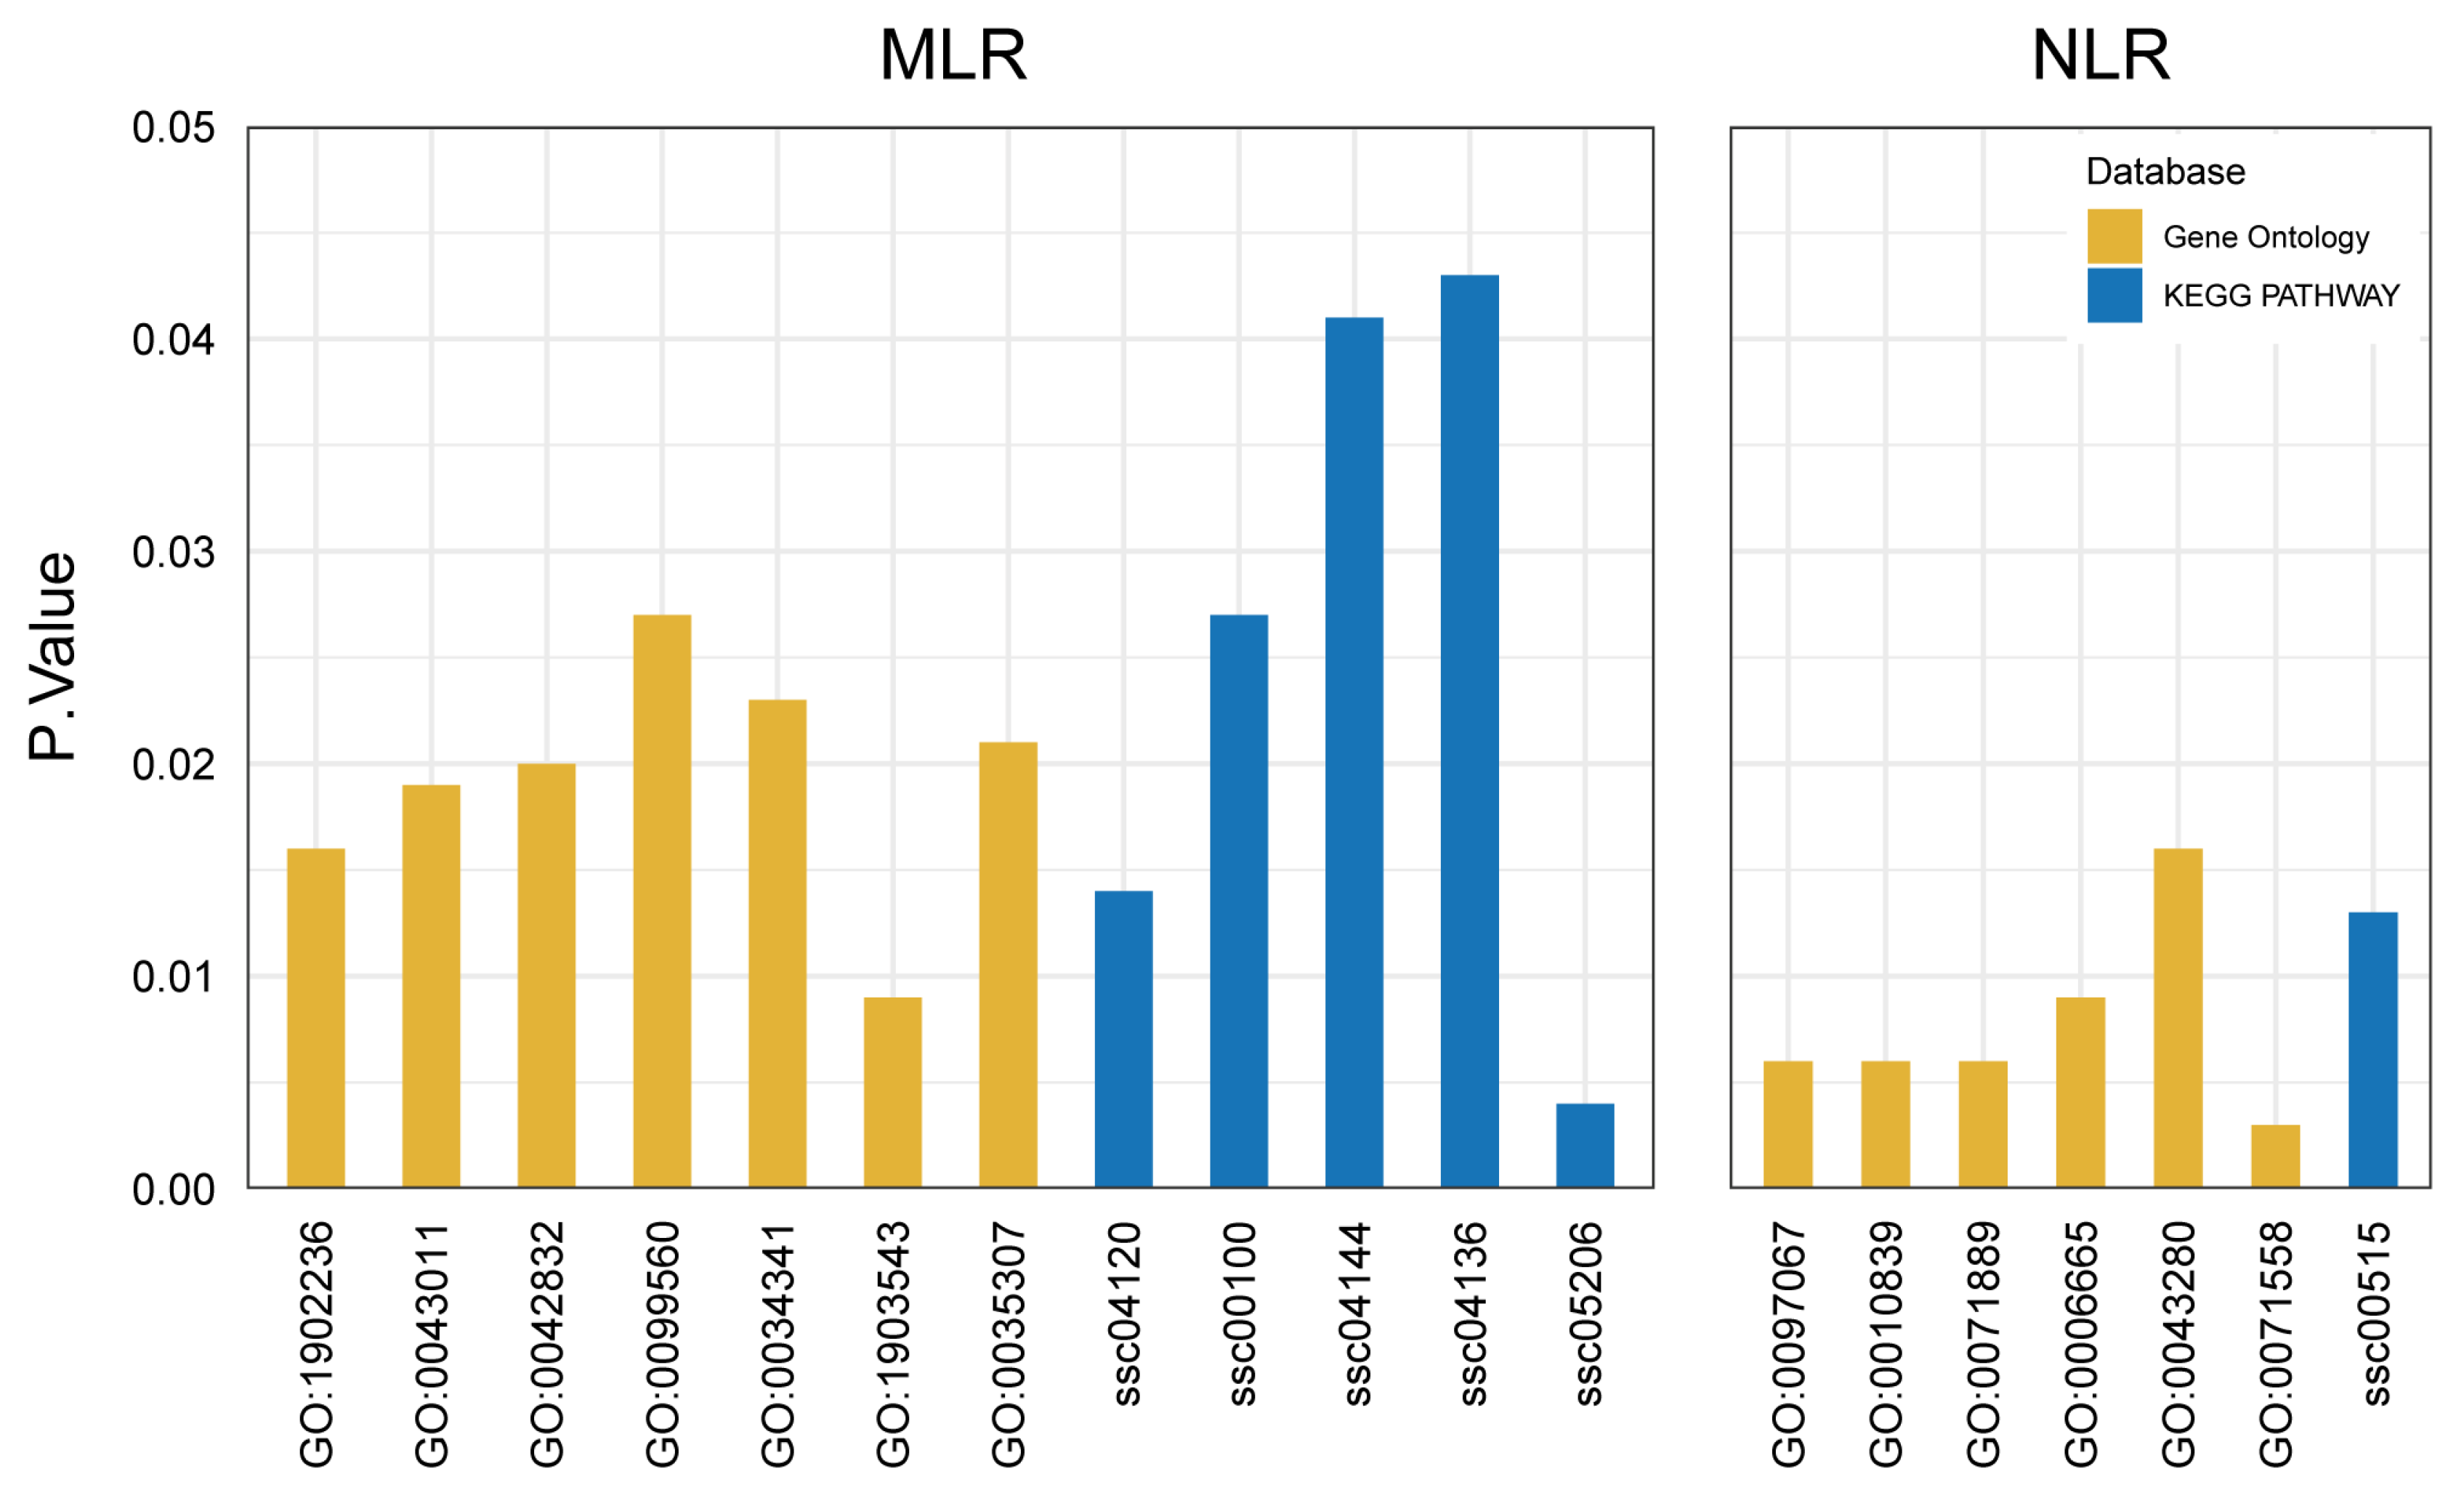
2.4. Functional Enrichment Analysis Identified Multiple Candidate Genes for MLR and NLR

GO and KEGG enrichment analyses were performed on 37 MLR-related genes and 19 NLR-related genes (Table S3). The results revealed the involvement of multiple genes in immune-related biological processes, including the defense response to protozoan, the response to interferon-gamma, MicroRNAs in cancer, the sphingolipid metabolic process, autophagy and endocytosis (Figure 3, Table S3). We further consulted relevant PubMed literature (https://pubmed.ncbi.nlm.nih.gov/, accessed on 25 May 2024) and identified 11 and 6 candidate genes related to MLR and NLR traits, respectively (Table 4).

3. Discussion

The maintenance of porcine health relies on the coordinated action of multiple immune cells. While numerous GWAS analyses have been conducted to identify QTL associated with individual immune-cell traits in pigs [36,37,38,39], our study focuses on the ratios between different immune cell types. These ratios, specifically the MLR and NLR, provide a more comprehensive view of the immune response by combining the actions of distinct immune cells [10,11,12]. Applying E-GWAS to the Duroc × Erhualian F2 resource population, we successfully identified 5 SNPs associated with the MLR and 4 SNPs associated with the NLR.
Most immune-cell traits are heritable. Research has shown that most immune-cell traits in pigs exhibit moderate to high heritability, with estimates ranging from 0.4 to 0.8 [40,41,42]. Our study corroborates and extends these findings, revealing high heritability for both MLR and NLR traits in the Duroc × Erhualian F2 resource population. These results provide robust evidence for the significant genetic influence on the MLR and NLR, reinforcing the potential for genetic improvement of these traits through selective breeding.
The present study successfully identified a total of 11 candidate genes associated with the MLR. Notably, IGF2BP1 (insulin-like growth factor 2 mRNA binding protein 1), MIR192 (microRNA mir-192), and CACD5 (cell division cycle associated 5) are significantly enriched in the KEGG pathway of MicroRNAs in cancer. Among them, IGF2BP1 has been reported to modulate both innate and adaptive immune responses [43]. Similarly, the MIR192 gene, a crucial component of exosomes, regulates gene expression and mediates the host’s antiviral immune response [44]. A study has demonstrated that exosomes from simulated infected newborn piglets can inhibit porcine epidemic diarrhea virus infection [45]. Additionally, silencing the CDCA5 gene has been shown to inhibit the AKT signaling pathway, activating the pro-apoptotic signaling pathway and revealing CDCA5’s functional role in hepatocellular carcinoma [46]. SYVN1 (synoviolin 1) is significantly enriched in the ubiquitin-mediated proteolysis pathway, and defects in this system are linked to various diseases [47]. An analysis of miRNA expression profiles in lawsonia intracellularis-infected porcine intestines revealed an upregulation of SYVN1 [48]. TM7SF2 (transmembrane 7 superfamily member 2) on chromosome 4 is involved in steroid biosynthesis, with steroids known to have immunosuppressive effects [49,50]. SLITRK1 (SLIT and NTRK like family member 1) function changes may be implicated in neuropsychiatric disorders [51]. ATG2A (autophagy-related 2A) is significantly enriched in the biological process of autophagy, an essential pathway for immune balance [52]. The CALCOCO2 (calcium binding and coiled-coil domain 2) gene responds to interferon-gamma and regulates pro-apoptotic and autophagy-related genes [53]. The SNF8 (SNF8 subunit of ESCRT-II) participates in interferon-mediated antiviral responses [54,55]. CDCA2 (cell division cycle associated 2), a member of cell cycle-related proteins, regulates cell proliferation and is involved in the development of various cancers [56,57,58]. Lastly, BATF2 (basic leucine zipper ATF-like transcription factor 2) plays a crucial role in the innate immune response and defense against protozoan infections [59].
Our NLR analysis identified six potential candidate genes, each with distinct roles in immune-related processes. Among these genes, the POMGNT2 (protein O-linked mannose N-acetylglucosaminyltransferase 2 (beta 1, 4-)) gene is involved in the biosynthesis of Mannose type O-glycans which can participate in hematopoiesis and inflammatory responses [60,61]. It was identified as a candidate gene for a significantly reduced total number born by a separate study on lethal recessive mutations in pigs [62]. The KDM7A (lysine demethylase 7A) gene functions in post-translational modification and has been linked to cancer development and inflammatory responses [63,64]. The TBC1D22A (TBC1 domain family member 22A) gene interacts with 14-3-3 proteins, which play a crucial role in various neurological diseases [51]. The KLF9 (KLF transcription factor 9) gene is significantly enriched in the biological processes of the cellular response to thyroid hormone stimulus and negative regulation of keratinocyte proliferation. The thyroid hormone is believed to maintain immune cell activity and function [65,66,67]. Additionally, keratinocytes contribute significantly to innate immune responses [68]. The GRAMD4 (GRAM domain containing 4) gene positively regulates cysteine-type endopeptidase activity in the apoptotic process. Lastly, CERK (ceramide kinase) is involved in the sphingolipid metabolic process, and the regulatory mechanisms of key sphingolipids affect various biological processes such as inflammation, cellular proliferation, and apoptosis [69,70].
While our findings provide valuable insights for the investigation of immune responses in pigs as well as genetic diseases relevant to humans, they also highlight the need for further study. Most of the identified genes, though known to be involved in immune regulation, require additional functional characterization to elucidate their precise mechanisms of action in both porcine and human contexts. Future studies focusing on the functional validation of these genes will provide a comprehensive and robust explanation for this statistical analysis, further enhancing our understanding of immune mechanisms in both pigs and humans.

4. Materials and Methods

4.1. Animals

The study used an F2 resource population (393 pigs) resulting from crossbreeding Duroc and Erhualian [8]. A total of 8 Duroc boars were crossed with 18 Erhualien sows, and subsequently, 31 boars and 38 sows from the F1 generation were selected for mating to obtain the F2 population. All animals were raised at the experimental facility operated by a prominent breeding company. The ear or tail tissues of the F2 hybrids were collected.

4.2. Phenotype

It has been demonstrated that 7-week-old pigs possess a fully developed immune system, rendering them suitable as an animal model for immunological investigations [71]. In this study, blood samples (1 mL) were collected from the jugular vein of the piglets using vacuum tubes containing EDTA-K2 at the age of 35 days. Subsequently, blood parameters were measured using a photoelectric MEK-8222K fully automatic five-category blood cell analyzer (Nihon Kohden, Tokyo, Japan) at the People’s Hospital of Xinxing County, Yunfu, Guangdong, China [8]. The MLR and NLR were computed based on three blood parameters, namely the monocyte count, lymphocyte count, and neutrophil count, for subsequent analysis.

4.3. Genotype

The DNA samples were extracted from ear or tail tissues (336 pigs), followed by genotyping using an iScan system (Illumina Inc., San Diego, CA, USA) with PorcineSNP60 BeadChips, resulting in a total of 62,163 SNPs. SNPs with a missing rate higher than 0.05 underwent quality control using Plink (v1.9) [72], while the remaining genotypes were imputed using Beagle (v5.4) [73]. After imputation, SNPs with a minor allele frequency (MAF) < 0.01 were excluded [72]. Following genotype data processing, a total of 39,292 SNPs were used for analysis.

4.4. Estimation of Genetic Variance and Heritability

The genetic variance and heritability were estimated through restricted maximum likelihood (REML) analysis with GCTA software (v1.94.1) [29]. The model of estimating variance can be written as:
y = X b + Z u + e
where y is the vector of trait (including MLR and NLR); b is the fixed effects; u denotes the additive genetic effect, with a normal distribution u ~ N ( 0 , G σ u 2 ) ; X and Z are respective incidence matrices for the fixed effect and additive genetic effect, respectively; e is the residual error following a normal distribution e ~ N ( 0 , I σ e 2 ) , where I indicates the identity matrix. Heritability ( h 2 ) was estimated using the formula: h 2 = σ u 2 / σ y 2 , where σ u 2 and σ y 2 represent the additive genetic variance and phenotypic variance, respectively.

4.5. Genome-Wide Association Study

E-GWAS can efficiently integrate diverse GWAS models to yield more robust and dependable outcomes [74]. In the analysis, the mixed-effect linear model (MLM) [28], MLM leaving-one-chromosome-out (MLMA-LOCO) [29], fixed and random model circulating probability unification (FarmCPU) [30], and Bayesian-information and linkage-disequilibrium iteratively nested keyway (BLINK) [31] models were integrated by the E-GWAS strategy to conduct genome-wide association studies (GWASs).
The MLM model controls false positives by stratifying groups as a fixed effect and using the individual relationship matrix as a random effect [28]. The MLM model was implemented using GCTA software, with the following formula:
y = X b + S d + Z u + e
where y is the phenotype, b is the fixed effects; d is the additive effect of the candidate SNP to be tested for association; u is the additive genetic effect, with a normal distribution u ~ N ( 0 , G σ u 2 ) , the G was calculated using all SNPs; X and Z are respective incidence matrices for b and u; S is the genotype indicator variable of the candidate SNP to be tested, coded as 0, 1, or 2; Z is the incidence matrices for u; e is the residual error following a normal distribution e ~ N ( 0 , I σ e 2 ) , where I indicates the identity matrix.
The MLMA-LOCO model builds upon the MLM by excluding the influence of SNPs on the chromosome where the candidate SNP is located, further improving accuracy [29]. The MLMA-LOCO model was performed using GCTA software, with the following formula:
y = X b + S d + Z u + e
where y, b, d, e, X, S, and Z are the same as those in the MLM model; u is the additive genetic effect, with the assumption that u ~ N ( 0 , G σ u 2 ) ; the G was calculated using all SNPs except those on the chromosome where the candidate SNP is located; the σ u 2 will be re-estimated each time when a chromosome is excluded from the G calculation.
The FarmCPU model improves SNP detection by dividing the MLM into a separate fixed-effects model (FEM) and random-effects model (REM), and iteratively utilizing both models [30]. The FarmCPU model was implemented using the rMVP (v1.0.6) package [75].
The FEM was calculated based on the following formula:
y = X b + M p + S d + e
where y, b, d, e, X, and S are the same as those in the MLM model; M is the genotype matrix of pseudo-SNPs that are used as fixed effects; p is the relevant design matrix for M.
The REM was employed to select the most suitable pseudo-SNPs, as follows:
y = g + e
where y and e are the same as those in the FEM; g is the additive genetic effect, with a normal distribution g ~ N ( 0 , K σ g 2 ) , the K was calculated using pseudo-SNPs.
The BLINK model replaces the REM in FarmCPU with the FEM based on Bayesian information criteria, and substitutes the bin method of FarmCPU with linkage disequilibrium information, significantly reducing the computational time while improving the statistical power [31]. The BLINK model was built using the BLINK (v1.0.6) package, with the following formula:
The first FEM :   y = M p + S d + e
The second FEM :   y = M p + e
where y, p, d, e, M, and S are the same as those in the FarmCPU model. The two FEM models have two differences: firstly, the second FEM excludes the testing marker in the first FEM; secondly, the number of covariate pseudo QTNs varies in the second FEM to select an optimal set of k out of t pseudo QTNs.
A Bonferroni correction was applied to establish the threshold for significance [76]. To avoid overlooking potential linkage signals, the genome-wide levels of significance and suggestiveness thresholds were defined as p = 0.05/N and p = 1/N, respectively, where N represents the number of SNPs.

4.6. Identification and Functional Analysis of Candidate Genes

The biomaRt (v2.58.2) package [77,78] was employed to identify genes associated with the MLR and NLR within a 500 kb region upstream and downstream of identified SNPs by GWAS. Subsequently, we performed Kyoto Encyclopedia of Genes and Genomes (KEGG) analysis and gene ontology (GO) enrichment analysis using the KOBAS 3.0 website (http://kobas.cbi.pku.edu.cn, accessed on 25 May 2024) [79,80].

5. Conclusions

Our analysis of the MLR and NLR in the Duroc × Erhualian F2 resource population has successfully identified several SNPs and candidate genes associated with these immune cell ratios. These findings offer valuable insights into the underlying genetic mechanisms of immune regulation in pigs. This knowledge can be leveraged to develop breeding programs for disease resistance, a significant goal within the pig industry. Furthermore, the identified candidate genes have been implicated in human disease development and immune processes. Since pigs are a well-established animal model for human diseases, our findings also offer valuable reference for human disease research.

Supplementary Materials

The following supporting information can be downloaded at: https://www.mdpi.com/article/10.3390/ijms25179745/s1.

Author Contributions

M.Z. and J.Q. conceived and designed the experiments. J.Q. and M.X. processed these data. J.Q., M.X., F.X. and Z.C. conducted the data analysis. M.Z., J.Q., M.X., F.X., P.H., X.D. and N.M. wrote the first draft of the manuscript. All authors have read and agreed to the published version of the manuscript.

Funding

This research was funded by the Natural Science Foundation of China (31961143020), the National Key Research and Development Program of China (2021YFD1301201), and the Earmarked Fund for China Agriculture Research System (CARS-35).

Institutional Review Board Statement

This study was conducted according to the guidelines of the Declaration of Helsinki and approved by the Institutional Review Board of Huazhong Agricultural University.

Informed Consent Statement

Not applicable.

Data Availability Statement

The data analyzed in this study are accessible on figshare (https://figshare.com/s/daf50a666ff6c3d8514f, accessed on 5 June 2024).

Conflicts of Interest

The authors declare that they have no competing interests.

References

  1. Parkin, J.; Cohen, B. An overview of the immune system. Lancet 2001, 357, 1777–1789. [Google Scholar] [CrossRef]
  2. Tomar, N.; De, R.K. A brief outline of the immune system. Methods Mol. Biol. 2014, 1184, 3–12. [Google Scholar] [PubMed]
  3. Margraf, A.; Perretti, M. Immune Cell Plasticity in Inflammation: Insights into Description and Regulation of Immune Cell Phenotypes. Cells 2022, 11, 1824. [Google Scholar] [CrossRef] [PubMed]
  4. Wang, S.; Fan, Z.-s. Research progress on immune cell plasticity and immune pathogenesis. Chin. J. Immunol. 2018, 12, 641–646. [Google Scholar]
  5. Bogdanos, D.P.; Sakkas, L.I. Enterococcus gallinarum as a component of the Autoinfectome: The gut-liver-autoimmune rheumatic disease axis is alive and kicking. Mediterr. J. Rheumatol. 2018, 29, 187–189. [Google Scholar] [CrossRef]
  6. Baynes, R.E.; Dedonder, K.; Kissell, L.; Mzyk, D.; Marmulak, T.; Smith, G.; Tell, L.; Gehring, R.; Davis, J.; Riviere, J.E. Health concerns and management of select veterinary drug residues. Food Chem. Toxicol. 2016, 88, 112–122. [Google Scholar] [CrossRef] [PubMed]
  7. Centner, T.J.; Alvey, J.C.; Stelzleni, A.M. Beta agonists in livestock feed: Status, health concerns, and international trade. J. Anim. Sci. 2014, 92, 4234–4240. [Google Scholar] [CrossRef]
  8. Zhang, J.; Chen, J.H.; Liu, X.D.; Wang, H.Y.; Liu, X.L.; Li, X.Y.; Wu, Z.F.; Zhu, M.J.; Zhao, S.H. Genomewide association studies for hematological traits and T lymphocyte subpopulations in a Duroc × Erhualian F2 resource population. J. Anim. Sci. 2016, 94, 5028–5041. [Google Scholar] [CrossRef]
  9. Pabst, R. The pig as a model for immunology research. Cell Tissue Res. 2020, 380, 287–304. [Google Scholar] [CrossRef]
  10. Zahorec, R. Ratio of neutrophil to lymphocyte counts--rapid and simple parameter of systemic inflammation and stress in critically ill. Bratisl. Lek. Listy 2001, 102, 5–14. [Google Scholar]
  11. Ji, H.; Li, Y.; Fan, Z.; Zuo, B.; Jian, X.; Li, L.; Liu, T. Monocyte/lymphocyte ratio predicts the severity of coronary artery disease: A syntax score assessment. BMC Cardiovasc. Disord. 2017, 17, 90. [Google Scholar] [CrossRef]
  12. Balta, S.; Demirkol, S.; Unlu, M.; Arslan, Z.; Celik, T. Neutrophil to lymphocyte ratio may be predict of mortality in all conditions. Br. J. Cancer 2013, 109, 3125–3126. [Google Scholar] [CrossRef]
  13. Gomes, L.T.; Morato-Conceicao, Y.T.; Gambati, A.V.M.; Maciel-Pereira, C.M.; Fontes, C.J.F. Diagnostic value of neutrophil-to-lymphocyte ratio in patients with leprosy reactions. Heliyon 2020, 6, e03369. [Google Scholar] [CrossRef] [PubMed]
  14. Huang, Z.; Fu, Z.; Huang, W.; Huang, K. Prognostic value of neutrophil-to-lymphocyte ratio in sepsis: A meta-analysis. Am. J. Emerg. Med. 2020, 38, 641–647. [Google Scholar] [CrossRef] [PubMed]
  15. Howard, R.; Kanetsky, P.A.; Egan, K.M. Exploring the prognostic value of the neutrophil-to-lymphocyte ratio in cancer. Sci. Rep. 2019, 9, 19673. [Google Scholar] [CrossRef] [PubMed]
  16. Raffetti, E.; Donato, F.; Casari, S.; Castelnuovo, F.; Sighinolfi, L.; Bandera, A.; Maggiolo, F.; Ladisa, N.; di Pietro, M.; Fornabaio, C.; et al. Systemic inflammation-based scores and mortality for all causes in HIV-infected patients: A MASTER cohort study. BMC Infect. Dis. 2017, 17, 193. [Google Scholar] [CrossRef]
  17. Hua, Y.; Sun, J.Y.; Lou, Y.X.; Sun, W.; Kong, X.Q. Monocyte-to-lymphocyte ratio predicts mortality and cardiovascular mortality in the general population. Int. J. Cardiol. 2023, 379, 118–126. [Google Scholar] [CrossRef]
  18. Mortaz, E.; Alipoor, S.D.; Adcock, I.M.; Mumby, S.; Koenderman, L. Update on Neutrophil Function in Severe Inflammation. Front Immunol. 2018, 9, 2171. [Google Scholar] [CrossRef]
  19. Shi, C.; Pamer, E.G. Monocyte recruitment during infection and inflammation. Nat. Rev. Immunol. 2011, 11, 762–774. [Google Scholar] [CrossRef]
  20. Marti, G.E.; Fleisher, T.A. Application of lymphocyte immunophenotyping in selected diseases. Pathol. Immunopathol. Res. 1988, 7, 319–337. [Google Scholar] [CrossRef]
  21. Cantor, R.M.; Lange, K.; Sinsheimer, J.S. Prioritizing GWAS Results: A Review of Statistical Methods and Recommendations for Their Application. Am. J. Hum. Genet. 2010, 86, 6–22. [Google Scholar] [CrossRef] [PubMed]
  22. Korte, A.; Farlow, A. The advantages and limitations of trait analysis with GWAS: A review. Plant Methods 2013, 9, 29. [Google Scholar] [CrossRef]
  23. Zhang, X.; Johnson, A.D.; Hendricks, A.E.; Hwang, S.J.; Tanriverdi, K.; Ganesh, S.K.; Smith, N.L.; Peyser, P.A.; Freedman, J.E.; O’Donnell, C.J. Genetic associations with expression for genes implicated in GWAS studies for atherosclerotic cardiovascular disease and blood phenotypes. Hum. Mol. Genet. 2014, 23, 782–795. [Google Scholar] [CrossRef] [PubMed]
  24. Andiappan, A.K.; Melchiotti, R.; Poh, T.Y.; Nah, M.; Puan, K.J.; Vigano, E.; Haase, D.; Yusof, N.; San Luis, B.; Lum, J.; et al. Genome-wide analysis of the genetic regulation of gene expression in human neutrophils. Nat. Commun. 2015, 6, 7971. [Google Scholar] [CrossRef]
  25. Lin, B.D.; Carnero-Montoro, E.; Bell, J.T.; Boomsma, D.I.; de Geus, E.J.; Jansen, R.; Kluft, C.; Mangino, M.; Penninx, B.; Spector, T.D.; et al. 2SNP heritability and effects of genetic variants for neutrophil-to-lymphocyte and platelet-to-lymphocyte ratio. J. Hum. Genet. 2017, 62, 979–988. [Google Scholar] [CrossRef]
  26. Roth, K.; Proll-Cornelissen, M.J.; Henne, H.; Appel, A.K.; Schellander, K.; Tholen, E.; Grosse-Brinkhaus, C. Multivariate genome-wide associations for immune traits in two maternal pig lines. BMC Genom. 2023, 24, 492. [Google Scholar] [CrossRef]
  27. Dauben, C.M.; Proll-Cornelissen, M.J.; Heuss, E.M.; Appel, A.K.; Henne, H.; Roth, K.; Schellander, K.; Tholen, E.; Grosse-Brinkhaus, C. Genome-wide associations for immune traits in two maternal pig lines. BMC Genom. 2021, 22, 717. [Google Scholar] [CrossRef] [PubMed]
  28. Yu, J.M.; Pressoir, G.; Briggs, W.H.; Bi, I.V.; Yamasaki, M.; Doebley, J.F.; McMullen, M.D.; Gaut, B.S.; Nielsen, D.M.; Holland, J.B.; et al. A unified mixed-model method for association mapping that accounts for multiple levels of relatedness. Nat. Genet. 2006, 38, 203–208. [Google Scholar] [CrossRef]
  29. Yang, J.A.; Lee, S.H.; Goddard, M.E.; Visscher, P.M. GCTA: A Tool for Genome-wide Complex Trait Analysis. Am. J. Hum. Genet. 2011, 88, 76–82. [Google Scholar] [CrossRef]
  30. Liu, X.L.; Huang, M.; Fan, B.; Buckler, E.S.; Zhang, Z.W. Iterative Usage of Fixed and Random Effect Models for Powerful and Efficient Genome-Wide Association Studies. PLoS Genet. 2016, 12, e1005767. [Google Scholar] [CrossRef]
  31. Huang, M.; Liu, X.L.; Zhou, Y.; Summers, R.M.; Zhang, Z.W. BLINK: A package for the next level of genome-wide association studies with both individuals and markers in the millions. Gigascience 2019, 8, giy154. [Google Scholar] [CrossRef]
  32. Sun, H.; Cheng, Y.; He, Y.; Cheng, C.; Zhao, H.; Yang, S.; Wei, M.; Yang, J.; Liang, S.; Bai, C.; et al. Genome-wide association studies for the number of piglets born alive and dead in Dongliao black pigs. Anim. Genet. 2024, 55, 282–285. [Google Scholar] [CrossRef]
  33. Zeng, M.; Wang, B.H.; Liu, L.; Yang, Y.L.; Tang, Z.L. Genome-wide association study identifies 12 new genetic loci associated with growth traits in pigs. J. Integr. Agric. 2024, 23, 217–227. [Google Scholar] [CrossRef]
  34. Wang, J.; Peng, W.; Chen, L.; Kangzhu, Y.; Zhong, J. Assessment of Genomic Prediction Strategies after Animal Genome-Wide Association Study. 2022. [Google Scholar] [CrossRef]
  35. Adhikari, M.; Kantar, M.B.; Longman, R.J.; Lee, C.N.; Oshiro, M.; Caires, K.; He, Y. Genome-wide association study for carcass weight in pasture-finished beef cattle in Hawai’i. Front. Genet. 2023, 14, 1168150. [Google Scholar] [CrossRef]
  36. Bai, X.; Yang, T.; Putz, A.M.; Wang, Z.; Li, C.; Fortin, F.; Harding, J.C.S.; Dyck, M.K.; PigGen, C.; Dekkers, J.C.M.; et al. Investigating the genetic architecture of disease resilience in pigs by genome-wide association studies of complete blood count traits collected from a natural disease challenge model. BMC Genom. 2021, 22, 535. [Google Scholar] [CrossRef]
  37. Dervishi, E.; Bai, X.; Dyck, M.K.; Harding, J.C.S.; Fortin, F.; Dekkers, J.C.M.; Plastow, G. GWAS and genetic and phenotypic correlations of plasma metabolites with complete blood count traits in healthy young pigs reveal implications for pig immune response. Front. Mol. Biosci. 2023, 10, 1140375. [Google Scholar] [CrossRef] [PubMed]
  38. Uemoto, Y.; Ichinoseki, K.; Matsumoto, T.; Oka, N.; Takamori, H.; Kadowaki, H.; Kojima-Shibata, C.; Suzuki, E.; Okamura, T.; Aso, H.; et al. Genome-wide association studies for production, respiratory disease, and immune-related traits in Landrace pigs. Sci. Rep. 2021, 11, 15823. [Google Scholar] [CrossRef]
  39. Lu, X.; Fu, W.X.; Luo, Y.R.; Ding, X.D.; Zhou, J.P.; Liu, Y.; Liu, J.F.; Zhang, Q. Genome-wide association study for T lymphocyte subpopulations in swine. BMC Genom. 2012, 13, 488. [Google Scholar] [CrossRef] [PubMed]
  40. Ballester, M.; Jove-Junca, T.; Pascual, A.; Lopez-Serrano, S.; Crespo-Piazuelo, D.; Hernandez-Banque, C.; Gonzalez-Rodriguez, O.; Ramayo-Caldas, Y.; Quintanilla, R. Genetic architecture of innate and adaptive immune cells in pigs. Front. Immunol. 2023, 14, 1058346. [Google Scholar] [CrossRef] [PubMed]
  41. Flori, L.; Gao, Y.; Laloë, D.; Lemonnier, G.; Leplat, J.J.; Teillaud, A.; Cossalter, A.M.; Laffitte, J.; Pinton, P.; de Vaureix, C.; et al. Immunity Traits in Pigs: Substantial Genetic Variation and Limited Covariation. PLoS ONE 2011, 6, e22717. [Google Scholar] [CrossRef] [PubMed]
  42. Clapperton, M.; Diack, A.B.; Matika, O.; Glass, E.J.; Gladney, C.D.; Mellencamp, M.A.; Hoste, A.; Bishop, S.C. Traits associated with innate and adaptive immunity in pigs: Heritability and associations with performance under different health status conditions. Genet. Sel. Evol. 2009, 41, 54. [Google Scholar] [CrossRef] [PubMed]
  43. Elcheva, I.A.; Gowda, C.P.; Bogush, D.; Gornostaeva, S.; Fakhardo, A.; Sheth, N.; Kokolus, K.M.; Sharma, A.; Dovat, S.; Uzun, Y.; et al. IGF2BP family of RNA-binding proteins regulate innate and adaptive immune responses in cancer cells and tumor microenvironment. Front. Immunol. 2023, 14, 1224516. [Google Scholar] [CrossRef]
  44. Kim, J.H.; Lee, C.H.; Lee, S.W. Exosomal Transmission of MicroRNA from HCV Replicating Cells Stimulates Transdifferentiation in Hepatic Stellate Cells. Mol. Ther. Nucleic Acids 2019, 14, 483–497. [Google Scholar] [CrossRef]
  45. Chen, J.; Jin, L.; Yan, M.; Yang, Z.; Wang, H.; Geng, S.; Gong, Z.; Liu, G. Serum Exosomes from Newborn Piglets Restrict Porcine Epidemic Diarrhea Virus Infection. J. Proteome Res. 2019, 18, 1939–1947. [Google Scholar] [CrossRef]
  46. Chen, H.; Chen, J.; Zhao, L.; Song, W.; Xuan, Z.; Chen, J.; Li, Z.; Song, G.; Hong, L.; Song, P.; et al. CDCA5, Transcribed by E2F1, Promotes Oncogenesis by Enhancing Cell Proliferation and Inhibiting Apoptosis via the AKT Pathway in Hepatocellular Carcinoma. J. Cancer 2019, 10, 1846–1854. [Google Scholar] [CrossRef] [PubMed]
  47. Chen, R.H.; Chen, Y.H.; Huang, T.Y. Ubiquitin-mediated regulation of autophagy. J. Biomed. Sci. 2019, 26, 80. [Google Scholar] [CrossRef]
  48. Li, H.; Zhang, M.; Zheng, E. Comprehensive miRNA expression profiles in the ilea of Lawsonia intracellularis-infected pigs. J. Vet. Med. Sci. 2017, 79, 282–289. [Google Scholar] [CrossRef]
  49. Della Corte, C.M.; Morgillo, F. Early use of steroids affects immune cells and impairs immunotherapy efficacy. ESMO Open 2019, 4, e000477. [Google Scholar] [CrossRef]
  50. Arbour, K.C.; Mezquita, L.; Long, N.; Rizvi, H.; Auclin, E.; Ni, A.; Martinez-Bernal, G.; Ferrara, R.; Lai, W.V.; Hendriks, L.E.L.; et al. Impact of Baseline Steroids on Efficacy of Programmed Cell Death-1 and Programmed Death-Ligand 1 Blockade in Patients With Non-Small-Cell Lung Cancer. J. Clin. Oncol. 2018, 36, 2872–2878. [Google Scholar] [CrossRef]
  51. Kajiwara, Y.; Buxbaum, J.D.; Grice, D.E. SLITRK1 binds 14-3-3 and regulates neurite outgrowth in a phosphorylation-dependent manner. Biol. Psychiatry 2009, 66, 918–925. [Google Scholar] [CrossRef]
  52. Mosner, M.G.; Kinard, J.L.; Shah, J.S.; McWeeny, S.; Greene, R.K.; Lowery, S.C.; Mazefsky, C.A.; Dichter, G.S. Rates of Co-occurring Psychiatric Disorders in Autism Spectrum Disorder Using the Mini International Neuropsychiatric Interview. J. Autism. Dev. Disord. 2019, 49, 3819–3832. [Google Scholar] [CrossRef]
  53. Tian, Z.; Ning, C.; Fu, C.; Xu, F.; Zou, C.; Zhu, Q.; Cai, J.; Wang, Y. CALCOCO2 silencing represents a potential molecular therapeutic target for glioma. Arch. Med. Sci. 2020, 16. Available online: https://api.semanticscholar.org/CorpusID:226639886 (accessed on 7 September 2024). [CrossRef]
  54. Kumthip, K.; Yang, D.; Li, N.L.; Zhang, Y.; Fan, M.; Sethuraman, A.; Li, K. Pivotal role for the ESCRT-II complex subunit EAP30/SNF8 in IRF3-dependent innate antiviral defense. PLoS Pathog. 2017, 13, e1006713. [Google Scholar] [CrossRef]
  55. Jiang, Y.; Zhang, G.; Li, L.; Chen, J.; Hao, P.; Gao, Z.; Hao, J.; Xu, Z.; Wang, M.; Li, C.; et al. A novel host restriction factor MRPS6 mediates the inhibition of PDCoV infection in HIEC-6 cells. Front. Immunol. 2024, 15, 1381026. [Google Scholar] [CrossRef] [PubMed]
  56. Tang, M.Y.; Liao, M.C.; Ai, X.H.; He, G.C. Increased CDCA2 Level Was Related to Poor Prognosis in Hepatocellular Carcinoma and Associated With Up-Regulation of Immune Checkpoints. Front. Med. 2022, 8, 773724. [Google Scholar] [CrossRef] [PubMed]
  57. Li, F.; Zhang, H.H.; Li, Q.; Wu, F.; Wang, Y.; Wang, Z.Z.; Wang, X.F.; Huang, C. CDCA2 acts as an oncogene and induces proliferation of clear cell renal cell carcinoma cells. Oncol. Lett. 2020, 19, 2466–2474. [Google Scholar] [CrossRef]
  58. Jin, W.H.; Zhou, A.T.; Chen, J.J.; Cen, Y. CDCA2 promotes proliferation and migration of melanoma by upregulating CCAD1. Eur. Rev. Med. Pharmacol. Sci. 2020, 24, 6858–6863. [Google Scholar]
  59. Roy, S.; Guler, R.; Parihar, S.P.; Schmeier, S.; Kaczkowski, B.; Nishimura, H.; Shin, J.W.; Negishi, Y.; Ozturk, M.; Hurdayal, R.; et al. Batf2/Irf1 induces inflammatory responses in classically activated macrophages, lipopolysaccharides, and mycobacterial infection. J. Immunol. 2015, 194, 6035–6044. [Google Scholar] [CrossRef] [PubMed]
  60. Thompson, N.; Wakarchuk, W. O-glycosylation and its role in therapeutic proteins. Biosci. Rep. 2022, 42, BSR20220094. [Google Scholar] [CrossRef]
  61. Pinho, S.S.; Alves, I.; Gaifem, J.; Rabinovich, G.A. Immune regulatory networks coordinated by glycans and glycan-binding proteins in autoimmunity and infection. Cell. Mol. Immunol. 2023, 20, 1101–1113. [Google Scholar] [CrossRef]
  62. Derks, M.F.L.; Megens, H.J.; Bosse, M.; Lopes, M.S.; Harlizius, B.; Groenen, M.A.M. A systematic survey to identify lethal recessive variation in highly managed pig populations. BMC Genom. 2017, 18, 858. [Google Scholar] [CrossRef] [PubMed]
  63. Meng, Z.Z.; Liu, Y.; Wang, J.; Fan, H.J.; Fang, H.; Li, S.; Yuan, L.; Liu, C.C.; Peng, Y.; Zhao, W.W.; et al. Histone demethylase KDM7A is required for stem cell maintenance and apoptosis inhibition in breast cancer. J. Cell. Physiol. 2020, 235, 932–943. [Google Scholar] [CrossRef]
  64. Higashijima, Y.; Matsui, Y.; Shimamura, T.; Nakaki, R.; Nagai, N.; Tsutsumi, S.; Abe, Y.; Link, V.M.; Osaka, M.; Yoshida, M.; et al. Coordinated demethylation of H3K9 and H3K27 is required for rapid inflammatory responses of endothelial cells. EMBO J. 2020, 39, e103949. [Google Scholar] [CrossRef]
  65. Montesinos, M.D.M.; Pellizas, C.G. Thyroid Hormone Action on Innate Immunity. Front. Endocrinol. 2019, 10, 350. [Google Scholar] [CrossRef]
  66. De Vito, P.; Incerpi, S.; Pedersen, J.Z.; Luly, P.; Davis, F.B.; Davis, P.J. Thyroid Hormones as Modulators of Immune Activities at the Cellular Level. Thyroid 2011, 21, 879–890. [Google Scholar] [CrossRef] [PubMed]
  67. van der Spek, A.H.; Fliers, E.; Boelen, A. Thyroid hormone metabolism in innate immune cells. J. Endocrinol. 2017, 232, R67–R81. [Google Scholar] [CrossRef] [PubMed]
  68. Köllisch, G.; Kalali, B.N.; Voelcker, V.; Wallich, R.; Behrendt, H.; Ring, J.; Bauer, S.; Jakob, T.; Mempel, M.; Ollert, M. Various members of the Toll-like receptor family contribute to the innate immune response of human epidermal keratinocytes. Immunology 2005, 114, 531–541. [Google Scholar] [CrossRef]
  69. Morad, S.A.; Cabot, M.C. Ceramide-orchestrated signalling in cancer cells. Nat. Rev. Cancer 2013, 13, 51–65. [Google Scholar] [CrossRef]
  70. Rajput, K.; Ansari, M.N.; Jha, S.K.; Pani, T.; Medatwal, N.; Chattopadhyay, S.; Bajaj, A.; Dasgupta, U. Ceramide Kinase (CERK) Emerges as a Common Therapeutic Target for Triple Positive and Triple Negative Breast Cancer Cells. Cancers 2022, 14, 4496. [Google Scholar] [CrossRef]
  71. Qing, L.; Yuan, Z. Measurement of immune parameters in growing piglets. J. -Huazhong Agric. Univ. 2001, 20, 561–563. [Google Scholar]
  72. Purcell, S.; Neale, B.; Todd-Brown, K.; Thomas, L.; Ferreira, M.A.R.; Bender, D.; Maller, J.; Sklar, P.; de Bakker, P.I.W.; Daly, M.J.; et al. PLINK: A tool set for whole-genome association and population-based linkage analyses. Am. J. Hum. Genet. 2007, 81, 559–575. [Google Scholar] [CrossRef] [PubMed]
  73. Browning, B.L.; Tian, X.W.; Zhou, Y.; Browning, S.R. Fast two-stage phasing of large-scale sequence data. Am. J. Hum. Genet. 2021, 108, 1880–1890. [Google Scholar] [CrossRef]
  74. Zhou, G.L.; Xu, F.J.; Qiao, J.K.; Che, Z.X.; Xiang, T.; Liu, X.L.; Li, X.Y.; Zhao, S.H.; Zhu, M.J. E-GWAS: An ensemble-like GWAS strategy that provides effective control over false positive rates without decreasing true positives. Genet. Sel. Evol. 2023, 55, 46. [Google Scholar] [CrossRef]
  75. Yin, L.; Zhang, H.; Tang, Z.; Xu, J.; Yin, D.; Zhang, Z.; Yuan, X.; Zhu, M.; Zhao, S.; Li, X.; et al. rMVP: A Memory-efficient, Visualization-enhanced, and Parallel-accelerated Tool for Genome-wide Association Study. Genom. Proteom. Bioinform. 2021, 19, 619–628. [Google Scholar] [CrossRef]
  76. Shaffer, J.P. Multiple Hypothesis-Testing. Annu. Rev. Psychol. 1995, 46, 561–584. [Google Scholar] [CrossRef]
  77. Durinck, S.; Spellman, P.T.; Birney, E.; Huber, W. Mapping identifiers for the integration of genomic datasets with the R/Bioconductor package biomaRt. Nat. Protoc. 2009, 4, 1184–1191. [Google Scholar] [CrossRef]
  78. Durinck, S.; Moreau, Y.; Kasprzyk, A.; Davis, S.; De Moor, B.; Brazma, A.; Huber, W. BioMart and Bioconductor: A powerful link between biological databases and microarray data analysis. Bioinformatics 2005, 21, 3439–3440. [Google Scholar] [CrossRef]
  79. Mao, X.Z.; Cai, T.; Olyarchuk, J.G.; Wei, L.P. Automated genome annotation and pathway identification using the KEGG Orthology (KO) as a controlled vocabulary. Bioinformatics 2005, 21, 3787–3793. [Google Scholar] [CrossRef]
  80. Wu, J.M.; Mao, X.Z.; Cai, T.; Luo, J.C.; Wei, L.P. KOBAS server: A web-based platform for automated annotation and pathway identification. Nucleic Acids Res. 2006, 34, W720–W724. [Google Scholar] [CrossRef]
Figure 1. Manhattan plots of different GWAS models for MLR. (A), Manhattan plot of MLM model. (B), Manhattan plot of MLMA-LOCO model. (C), Manhattan plot of FarmCPU model. (D), Manhattan plot of BLINK model. The rows represent the GWAS results of different models, and the annotated SNPs are the ones identified by the E-GWAS. The dotted lines represent the Bonferroni correction thresholds.
Ijms 25 09745 g001
Figure 2. Manhattan plots of different GWAS models for NLR. (A), Manhattan plot of MLM model. (B), Manhattan plot of MLMA-LOCO model. (C), Manhattan plot of FarmCPU model. (D), Manhattan plot of BLINK model. The rows represent the GWAS results of different models, and the annotated SNPs are the ones identified by the E-GWAS. The dotted lines represent the Bonferroni correction thresholds.
Ijms 25 09745 g002
Figure 3. Immune-related biological processes in enrichment analysis results. The X-axis represents the ID of the enriched term, and the Y-axis represents the significant p value.
Ijms 25 09745 g003
Table 1. Estimation of variance components and heritability for mononuclear-lymphocyte ratio (MLR), and neutrophil-lymphocyte ratio (NLR).
Trait1  σ u 2 ± SE2  σ e 2 ± SE3  h 2 ± 4 SE
MLR0.008 ± 0.0020.004 ± 0.0010.649 ± 0.080
NLR1.384 ± 0.2730.627 ± 0.1180.688 ± 0.076
1  σ u 2 , additive genetic variance; 2  σ e 2 , dominance genetic variance; 3  h 2 , additive heritability; 4 SE, standard error.
Table 2. SNPs associated with monocyte/lymphocyte ratio (MLR).
SNP1 ChrPositionModel2 p-Value
INRA005829727110358MLMA-LOCO1.51 × 10−5
BLINK2.71 × 10−7 *
ASGA00225544116094650MLM9.41 × 10−6
MLMA-LOCO6.07 × 10−6
H3GA00323081154602515FarmCPU8.25 × 10−7 *
BLINK2.27 × 10−8 *
DRGA00117941225068363MLMA-LOCO2.28 × 10−5
BLINK6.92 × 10−7 *
ALGA0075031149571032MLMA-LOCO2.54 × 10−5
FarmCPU2.98 × 10−12 *
1 Chr, Chromosome; 2 p-value, p values of different GWAS models are represented by * above the significant threshold and without * above the suggestiveness threshold.
Table 3. SNPs associated with neutrophil/lymphocyte ratio (NLR).
SNP1 ChrPositionModel2 p-Value
ASGA00066501223397796MLM2.53 × 10−5
MLMA-LOCO1.08 × 10−5
FarmCPU2.21 × 10−6
ASGA002391152488153MLMA-LOCO2.47 × 10−5
FarmCPU4.67 × 10−6
BLINK3.50 × 10−8 *
ASGA00573351326494790MLMA-LOCO1.94 × 10−5
FarmCPU8.84 × 10−6
M1GA0023131189230153MLM1.32 × 10−6 *
MLMA-LOCO8.52 × 10−7 *
FarmCPU2.52 × 10−8 *
BLINK6.60 × 10−9 *
1 Chr, Chromosome; 2 p-value, p values of different GWAS models are represented by * above the significant threshold and without * above the suggestiveness threshold.
Table 4. Summary of candidate genes associated with monocyte/lymphocyte ratio (MLR) and neutrophil/lymphocyte ratio (NLR).
TraitGene1 Chr2 TermDatabaseID3 p-Value
MLRSYVN12Ubiquitin mediated proteolysisKEGG PATHWAYssc041200.014
negative regulation of endoplasmic reticulum stress-induced intrinsic apoptotic signaling pathwayGene OntologyGO:19022360.016
TM7SF22Steroid biosynthesisKEGG PATHWAYssc001000.027
CDCA52MicroRNAs in cancerKEGG PATHWAYssc052060.004
BATF22EndocytosisKEGG PATHWAYssc041440.041
myeloid dendritic cell differentiationGene OntologyGO:00430110.019
defense response to protozoanGene OntologyGO:00428320.020
ATG2A2Autophagy—otherKEGG PATHWAYssc041360.043
MIR1922MicroRNAs in cancerKEGG PATHWAYssc052060.004
SLITRK111synaptic membrane adhesionGene OntologyGO:00995600.027
CALCOCO212response to interferon-gammaGene OntologyGO:00343410.023
SNF812positive regulation of exosomal secretionGene OntologyGO:19035430.009
IGF2BP112MicroRNAs in cancerKEGG PATHWAYssc052060.004
CDCA214positive regulation of protein dephosphorylationGene OntologyGO:00353070.021
NLRKLF91cellular response to thyroid hormone stimulusGene OntologyGO:00970670.006
negative regulation of keratinocyte proliferationGene OntologyGO:00108390.006
TBC1D22A514-3-3 protein bindingGene OntologyGO:00718890.006
CERK5sphingolipid metabolic processGene OntologyGO:00066650.009
GRAMD45positive regulation of cysteine-type endopeptidase activity involved in apoptotic processGene OntologyGO:00432800.016
POMGNT213Mannose type O-glycan biosynthesisKEGG PATHWAYssc005150.013
KDM7A18histone demethylase activity (H3-K27 specific)Gene OntologyGO:00715580.003
1 Chr, Chromosome; 2 Term, biological processes of enrichment analysis, 3 p-Value, p value of enrichment analysis.
Disclaimer/Publisher’s Note: The statements, opinions and data contained in all publications are solely those of the individual author(s) and contributor(s) and not of MDPI and/or the editor(s). MDPI and/or the editor(s) disclaim responsibility for any injury to people or property resulting from any ideas, methods, instructions or products referred to in the content.

