Article

Simultaneous Electrochemical Detection of Catechol and Hydroquinone Based on a Carbon Nanotube Paste Electrode Modified with Electro-Reduced Graphene Oxide

by
Tingfei Chen
1,†,
Chao Liu
1,2,3,†,
Xiaojun Liu
1,2,3,
Chunnan Zhu
1,2,3 and
Dongyun Zheng
1,2,3,*
1
School of Biomedical Engineering, South-Central Minzu University, Wuhan 430074, China
2
Key Laboratory of Cognitive Science, State Ethnic Affairs Commission, Wuhan 430074, China
3
Hubei Key Laboratory of Medical Information Analysis and Tumor Diagnosis & Treatment, Wuhan 430074, China
*
Author to whom correspondence should be addressed.
These authors contributed equally to this work.
Int. J. Mol. Sci. 2024, 25(18), 9829; https://doi.org/10.3390/ijms25189829
Submission received: 10 August 2024 / Revised: 6 September 2024 / Accepted: 10 September 2024 / Published: 11 September 2024
(This article belongs to the Special Issue Molecular Functions of Polyphenols in Health and Diseases)

Abstract

:
Effectively detecting catechol (CC) and hydroquinone (HQ) simultaneously is crucial for environmental protection and human health monitoring. In the study presented herein, a novel electrochemical sensor for the sensitive simultaneous detection of CC and HQ was constructed based on an electrochemically reduced graphene oxide (ERGO)-modified multi-walled carbon nanotube paste electrode (MWCNTPE). Scanning electron microscopy, X-ray photoelectron spectroscopy, Raman spectroscopy and electrochemical techniques were utilized to characterize the sensing interface and investigate the sensing mechanism. Under the optimal detection conditions, the oxidation peak currents of CC and HQ show a good linear relationship with their concentrations in the range of 0.4–400 μM with a detection limit of 0.083 μM for CC and 0.028 μM for HQ (S/N = 3). Moreover, the sensor exhibits good performance and can be applied successfully in the simultaneous detection of CC and HQ in tap water samples and urine samples with satisfactory results, indicating its promising application prospects.

1. Introduction

Catechol (CC) and hydroquinone (HQ) are isomers of dihydroxybenzene, and are known as environmental endocrine disruptors [1]. As metabolites of benzene, phenols are considered important indicators for monitoring the metabolism of the carcinogen benzene in the human body [2]. It has been proven that they can affect the human endocrine system and are associated with endocrine tumors [3]. Excessive amounts of CC and HQ may also cause fatigue, tachycardia, liver damage, kidney dysfunction, and other health issues [4]. However, the direct and simultaneous determination of the isomers presents a challenge due to their similar properties [5]. Therefore, it is crucial to develop an efficient, sensitive, selective, and low-cost method for the detection of CC and HQ.
Various methods have been used for the simultaneous detection of CC and HQ, including spectrophotometry [6], fluorescence [7], chemiluminescence [8], high-performance liquid chromatography [9] and electrochemical analysis [10]. Among these methods, electrochemical analysis has been widely used for detection in a range of applications, from humans to the environment, due to its simple operation, low cost and fast response [11,12,13,14]. However, extended overlapping voltammetric signals may affect the transient detection of CC and HQ due to their similar properties [15]. Therefore, it is necessary to develop an effective electrochemical sensor to enhance selectivity and sensitivity for CC and HQ detection.
Nanomaterials such as metal nanoparticles [16] and carbon nanomaterials (i.e., carbon nanofibers [17], fullerenes [18], carbon nanotubes [19], and graphene [20]) have been widely used to modify electrode surfaces. Graphene (G) and multi-walled carbon nanotubes (MWCNTs) have become promising materials in the field of electrode modification due to their excellent properties and environmental friendliness [21,22,23,24]. However, G is extremely vulnerable to self-polymerization or stacking due to Van der Waals interactions, resulting in a loss of surface area and electrical conductivity [25]. Therefore, reduced graphene oxide (RGO) was synthesized by reducing graphene oxide (GO) to remove the oxygen groups. This process not only retains the high electrical conductivity and mechanical strength of graphene but also maintains the dispersion and functionalization of GO [26,27]. Several methods have been used to produce RGO, including chemical reduction [28], thermal reduction [29], and electrochemical reduction [30]. Compared to these methods, the electrochemical reduction of GO (ERGO) not only produces high-quality material but also forms ERGO films directly on the electrode surface through a one-step electrodeposition technique.
Glassy carbon electrodes (GCEs) are extensively utilized in developing CC and HQ electrochemical sensors because of their facile surface modification and reproducibility. However, these electrodes often face challenges such as low surface activity, poor adsorption of modifying materials, and high costs, that prevent them from being disposable [31,32]. Hence, there is a need to develop a cost-effective and easy-to-prepare disposable electrode. In recent years, carbon materials have gained extensive utilization in electrochemical research due to their excellent properties, eco-friendly nature, and cost-effectiveness [33,34,35]. Multi-walled carbon nanotubes (MWCNTs), consisting of multiple layers of graphite rolled into tube shapes with varying diameters, exhibit several remarkable properties, including a larger specific surface area, higher stability, and better electrical conductivity, even in smaller amounts compared to graphite [36,37]. When MWCNTs are used as an electron transfer medium, they significantly reduce the overpotential of the redox reactions of detected substances, thereby enhancing the electrode’s selectivity and sensitivity [38]. Therefore, MWCNTs are widely used as the primary prepared carbon material for carbon paste electrodes [11,39,40].
In this work, we developed a disposable ERGO-modified MWCNT carton paste microelectrode (ERGO/MWCNTPE) using a simple and controllable electrodeposition method for the simultaneous detection of CC and HQ. The sensitivity and selectivity of the sensor were enhanced due to the synergistic interaction of MWCNT and ERGO on the surface of the modified electrode. Scheme 1 describes the preparation of the ERGO/MWCNTPE and the electrochemical affect of CC and HQ on the electrode. The electrochemical sensor was characterized, and its performance in detecting CC and HQ was also investigated. The results showed that the ERGO/MWCNTPE exhibited good electrocatalytic performance for the redox reactions of CC and HQ. It was effective in the determination of CC and HQ in tap water samples and urine samples with satisfactory results.

2. Results and Discussion

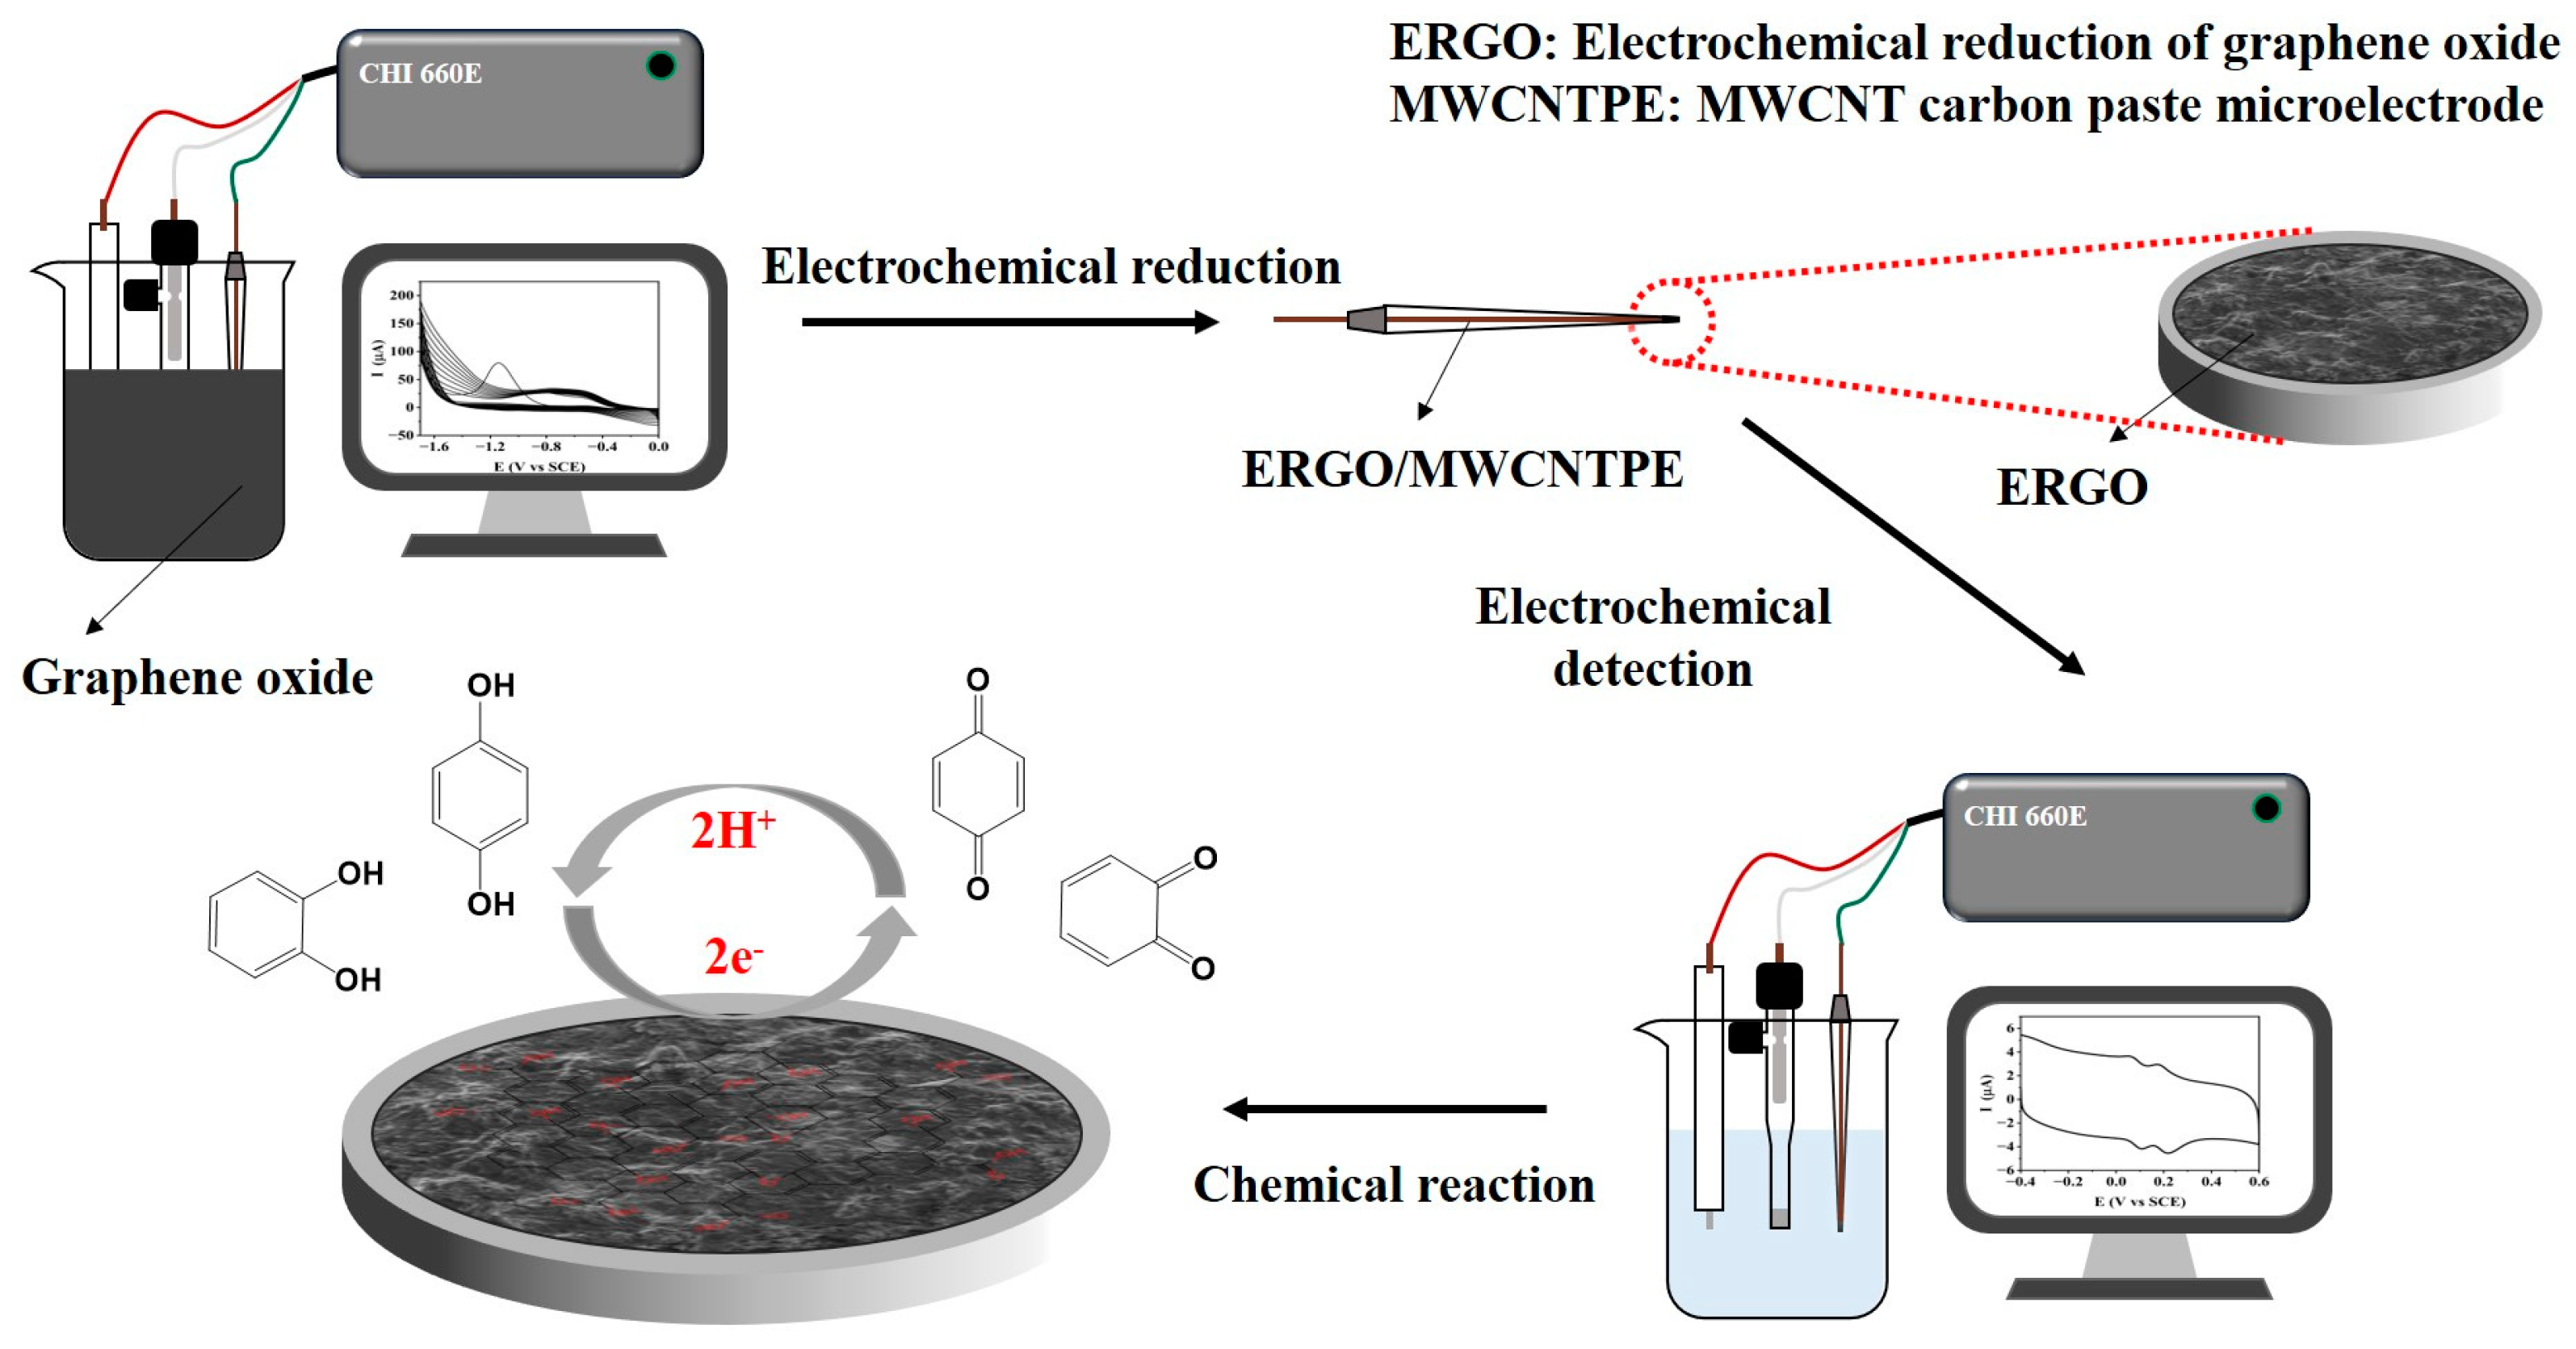
2.1. Electrochemical Reduction of Graphene Oxide

To improve the conductivity and electrocatalytic properties of the electrodes, graphene oxide was electrochemically reduced. As shown in Figure 1, ERGO was generated by reducing the oxygen groups on the GO film using cyclic voltammetry, which involved applying a high negative potential ranging from 0 V to −1.7 V. The cathodic peak I within the first cycle, which had the largest current signal at a potential of −1.1 V, suggests that the process of GO reduction was almost complete [25,41]. In the subsequent cycles, the remaining reactive oxygen groups on the GO surface were gradually reduced, corresponding to peak II. Only a small portion of the oxygen-containing groups was retained to improve the adsorption of CC and HQ.

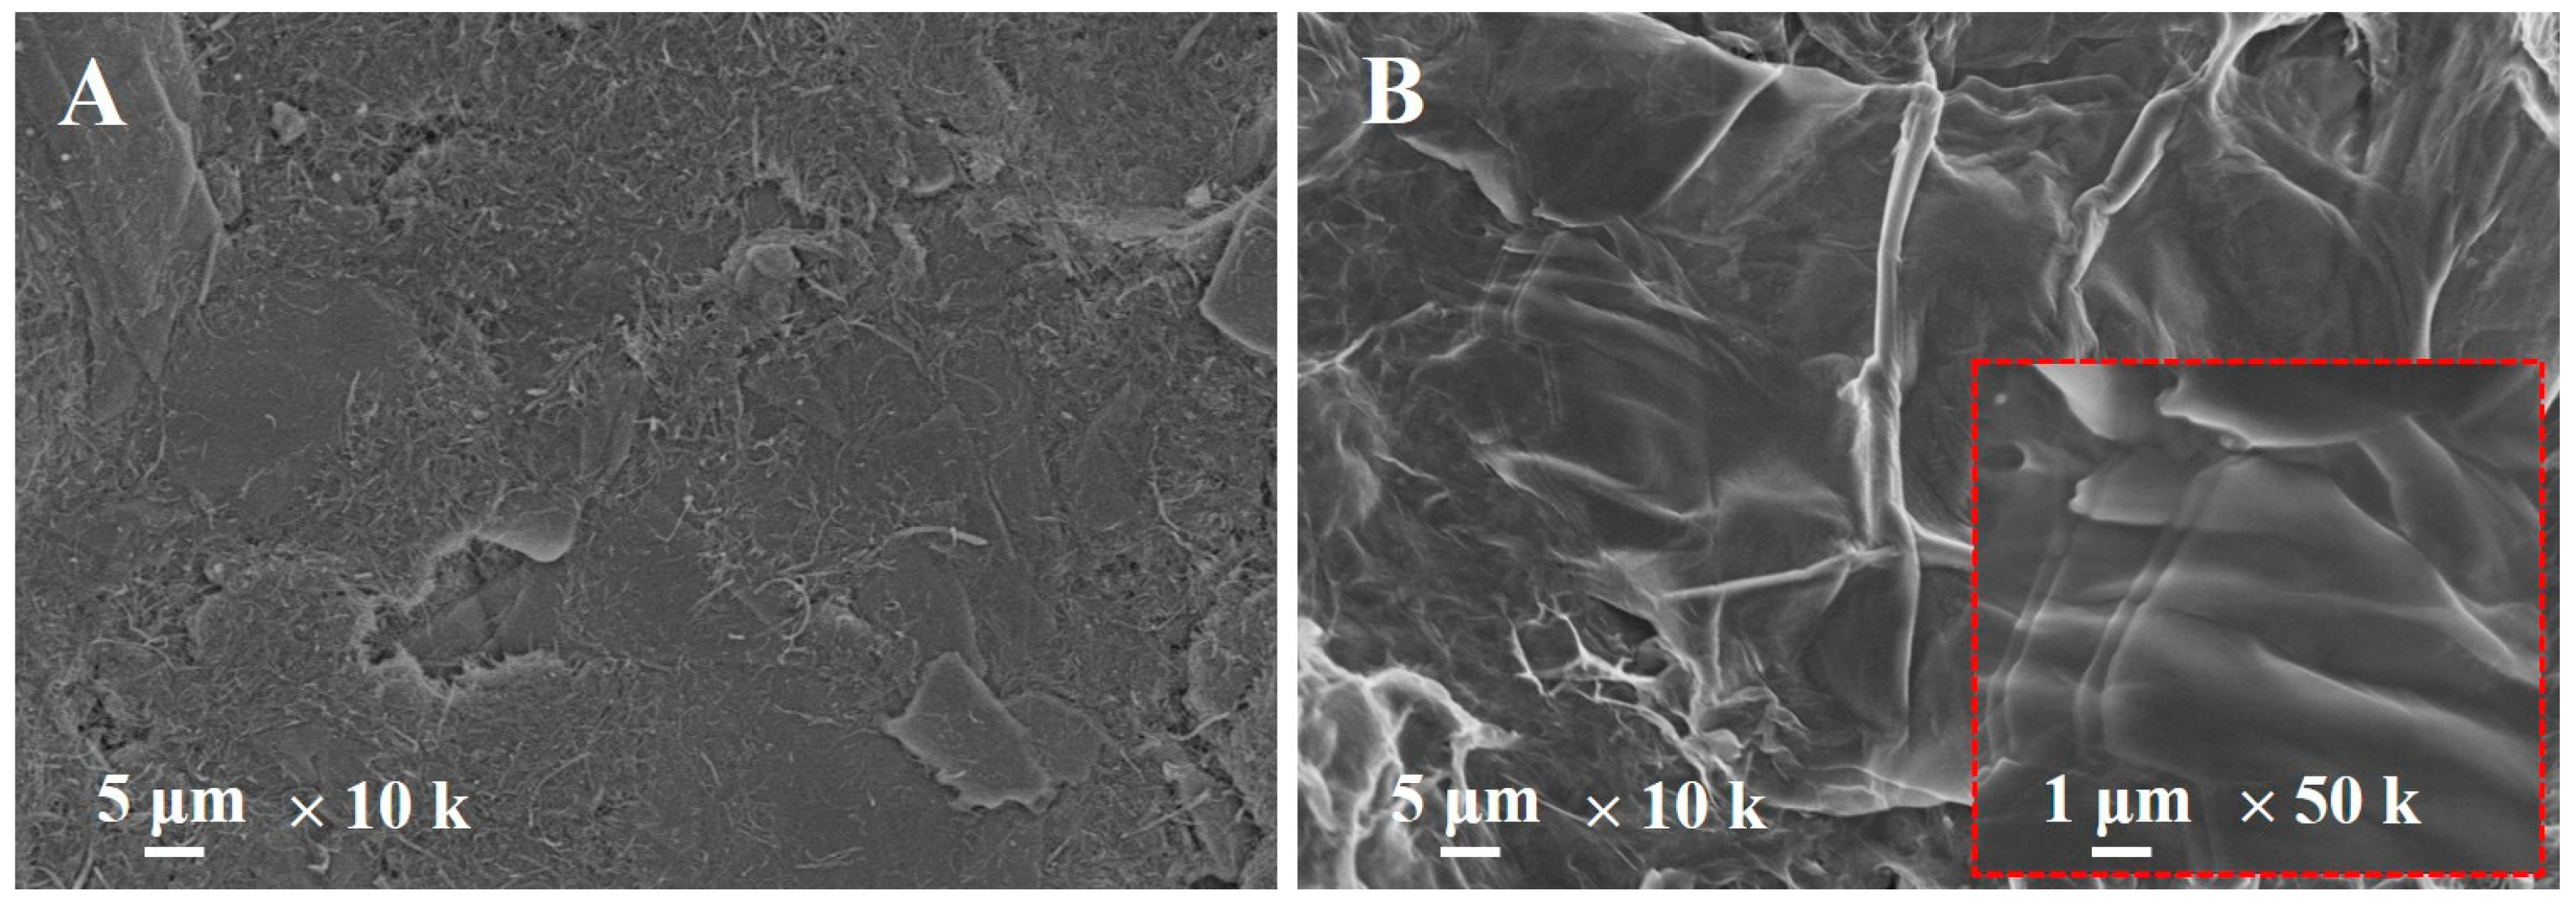
2.2. Morphological and Structural Characterization of Different Electrodes

The morphology of the different electrode surfaces was characterized via scanning electron microscopy (SEM). As shown in Figure 2A, numerous striped MWCNTs were observed on the electrode surface, indicating that the MWCNTs mixed with paraffin oil were compact. Figure 2B shows that the MWCNTs were completely obscured by a large number of bulging ERGO flakes, indicating that the effective area of the electrode was expanded, thereby improving the enrichment of HQ and CC.
The structures of ERGO and GO were characterized using XPS and Raman spectroscopy. As shown in Figure 3A,B, the intensity of the C1s peaks corresponding to oxygen-bound carbon atoms in ERGO was significantly reduced compared to GO, indicating that the electrochemical reduction was relatively thorough and most of the oxygen-containing groups were removed. To further understand the electronic properties of graphite, GO, and ERGO, Raman spectra were analyzed (Figure 3C). The G peak corresponds to the in-plane vibration of the E2g symmetric mode of carbon–carbon bonding in graphite crystals, and its presence indicates higher crystal quality. The D peak originates from the vibration of the A1g symmetric mode due to lattice defects or the irregular arrangement of carbon atoms, with a stronger D peak indicating greater structural defects [42]. Therefore, the defects in graphite, GO, and ERGO increase sequentially, suggesting that the electrochemical reduction of GO further increases the structural defects resulting from graphite oxidation.

2.3. Electrochemical Behavior of the Modified Electrode

Cyclic voltammetry (CV) is an electrochemical technique used to measure the current response of a redox-active solution to a linearly cycled potential sweep using a potentiostat. It is a useful method for quickly obtaining information about the kinetics of electron transfer reactions. Using [Fe(CN)6]3−/4− as a probe, cyclic voltammetry was applied to investigate the electrochemical properties of different electrodes. As shown in Figure 4A, only a weak redox peak was observed on the bare MWCNTPE (solid line). However, following modification with ERGO, the redox current increased significantly (dashed line). This change is attributed to the excellent electrical conductivity, large active area, and residual oxygen functional groups of the ERGO films [43,44].
Electrochemical impedance spectroscopy (EIS) was further used to investigate the interface properties of the electrode surfaces. In a typical Nyquist plot, the EIS curve consists of two parts. One is a semicircle in the high-frequency region, which is usually controlled by diffusion. The other is a straight line in the low-frequency region, which is related to electron transfer resistance. The diameter of the semicircle is positively correlated with electron transfer resistance [45]. In Figure 4B, [Fe(CN)6]3−/4− was used as a redox probe to study the surface characteristics of different electrodes. The semicircle diameter of the bare MWCNTPE is larger than that of the ERGO/MWCNTPE, which indicates that the electrical conductivity of the ERGO/MWCNTPE is better. This finding is attributed to the excellent electrical conductivity of both MWCNTs and ERGO. The results are consistent with the CV curves, which further proved that ERGO-MWCNTs effectively improve electrical conductivity and accelerate electron transfer.
The electrocatalytic performance of different electrodes was investigated by using cyclic voltammetry in 0.2 M PBS buffer solution (pH = 6) containing 0 mM or 0.1 mM CC and HQ. The results are shown in Figure 4C,D. When no CC and HQ were present in the electrolyte solution, almost no electrochemical response was observed. When 0.1 mM CC and HQ were present in the electrolyte solution, two distinct oxidation peaks for CC and HQ were observed on the ERGO/MWCNTPE: Epa(CC) = 0.223 V, Ipa(CC) = 0.769 μA, Epc(CC) = 0.179 V, and Ipc(CC) = 0.494 μA for CC, and Epa(HQ) = 0.105 V, Ipa(HQ) = 0.508 μA, Epc(HQ) = 0.059 V, and Ipc(HQ) = 0.418 μA for HQ. This finding indicates that a quasi-reversible reaction occurs on the surface of the ERGO/MWCNTPE. However, only one oxidation peak was observed on the bare MWCNTPE with the following parameters: Epa = 0.265 V, Ipa = 0.099 μA, Epc(HQ) = 0.000 V, Ipc(HQ) = 0.033 μA, Epc(CC) = 0.127 V, and Ipc(CC) = 0.020 μA. These findings indicate that bare MWCNTCPE cannot separate the oxidation peaks of CC and HQ. In contrast, the ERGO/MWCNTPE demonstrates strong catalysis and high separation of the oxidation peak for CC and HQ. This is attributed to the oxygen-containing functional groups and defect structures of ERGO, as well as the high conductivity, electron transfer kinetics and catalytic activity of ERGO-MWCNTs.

2.4. Optimization of Experimental Conditions

The electrode optimization processes are detailed in the Supplementary Materials. The optimal conditions were as follows: (1) a 1 mg∙mL−1 of GO dispersion with 10 cycles for ERGO preparation (Figure S1A,B); (2) a 0.2 M PBS buffer solution with a pH of 6.0 as the supporting electrolyte (Figures S1E and S2); (3) −0.2 V for enrichment potential (Figure S1D) and 50 s for enrichment time (Figure S1C). The response of the sensor in this work is a little slow, which could be accelerated through using a smaller electrochemical cell in our future research.

2.5. Influence of the pH Value of the Electrolyte

Square wave voltammetry (SWV) is certainly one of the most advanced and versatile forms of pulse voltammetry. It offers high analytical sensitivity and speed of measurement [46]. The pH value of the electrolyte affects the electrostatic interaction between the sensing interface; CC or HQ was investigated via SWV (Figure 5A,B). Within the pH range of 3.0 to 8.0, the peak potential (Epa) of CC and HQ decreased linearly with increasing pH (Epa, CC (V) = 0.575–0.059 pH, R2 = 0.99, Epa, HQ (V) = 0.462–0.060 pH, and R2 = 0.99) (Figure 5C,D). This finding indicates that protons are involved in the electrochemical redox processes of CC and HQ at the sensing interface, and that the number of protons and transferred electrons involved in the electrochemical oxidation of CC and HQ are the same [47].

2.6. Influence of the Scan Rate

To analyze the electrochemical reaction kinetics of HQ and CC on the surface of the ERGO/MWCNTPE, the influence of the scan rates on the responses of HQ and CC was studied under optimized conditions using CV (Figure 6A). The oxidation peak currents (Ipa) and reduction peak currents (Ipc) of HQ and CC showed good linear relationships with the square root of the scan rate (v1/2). The relationships are as follows: Ipa, HQ (μA) = −14.92 v1/2 + 1.01 (R2 = 0.99), Ipc, HQ (μA) = 10.28 v1/2 − 0.48 (R2 = 0.99) for HQ (Figure 6B), and Ipa, CC (μA) = −11.7 v1/2 + 0.96 (R2 = 0.99), Ipc, CC (μA) = 17.17 v1/2 − 1.59 (R2 = 0.99) for CC (Figure 6C). The above results indicate a diffusion-controlled process on the surface of the modified electrode [48]. As shown in Figure 6D,E, the electrochemical reactions of HQ and CC on the sensing interface are quasi-reversible. The linear relationships between Ep and the natural logarithm of the scan rate (lnv) are Epa, HQ (V) = 0.015 lnv (V∙s−1) + 0.13 (R2 = 0.99), Epc, HQ (V) = −0.008 lnv (V∙s−1) + 0.03 (R2 = 0.99) for HQ, and Epa, CC (V) = 0.012 lnv (V∙s−1) + 0.24 (R2 = 0.99), Epc, CC (V) = −0.010 lnv (V∙s−1) + 0.14 (R2 = 0.99) for CC.
According to Nicholson’s theory [49], for quasi-reversible electrochemical reaction processes controlled by diffusion, the redox peak potential is linearly related to the natural logarithm of the scan rate by the following equation:
E p a = E θ + R T α n F 0.781 + ln D 1 / 2 k θ + ln α n F v R T 1 / 2
E p c = E θ R T 1 α n F 0.781 + ln D 1 / 2 k θ + ln 1 α n F v R T 1 / 2
where E θ is the formal potential, α is the electron transfer coefficient, k θ is the standard rate constant, n is the electron transfer number, F is the Faraday constant, D is the diffusion coefficient, and T is the absolute temperature.
We calculated the transfer number of electrons (n) for HQ and CC, which were 2.4 (≈2) and 2.3 (≈2), and the α values, which were 0.358 and 0.454, respectively. Based on the conclusion in Section 2.5, the possible reaction mechanism of CC and HQ on the ERGO/MWCNTPE is shown in Figure 7, which is consistent with results reported in the literature [50].

2.7. Adsorption Quantity of CC on Different Electrodes

Chronocoulometry is an electrochemical technique in which a constant potential is set. It can be used to determine the adsorbed number of active species in a solution of freely diffusing active species. The electrochemical adsorption behavior of CC and HQ on both the bare MWCNTPE and the ERGO/MWCNTPE was investigated using chronocoulometry (Figure S3A,C). As shown in Figure S3B,D, the linear regression equations of the charge Q and t1/2 were QMWCNTPE (μC) = 1.03 t1/2(s1/2) − 1.16 (R2 = 0.99), QERGO/MWCNTPE (μC) = 125.95 t1/2(s1/2) − 151.66 (R2 = 0.99) for CC, and QMWCNTPE (μC) = 1.04 t1/2(s1/2) − 1.18 (R2 = 0.99), QERGO/MWCNTPE (μC) = 125.47 t1/2(s1/2) − 147.96 (R2 = 0.99) for HQ.
We combined these results with the Anson equation [51]:
Q = 2 n c F A D 0 1 / 2 t 1 / 2 π 1 / 2 + Q d l + n F A Γ 0
where n is the electron transfer number, c is the concentration of HQ or CC, F is the Faraday constant, D 0 is the diffusion coefficient of HQ or CC, n F A Γ 0 is the Faraday charge induced by the surface adsorbent, Q d l is the charge of the double electric layer, and A is the electrode surface area. Based on the results shown in Figure S4 [52,53], the effective areas (A) of the bare MWCNTPE and the ERGO/MWCNTPE were calculated to be 5.17 × 10⁻³ cm2 and 9.876 × 10⁻³ cm2, respectively. Using Equation (3), the saturated adsorption capacity ( Γ 0 ) for HQ and CC on the bare MWCNTPE and the ERGO/MWCNTPE were calculated as follows: 1.18 × 10⁻⁹ mol∙cm−2, 7.76 × 10⁻⁸ mol∙cm−2 for HQ, and 1.16 × 10⁻⁹ mol∙cm−2, 7.76 × 10⁻⁸ mol∙cm−2 for CC. The adsorption quantity of HQ and CC on the ERGO/MWCNTPE was approximately 80 times greater than that on the bare MWCNTPE, indicating a significant contribution of ERGO to the enrichment of HQ and CC.

2.8. Individual and Simultaneous Determination of CC and HQ

Differential pulse voltammetry (DPV) is an electrochemical technique with high sensitivity and resolution for detecting low concentrations of compounds. Therefore, the linear range, selectivity, and detection limits of the sensor were investigated through multiple DPV measurements in a 0.2 M PBS solution (pH = 6.0) under optimal experimental conditions. As shown in Figure 8A, with the response of HQ fixed at 50 μM and CC varying from 3 μM to 200 μM, the calibrated linear regression equation for CC was Ip(μA) = 0.20 c (μM) − 0.13 (R2 = 0.99) (Figure 8D). Figure 8B shows that with the response of CC fixed at 50 μM and HQ varying from 3 μM to 200 μM, the calibrated linear regression equation for HQ was Ip (μA) = 0.29 c (μM) − 0.74 (R2 = 0.99) (Figure 8E). This indicates that selective determination of one analyte in the presence of the other is feasible.
The feasibility of the simultaneous determination of CC and HQ using this modified electrode was evaluated in multiple ways. The response obtained with DPV when the concentrations of CC and HQ were varied simultaneously is shown in Figure 8C. The calibrated linear regression equations for CC and HQ were Ip, CC (μA) = 0.12 c (μM) + 0.24 (R2 = 0.99) (0.4–400 μM) and Ip, HQ (μA) = 0.14 c (μM) + 4.56 (R2 = 0.99) (0.4–400 μM), respectively (Figure 8F). The detection limits of CC and HQ were 0.083 μM and 0.028 μM (S/N = 3), respectively. This indicates that the ERGO/MWCNTPE can be used for the separation and simultaneous determination of CC and HQ. As shown in Table 1, compared with other reported electrochemical sensors for CC and HQ, our sensor not only offers the advantage of easy preparation but also has low detection limits.

2.9. Reproducibility, Repeatability, and Selectivity

The reproducibility and repeatability of the sensor were examined using SWV. The relative standard deviations (RSDs) were 5.65% and 4.73% for one ERGO/MWCNTPE used for the parallel determination of 0.1 mM HQ and CC (Figure 9A) over six measurements. For six different ERGO/MWCNTPEs used for the parallel measurement of 0.1 mM HQ and CC (Figure 9B), the RSDs were 5.5% and 1.18%. The literature studies suggest that the peak around −0.17 V is likely due to benzoquinone. These results indicate the good reproducibility and repeatability of the sensor.
In addition, the selectivity measurements showed no interference for 0.1 mM HQ and CC (containing 0.3 mM Na+) by 0.1 mM benzene (Ben) and naphthalene (Nap), 0.5 mM glucose (Glu), ascorbic acid (AA), toluene (Tol), uric acid (UA), 8-hydroxyquinoline (8-HQ) or 10 mM Ca2+, Mg2+, and K+, with RSDs of less than 5% (Figure 9C). The good selectivity may be due to the fact that HQ and CC are small polar molecules that can strongly interact with the oxygen functional groups (such as hydroxyl and carboxyl) and defect structures of ERGO through mechanisms involving hydrogen bonds, π-π interactions and adsorption, in addition to the good peak separation of ERGO.

2.10. Real Sample Analysis

In order to verify the practicality of the sensor, the CC and HQ contents in the tap water sample and urine sample were determined using the standard addition method with DPV. The results are shown in Table 2. The sensors demonstrated good recoveries for each sample. The average recoveries of HQ and CC were 98.9% and 100.5% for the tap water sample, and 100.1% and 100.6% for the urine sample, respectively, and the RSDs were both lower than 5.0%, indicating the sensor’s high accuracy and its potential for preventing water pollution and human health monitoring.

3. Materials and Methods

3.1. Reagents and Samples

Graphene oxide (GO), sodium dihydrogen phosphate dihydrate (NaH2PO4·2H2O), disodium hydrogen phosphate dodecahydrate (Na2HPO4·12H2O), glucose (Glu) and ascorbic acid (AA) were purchased from Shanghai Yuanye Bio-Technology Co., Ltd. (Shanghai, China). Multi-walled carbon nanotube (MWCNT, Ø = 10–20 nm purity ≥ 95 wt%) powder was bought from Suzhou Carbonfund Graphene Technology Co., Ltd. (Suzhou, China). Catechol (CC) and uric acid (UA) were purchased from Aladdin Reagent Co., Ltd. (Shanghai, China). Hydroquinone (HQ), K3[Fe(CN)6], K4[Fe(CN)6], KCl, NaCl, CuCl2, MgCl2, graphite, benzene (Ben), naphthalene (Nap), toluene (Tol) and 8-hydroxyquinoline (8-HQ) were bought from Sinopharm Chemical Reagent Co., Ltd. (Shanghai, China). Liquid paraffin was purchased from Jiangsu Qiangsheng Functional Chemical Co., Ltd. (Changshu, China). Copper wire was purchased from the local supermarket. All reagents were of analytical grade and used without further purification. All solutions were prepared with ultra-pure water. The tap water sample was prepared by injecting a quantity of tap water into a small beaker and diluting it to 5 mL with 0.2 M PBS buffer (pH = 6). The tap water was collected from our laboratory. The urine sample was taken from a healthy volunteer when it was ethically permissible to do so and was diluted to the desired concentration with 0.2 M PBS buffer (pH = 6) as the supporting electrolyte.

3.2. Apparatus

Scanning electron microscope (SEM) of the WMCNTs and ERGO was carried out with an FEI-Sirion200 (FEI, Hillsboro, OR, USA). X-ray photoelectron spectroscopy (XPS) measurements were carried out on an ESCALAB Xi+ X-ray photoelectron spectrometer (Thermo Fisher Scientific, Waltham, MA, USA). Raman spectroscopy was carried out by the inVia Qontor (Renishaw PLC, Wotton-under-Edge, UK) (532 nm and 0.5 laser power). Electrochemical impedance spectroscopy (EIS) was carried out with a Zennium electrochemical workstation (Zahner, Kronach, German). Electrochemical measurements were carried out with a CHI 830D electrochemical workstation (Chenhua Instrument Co., Ltd., Shanghai, China). The conversion of chemical data into electrical signals was facilitated by CHI830D (22.04) software and the data were calibrated and processed using Origin 2022 (9.90.225) software. A typical three-electrode cell with a 5 mL volume was used for all electrochemical experiments, with a bare or modified electrode as the working electrode, a platinum wire as the counter electrode, and a saturated calomel electrode (SCE) as the reference electrode. The analytical techniques used were cyclic voltammetry (CV), square wave voltammetry (SWV), differential pulse voltammetry (DPV), and electrochemical impedance spectroscopy (EIS).

3.3. Preparation of Carbon Paste Microelectrodes

3.3.1. Fabrication of Bare MWCNTPEs

Bare MWCNTPEs were fabricated according to methods listed in the literature [63]. First, homemade microelectrodes were fabricated by inserting a copper wire (Φ = 500 μm) into a pipette with a tip diameter of 100 μm, burning and melting the tail end of the pipette by using an alcohol lamp, and followed by natural cooling to fix the copper wire. Thereafter, MWCNT paste was obtained by mixing 5 mg MWCNT powder with 15 μL of liquid paraffin and grinding the mixture by hand in a small agate mortar until a homogeneous paste was obtained. Lastly, a quantity of MWCNT paste was packed into the homemade microelectrode, and the electrode surface was polished manually on a piece of weighting paper until it was smooth and shiny.
To renew the surface of the carbon paste microelectrodes, they were first sonicated in ethanol for 3 min to remove the old carbon paste, and then the new paste was packed into the microelectrodes.

3.3.2. Fabrication of the ERGO/MWCNTPE

First, 2 mg of GO was dispersed in 1 mL of ultra-pure water and sonicated for 3 h. Afterward, the denoted GO solution was obtained by mixing the dispersed GO solution with 0.1 M phosphate-buffer solution (pH = 7.4) in a 1:1 ratio. To fabricate the ERGO/MWCNTPEs, the MWCNTPE was placed in 5 mL of a 1 mg∙mL−1 GO solution. Cyclic voltammetry was performed for 10 cycles at a scan rate of 100 mV∙s−1 in the range of 0 to −1.7 V (vs. SCE), followed by drying at room temperature.

3.4. Statistical Analysis

The peak currents of three replications of all experiments are expressed as the mean ± SD. Statistical analysis was performed using Origin 2022 (9.90.225) (OriginLab Corporation, Northampton, MA, USA), with the statistical significance level set to α < 0.05. Linear baseline correction was applied to address the peak shoulder overlap of CC and HQ resulting from molecular competition. Real sample analysis was performed on tap water and urine samples using the standard addition method to assess the accuracy of the developed sensors.

4. Conclusions

A novel electrochemical sensor for the simultaneous detection of CC and HQ was achieved in this work based on an electrochemically reduced graphene oxide (ERGO)-modified disposable MWCNT carbon paste microelectrode using one-step electrodeposition. The ERGO-MWCNT exhibits a high specific surface area, catalytic activity, and electrical conductivity. The sensing interface was characterized, the sensing mechanism was discussed, and the performance of the sensor was evaluated. The sensor offers advantages such as simple operation, low cost, and good performance, including high sensitivity, selectivity, and accuracy. It has promising applications in environmental protection and human health monitoring. Moreover, the use of a disposable carbon paste electrode and ERGO in the construction of an electrochemical sensor for the simultaneous detection of CC and HQ may provide a new approach for developing electrochemical sensors for environmental estrogens and benzene metabolite phenol in humans.

Supplementary Materials

The following supporting information can be downloaded at https://www.mdpi.com/article/10.3390/ijms25189829/s1.

Author Contributions

Conceptualization, methodology, investigation and writing—original draft preparation, T.C. and C.L.; software, formal analysis and visualization, X.L. resources, data curation and validation, C.Z. supervision, writing—review and editing, D.Z. All authors have read and agreed to the published version of the manuscript.

Funding

This work was supported by the National Natural Science Foundation of China (Nos. 61501526, 21804146 and 22004134), the Fundamental Research Funds for the Central Universities, South-Central Minzu University (No. CZZ24004), Wuhan Qinji Intelligent Technology Co., Ltd. (HZY21073), and Wuhan Jingshi Telemetry Technology Co., Ltd. (HZY22134).

Institutional Review Board Statement

Not applicable.

Informed Consent Statement

Not applicable.

Data Availability Statement

Data are contained within the article or Supplementary Material.

Conflicts of Interest

The authors declare no conflicts of interest.

References

  1. Lindsay, R.H.; Hill, J.B.; Gaitan, E.; Cooksey, R.C.; Jolley, R.L. Antithyroid effects of coal-derived pollutants. J. Toxicol. Environ. Health 1992, 37, 467–481. [Google Scholar] [CrossRef] [PubMed]
  2. Lee, B.L.; Ong, H.Y.; Shi, C.Y.; Ong, C.N. Simultaneous determination of hydroquinone, catechol and phenol in urine using high-performance liquid chromatography with fluorimetric detection. J. Chromatogr. B 1993, 619, 259–266. [Google Scholar] [CrossRef] [PubMed]
  3. Diamanti-Kandarakis, E.; Bourguignon, J.P.; Giudice, L.C.; Hauser, R.; Prins, G.S.; Soto, A.M.; Zoeller, R.T.; Gore, A.C. Endocrine-disrupting chemicals: An Endocrine Society scientific statement. Endocr. Rev. 2009, 30, 293–342. [Google Scholar] [CrossRef] [PubMed]
  4. Kaneva, M.; Levshakova, A.; Tumkin, I.; Fatkullin, M.; Gurevich, E.; Manshina, A.; Rodriguez, R.D.; Khairullina, E. Simultaneous electrochemical detection of hydroquinone and catechol using flexible laser-induced metal-polymer composite electrodes. Microchem. J. 2024, 204, 111106. [Google Scholar] [CrossRef]
  5. Huang, H.; Chen, Y.; Chen, Z.; Chen, J.; Hu, Y.; Zhu, J.-J. Electrochemical sensor based on Ce-MOF/carbon nanotube composite for the simultaneous discrimination of hydroquinone and catechol. J. Hazard. Mater. 2021, 416, 125895. [Google Scholar] [CrossRef]
  6. Ni, Y.; Xia, Z.; Kokot, S. A kinetic spectrophotometric method for simultaneous determination of phenol and its three derivatives with the aid of artificial neural network. J. Hazard. Mater. 2011, 192, 722–729. [Google Scholar] [CrossRef]
  7. Patil, S.K.; Patil, S.A.; Vadiyar, M.M.; Awale, D.V.; Sartape, A.S.; Walekar, L.S.; Kolekar, G.B.; Ghorpade, U.V.; Kim, J.H.; Kolekar, S.S. Tailor-made dicationic ionic liquid as a fluorescent sensor for detection of hydroquinone and catechol. J. Mol. Liq. 2017, 244, 39–45. [Google Scholar] [CrossRef]
  8. Chen, T.-S.; Liou, S.-Y.; Kuo, W.-W.; Wu, H.-C.; Jong, G.-P.; Wang, H.-F.; Shen, C.-Y.; Padma, V.V.; Huang, C.-Y.; Chang, Y.-L. Rapid method for the quantification of hydroquinone concentration: Chemiluminescent analysis. Luminescence 2015, 30, 947–949. [Google Scholar] [CrossRef]
  9. Marrubini, G.; Calleri, E.; Coccini, T.; Castoldi, A.F.; Manzo, L. Direct analysis of phenol, catechol and hydroquinone in human urine by coupled-column hplc with fluorimetric detection. Chromatographia 2005, 62, 25–31. [Google Scholar] [CrossRef]
  10. Han, B.; Chen, Y.; Wang, H.; Yan, J.; Liu, G.; Huang, Z.; Zhou, C. A Biosensor for Simultaneous Detection of Epinephrine and Ascorbic Acid Based on Fe(III)–Polyhistidine-Functionalized Multi-Wall Carbon Nanotube Composites. Int. J. Mol. Sci. 2024, 25, 7883. [Google Scholar] [CrossRef]
  11. Ganjali, M.R.; Motakef-Kazami, N.; Faridbod, F.; Khoee, S.; Norouzi, P. Determination of Pb2+ ions by a modified carbon paste electrode based on multi-walled carbon nanotubes (MWCNTs) and nanosilica. J. Hazard. Mater. 2010, 173, 415–419. [Google Scholar] [CrossRef] [PubMed]
  12. Niranjana, J.S.; Koyakutty, H.; Thomas, A.A.; Bushiri, M.J. Novel synthesis of multi-layered rGO/Fe3O4 nanocomposite in a single step and its efficient electrochemical sensing of vitamin C. Mater. Sci. Eng. B 2023, 290, 116283. [Google Scholar] [CrossRef]
  13. Medetalibeyoglu, H.; Kotan, G.; Atar, N.; Yola, M.L. A novel sandwich-type SERS immunosensor for selective and sensitive carcinoembryonic antigen (CEA) detection. Anal. Chim. Acta 2020, 1139, 100–110. [Google Scholar] [CrossRef]
  14. Chen, T.; Zhang, S.; Zhu, C.; Liu, C.; Liu, X.; Hu, S.; Zheng, D.; Zhang, J. Application of surfactants in the electrochemical sensing and biosensing of biomolecules and drug molecules. Anal. Methods 2024, 16, 3607–3619. [Google Scholar] [CrossRef] [PubMed]
  15. Song, Y.; Zhao, M.; Wang, X.; Qu, H.; Liu, Y.; Chen, S. Simultaneous electrochemical determination of catechol and hydroquinone in seawater using Co3O4/MWCNTs/GCE. Mater. Chem. Phys. 2019, 234, 217–223. [Google Scholar] [CrossRef]
  16. Sun, L.; Guo, H.; Pan, Z.; Liu, B.; Zhang, T.; Yang, M.; Wu, N.; Zhang, J.; Yang, F.; Yang, W. In-situ reducing platinum nanoparticles on covalent organic framework as a sensitive electrochemical sensor for simultaneous detection of catechol, hydroquinone and resorcinol. Colloids Surf. A 2022, 635, 128114. [Google Scholar] [CrossRef]
  17. Yue, Y.; Hu, G.; Zheng, M.; Guo, Y.; Cao, J.; Shao, S. A mesoporous carbon nanofiber-modified pyrolytic graphite electrode used for the simultaneous determination of dopamine, uric acid, and ascorbic acid. Carbon 2012, 50, 107–114. [Google Scholar] [CrossRef]
  18. Wong, A.; Santos, A.M.; Cardenas-Riojas, A.A.; Baena-Moncada, A.M.; Sotomayor, M.D.P.T. Voltammetric sensor based on glassy carbon electrode modified with hierarchical porous carbon, silver sulfide nanoparticles and fullerene for electrochemical monitoring of nitrite in food samples. Food Chem. 2022, 383, 132384. [Google Scholar] [CrossRef]
  19. Anagawadi, R.B.; Mahanthesha, K.R. Glycine functionalized multiwalled carbon nanotube modified carbon paste electrode for the selective determination of Norepinephrine: A Voltammetric study. Results Chem. 2024, 7, 101479. [Google Scholar] [CrossRef]
  20. Mǎgeruşan, L.; Pogǎcean, F.; Cozar, B.-I.; Tripon, S.-C.; Pruneanu, S. Harnessing graphene-modified electrode sensitivity for enhanced ciprofloxacin detection. Int. J. Mol. Sci. 2024, 25, 3691. [Google Scholar] [CrossRef]
  21. Sun, C.-L.; Lai, S.-Y.; Tsai, K.-J.; Wang, J.; Zhou, J.; Chen, H.-Y. Application of nanoporous core–shell structured multi-walled carbon nanotube–graphene oxide nanoribbons in electrochemical biosensors. Microchem. J. 2022, 179, 107586. [Google Scholar] [CrossRef]
  22. Kumara Swamy, N.; Narasimha Shetty Mohana, K.; Madhusudana, A.M.; Manjunatha, J.G.; Manukumar, H.M. Graphene nanoribbon derived from multi-walled carbon nanotube: An efficient viral gene hosting and biosensing molecular platform for the electroanalysis of HIV-1 gene. Results Chem. 2024, 7, 101393. [Google Scholar] [CrossRef]
  23. Settu, K.; Lai, Y.-C.; Liao, C.-T. Carbon nanotube modified laser-induced graphene electrode for hydrogen peroxide sensing. Mater. Lett. 2021, 300, 130106. [Google Scholar] [CrossRef]
  24. Yi, K.; Xu, S.; Cheng, H.; Chen, S.; Jiang, S.; Tu, J. A label-free sensor based on a carbon nanotube-graphene platform for the detection of non-Hodgkin lymphoma genes. Alex. Eng. J. 2023, 84, 93–99. [Google Scholar] [CrossRef]
  25. Akkarachanchainon, N.; Rattanawaleedirojn, P.; Chailapakul, O.; Rodthongkum, N. Hydrophilic graphene surface prepared by electrochemically reduced micellar graphene oxide as a platform for electrochemical sensor. Talanta 2017, 165, 692–701. [Google Scholar] [CrossRef]
  26. Pei, S.; Cheng, H.-M. The reduction of graphene oxide. Carbon 2012, 50, 3210–3228. [Google Scholar] [CrossRef]
  27. Khan, M.U.; Shaida, M.A. Reduction mechanism of graphene oxide including various parameters affecting the C/O ratio. Mater. Today Commun. 2023, 36, 106577. [Google Scholar] [CrossRef]
  28. Chua, C.K.; Pumera, M. Chemical reduction of graphene oxide: A synthetic chemistry viewpoint. Chem. Soc. Rev. 2014, 43, 291–312. [Google Scholar] [CrossRef]
  29. Sengupta, I.; Chakraborty, S.; Talukdar, M.; Pal, S.K.; Chakraborty, S. Thermal reduction of graphene oxide: How temperature influences purity. J. Mater. Res. 2018, 33, 4113–4122. [Google Scholar] [CrossRef]
  30. Toh, S.Y.; Loh, K.S.; Kamarudin, S.K.; Daud, W.R.W. Graphene production via electrochemical reduction of graphene oxide: Synthesis and characterisation. Chem. Eng. J. 2014, 251, 422–434. [Google Scholar] [CrossRef]
  31. Mollarasouli, F.; Kurbanoglu, S.; Asadpour-Zeynali, K.; Ozkan, S.A. Preparation of porous Cu metal organic framework/ZnTe nanorods/Au nanoparticles hybrid platform for nonenzymatic determination of catechol. J. Electroanal. Chem. 2020, 856, 113672. [Google Scholar] [CrossRef]
  32. Wang, Y.; Fu, Q.; Chen, J.; Lin, Y.; Yang, Y.; Wang, C.; Xie, Y.; Zhao, P.; Fei, J. Temperature-controlled electrochemical sensor based on environmentally responsive polymer/BiPO4/BiOCl/multi-walled carbon nanotube composite for the detection of catechol in water. Colloids Surf. A 2023, 657, 130543. [Google Scholar] [CrossRef]
  33. Yu, S.; Liu, S.; Jiang, X.; Yang, N. Recent advances on electrochemistry of diamond related materials. Carbon 2022, 200, 517–542. [Google Scholar] [CrossRef]
  34. Chen, G. Application of carbon based material for the electrochemical detection of heavy metal ions in water environment. Int. J. Electrochem. Sci. 2020, 15, 4252–4263. [Google Scholar] [CrossRef]
  35. Michalkiewicz, S.; Skorupa, A.; Jakubczyk, M. Carbon materials in electroanalysis of preservatives: A review. Materials 2021, 14, 7630. [Google Scholar] [CrossRef]
  36. Famá, L.; Pettarin, V.; Goyanes, S.; Bernal, C. Starch/multi-walled carbon nanotubes composites with improved mechanical properties. Carbohydr. Polym. 2011, 83, 1226–1231. [Google Scholar] [CrossRef]
  37. Vengurlekar, S.; Chaturvedi, S.C. Chapter 10—Elevating toward a new innovation: Carbon nanotubes (CNTs). In Biomedical Applications of Nanoparticles; Grumezescu, A.M., Ed.; William Andrew Publishing: Norwich, NY, USA, 2019; pp. 271–294. [Google Scholar]
  38. Kanagaraj, R.; John, S.A. Highly sensitive determination of nitrite using FMWCNTs-conducting polymer composite modified electrode. Sens. Actuators B 2015, 215, 119–124. [Google Scholar] [CrossRef]
  39. Ali, T.A.; Mohamed, G.G. Determination of Mn(II) ion by a modified carbon paste electrode based on multi-walled carbon nanotubes (MWCNTs) in different water samples. Sens. Actuators B 2014, 202, 699–707. [Google Scholar] [CrossRef]
  40. Malode, S.J.; Sharma, P.; Hasan, M.R.; Shetti, N.P.; Mascarenhas, R.J. 4—Carbon and carbon paste electrodes. In Electrochemical Sensors; Maruccio, G., Narang, J., Eds.; Woodhead Publishing: Cambridge, UK, 2022; pp. 79–114. [Google Scholar]
  41. Yang, L.; Liu, D.; Huang, J.; You, T. Simultaneous determination of dopamine, ascorbic acid and uric acid at electrochemically reduced graphene oxide modified electrode. Sens. Actuators B 2014, 193, 166–172. [Google Scholar] [CrossRef]
  42. Pourmoghaddam, N.; Ayas, N. Synthesis, structure characterization, and electrochemical hydrogen storage of reduced graphene oxide and graphene. Int. J. Hydrog. Energy 2024, 82, 1422–1434. [Google Scholar] [CrossRef]
  43. Pumera, M. Graphene-based nanomaterials and their electrochemistry. Chem. Soc. Rev. 2010, 39, 4146–4157. [Google Scholar] [CrossRef] [PubMed]
  44. Pumera, M. Electrochemistry of graphene: New horizons for sensing and energy storage. Chem. Rec. 2009, 9, 211–223. [Google Scholar] [CrossRef] [PubMed]
  45. Li, C.; Liu, W.; Gu, Y.; Hao, S.; Yan, X.; Zhang, Z.; Yang, M. Simultaneous determination of catechol and hydroquinone based on poly(sulfosalicylic acid)/functionalized graphene modified electrode. J. Appl. Electrochem. 2014, 44, 1059–1067. [Google Scholar] [CrossRef]
  46. Mirceski, V.; Skrzypek, S.; Stojanov, L. Square-wave voltammetry. ChemTexts 2018, 4, 17. [Google Scholar] [CrossRef]
  47. Li, J.; Qu, J.; Yang, R.; Qu, L.; Harrington, P.d.B. A sensitive and selective electrochemical sensor based on graphene quantum dot/gold nanoparticle nanocomposite modified electrode for the determination of quercetin in biological samples. Electroanalysis 2016, 28, 1322–1330. [Google Scholar] [CrossRef]
  48. Ahmed, J.; Rashed, M.A.; Faisal, M.; Harraz, F.A.; Jalalah, M.; Alsareii, S.A. Novel SWCNTs-mesoporous silicon nanocomposite as efficient non-enzymatic glucose biosensor. Appl. Surf. Sci. 2021, 552, 149477. [Google Scholar] [CrossRef]
  49. Yang, M.; Guo, H.; Sun, L.; Wu, N.; Wang, M.; Yang, F.; Zhang, T.; Zhang, J.; Pan, Z.; Yang, W. Simultaneous electrochemical detection of hydroquinone and catechol using MWCNT-COOH/CTF-1 composite modified electrode. Colloids Surf. A 2021, 625, 126917. [Google Scholar] [CrossRef]
  50. Indrajith Naik, E.; Sunil Kumar Naik, T.S.; Pradeepa, E.; Singh, S.; Naik, H.S.B. Design and fabrication of an innovative electrochemical sensor based on Mg-doped ZnO nanoparticles for the detection of toxic catechol. Mater. Chem. Phys. 2022, 281, 125860. [Google Scholar] [CrossRef]
  51. Ngamchuea, K.; Eloul, S.; Tschulik, K.; Compton, R.G. Planar diffusion to macro disc electrodes—what electrode size is required for the Cottrell and Randles-Sevcik equations to apply quantitatively? J. Solid State Electrochem. 2014, 18, 3251–3257. [Google Scholar] [CrossRef]
  52. Sundfors, F.; Bobacka, J.; Ivaska, A.; Lewenstam, A. Kinetics of electron transfer between Fe(CN)63−/4− and poly(3,4-ethylenedioxythiophene) studied by electrochemical impedance spectroscopy. Electrochim. Acta 2002, 47, 2245–2251. [Google Scholar] [CrossRef]
  53. Anson, F.C. Application of potentiostatic current integration to the study of the adsorption of cobalt(iii)-(ethylenedinitrilo(tetraacetate) on mercury electrodes. Anal. Chem. 1964, 36, 932–934. [Google Scholar] [CrossRef]
  54. Liu, B.; Guo, H.; Sun, L.; Pan, Z.; Peng, L.; Wang, M.; Wu, N.; Chen, Y.; Wei, X.; Yang, W. Electrochemical sensor based on covalent organic frameworks/MWCNT for simultaneous detection of catechol and hydroquinone. Colloids Surf. A 2022, 639, 128335. [Google Scholar] [CrossRef]
  55. Erogul, S.; Bas, S.Z.; Ozmen, M.; Yildiz, S. A new electrochemical sensor based on Fe3O4 functionalized graphene oxide-gold nanoparticle composite film for simultaneous determination of catechol and hydroquinone. Electrochim. Acta 2015, 186, 302–313. [Google Scholar] [CrossRef]
  56. Velmurugan, M.; Karikalan, N.; Chen, S.-M.; Cheng, Y.-H.; Karuppiah, C. Electrochemical preparation of activated graphene oxide for the simultaneous determination of hydroquinone and catechol. J. Colloid Interface Sci. 2017, 500, 54–62. [Google Scholar] [CrossRef]
  57. Yang, C.; Chai, Y.; Yuan, R.; Xu, W.; Chen, S. Gold nanoparticle–graphene nanohybrid bridged 3-amino-5-mercapto-1,2,4-triazole-functionalized multiwall carbon nanotubes for the simultaneous determination of hydroquinone, catechol, resorcinol and nitrite. Anal. Methods 2013, 5, 666–672. [Google Scholar] [CrossRef]
  58. Zhu, J.; Fan, R.; Wang, Y.; Lv, Z.; Han, Y.; Peng, J.; Zheng, X.; Lin, R. Determination of catechol and hydroquinone by using perilla frutescens activated carbon modified glassy carbon electrode. J. Braz. Chem. Soc. 2020, 31, 25–32. [Google Scholar] [CrossRef]
  59. Zhu, Y.; Huai, S.; Jiao, J.; Xu, Q.; Wu, H.; Zhang, H. Fullerene and platinum composite-based electrochemical sensor for the selective determination of catechol and hydroquinone. J. Electroanal. Chem. 2020, 878, 114726. [Google Scholar] [CrossRef]
  60. Alshahrani, L.A.; Liu, L.; Sathishkumar, P.; Nan, J.; Gu, F.L. Copper oxide and carbon nano-fragments modified glassy carbon electrode as selective electrochemical sensor for simultaneous determination of catechol and hydroquinone in real-life water samples. J. Electroanal. Chem. 2018, 815, 68–75. [Google Scholar] [CrossRef]
  61. Si, W.; Lei, W.; Zhang, Y.; Xia, M.; Wang, F.; Hao, Q. Electrodeposition of graphene oxide doped poly(3,4-ethylenedioxythiophene) film and its electrochemical sensing of catechol and hydroquinone. Electrochim. Acta 2012, 85, 295–301. [Google Scholar] [CrossRef]
  62. Zhou, T.; Gao, W.; Gao, Y.; Wang, Q. Simultaneous determination of catechol and hydroquinone using non-enzymatic Co3O4@ carbon core/shell composites based sensor. J. Electrochem. Soc. 2019, 166, B1069. [Google Scholar] [CrossRef]
  63. Zheng, D.; Liu, X.; Zhu, S.; Cao, H.; Chen, Y.; Hu, S. Sensing nitric oxide with a carbon nanofiber paste electrode modified with a CTAB and nafion composite. Microchim. Acta 2015, 182, 2403–2410. [Google Scholar] [CrossRef]
Scheme 1. Schematic diagram showing the preparation of the ERGO/MWCNTPE and its application in the electrochemical detection of CC and HQ.
Ijms 25 09829 sch001
Figure 1. Cyclic voltammograms of the electrochemical reduction of GO on the MWCNTPE.
Ijms 25 09829 g001
Figure 2. SEM images of the bare MWCNTPE (A) and ERGO/MWCNTPE (B).
Ijms 25 09829 g002
Figure 3. XPS spectra of GO (A)and ERGO (B) and Raman spectra (C) of graphite, GO and ERGO.
Ijms 25 09829 g003
Figure 4. Cyclic voltammograms of the bare MWCNTPE and ERGO/MWCNTPE in 5.0 mM [Fe(CN)6]3−/4− solution containing 0.1 M KCl (A). EIS of the bare MWCNTPE and ERGO/MWCNTPE in 5.0 mM [Fe(CN)6]3−/4− solution containing 0.1 M KCl (B). Cyclic voltammograms of bare MWCNTPE (D) and ERGO/MWCNTPE (C) in 0.2 M PBS (pH = 6) with or without 0.1 mM CC and HQ.
Ijms 25 09829 g004
Figure 5. Square wave voltammograms of 0.1 mM CC (A) and HQ (B) in 0.2 M PBS on the ERGO/MWCNTPE at different pH values (from left to right: 3.0, 4.0, 5.0, 6.0, 7.0, and 8.0, respectively). The linear relationship between the oxidation peak potentials of CC (C) and HQ (D) and the pH of the electrolyte are shown.
Ijms 25 09829 g005
Figure 6. Cyclic voltammograms of the ERGO/MWCNTPE in 0.2 M PBS (pH = 6.0) containing 0.1 mM CC and HQ at different scan rates (from inner to outer: 0.02, 0.05, 0.08, 0.11, 0.14, 0.17, and 0.20 V∙s−1, respectively) (A). The linear relationships of the peak currents (Ip) and the square root of the scan rates (v1/2) of HQ (B) and CC (C). The linear relationships of the peak potential (Ep) and the natural logarithm of the scan rate (lnv) for HQ (D) and CC (E).
Ijms 25 09829 g006
Figure 7. The electrochemical reaction mechanism of CC and HQ on the ERGO/MWCNTPE.
Ijms 25 09829 g007
Figure 8. Differential pulse voltammograms of the ERGO/MWCNTPE in 0.2 M PBS (pH = 6.0) containing 50 μM HQ and different concentrations of CC (from inner to outer: 3, 4, 7, 10, 20, 40, 70, 100, 150 and 200 μM) (A), 50 μM CC and different concentrations of HQ (from inner to outer: 3, 4, 7, 10, 20, 40, 70, 100, 150 and 200 μM) (B), and CC and HQ of different concentrations (from inner to outer: 0.4, 4, 7, 10, 40, 70, 100, 150, 250 and 400 μM) (C). The corresponding linear relationships of the ERGO/MWCNTPE in 0.2 M PBS (pH = 6.0) containing 50 μM HQ and different concentrations of CC (3–200 μM) (D), 50 μM CC and different concentrations of HQ (3–200 μM) (E), and different concentrations of CC and HQ (0.4–400 μM) (F).
Ijms 25 09829 g008
Figure 9. Electrochemical response of 0.1 mM CC and HQ on a single ERGO/MWCNTPE for six parallel measurements (A). Electrochemical response of 0.1 mM CC and HQ on six different ERGO/MWCNTPEs (B). Evaluation of the selectivity of the sensor (C).
Ijms 25 09829 g009
Table 1. Analytical performance comparison of the ERGO/MWCNTPE for CC and HQ detection with other reported electrodes.
ElectrodesLinear Range (μM)Detection Limit (μM)Ref.
CCHQCCHQ
COFs/MWCNT/GCE4–4504–4500.360.38[54]
AuNPs/Fe3O4-GO/GCE2–1453–1370.81.1[55]
aGO/SCPE1–3501–3120.1820.27[56]
CNT-SH@Au-GR/GCE11–12655–1251.04.2[57]
PFHSAAC/GCE1–1501–2000.4230.357[58]
Ce-MOF/CNTs/GCE5–5010–1003.55.3[5]
Pt/C60/PGE50–150050–11002.972.19[59]
CuO-CNF/GCE0–1503–802.01.0[60]
PEDOT/GO/GCE2–4002.5–2001.61.6[61]
Co3O4@carbon/GCE0.6–116.40.8–127.10.030.03[62]
ERGO/MWCNTPE0.4–4000.4–4000.0830.028This work
COFs: Covalent organic frameworks; AuNPs: gold nanoparticles; aGO: activated graphene oxide; SCPE: screen-printed carbon electrode; CNT-SH@Au-GR: gold nanoparticle–graphene nanohybrid-bridged 3-amino-5-mercapto-1,2,4-triazole-functionalized multi-wall carbon nanotubes; PFHSAAC: perilla frutescens; MOF: metal–organic frameworks; CNTs: carbon nanotubes; PGE: pyrolytic graphite electrode; CNF: carbon nano-fragments; PEDOT: poly(3,4-ethylenedioxythiophene).
Table 2. Application of the sensor in the detection of CC and HQ in tap water sample and urine sample (n = 3).
SampleAdded (μM)Found (μM)Recovery (%)RSD (%)
HQCCHQCCHQCCHQCC
Tap
water
505048.9650.5097.92101.004.861.89
10010099.28100.6799.28100.671.180.98
150150149.14149.6799.4299.784.594.05
Urine505049.4750.8198.94101.621.615.55
100100100.7899.58100.7899.582.553.88
150150150.71150.83100.47100.550.633.09
Disclaimer/Publisher’s Note: The statements, opinions and data contained in all publications are solely those of the individual author(s) and contributor(s) and not of MDPI and/or the editor(s). MDPI and/or the editor(s) disclaim responsibility for any injury to people or property resulting from any ideas, methods, instructions or products referred to in the content.

