

The Link between Salivary Amylase Activity, Overweight, and Glucose Homeostasis


Abstract
:1. Introduction
2. Results
2.1. Absence of a Positive Correlation in the Plot
2.2. Model Diagnostics
3. Discussion
3.1. Butyrate and Adipocyte Health
3.2. Enhancement of GIP Receptor Expression
3.3. Enhancement of PYY Secretion
3.4. Enhancement of GLP-1 Secretion
- Enhanced Insulin Sensitivity: GLP-1 receptors are present in adipose tissue. Activation of these receptors increases insulin sensitivity in adipocytes, improving glucose uptake and reducing blood glucose levels [23].
- Promotion of Adiponectin Release: GLP-1 can stimulate adiponectin secretion from adipocytes, enhancing insulin sensitivity and reducing inflammation [29].
- Indirect Effects on Body Weight: GLP-1 receptors, found in the pancreas, intestines, hypothalamus, and brainstem, are critical for regulating satiety and food intake. Activation of these receptors promotes feelings of fullness and reduces food consumption, contributing to weight loss [31].
3.5. Salivary Amylase Activity and Microbiome Composition
3.6. Influence of Hormonal Profile on Butyrate Production and Metabolic Outcomes
3.7. Dietary Strategies to Increase Butyrate
3.8. Salivary Amylase Activity as a Predictor of Insulin Sensitivity
3.9. Future Research Directions
- Salivary Amylase and Genetic Variability: Investigate the genetic factors influencing salivary amylase levels and their impact on glucose metabolism and obesity. Understanding individual genetic variability could lead to personalized dietary recommendations based on amylase activity.
- Longitudinal Studies on Glucose Homeostasis: Conduct long-term studies to assess how variations in salivary amylase activity affect glucose homeostasis over time. These studies should explore how early-life amylase activity levels may predict the development of metabolic disorders such as type 2 diabetes.
- Interventions Targeting Amylase Activity: Explore potential interventions that can modulate salivary amylase activity, such as dietary changes, medications, or lifestyle modifications. Understanding how these interventions affect glucose regulation and body weight could lead to new strategies for preventing and managing obesity and related metabolic conditions.
- Interactions with the Microbiome: Investigate the relationship between salivary amylase activity, the oral and gut microbiomes, and glucose metabolism. This research could reveal how microbial composition and function are influenced by amylase activity, potentially leading to microbiome-targeted therapies for metabolic health.
- Clinical Trials: Design and implement large-scale clinical trials to evaluate the effectiveness of amylase-based biomarkers in predicting metabolic risk and the impact of targeted interventions on glucose homeostasis and obesity. These trials should include diverse populations to ensure the broad applicability of findings.
3.10. Study Strengths and Limitations
- Innovative Focus: This study’s exploration of the link between salivary amylase activity and metabolic health is relatively novel, particularly its emphasis on dietary impacts tailored to salivary enzyme activity. This innovative focus adds valuable knowledge to the field of personalized nutrition and metabolic health.
- Comprehensive Insights: The detailed discussion on butyrate’s multiple mechanisms of action in maintaining adipocyte health and improving glucose homeostasis is a strength. It provides a thorough understanding of how butyrate influences metabolic processes, enhancing its therapeutic potential.
- Potential for Personalized Nutrition: By investigating the relationship between salivary amylase activity and gut microbiota composition, the study creates opportunities for the development of personalized dietary strategies. This aspect is crucial for developing more targeted interventions for metabolic disorders.
- Population Specificity: While the focus on women of reproductive age is valuable, it limits the generalizability of the findings. The study’s results may not fully apply to males or individuals outside this age group, requiring careful consideration when generalizing these conclusions to broader populations.
- Cross-sectional Design: The study’s cross-sectional nature limits the ability to infer causality. Longitudinal studies would be necessary to establish a clearer cause-and-effect relationship between salivary amylase activity, dietary patterns, and metabolic outcomes.
- Genetic Variability Considerations: While the study acknowledges the role of genetic variability in salivary amylase activity, it does not deeply explore the genetic factors that could influence these metabolic outcomes. Future research should explore the genetic influences on salivary amylase activity to enhance the personalization of dietary recommendations.
- Microbiome Analysis Limitations: Although the study discusses the impact of salivary amylase on gut microbiota, it lacks direct microbiome analysis. Future studies incorporating detailed microbiome profiling would strengthen the findings and provide more robust insights into the relationship between salivary amylase, diet, and metabolic health.
4. Materials and Methods
4.1. Study Design and Participants
4.2. Dietary Interventions
4.3. Evaluation of Salivary Amylase Activity
4.4. Measurement of Butyrate Levels
4.5. Measurement of Insulin Sensitivity
4.6. Statistical Analysis
4.7. Ethics Statement
5. Conclusions
Author Contributions
Funding
Institutional Review Board Statement
Informed Consent Statement
Data Availability Statement
Acknowledgments
Conflicts of Interest
Abbreviations
References
- Valdes, A.M.; Walter, J.; Segal, E.; Spector, T.D. Role of the gut microbiota in nutrition and health. BMJ 2018, 361, k2179. [Google Scholar] [CrossRef] [PubMed]
- Marchesi, J.R.; Adams, D.H.; Fava, F.; Hermes, G.D.A.; Hirschfield, G.M.; Hold, G.; Quraishi, M.N.; Kinross, J.; Smidt, H.; Tuohy, K.M.; et al. The gut microbiota and host health: A new clinical frontier. Gut 2016, 65, 330–339. [Google Scholar] [CrossRef] [PubMed]
- Khaledi, M.; Poureslamfar, B.; Alsaab, H.O.; Tafaghodi, S.; Hjazi, A.; Singh, R.; Alawadi, A.H.; Alsaalamy, A.; Qasim, Q.A.; Sameni, F. The role of gut microbiota in human metabolism and inflammatory diseases: A focus on elderly individuals. Ann. Microbiol. 2024, 74, 1. [Google Scholar] [CrossRef]
- Karim, R.; Iqbal, S.; Mohammad, S.; Morshed, N.; Haque, A.; Mathiyalagan, R.; Yang, D.C.; Kim, Y.J.; Song, J.H.; Yang, D.U. Butyrate’s (a short-chain fatty acid) microbial synthesis, absorption, and preventive roles against colorectal and lung cancer. Arch. Microbiol. 2024, 206, 137. [Google Scholar] [CrossRef] [PubMed]
- He, Z.; Dong, H. The roles of short-chain fatty acids derived from colonic bacteria fermentation of non-digestible carbohydrates and exogenous forms in ameliorating intestinal mucosal immunity of young ruminants. Front. Immunol. 2023, 14, 1291846. [Google Scholar] [CrossRef]
- Bhatia, Z.; Kumar, S.; Seshadri, S. Exploring the Unexplored Arena: Butyrate as a Dual Communicator in Gut–Brain Axis. In Probiotics, Prebiotics, Synbiotics, and Postbiotics; Kothari, V., Kumar, P., Ray, S., Eds.; Springer: Singapore, 2023. [Google Scholar] [CrossRef]
- Bonnefond, A.; Yengo, L.; Dechaume, A.; Canouil, M.; Castelain, M.; Roger, E.; Allegaert, F.; Caiazzo, R.; Raverdy, V.; Pigeyre, M.; et al. Relationship between salivary/pancreatic amylase and body mass index: A systems biology approach. BMC Med. 2017, 15, 37. [Google Scholar] [CrossRef]
- Roshanravan, N.; Mahdavi, R.; Alizadeh, E.; Jafarabadi, M.A.; Hedayati, M.; Ghavami, A.; Alipour, S.; Alamdari, N.M.; Barati, M.; Ostadrahimi, A. Effect of Butyrate and Inulin Supplementation on Glycemic Status, Lipid Profile and Glucagon-Like Peptide 1 Level in Patients with Type 2 Diabetes: A Randomized Double-Blind, Placebo-Controlled Trial. Horm. Metab. Res. 2017, 49, 886–891. [Google Scholar] [CrossRef]
- Zhang, L.; Zhang, S.; Zou, W.; Hu, Y.; Gao, Y.; Zhang, J.; Zheng, J. Maternal high-fat diet regulates offspring hepatic ABCG5 expression and cholesterol metabolism via the gut microbiota and its derived butyrate. Clin. Sci. 2024, 138, 1039–1054. [Google Scholar] [CrossRef]
- Li, H.; Borné, Y.; Wang, Y.; Sonestedt, E. Starch intake, amylase gene copy number variation, plasma proteins, and risk of cardiovascular disease and mortality. BMC Med. 2023, 21, 27. [Google Scholar] [CrossRef]
- Jabeen, N.; Abirami Arthanari, D.D.E. Profiling of Salivary Alpha Amylase among Young Adults in Human Saliva. Obstet. Gynaecol. Forum 2024, 34, 575–581. Available online: https://www.obstetricsandgynaecologyforum.com/index.php/ogf/article/view/187 (accessed on 12 September 2024).
- Koopen, A.; Witjes, J.; Wortelboer, K.; Majait, S.; Prodan, A.; Levin, E.; Herrema, H.; Winkelmeijer, M.; Aalvink, S.; Bergman, J.J.G.H.M.; et al. Duodenal Anaerobutyricum soehngenii infusion stimulates GLP-1 production, ameliorates glycaemic control and beneficially shapes the duodenal transcriptome in metabolic syndrome subjects: A randomised double-blind place-bo-controlled cross-over study. Gut 2022, 71, 1577–1587. Available online: https://gut.bmj.com/content/71/8/1577 (accessed on 12 September 2024). [CrossRef] [PubMed]
- Goh, A.T.; Yao, J.; Chua, X.H.; Whitton, C.; Van Dam, R.M.; Forde, C.G. Associations between oral processing, saliva, and bolus properties on daily glucose excursions amongst people at risk of type-2 diabetes. Food Funct. 2023, 14, 2260–2269. [Google Scholar] [CrossRef] [PubMed]
- Dorling, J.L.; Martin, C.K.; Redman, L.M. Calorie restriction for enhanced longevity: The role of novel dietary strategies in the present obesogenic environment. Ageing Res. Rev. 2020, 64, 101038. [Google Scholar] [CrossRef] [PubMed]
- Ma, W.; Nguyen, L.H.; Song, M.; Wang, D.D.; Franzosa, E.A.; Cao, Y.; Joshi, A.; Drew, D.A.; Mehta, R.; Ivey, K.L.; et al. Dietary fiber intake, the gut microbiome, and chronic systemic inflammation in a cohort of adult men. Genome Med. 2021, 13, 102. [Google Scholar] [CrossRef] [PubMed]
- Davie, J.R. Inhibition of Histone Deacetylase Activity by Butyrate. J. Nutr. 2003, 133 (Suppl. S7), 2485S–2493S. [Google Scholar] [CrossRef]
- Kimura, I.; Ichimura, A.; Ohue-Kitano, R.; Igarashi, M. Free Fatty Acid Receptors in Health and Disease. Physiol. Rev. 2020, 100, 171–210. [Google Scholar] [CrossRef]
- Furusawa, Y.; Obata, Y.; Fukuda, S.; Hase, K. Roles of Short-Chain Fatty Acids in Colonic Health and Disease. Front. Immunol. 2019, 10, 2839. [Google Scholar] [CrossRef]
- Facchin, S.; Bertin, L.; Bonazzi, E.; Lorenzon, G.; De Barba, C.; Barberio, B.; Zingone, F.; Maniero, D.; Scarpa, M.; Ruffolo, C.; et al. Short-Chain Fatty Acids and Human Health: From Metabolic Pathways to Current Therapeutic Implications. Life 2024, 14, 559. [Google Scholar] [CrossRef]
- Yan, M.; Li, X.; Sun, C.; Tan, J.; Liu, Y.; Li, M.; Qi, Z.; He, J.; Wang, D.; Wu, L. Sodium Butyrate Attenuates AGEs-Induced Oxidative Stress and Inflammation by Inhibiting Autophagy and Affecting Cellular Metabolism in THP-1 Cells. Molecules 2022, 27, 8715. [Google Scholar] [CrossRef]
- Ashraf, A.; Hassan, I. Microbial Endocrinology: Host metabolism and appetite hormones interaction with gut microbiome. Mol. Cell. Endocrinol. 2024, 592, 112281. [Google Scholar] [CrossRef]
- Priyadarshini, M.; Kotlo, K.U.; Dudeja, P.K.; Layden, B.T. Role of Short Chain Fatty Acid Receptors in Intestinal Physiology and Pathophysiology. Compr. Physiol. 2018. [CrossRef]
- Vendrell, J.; El Bekay, R.; Peral, B.; Garcia-Fuentes, E.; Megia, A.; Macías-González, M.; Fernández Real, J.; Jiménez-Gómez, Y.; Escoté, X.; Pachón, G.; et al. Study of the Potential Association of Adipose Tissue GLP-1 Receptor with Obesity and Insulin Resistance. Endocrinology 2011, 152, 4072–4079. [Google Scholar] [CrossRef] [PubMed]
- Braun, K.; Oeckl, J.; Westermeier, J.; Li, Y.; Klingenspor, M. Non-adrenergic control of lipolysis and thermogenesis in adipose tissues. J. Exp. Biol. 2018, 221, jeb165381. [Google Scholar] [CrossRef] [PubMed]
- Petrovic, A.; Igrec, D.; Rozac, K.; Bojanic, K.; Kuna, L.; Kolaric, T.O.; Mihaljevic, V.; Sikora, R.; Smolic, R.; Glasnovic, M.; et al. The Role of GLP1-RAs in Direct Modulation of Lipid Metabolism in Hepatic Tissue as Determined Using In Vitro Models of NAFLD. Curr. Issues Mol. Biol. 2023, 45, 4544–4556. [Google Scholar] [CrossRef] [PubMed]
- Chen, J.; Zhao, H.; Ma, X.; Zhang, Y.; Lu, S.; Wang, Y.; Zong, C.; Qin, D.; Wang, Y.; Yang, Y.Y.; et al. GLP-1/GLP-1R Signaling in Regulation of Adipocyte Differentiation and Lipogenesis. Cell. Physiol. Biochem. 2017, 42, 1165–1176. [Google Scholar] [CrossRef]
- Pirro, V.; Roth, K.D.; Lin, Y.; A Willency, J.; Milligan, P.L.; Wilson, J.M.; Ruotolo, G.; Haupt, A.; Newgard, C.B.; Duffin, K.L. Effects of Tirzepatide, a Dual GIP and GLP-1 RA, on Lipid and Metabolite Profiles in Subjects With Type 2 Diabetes. J. Clin. Endocrinol. Metab. 2021, 107, 363–378. [Google Scholar] [CrossRef]
- Diz-Chaves, Y.; Mastoor, Z.; Spuch, C.; González-Matías, L.C.; Mallo, F. Anti-Inflammatory Effects of GLP-1 Receptor Activation in the Brain in Neurodegenerative Diseases. Int. J. Mol. Sci. 2022, 23, 9583. [Google Scholar] [CrossRef]
- Mehdi, S.F.; Pusapati, S.; Anwar, M.S.; Lohana, D.; Kumar, P.; Nandula, S.A.; Nawaz, F.K.; Tracey, K.; Yang, H.; LeRoith, D.; et al. Glucagon-like peptide-1: A multi-faceted anti-inflammatory agent. Front. Immunol. 2023, 14, 1148209. [Google Scholar] [CrossRef]
- Lymperopoulos, A.; Borges, J.I.; Stoicovy, R.A. Cyclic Adenosine Monophosphate in Cardiac and Sympathoadrenal GLP-1 Receptor Signaling: Focus on Anti-Inflammatory Effects. Pharmaceutics 2024, 16, 693. [Google Scholar] [CrossRef]
- Herrou, J.; Mabilleau, G.; Lecerf, J.-M.; Thomas, T.; Biver, E.; Paccou, J. Narrative Review of Effects of Glucagon-Like Peptide-1 Receptor Agonists on Bone Health in People Living with Obesity. Calcif. Tissue Int. 2023, 114, 86–97. [Google Scholar] [CrossRef]
- Zhang, Q.; Hutchison, E.R.; Pan, C.; Warren, M.F.; Keller, M.P.; Attie, A.D.; Lusis, A.J.; Rey, F.E. Systems genetics approach uncovers associations between host amylase locus, gut microbiome and metabolic traits in hyperlipidemic mice. bioRxiv 2024. [Google Scholar] [CrossRef]
- Perry, G.H.; Dominy, N.J.; Claw, K.G.; Lee, A.S.; Fiegler, H.; Redfern, R.; Werner, J.; Villanea, F.A.; Mountain, J.L.; Misra, R.; et al. Diet and the evolution of human amylase gene copy number variation. PLoS ONE 2010, 5, e13352. [Google Scholar] [CrossRef] [PubMed]
- Acharya, A.; Shetty, S.S.; N, S.K. Role of gut microbiota derived short chain fatty acid metabolites in modulating female reproductive health. Hum. Nutr. Metab. 2024, 36, 200256. [Google Scholar] [CrossRef]
- Murga-Garrido, S.M.; Hong, Q.; Cross, T.-W.L.; Hutchison, E.R.; Han, J.; Thomas, S.P.; Vivas, E.I.; Denu, J.; Ceschin, D.G.; Tang, Z.-Z.; et al. Gut microbiome variation modulates the effects of dietary fiber on host metabolism. Microbiome 2021, 9, 117. [Google Scholar] [CrossRef]
- Wang, X.; Qi, Y.; Zheng, H. Dietary Polyphenol, Gut Microbiota, and Health Benefits. Antioxidants 2022, 11, 1212. [Google Scholar] [CrossRef]
- Holscher, H.D. Dietary fiber and prebiotics and the gastrointestinal microbiota. Front. Nutr. 2019, 6, 188. [Google Scholar] [CrossRef]
- Zambrano, A.K.; Cadena-Ullauri, S.; Ruiz-Pozo, V.A.; Tamayo-Trujillo, R.; Paz-Cruz, E.; Guevara-Ramírez, P.; Frias-Toral, E.; Simancas-Racines, D. Impact of fundamental components of the Mediterranean diet on the microbiota composition in blood pressure regulation. J. Transl. Med. 2024, 22, 417. [Google Scholar] [CrossRef] [PubMed]
- Fu, J.; Zheng, Y.; Gao, Y.; Xu, W. Dietary Fiber Intake and Gut Microbiota in Human Health. Microorganisms 2022, 10, 2507. [Google Scholar] [CrossRef]
- Stilling, R.M.; van de Wouw, M.; Clarke, G.; Stanton, C.; Dinan, T.G.; Cryan, J.F. The neuropharmacology of butyrate: The bread and butter of the microbiota-gut-brain axis? Neurochem. Int. 2016, 99, 110–132. [Google Scholar] [CrossRef]
- Paparo, L.; Nocerino, R.; Ciaglia, E.; Di Scala, C.; De Caro, C.; Russo, R.; Trinchese, G.; Aitoro, R.; Amoroso, A.; Bruno, C.; et al. Butyrate as a bioactive human milk protective component against food allergy. Allergy 2020, 76, 1398–1415. [Google Scholar] [CrossRef]
- Procházková, N.; Venlet, N.; Hansen, M.L.; Lieberoth, C.B.; Dragsted, L.O.; Bahl, M.I.; Licht, T.R.; Kleerebezem, M.; Lauritzen, L.; Roager, H.M. Effects of a wholegrain-rich diet on markers of colonic fermentation and bowel function and their associations with the gut microbiome: A randomised controlled cross-over trial. Front. Nutr. 2023, 10, 1187165. [Google Scholar] [CrossRef] [PubMed]
- Higuchi, R.; Iwane, T.; Iida, A.; Nakajima, K. Copy Number Variation of the Salivary Amylase Gene and Glucose Metabolism in Healthy Young Japanese Women. J. Clin. Med. Res. 2020, 12, 184–189. [Google Scholar] [CrossRef] [PubMed] [PubMed Central]
- Ostendorf, D.M.; Caldwell, A.E.; Zaman, A.; Pan, Z.; Bing, K.; Wayland, L.T.; Creasy, S.A.; Bessesen, D.H.; MacLean, P.; Melanson, E.L.; et al. Comparison of weight loss induced by daily caloric restriction versus intermittent fasting (DRIFT) in individuals with obesity: Study protocol for a 52-week randomized clinical trial. Trials 2022, 23, 718. [Google Scholar] [CrossRef] [PubMed]
- Ebringer, A.; Wilson, C. The Use of a Low Starch Diet in the Treatment of Patients Suffering from Ankylosing Spondylitis. Clin. Rheumatol. 1996, 15, 62–66. [Google Scholar] [CrossRef] [PubMed]
- Erta, G.; Gersone, G.; Jurka, A.; Tretjakovs, P. Impact of a 12-Week Dietary Intervention on Adipose Tissue Metabolic Markers in Overweight Women of Reproductive Age. Int. J. Mol. Sci. 2024, 25, 8512. [Google Scholar] [CrossRef]
- Pouteau, E.; Meirim, I.; Métairon, S.; Fay, L. Acetate, propionate and butyrate in plasma: Determination of the concentration and isotopic enrichment by gas chromatography/mass spectrometry with positive chemical ionization. J. Mass Spectrom. 2001, 36, 798–805. [Google Scholar] [CrossRef]


| Group Allocation | Mean Age (Years) ± SD | Salivary Amylase (U/mL) Median (IQR) |
|---|---|---|
| Caloric Restriction (Low Salivary Amylase) (n = 15) | 28.1 ± 3.9 | 15.3 ± 14.9 |
| Low-Starch Diet (High Salivary Amylase) (n = 15) | 29.4 ± 3.2 | 77.1 ± 50.5 |
| Low-Starch Diet (Low Salivary Amylase) (n = 15) | 28.5 ± 3.5 | 15.6 ± 19.7 |
| Caloric Restriction (High Salivary Amylase) (n = 15) | 30.1 ± 4.3 | 89.2 ± 47.4 |
| Control Group (Normal Weight) (n = 7) | 29.1 ± 3.2 | 31.7 ± 23.4 |
| Variable | Value |
|---|---|
| Salivary Amylase (U/mL) | Median (IQR): 27.77 (10.64–56.24) |
| Butyrate (µmol/L) | Median (IQR): 1.823 (0.373–6.985) |
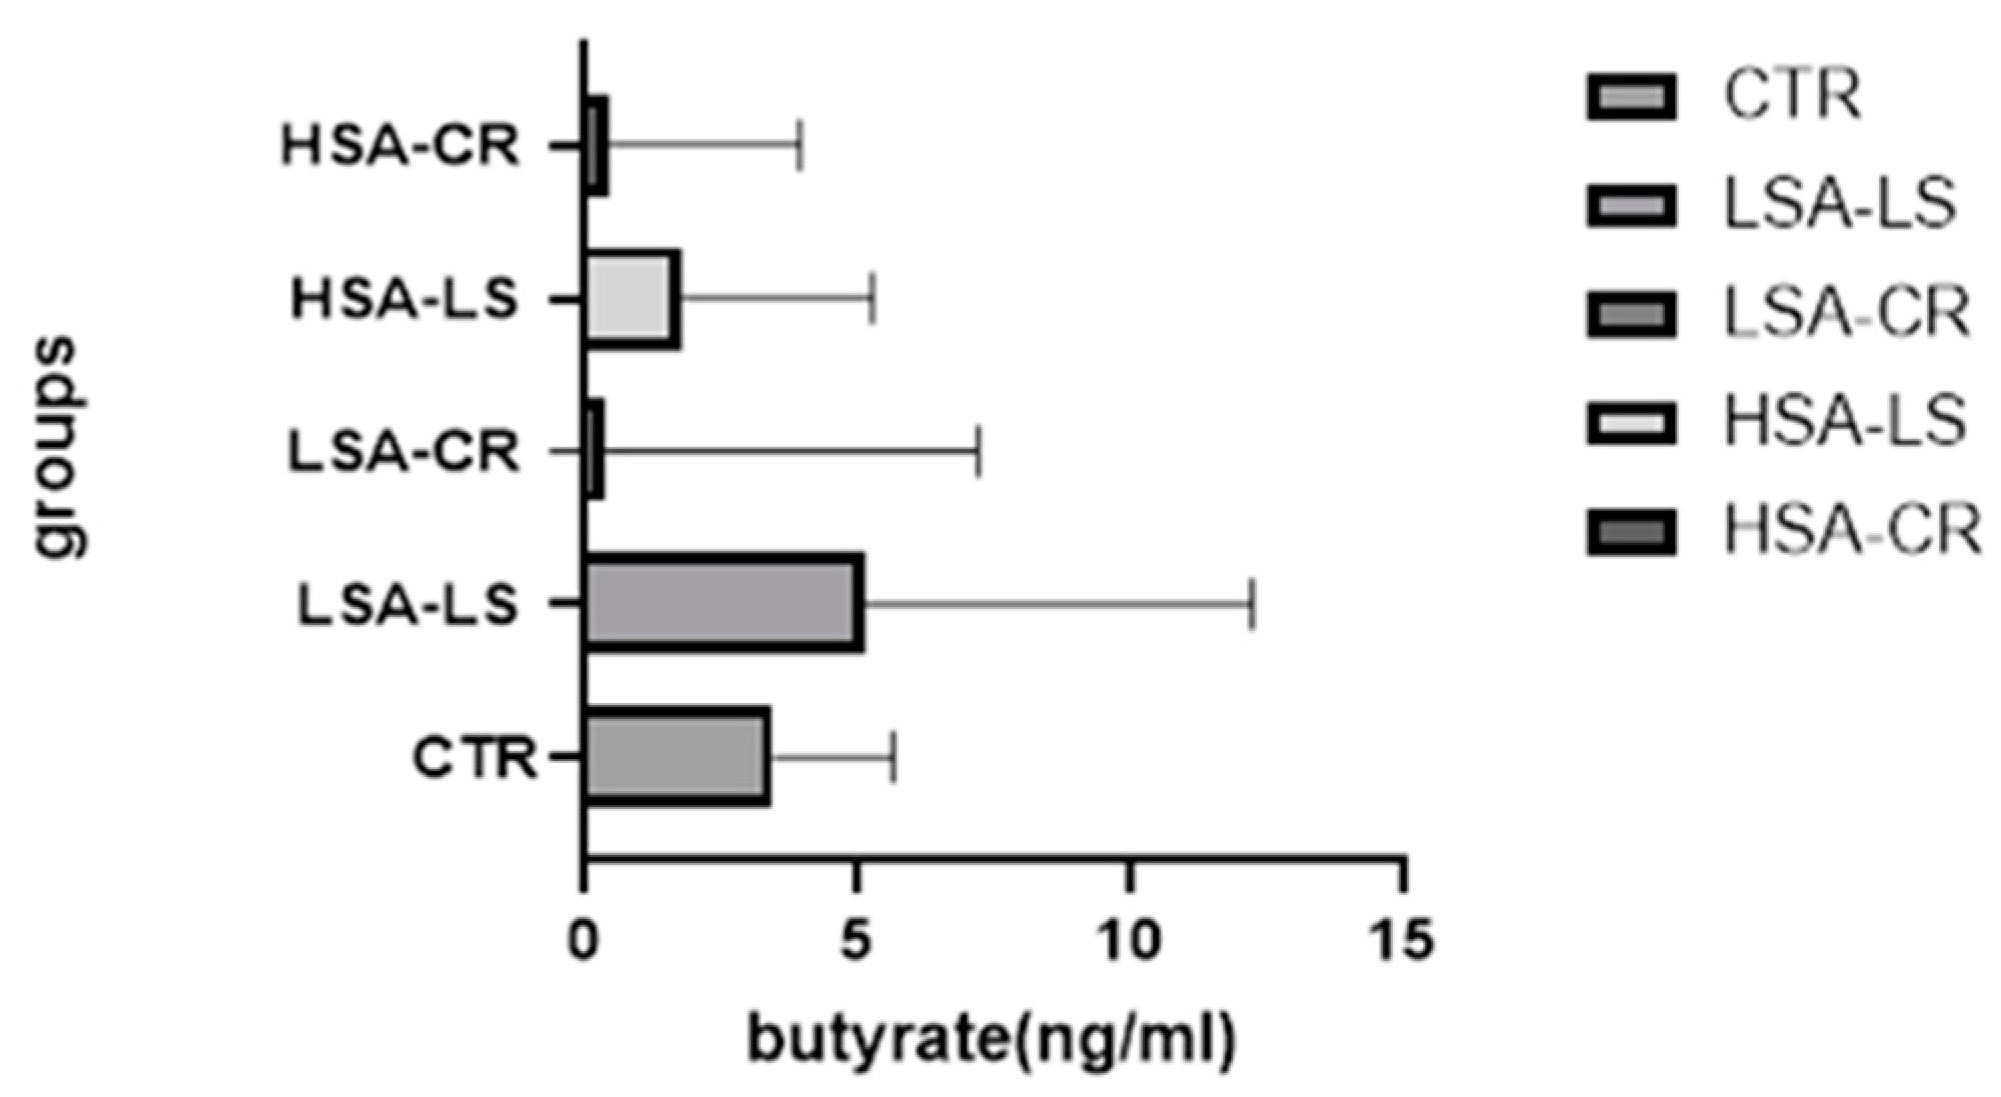
| Group | Median Butyrate Level (ng/mL) and 95% CI for Median Values | IQR (ng/mL) |
|---|---|---|
| Low-Starch Diet (Low Salivary Amylase) (n = 15) | 5.140 | 0.7070–12.25 |
| Caloric Restriction (Low Salivary Amylase) (n = 15) | 3.90 | 0.246–7.225 |
| Caloric Restriction (High Salivary Amylase) (n = 15) | 0.47 | 0.29–3.955 |
| Low-Starch Diet (High Salivary Amylase) (n = 15) | 1.8 | 1.13–5.29 |
| Control Group (Normal Weight) (n = 7) | 3.47 (95% CI: 0.14–7.15) | - |
| Correlation | ρ | p-value |
| Salivary Amylase Activity and Butyrate | 0.0486 | p < 0.05 |
| Comparative Tests | Mann–Whitney U | p-value |
| High vs Low Salivary Amylase Activity | 44 | p < 0.05 |
| Low-Starch Diet vs Caloric Restriction (Low Salivary Amylase) | 59.50 | p < 0.05 |
| Group | Mean Age (Years) ± SD | Lower IQR Butyrate Level (ng/mL) | Higher IQR Butyrate Level (ng/mL) |
|---|---|---|---|
| Low-Starch Diet (Low Salivary Amylase) | 28.8 ± 2.57 | 0.7070 | 12.25 |
| Caloric Restriction (Low Salivary Amylase) | 28.43 ± 3.59 | 0.246 | 7.225 |
| Caloric Restriction (High Salivary Amylase) | 30.2 ± 4.47 | 0.29 | 3.955 |
| Low-Starch Diet (High Salivary Amylase) | 29.33 ± 3.67 | 1.13 | 5.29 |
| Control Group (Normal Weight) | 28.57 ± 2.57 | 0.951 | 5.67 |
| Predictor | β | SE | p-Value (β) | 95% CI | R2 | F (DF) | p-Value (Model) |
|---|---|---|---|---|---|---|---|
| Salivary Amylase Activity | 0.435 | 0.12 | <0.0003 | [0.195, 0.675] | 0.35 | F (1, 34) = 5.5 | 0.0249 |
Disclaimer/Publisher’s Note: The statements, opinions and data contained in all publications are solely those of the individual author(s) and contributor(s) and not of MDPI and/or the editor(s). MDPI and/or the editor(s) disclaim responsibility for any injury to people or property resulting from any ideas, methods, instructions or products referred to in the content. |
© 2024 by the authors. Licensee MDPI, Basel, Switzerland. This article is an open access article distributed under the terms and conditions of the Creative Commons Attribution (CC BY) license (https://creativecommons.org/licenses/by/4.0/).
Share and Cite
Erta, G.; Gersone, G.; Jurka, A.; Tretjakovs, P. The Link between Salivary Amylase Activity, Overweight, and Glucose Homeostasis. Int. J. Mol. Sci. 2024, 25, 9956. https://doi.org/10.3390/ijms25189956
Erta G, Gersone G, Jurka A, Tretjakovs P. The Link between Salivary Amylase Activity, Overweight, and Glucose Homeostasis. International Journal of Molecular Sciences. 2024; 25(18):9956. https://doi.org/10.3390/ijms25189956
Chicago/Turabian StyleErta, Gita, Gita Gersone, Antra Jurka, and Pēteris Tretjakovs. 2024. "The Link between Salivary Amylase Activity, Overweight, and Glucose Homeostasis" International Journal of Molecular Sciences 25, no. 18: 9956. https://doi.org/10.3390/ijms25189956