
Optimization of Basophil Activation Test in the Diagnosis and Qualification for Allergen-Specific Immunotherapy in Children with Respiratory Allergy to the House Dust Mite Dermatophagoides pteronyssinus


Abstract
:1. Introduction
2. Results
3. Discussion
4. Material and Methods
4.1. Study Participants
4.2. Allergy Tests
4.2.1. Routine Allergy Tests
4.2.2. Basophil Activation Test
4.3. Statistical Analysis
5. Conclusions
Supplementary Materials
Author Contributions
Funding
Institutional Review Board Statement
Informed Consent Statement
Data Availability Statement
Conflicts of Interest
References
- Papadopoulos, N.G.; Agache, I.; Bavbek, S.; Bilo, B.M.; Braido, F.; Cardona, V.; Custovic, A.; Demonchy, J.; Demoly, P.; Eigenmann, P.; et al. Research needs in allergy: An EAACI position paper, in collaboration with EFA. Clin. Transl. Allergy 2012, 2, 21. [Google Scholar] [CrossRef] [PubMed]
- Licari, A.; Magri, P.; De Silvestri, A.; Giannetti, A.; Indolfi, C.; Mori, F.; Marseglia, G.L.; Peroni, D. Epidemiology of Allergic Rhinitis in Children: A Systematic Review and Meta-Analysis. J. Allergy Clin. Immunol. Pract. 2023, 11, 2547–2556. [Google Scholar] [CrossRef] [PubMed]
- Ojo, R.O.; Okobi, O.E.; Ezeamii, P.C.; Ezeamii, V.C.; Nwachukwu, E.U.; Gebeyehu, Y.H.; Okobi, E.; David, A.B.; Akinsola, Z. Epidemiology of Current Asthma in Children Under 18: A Two-Decade Overview Using National Center for Health Statistics (NCHS) Data. Cureus 2023, 15, e49229. [Google Scholar] [CrossRef]
- Arshad, S.H.; Tariq, S.M.; Matthews, S.; Hakim, E. Sensitization to common allergens and its association with allergic disorders at age 4 years: A whole population birth cohort study. Pediatrics 2001, 108, E33. [Google Scholar] [CrossRef]
- Farraia, M.; Mendes, F.C.; Sokhatska, O.; Rama, T.; Severo, M.; Custovic, A.; Rufo, J.C.; Barros, H.; Moreira, A. Component-resolved diagnosis in childhood and prediction of asthma in early adolescence: A birth cohort study. Pediatr. Allergy Immunol. 2023, 34, e14056. [Google Scholar] [CrossRef]
- Gabet, S.; Rancière, F.; Just, J.; de Blic, J.; Lezmi, G.; Amat, F.; Seta, N.; Momas, I. Asthma and allergic rhinitis risk depends on house dust mite specific IgE levels in PARIS birth cohort children. World Allergy Organ. J. 2019, 12, 100057. [Google Scholar] [CrossRef]
- Brzozowska, A.; Woicka-Kolejwa, K.; Jerzynska, J.; Majak, P.; Stelmach, I. Allergic Rhinitis and House Dust Mite Sensitization Determine Persistence of Asthma in Children. Indian J. Pediatr. 2022, 89, 673–681. [Google Scholar] [CrossRef] [PubMed]
- Kowal, K.; Pampuch, A.; Siergiejko, G.; Siergiejko, Z.; Swiebocka, E.; Schlachter, C.R.; Chruszcz, M.; Jacquet, A. Sensitization to major Dermatophagoides pteronyssinus allergens in house dust mite allergic patients from North Eastern Poland developing rhinitis or asthma. Adv. Med. Sci. 2020, 65, 304–309. [Google Scholar] [CrossRef]
- Matos Semedo, F.; Dorofeeva, Y.; Pires, A.P.; Tomaz, E.; Taborda Barata, L.; Inácio, F.; Valenta, R. Der p 23: Clinical Relevance of Molecular Monosensitization in House Dust Mite Allergy. J. Investig. Allergol. Clin. Immunol. 2019, 29, 314–316. [Google Scholar] [CrossRef]
- Huang, H.J.; Sarzsinszky, E.; Vrtala, S. House dust mite allergy: The importance of house dust mite allergens for diagnosis and immunotherapy. Mol. Immunol. 2023, 158, 54–67. [Google Scholar] [CrossRef]
- Pfaar, O.; Becker, S.; Calabria, C.; Hartenstein, D.; Jung, J.; Zimmer, J.; Ponda, P. Comparison of allergen immunotherapy practice patterns in inhalant allergies in the United States of America and Europe: Similarities and differences 2023. World Allergy Organ. J. 2023, 16, 100766. [Google Scholar] [CrossRef] [PubMed]
- West, T.; Katelaris, C.H. The evidence for commercial house dust mite immunotherapy products: A pragmatic systematic review with narrative synthesis. J. Allergy Clin. Immunol. Glob. 2024, 3, 100255. [Google Scholar] [CrossRef] [PubMed]
- Asoudeh Moghanloo, S.; Forouzanfar, M.; Jafarinia, M.; Fazlollahi, M.R.; Kardar, G.A. A Comprehensive Overview of Allergen-specific Immunotherapy Types, Recombinant and Natural Extract Allergens in the Diagnosis and Treatment of Allergies. Iran. J. Allergy Asthma Immunol. 2022, 21, 494–511. [Google Scholar] [CrossRef] [PubMed]
- Asoudeh Moghanloo, S.; Forouzanfar, M.; Jafarinia, M.; Fazlollahi, M.R.; Kardar, G.A. Allergen-specific immunotherapy by recombinant Der P1 allergen-derived peptide-based vaccine in an allergic mouse model. Immun. Inflamm. Dis. 2023, 11, e878. [Google Scholar] [CrossRef] [PubMed]
- Batard, T.; Canonica, W.G.; Pfaar, O.; Shamji, M.H.; O’Hehir, R.E.; van Zelm, M.C.; Mascarell, L. Current advances in house dust mite allergen immunotherapy (AIT): Routes of administration, biomarkers and molecular allergen profiling. Mol. Immunol. 2023, 155, 124–134. [Google Scholar] [CrossRef] [PubMed]
- Fuiano, N.; Incorvaia, C.; Prodam, F.; Procaccini, D.A.; Bona, G. Relationship between the atopy patch test and clinical expression of the disease in children with atopic eczema/dermatitis syndrome and respiratory symptoms. Ann. Allergy Asthma Immunol. 2008, 101, 174–178. [Google Scholar] [CrossRef]
- Spiewak, R. Diseases from the Spectrum of Dermatitis and Eczema: Can “Omics” Sciences Help with Better Systematics and More Accurate Differential Diagnosis? Int. J. Mol. Sci. 2023, 24, 10468. [Google Scholar] [CrossRef]
- Bogacz-Piaseczyńska, A.; Bożek, A. Allergen immunotherapy in atopic dermatitis. Alergol. Pol.—Pol. J. Allergol. 2024, 11. online ahead of print. [Google Scholar] [CrossRef]
- Alvaro-Lozano, M.; Akdis, C.A.; Akdis, M.; Alviani, C.; Angier, E.; Arasi, S.; Arzt-Gradwohl, L.; Barber, D.; Bazire, R.; Cavkaytar, O.; et al. EAACI Allergen Immunotherapy User’s Guide. Pediatr. Allergy Immunol. 2020, 31 (Suppl. 25), 1–101. [Google Scholar] [CrossRef]
- Wongsa, C.; Phinyo, P.; Sompornrattanaphan, M.; Krikeerati, T.; Lumkul, L.; Thongngarm, T. Efficacy and Safety of House Dust Mite Sublingual Immunotherapy Tablet in Allergic Asthma: A Systematic Review of Randomized Controlled Trials. J. Allergy Clin. Immunol. Pract. 2022, 10, 1342–1355.e24. [Google Scholar] [CrossRef]
- Zheng, C.; Xu, H.; Huang, S.; Chen, Z. Efficacy and safety of subcutaneous immunotherapy in asthmatic children allergic to house dust mite: A meta-analysis and systematic review. Front. Pediatr. 2023, 11, 1137478. [Google Scholar] [CrossRef] [PubMed]
- Tam, H.; Calderon, M.A.; Manikam, L.; Nankervis, H.; García Núñez, I.; Williams, H.C.; Durham, S.; Boyle, R.J. Specific allergen immunotherapy for the treatment of atopic eczema. Cochrane Database Syst. Rev. 2016, 2, CD008774. [Google Scholar] [CrossRef]
- Yepes-Nuñez, J.J.; Guyatt, G.H.; Gómez-Escobar, L.G.; Pérez-Herrera, L.C.; Chu, A.W.; Ceccaci, R.; Acosta-Madiedo, A.S.; Wen, A.; Moreno-López, S.; MacDonald, M.; et al. Allergen immunotherapy for atopic dermatitis: Systematic review and meta-analysis of benefits and harms. J. Allergy Clin. Immunol. 2023, 151, 147–158. [Google Scholar] [CrossRef]
- Chen, K.W.; Zieglmayer, P.; Zieglmayer, R.; Lemell, P.; Horak, F.; Bunu, C.P.; Valenta, R.; Vrtala, S. Selection of house dust mite-allergic patients by molecular diagnosis may enhance success of specific immunotherapy. J. Allergy Clin. Immunol. 2019, 143, 1248–1252.e12. [Google Scholar] [CrossRef] [PubMed]
- González-Pérez, R.; Poza-Guedes, P.; Pineda, F.; Sánchez-Machín, I. Advocacy of Precision Allergy Molecular Diagnosis in Decision Making for the Eligibility of Customized Allergen Immunotherapy. Curr. Issues Mol. Biol. 2023, 45, 9976–9984. [Google Scholar] [CrossRef] [PubMed]
- Miller, J.D. The Role of Dust Mites in Allergy. Clin. Rev. Allergy Immunol. 2019, 57, 312–329. [Google Scholar] [CrossRef]
- Cao, H.; Liu, Z. Clinical significance of dust mite allergens. Mol. Biol. Rep. 2020, 47, 6239–6246. [Google Scholar] [CrossRef]
- Englhard, A.S.; Holzer, M.; Eder, K.; Gellrich, D.; Gröger, M. How reliable is anamnestic data in predicting the clinical relevance of house dust mite sensitization? Eur. Arch. Otorhinolaryngol. 2022, 279, 801–810. [Google Scholar] [CrossRef]
- Silvestri, M.; Pistorio, A.; Battistini, E.; Rossi, G.A. IgE in childhood asthma: Relevance of demographic characteristics and polysensitisation. Arch. Dis. Child. 2010, 95, 979–984. [Google Scholar] [CrossRef]
- Gellrich, D.; Högerle, C.; Becker, S.; Gröger, M. Is Quantitative sIgE Serology Suitable for Distinguishing Between Silent Sensitization and Allergic Rhinitis to Dermatophagoides pteronyssinus? J. Investig. Allergol. Clin. Immunol. 2019, 29, 124–131. [Google Scholar] [CrossRef]
- Santos, A.F.; Alpan, O.; Hoffmann, H.J. Basophil activation test: Mechanisms and considerations for use in clinical trials and clinical practice. Allergy 2021, 76, 2420–2432. [Google Scholar] [CrossRef] [PubMed]
- Alpan, O.; Wasserman, R.L.; Kim, T.; Darter, A.; Shah, A.; Jones, D.; McNeil, D.; Li, H.; Ispas, L.; Rathkopf, M.; et al. Towards an FDA-cleared basophil activation test. Front. Allergy 2023, 3, 1009437. [Google Scholar] [CrossRef] [PubMed]
- Pascal, M.; Edelman, S.M.; Nopp, A.; Möbs, C.; Geilenkeuser, W.J.; Knol, E.F.; Ebo, D.G.; Mertens, C.; Shamji, M.H.; Santos, A.F.; et al. EAACI task force report: A consensus protocol for the basophil activation test for collaboration and external quality assurance. Allergy 2024, 79, 290–293. [Google Scholar] [CrossRef] [PubMed]
- Czarnobilska, E.; Gregorius, A.; Porębski, G.; Śpiewak, R.; Sacha, M. Korzyści z wykonywania testu aktywacji bazofilów w kwalifikacji do immunoterapii swoistej w alergii wziewnej. Przegl. Lek. 2012, 69, 1249–1253. [Google Scholar] [PubMed]
- Leśniak, M.; Dyga, W.; Rusinek, B.; Mazur, M.; Czarnobilska, E. Comparison of the basophil activation test versus the nasal provocation test in establishing eligibility for specific immunotherapy. Pol. Arch. Med. Wewn. 2016, 126, 521–529. [Google Scholar] [CrossRef]
- Bulanda, M.; Dyga, W.; Rusinek, B.; Czarnobilska, E. Rola testu aktywacji bazofilów (BAT) w kwalifikacji do immunoterapii swoistej z alergenami wziewnymi. Przegl. Lek. 2016, 73, 786–790. [Google Scholar] [PubMed]
- Czarnobilska, E.; Bulanda, M.; Śpiewak, R. The usefulness of the basophil activation test in monitoring specific immunotherapy with house dust mite allergens. Postepy Dermatol. Alergol. 2018, 35, 93–98. [Google Scholar] [CrossRef]
- Alvarez-Cuesta, E.; Bousquet, J.; Canonica, G.W.; Durham, S.R.; Malling, H.J.; Valovirta, E.; EAACI Immunotherapy Task Force. Standards for practical allergen-specific immunotherapy. Allergy 2006, 61 (Suppl. 82), 1–20. [Google Scholar] [CrossRef]
- Halken, S.; Larenas-Linnemann, D.; Roberts, G.; Calderón, M.A.; Angier, E.; Pfaar, O.; Ryan, D.; Agache, I.; Ansotegui, I.J.; Arasi, S.; et al. EAACI guidelines on allergen immunotherapy: Prevention of allergy. Pediatr. Allergy Immunol. 2017, 28, 728–745. [Google Scholar] [CrossRef]
- Roberts, G.; Pfaar, O.; Akdis, C.A.; Ansotegui, I.J.; Durham, S.R.; van Wijk, G.R.; Halken, S.; Larenas-Linnemann, D.; Pawankar, R.; Pitsios, C.; et al. EAACI Guidelines on Allergen Immunotherapy: Allergic rhinoconjunctivitis. Allergy 2018, 73, 765–798. [Google Scholar] [CrossRef]
- González-Muñoz, M.; Villota, J.; Moneo, I. Analysis of basophil activation by flow cytometry in pediatric house dust mite allergy. Pediatr. Allergy Immunol. 2008, 19, 342–347. [Google Scholar] [CrossRef] [PubMed]
- Li, Y.; Liu, C.; Li, H.; Wang, X. Exploring the role of basophil activation test in diagnosis of Dermatophagoides farinae sensitization and evaluation of therapeutic efficacy of subcutaneous immunotherapy in children. Scand. J. Immunol. 2022, 96, e13168. [Google Scholar] [CrossRef] [PubMed]
- Ogulur, I.; Kiykim, A.; Baris, S.; Ozen, A.; Yuce, E.G.; Karakoc-Aydiner, E. Basophil activation test for inhalant allergens in pediatric patients with allergic rhinitis. Int. J. Pediatr. Otorhinolaryngol. 2017, 97, 197–201. [Google Scholar] [CrossRef]
- Zhao, L.; Zhang, Y.; Zhang, S.; Zhang, L.; Lan, F. The effect of immunotherapy on cross-reactivity between house dust mite and other allergens in house dust mite -sensitized patients with allergic rhinitis. Expert. Rev. Clin. Immunol. 2021, 17, 969–975. [Google Scholar] [CrossRef]
- González-Torres, L.; García-Paz, V.; Meijide, A.; Goikoetxea, M.J.; Salgado, M.A.; Sanz, M.L.; Vila, L. Local allergic rhinitis in children: Clinical characteristics and role of basophil activation test as a diagnostic tool. Int. J. Pediatr. Otorhinolaryngol. 2023, 172, 111645. [Google Scholar] [CrossRef]
- Bożek, A.; Kozłowska, R.; Sybila, P.; Miodońska, M.; Mędrala, A.; Foks-Ciekalska, A.; Ignasiak, B. The aspects of local allergic rhinitis in Polish children and adolescents. Postepy Dermatol. Alergol. 2023, 40, 321–325. [Google Scholar] [CrossRef] [PubMed]
- Bożek, A.; Ignasiak, B.; Krupka, M.; Miodonska, M. Local allergic rhinitis in children. Rhinology 2023, 61, 287–288. [Google Scholar] [CrossRef]
- Vespa, S.; Del Biondo, P.; Simeone, P.; Cavallucci, E.; Catitti, G.; Auciello, R.; De Bellis, D.; Altomare, I.; Pierdomenico, L.; Canonico, B.; et al. Basophil Activation Test with Different Polyethylene Glycols in Patients with Suspected PEG Hypersensitivity Reactions. Int. J. Mol. Sci. 2022, 23, 14592. [Google Scholar] [CrossRef]
- Mayorga, C.; Çelik, G.E.; Pascal, M.; Hoffmann, H.J.; Eberlein, B.; Torres, M.J.; Brockow, K.; Garvey, L.H.; Barbaud, A.; Madrigal-Burgaleta, R.; et al. Flow-based basophil activation test in immediate drug hypersensitivity. An EAACI task force position paper. Allergy 2024, 79, 580–600. [Google Scholar] [CrossRef]
- Bergmann, M.M.; Santos, A.F. Basophil activation test in the food allergy clinic: Its current use and future applications. Expert Rev. Clin. Immunol. 2024. online ahead of print. [Google Scholar] [CrossRef]
- Caruso, C.; Colantuono, S.; Tolusso, B.; Di Mario, C.; Fancello, G.; La Sorda, M.; Celi, G.; Caringi, M.; Volterrani, A.; Descalzi, D.; et al. Effects of house dust mite subcutaneous immunotherapy in real-life. Immunological and clinical biomarkers and economic impact analysis. World Allergy Organ J. 2023, 16, 100789. [Google Scholar] [CrossRef] [PubMed]
- Akobeng, A.K. Understanding diagnostic tests 3: Receiver operating characteristic curves. Acta Paediatr. 2007, 96, 644–647. [Google Scholar] [CrossRef] [PubMed]
- Hassanzad, M.; Hajian-Tilaki, K. Methods of determining optimal cut-point of diagnostic biomarkers with application of clinical data in ROC analysis: An update review. BMC Med. Res. Methodol. 2024, 24, 84. [Google Scholar] [CrossRef] [PubMed]
- Akobeng, A.K. Understanding diagnostic tests 1: Sensitivity, specificity and predictive values. Acta Paediatr. 2007, 96, 338–341. [Google Scholar] [CrossRef]
- Gregorius, A.; Spiewak, R. Podstawy racjonalnego wyboru testów diagnostycznych w alergologii. Alergia Astma Immunol. 2013, 18, 221–230. [Google Scholar]


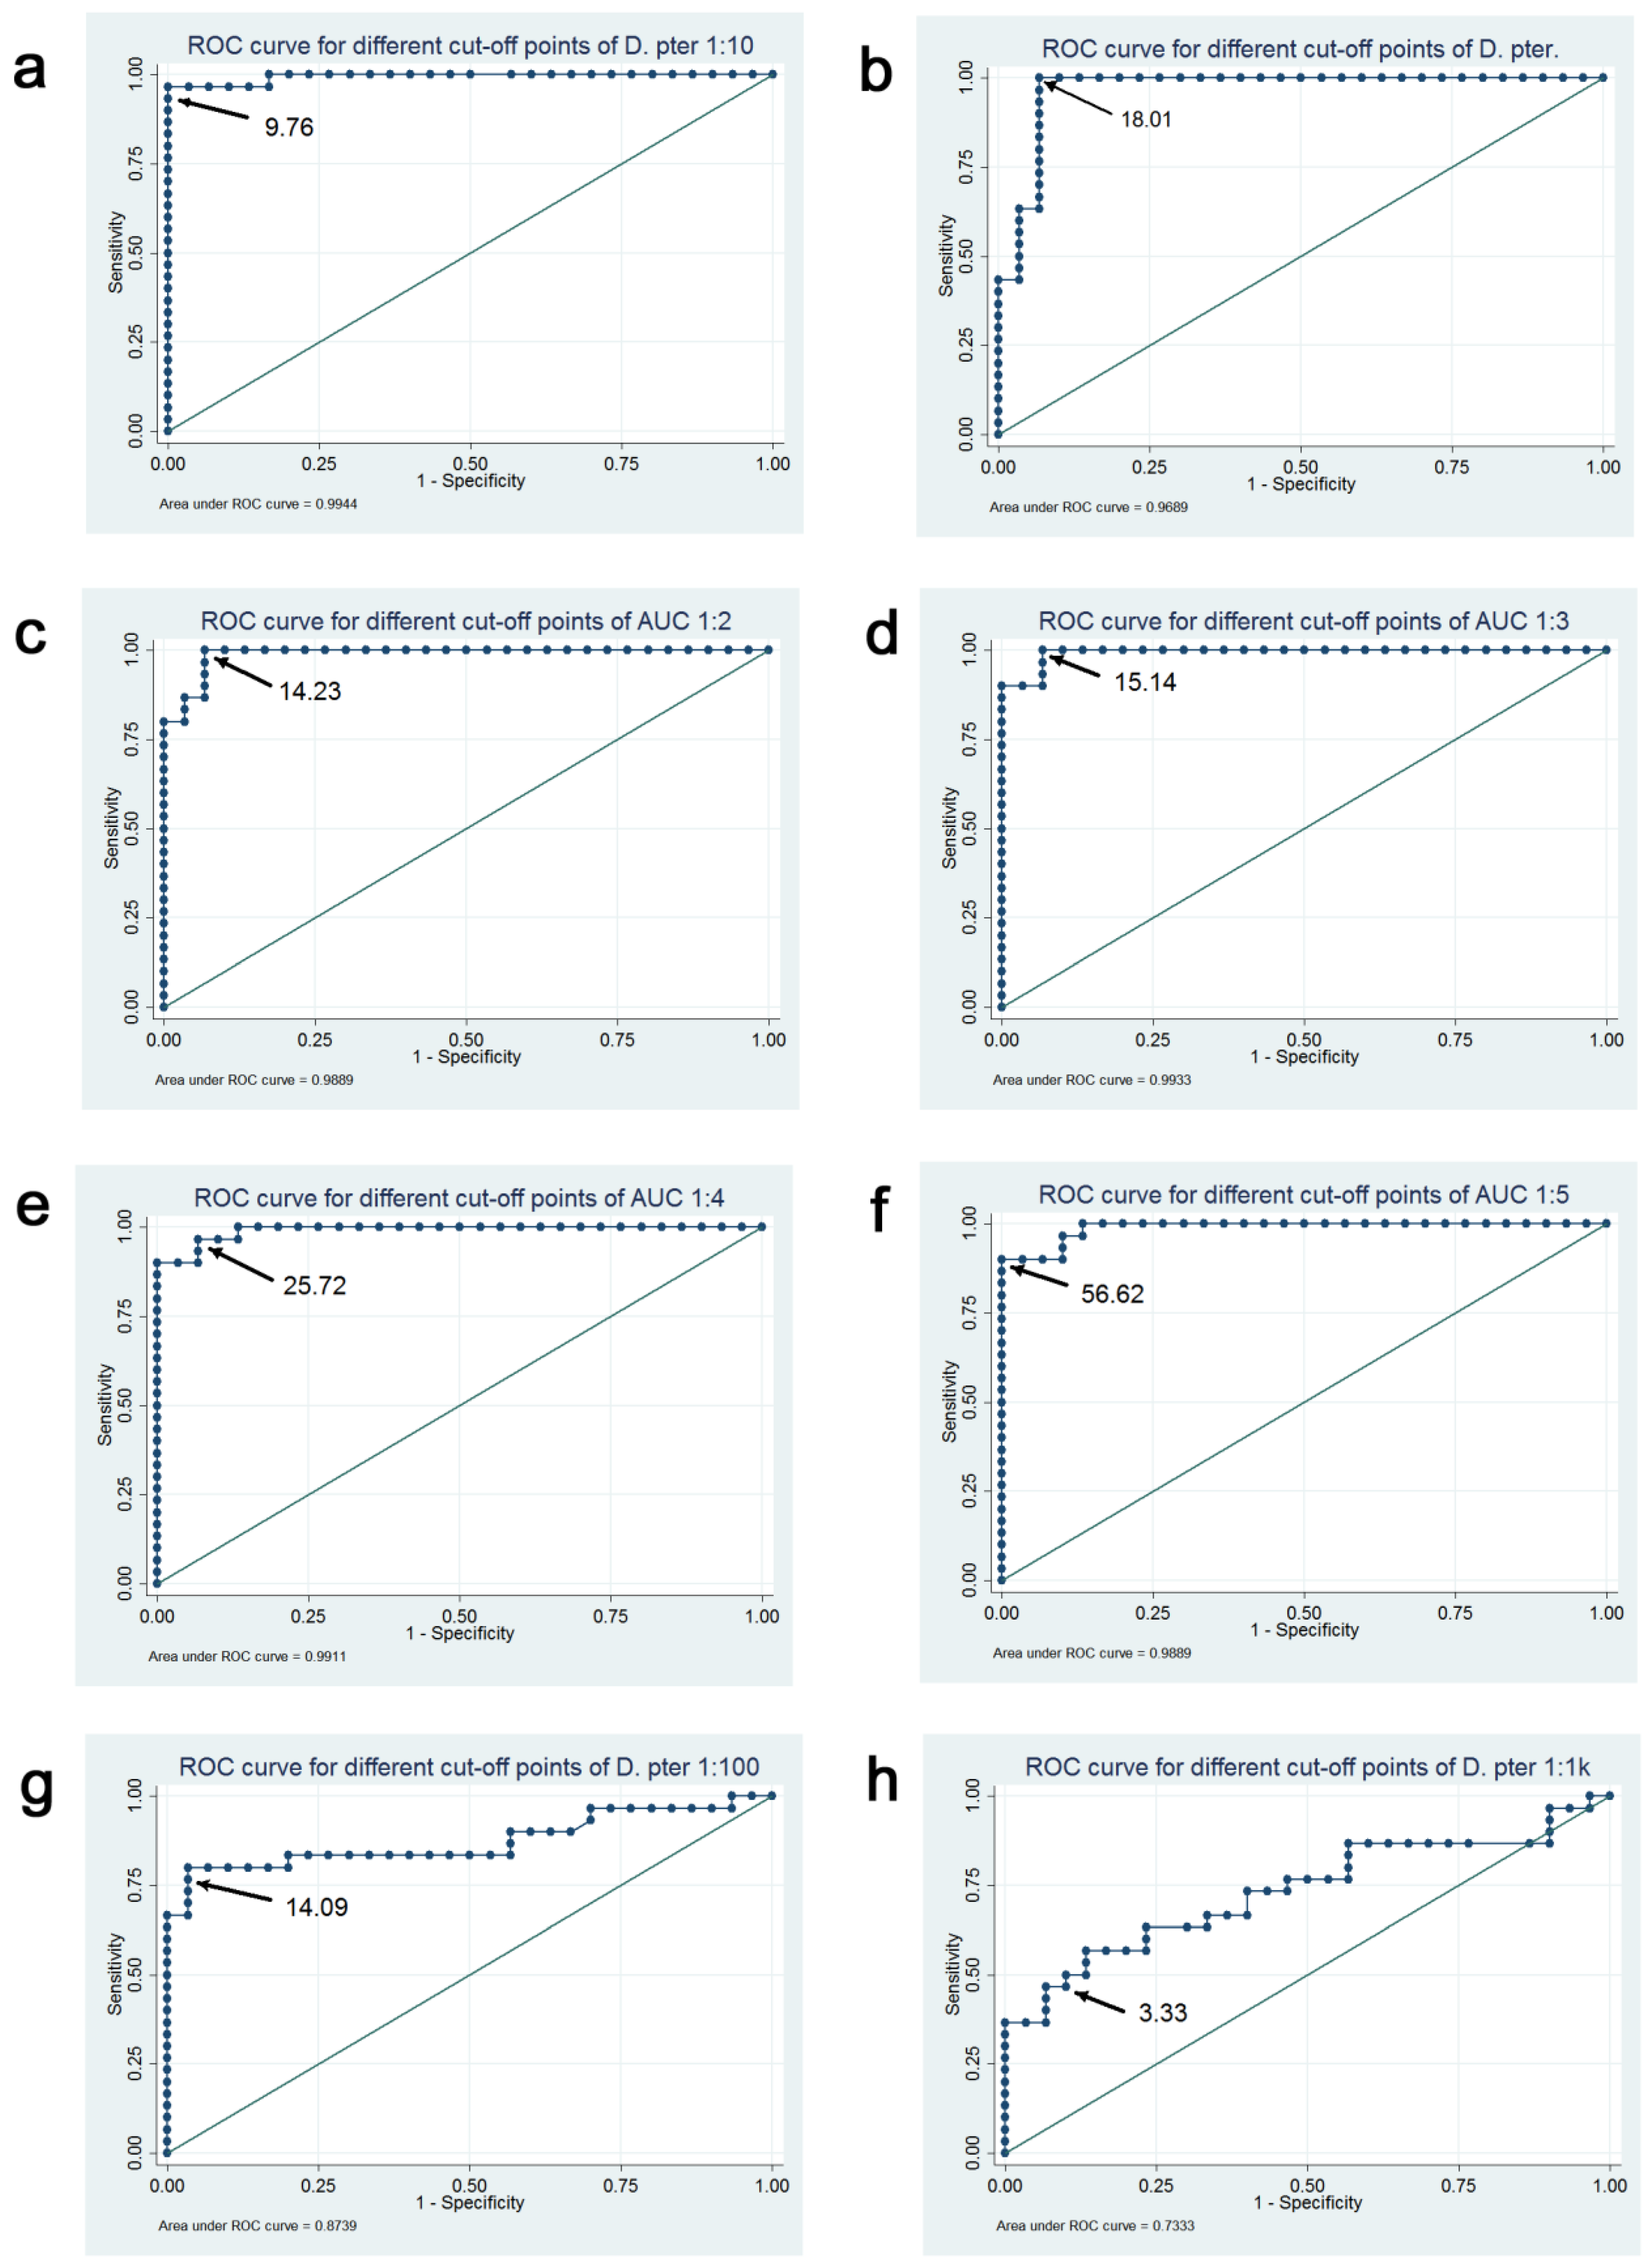
| Analyzed BAT Results | Optimal Cut-Off | Correctly Classified (%) | Sensitivity (%) | Specificity (%) | AUC for ROC (95% CI) | Plot in Figure 3 |
|---|---|---|---|---|---|---|
| BAT D. pteronyssinus 2.25 ng/mL | 9.76% | 95.31 | 90.63 | 100.00 | 0.98 (0.95–1.00) | a |
| BAT D. pteronyssinus 22.5 ng/mL | 18.01% | 93.75 | 93.75 | 93.75 | 0.96 (0.92–1.00) | b |
| BAT AUC_1-2 | 14.23 | 93.75 | 93.75 | 93.75 | 0.98 (0.96–1.00) | c |
| BAT AUC_1-3 | 15.14 | 93.75 | 93.75 | 93.75 | 0.97 (0.94–1.00) | d |
| BAT AUC_1-4 | 25.72 | 92.19 | 90.63 | 93.75 | 0.96 (0.91–1.00) | e |
| BAT AUC_1-5 | 12.79 | 92.19 | 96.88 | 87.50 | 0.96 (0.91–1.00) | f |
| BAT D. pteronyssinus 0.225 ng/mL | 14.09% | 85.94 | 75.00 | 96.88 | 0.84 (0.73–0.95) | g |
| BAT D. pteronyssinus 0.0225 ng/mL | 3.33% | 70.31 | 56.25 | 84.38 | 0.72 (0.59–0.85) | h |
| “Gold Standard” | BAT-Positive | BAT-Negative |
|---|---|---|
| Relevant allergy to D. pteronyssinus | 29 | 3 |
| No allergy to D. pteronyssinus | 0 | 32 |
| “Gold Standard” | BAT-Positive | BAT-Negative |
|---|---|---|
| Relevant allergy to D. pteronyssinus | 28 | 4 |
| No allergy to D. pteronyssinus | 0 | 32 |
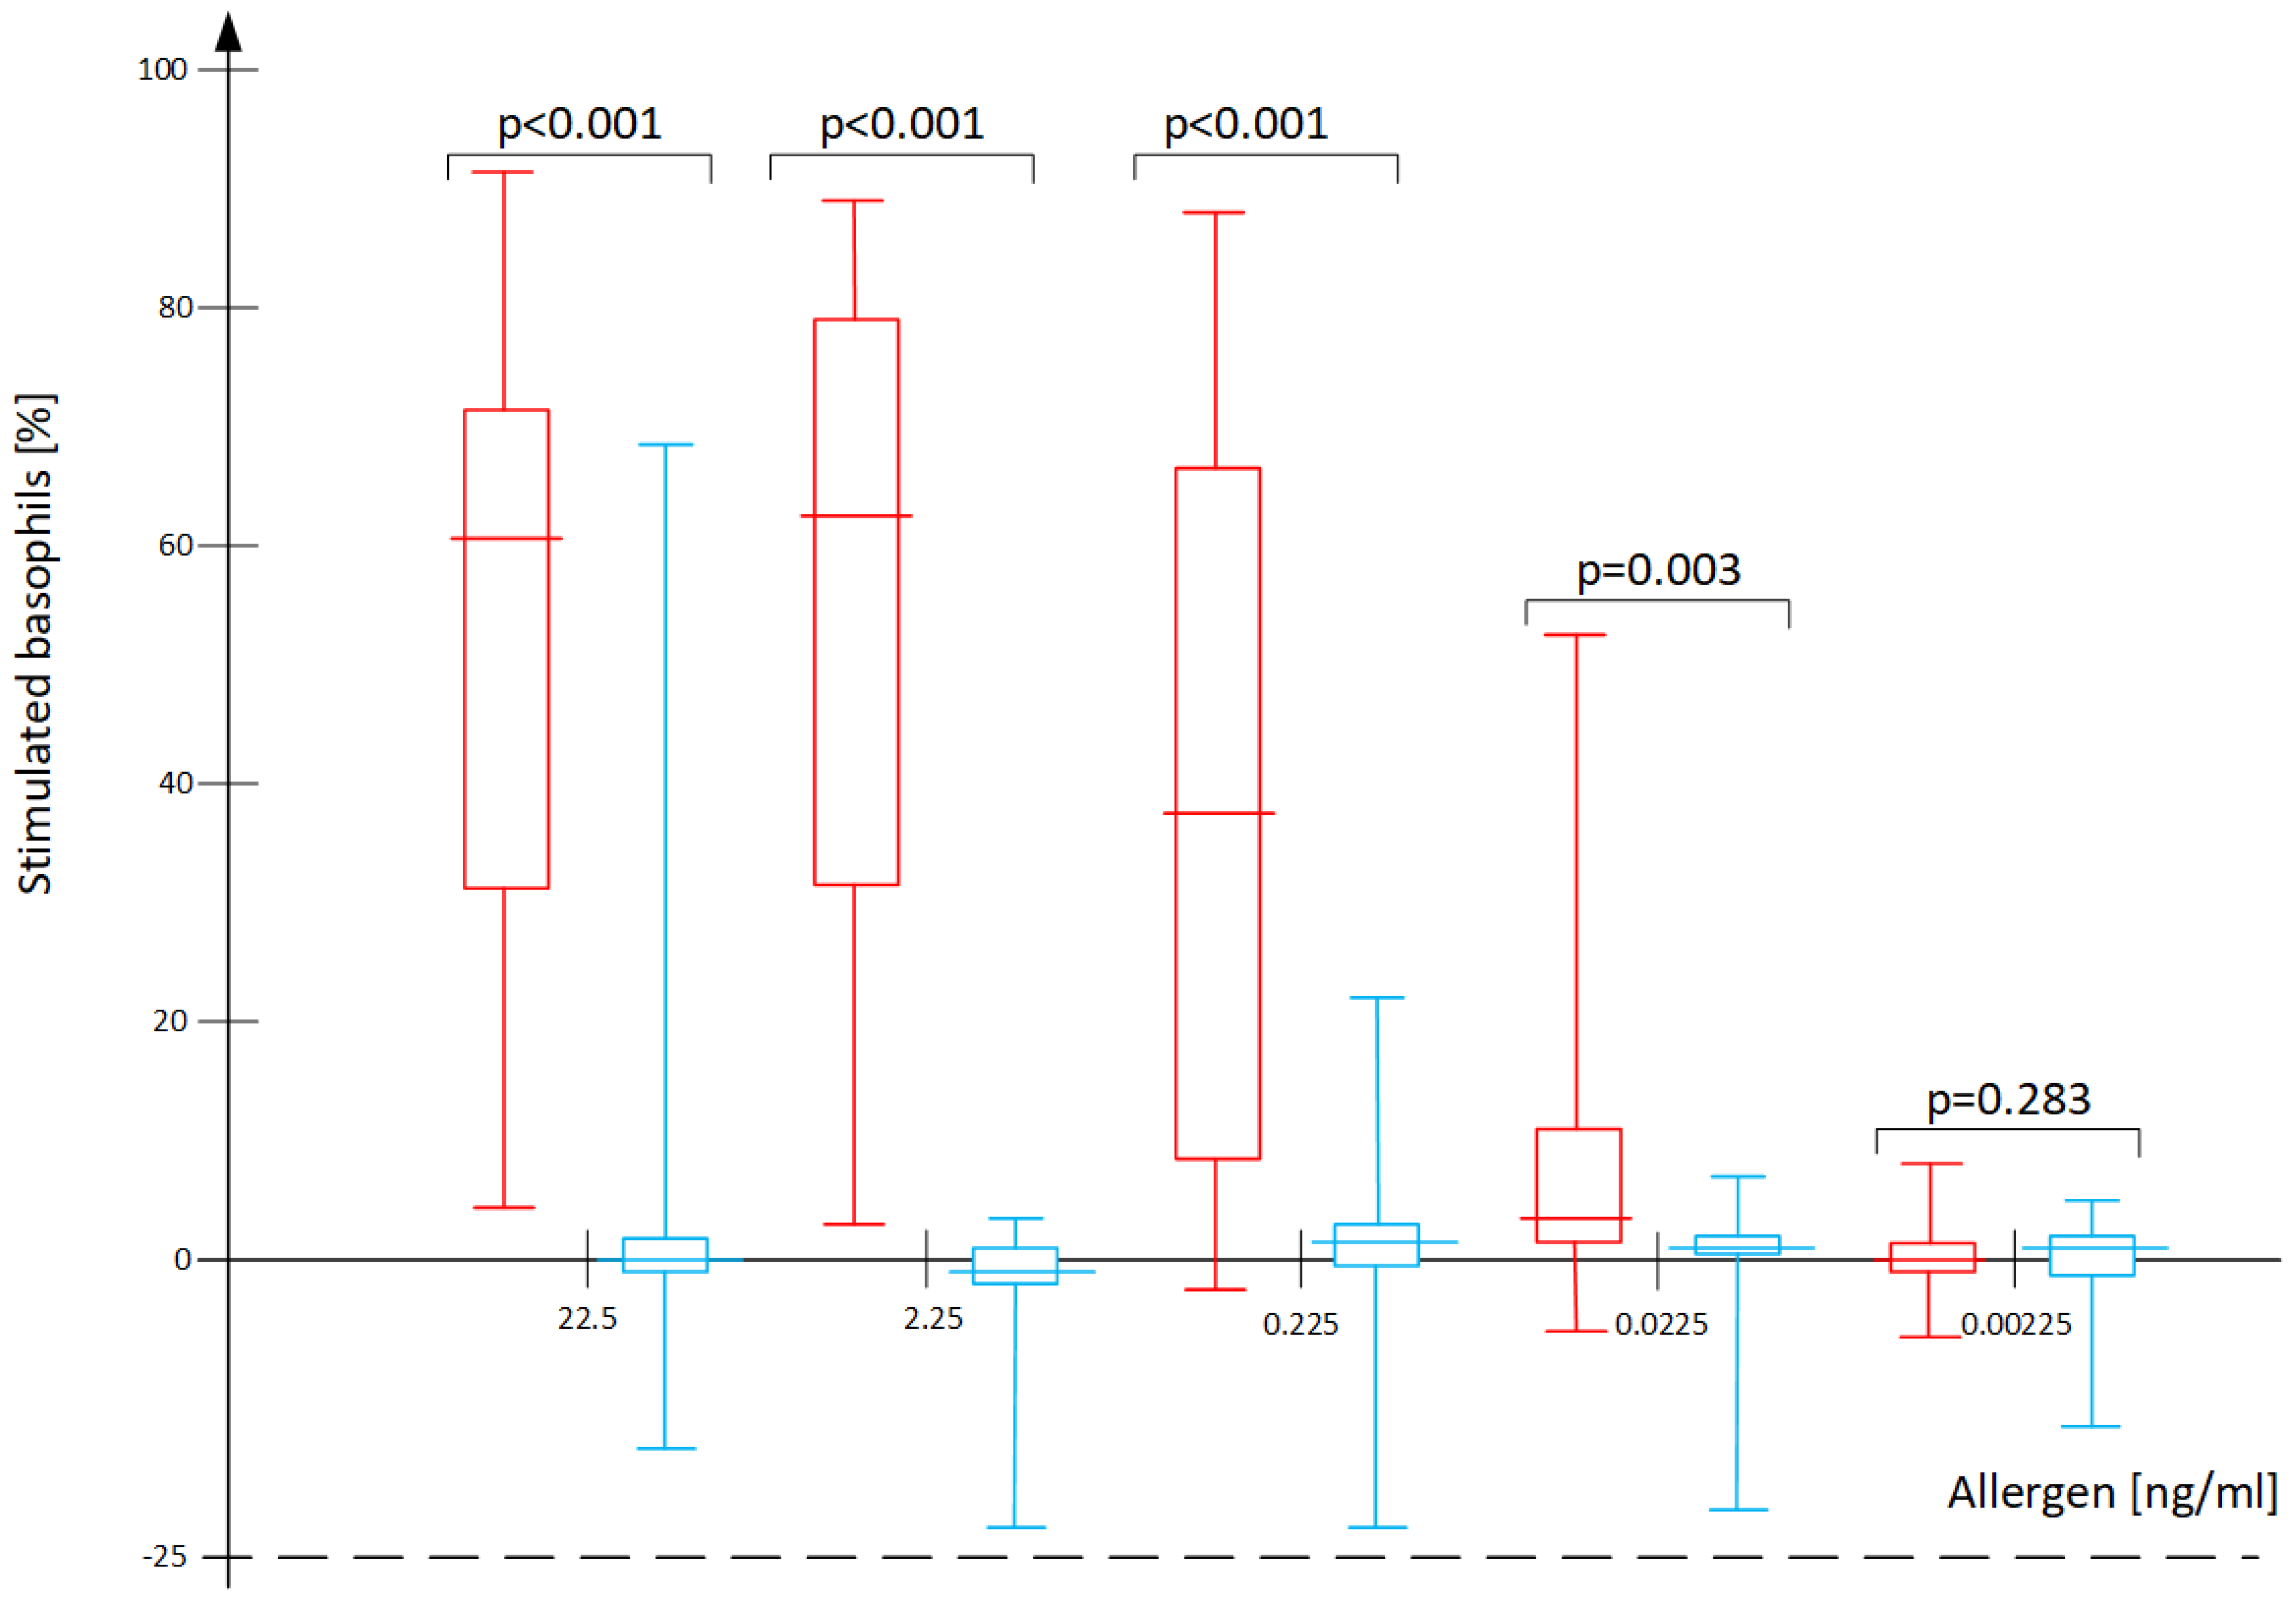
| sIgE D. pteronyssinus [kU/L] | SPT D. pteronyssinus (Wheal Diameter) [mm] | BAT D. pteronyssinus 22.5 ng/mL (% act.) | BAT D. pteronyssinus 2.25 ng/mL (% act.) | BAT D. pteronyssinus 0.225 ng/mL (% act.) | BAT D. pteronyssinus 0.0225 ng/mL (% act.) | |
|---|---|---|---|---|---|---|
| SPT D. pteronyssinus (wheal diameter) [mm] | r = 0.78 p < 0.001 | |||||
| BAT D. pteronyssinus 22.5 ng/mL (% act.) | r = 0.71 p < 0.001 | r = 0.77 p < 0.001 | ||||
| BAT D. pteronyssinus 2.25 ng/mL (% act.) | r = 0.74 p < 0.001 | r = 0.82 p < 0.001 | r = 0.90 p < 0.001 | |||
| BAT D. pteronyssinus 0.225 ng/mL (% act.) | r = 0.55 p < 0.001 | r = 0.64 p < 0.001 | r = 0.67 p < 0.001 | r = 0.78 p < 0.001 | ||
| BAT D. pteronyssinus 0.0225 ng/mL (% act.) | r = 0.39 p = 0.001 | r = 0.39 p = 0.001 | r = 0.44 p < 0.001 | r = 0.56 p < 0.001 | r = 0.74 p < 0.001 | |
| BAT D. pteronyssinus 0.00225 ng/mL (% act.) | r = 0.06 p = 0.666 | r = −0.16 p = 0.210 | r = −0.03 p = 0.830 | r = 0.05 p = 0.677 | r = 0.15 p = 0.238 | r = 0.34 p < 0.001 |
Disclaimer/Publisher’s Note: The statements, opinions and data contained in all publications are solely those of the individual author(s) and contributor(s) and not of MDPI and/or the editor(s). MDPI and/or the editor(s) disclaim responsibility for any injury to people or property resulting from any ideas, methods, instructions or products referred to in the content. |
© 2024 by the authors. Licensee MDPI, Basel, Switzerland. This article is an open access article distributed under the terms and conditions of the Creative Commons Attribution (CC BY) license (https://creativecommons.org/licenses/by/4.0/).
Share and Cite
Spiewak, R.; Gregorius, A.; Ostrowski, G.; Czarnobilska, E. Optimization of Basophil Activation Test in the Diagnosis and Qualification for Allergen-Specific Immunotherapy in Children with Respiratory Allergy to the House Dust Mite Dermatophagoides pteronyssinus. Int. J. Mol. Sci. 2024, 25, 9959. https://doi.org/10.3390/ijms25189959
Spiewak R, Gregorius A, Ostrowski G, Czarnobilska E. Optimization of Basophil Activation Test in the Diagnosis and Qualification for Allergen-Specific Immunotherapy in Children with Respiratory Allergy to the House Dust Mite Dermatophagoides pteronyssinus. International Journal of Molecular Sciences. 2024; 25(18):9959. https://doi.org/10.3390/ijms25189959
Chicago/Turabian StyleSpiewak, Radoslaw, Aleksandra Gregorius, Grzegorz Ostrowski, and Ewa Czarnobilska. 2024. "Optimization of Basophil Activation Test in the Diagnosis and Qualification for Allergen-Specific Immunotherapy in Children with Respiratory Allergy to the House Dust Mite Dermatophagoides pteronyssinus" International Journal of Molecular Sciences 25, no. 18: 9959. https://doi.org/10.3390/ijms25189959