Abstract
Major latex proteins, or MLPs, are crucial to plants’ capacity to grow, develop, and endure biotic and abiotic stresses. The MLP gene family has been found in numerous plants, but little is known about its role in Populus simonii × P. nigra. This study discovered and assessed 43 PtMLP genes that were unevenly dispersed throughout 12 chromosomes in terms of their physicochemical characteristics, gene structure, conserved motifs, and protein localization. Based on their phylogeny and protein structural characteristics, three separate subclasses of PtMLP family were identified. Segmental and tandem duplication were found to be essential variables in the expansion of the PtMLP genes. The involvement of the PtMLP genes in growth and development, as well as in the responses to different hormones and stresses, was demonstrated by cis-regulatory element prediction. The PtMLP genes showed varying expression patterns in various tissues and under different conditions (cold, salt, and drought stress), as demonstrated in RNA-Seq databases, suggesting that PsnMLP may have different functions. Following the further investigation of the genes demonstrating notable variations in expression before and after the application of three stresses, PsnMLP5 was identified as a candidate gene. Subsequent studies revealed that PsnMLP5 could be induced by ABA treatment. This study paves the way for further investigations into the MLP genes’ functional mechanisms in response to abiotic stressors, as well as the ways in which they can be utilized in poplar breeding for improved stress tolerance.
1. Introduction
Initially identified in 1985 in opium poppies, major latex proteins (MLPs) are a class of tiny proteins specific to plants, with a molecular weight of roughly 20 kDa. As the opium poppy is subjected to mechanical damage, the proteins are secreted to the surface of the wounded plant and are dispersed throughout the growing and mature latex ducts of the plant [1,2]. After their initial identification, MLPs were found in cotton, apple, peach, tobacco, grape, and other plants [2,3,4,5,6,7,8]. Three groups of MLP homologs can be distinguished: pathogenesis-related protein 10 (PR-10), MLPs, and Bet v 1. As PR-10 family members exhibit allergenicity and are present as allergens in many plants, there are more studies on Bet v 1 and PR-10 and fewer on MLPs [9,10]. This is because oral allergy syndrome and other conditions can be caused by cross-reactivity with homologous Bet v 1-specific IgE, which explains why studies on Bet v 1 and PR-10 were conducted earlier and primarily from a medical perspective [11]. As a result, MLPs have received less attention in research in comparison to Bet v 1 and PR-10 [10,12]. However, as MLPs have broader biological activity than the other two homologous proteins, they have attracted increasing attention in recent years.
Members of the homologous family of MLPs have a common Bet v 1 structural domain. Studies have shown that, whereas there is little similarity in the primary structure (amino acid sequence), there is an elevated degree of similarity in the secondary and tertiary structures, which consist of three to four α-helices (short, α1, α2, and long α3), seven β-folds (β1–β7), and nine loops (L1–L9) [13,14]. The most characteristic structural feature of the homolog is an internal hydrophobic cavity with a ‘Y’ shape, which is formed by the β1–β7 wrapped around the long α3 [14,15]. This cavity allows the MLPs in many plants to bind hydrophobic substances, such as steroids, organic compounds, and long-chain fatty acids. MLPs from the Cucurbitaceae family can bind hydrophobic organic pollutants in the roots and then transport them to the aerial parts [15,16]. Cucurbitaceae MLP genes have the ability to move hydrophobic organic contaminants that are absorbed by the roots via hydrophobic crevices of the ‘Y’ type, which is important for bioremediation using cucurbits [17].
The second major structural characteristic of MLPs is the presence of a largely homogenous three-dimensional structure, a glycine-rich L4 loop (GXGGXG) connecting β2 and β3. This loop is substantially conserved among MLPs members [14,18]. The steroidogenic acute regulatory protein-associated lipid transfer structural domain, which is the third major structural feature, indicates that MLPs can bind steroids [13]. This steroidal acute regulatory protein-associated lipid transfer domain has also been found in abscisic acid (ABA) receptor pyrabactin resistance 1 (PYR1). As a result, MLPs are probably involved in the ABA signaling pathway through their binding to ABA [19,20].
Members of the MLP family are capable of responding to both biotic and abiotic stressors, and they play significant roles in the growth and development of plants [21,22]. The expression of MLP genes has been demonstrated to be induced by invasive plant diseases [23,24], and MLP genes primarily support plant defense via signals of acquired resistance (SAR) and intrinsic immunity [25,26,27]. Yang et al. discovered that the expression of GhMLP28 could be induced by exogenous Verticillium dahliae, while GhMLP28 contributed to Verticillium dahliae’s defense by promoting GhERF6’s binding to the recognition site in the upstream region of the PR gene. GhERF6 increased the expression of the PR gene and conferred disease resistance on cotton by binding to the GCC-box [5]. In the Arabidopsis thaliana functionally deficient mutant mlp, leaves farther from the inoculation site lost resistance, suggesting that MLP genes are involved in plant SAR. In addition, MLPs can increase plant disease resistance by inducing the formation of flavonoid compounds [3].
Drought, low temperatures, salt, and alkalinity are types of abiotic stress that can inhibit photosynthesis, create metabolic problems, impede growth and development, and, in extreme cases, even cause mortality. Effector molecules, which are directly involved in metabolism, and their upstream regulators enable plants to respond to abiotic stressors. Few research studies have been performed to investigate the ways in which MLPs affect abiotic stress in plants; however, in recent years, an increasing number of studies have suggested that MLPs play an essential role in this context. A cold stress response element, an SA-induced element, a salt stress response element, and an injury response element are all found in the promoter region of GhMLP [5]. The promoters of grape VvMLP and tobacco MLP28 contain abiotic stress response elements, such as low-temperature-, light-, dehydration-, and hormone-related response elements, including gibberellin (GA), ethylene (ET), growth hormone, and ABA [6,22]. According to Wang et al. [28], Arabidopsis thaliana MLP43 functions as a positive regulator and can bind to SnRK2 and the ABA response element-binding factor ABF1. It additionally plays a role in the ABA signaling-mediated regulation of plant drought tolerance. Furthermore, it has been shown that the expression of certain homologous MLP genes can be induced by salt treatment, which improves plant salt tolerance. According to Yuan et al. [29], ABA, NaCl, and drought stress are capable of inducing some of the MLP genes in apples. These genes may also be implicated in the response of apples to abiotic stresses by way of PRSP, SNRK1/2, bHLH, and other mechanisms. Liu et al. [7,30] also demonstrated that tobacco’s cold tolerance was enhanced by NtMLP423 overexpression. The results of the above research imply that MLPs play a role in how plants react to abiotic stressors.
A hybrid of Populus nigra L. and Populus simonii Carr, Populus simonii × P. nigra is a fast-growing, adaptable, cold- and drought-resistant species that is important for greening, afforestation, and timber in China. It is also a good material for the study of genetic engineering and forest physiology. The whole-genome sequencing and annotation of Populus simonii × P. nigra has not yet been completed; however, the genome of the model species, Populus trichocarpa, has been obtained, and its whole-genome sequencing and annotation were performed in 2006 [31], providing a basis for the genome-level analysis of Populus simonii × P. nigra. In this study, the genome of Populus trichocarpa was utilized for genome-wide identification and analysis. The main elements affecting the yield and quality of poplar are abiotic stresses, including low temperature, high temperature, salt and drought stress, etc. Characterizing and researching the MLP gene family in the poplar genome is very important since it has been demonstrated that this family is involved in the plant’s response to abiotic stresses but it has not yet been identified and functionally studied in poplar.
In this context, we identified 43 MLP genes in Populus trichocarpa and thoroughly investigated their physicochemical characteristics and conserved motifs, the cis-regulatory elements in the promoter region, chromosomal localization, protein localization, gene duplication events, and evolutionary relationships. We further explored the expression patterns of the PsnMLP genes in different tissues and under different abiotic stresses (drought, salt stress, and cold stress). Furthermore, we cloned PsnMLP5, the gene that changed in the Populus simonii × P. nigra roots most significantly and concurrently in response to all three stresses, and we examined its structure and possible relationship with ABA. Although the MLPs have been identified in some species of poplar [32], this work is the first in which the MLP gene family has been identified and characterized in Populus simonii × P. nigra, laying the foundation for the further investigation of the functional mechanisms of the MLP genes in response to abiotic stresses in Populus simonii × P. nigra, as well as their application in the breeding of poplar for stress tolerance.
2. Results
2.1. Identification and Characterization of PtMLP Genes
A total of 20 PtMLP genes were initially screened using the Bet_v_1 structure file, and 46 PtMLP genes were identified after sequence alignment and re-modeling. Using SMART and Interpro, we verified that all of the identified genes encoded proteins with a Bet_v_1 domain. A total of 43 MLP genes in Populus trichocarpa were obtained at the genome-wide level and named PtMLP1–PtMLP43 for brevity. The members of the PtMLP gene family varied widely in terms of their amino acid lengths and physicochemical properties. The number of amino acids ranged from 79 (PtMLP21) to 221 (PtMLP41), the molecular weight of the proteins ranged from 8471.61 (PtMLP21) to 24,059.16 Da (PtMLP9), the theoretical isoelectric point ranged from 4.65 (PtMLP7) to 8.73 (PtMLP9), the instability coefficients ranged from 16.92 (PtMLP14) to 54.69 (PtMLP31), the aliphatic index ranged from 74.9 (PtMLP38) to 109.21 (PtMLP37), and the overall average value of hydropathicity ranged from −0.522 (PtMLP38) to 0.028 (PtMLP37). The predictive analysis of subcellular localization showed that the PtMLPs were mostly localized in the cytoplasm (79.1%), and very few were localized in the extracellular region (11.6%), nuclear region (6.98%), and organelles, such as chloroplasts (6.98%) and mitochondria (2.33%) (Figure 1C). The details are listed in Table S1.
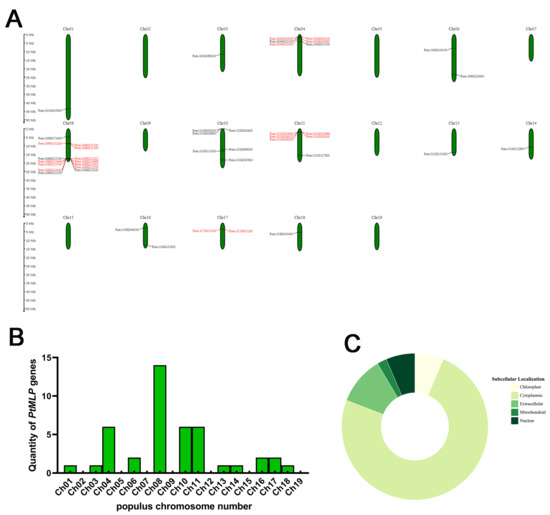
Figure 1.
Genomic distributions and prediction of subcellular localization of PtMLPs. (A) PtMLP gene distribution across 19 chromosomes of Populus trichocarpa. Vertical bars represent chromosomes and the scale on the left represents the chromosome length (Mb). Tandemly duplicated genes are indicated in red. (B) Numbers of PtMLP genes on each chromosome. (C) Subcellular localization prediction of PtMLPs.
2.2. Chromosome Distribution and Phylogenetic Analysis of the PtMLP Gene Family
The 43 PtMLP genes were distributed extensively and unevenly on 12 chromosomes, but there were no PtMLP genes located on chromosomes 2, 5, 7, 9, 12, 15, and 19. A total of 14 PtMLP genes were located on chromosome 8, representing the largest number of PtMLP genes. Most PtMLP genes were located at the proximal or distal ends of these chromosomes, and high densities of PtMLP genes were distributed at the front ends of chromosomes 4 and 11 and the bottom of chromosome 8 (Figure 1A,B).
To investigate the evolutionary relationships among the MLP genes from Arabidopsis thaliana and Populus trichocarpa, an unrooted phylogenetic tree was generated based on the alignment of the amino acid sequences for 69 MLPs, including 26 Arabidopsis and 43 poplar members. The results showed that the MLP gene family could be divided into three subfamilies, namely, Class I, Class II, and Class III, containing 9, 11, and 23 PtMLP family members, respectively. The evolutionary tree showed that PtMLP members belonging to subfamily Class II were closer to the Arabidopsis MLP family than the other two subfamilies (Figure 2A).
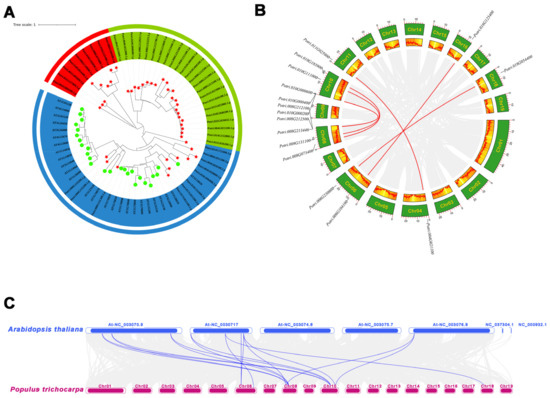
Figure 2.
Phylogenetic analysis of PtMLPs. (A) Phylogenetic relationships of MLPs between Populus trichocarpa and Arabidopsis thaliana. The three subclasses are marked with different colors. Red represents Class I, blue represents Class II, and green represents Class III. PtMLPs are marked with red stars and AtMLPs are marked with green circles. (B) The segmental replication events of PtMLP genes in Populus trichocarpa. Gray lines indicate all synteny blocks in the Populus trichocarpa genome and red lines indicate segmental duplication of PtMLP genes. (C) Collinearity analysis of MLP genes between Populus trichocarpa and Arabidopsis thaliana. Blue lines indicate the homologous MLP gene pairs.
2.3. Gene Structure and Conserved Motifs of the PtMLP Gene Family
The exon and intron composition analysis revealed that most members of the PtMLP gene family had two exons and only a small percentage had one exon, all belonging to Class I (Figure 3A). Following the motif analysis, three conserved motifs were found in the PtMLP family. Members of Class I had two conserved motifs (motif1 and motif3). Most members of Class II had only one conserved motif (motif3), with the exception of PtMLP3, which had two conserved motifs but belonged to Class II. Members of Class III had three conserved motifs (Figure 3A,B). These results indicate that genes with closer kinship have higher conserved motif similarity; however, there are some distinctions between individual genes. Additionally, family members with comparable gene structures can be aggregated into a single group.
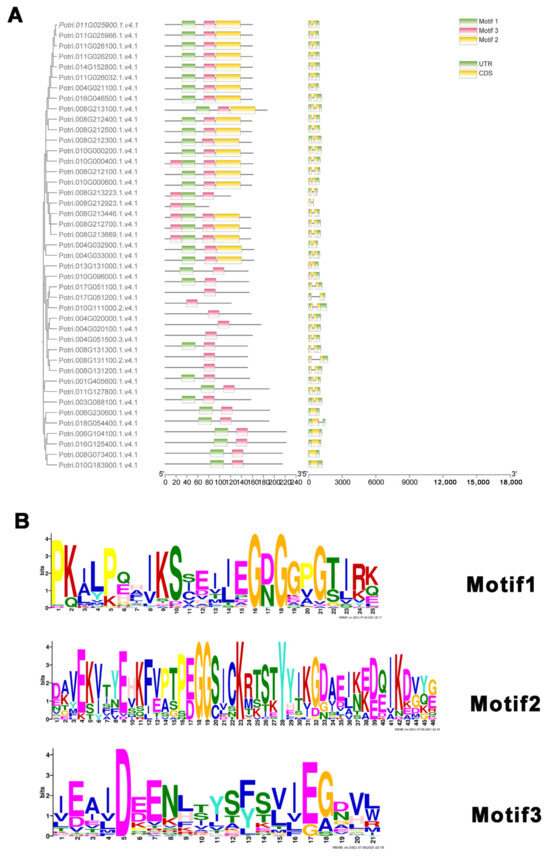
Figure 3.
Gene structure and conserved motifs of PtMLP family. (A) The gene structure and conserved motifs of PtMLPs. Left: Conserved motifs are displayed in different colors and correspond one-to-one in the structural diagram. Right: yellow boxes represent exons, green boxes represent untranslated regions, and black lines indicate introns. (B) The logo and indicated domain of each motif.
2.4. Gene Duplication, Genome Synteny and Selective Pressure Analysis of the PtMLP Gene Family
Tandem duplications and segmental duplications have promoted the expansion of new gene family members and the generation of new functions in the evolution of plant genomes. The segmental and tandem duplication events in the PtMLP gene family were investigated to elucidate its gene duplication events in P. trichocarpa. The analysis showed that there were 13 pairs of tandemly duplicated genes (21/43, 48.8%) in the PtMLP family: one pair on chromosome 17, two pairs on chromosome 4, three pairs on chromosome 11, and seven pairs on chromosome 8 (Figure 1 and Table S2). While the CDS sequences differed, the amino acid sequences of PtMLP32 and PtMLP33 were the same. PtMLP20, PtMLP24, and PtMLP25 were identical in both amino acid sequences and CDS sequences. Using MCScanX techniques, eight segmental duplication occurrences (16/44, 36.4%) were found, in addition to tandem duplication (Figure 2B and Table S2). The results demonstrate that replication events, in which tandem and segmental duplications are major contributors, are probably responsible for the production of PtMLP family members.
The rate of non-synonymous (Ka) and synonymous (Ks) substitutions is important in understanding the repeated event selection pressure. A Ka/Ks value of >1 indicates that positive selection is performed, a Ka/Ks value of 1 indicates neutral evolution, and a Ka/Ks value of <1 indicates purifying selection. The Ka/Ks values of tandemly duplicated PtMLP genes were 0–1.410, with a mean value of 0.401, and one pair had a value of >1, which was likely to have received positive selection (PtMLP42, PtMLP43). The Ka/Ks values of segmentally duplicated PtMLP genes ranged from 0.04 to 0.51, with an average value of 0.230. From the results, it is clear that most of the PtMLP family received purifying selection (Figure 4 and Table S3). To further explore the possible evolutionary processes of the PtMLP genes, we analyzed the collinearity of the MLP family genes in Populus trichocarpa and Arabidopsis thaliana. The results showed that a total of 16 pairs of orthologs were identified, with a Ka/Ks value of 0.117–0.356 (Figure 2C and Figure 4, and Table S3).
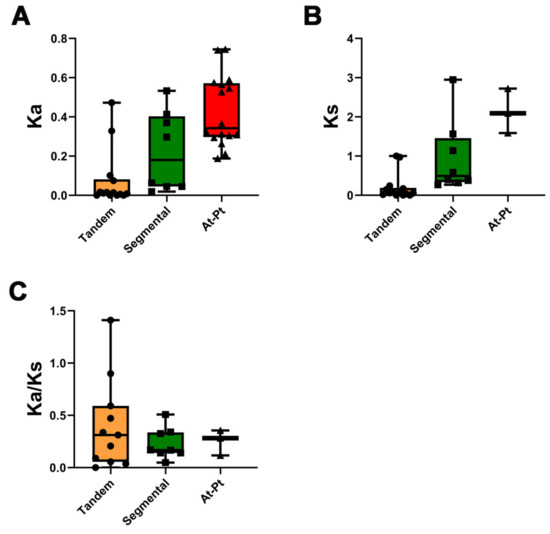
Figure 4.
Ka/Ks analysis of the PtMLP gene family. (A) Average Ka values of tandem duplication and segmental duplication of PtMLPs and the duplication between Populus trichocarpa and Arabidopsis thaliana. (B) Average Ks values of tandem duplication and segmental duplication of PtMLPs and the duplication between Populus trichocarpa and Arabidopsis thaliana. (C) Average Ka/Ks values of tandem duplication and segmental duplication of PtMLPs and the duplication between Populus trichocarpa and Arabidopsis thaliana. The black dots, triangles and squares represent the data values of tandem, segmental and At-Pt duplication, respectively.
2.5. Cis-Regulatory Element Analysis of PtMLP Gene Family
The cis-regulatory elements within the first 2000 bp fragments upstream of the PtMLP genes were predicted and summarized. These elements were categorized into three main groups based on their functions: hormone-responsive, abiotic- and biotic-stress-responsive, and growth-and-development-related elements. PtMLP30 had the most cis-regulatory elements (24), while PtMLP19 and PtMLP42 had the fewest (2). Hormone-responsive elements were the most common cis-regulatory elements in Class I and Class II (44.2% and 46.3%), while abiotic and biotic stress-responsive elements (45.9%) were the most common elements in Class III, and growth-and-development-related elements were the least common in all three subfamilies. The majority of Class I members possessed both the ARE element and the TGACG-motif element (methyl jasmonate response elements). The TGACG-motif element was the most common hormone-responsive element (18), and the ARE element was the most common stress-responsive element (19). The most common hormone-responsive element among the Class II members was the ABRE element (33), while the most common stress-responsive element was the ARE element (17). The majority of members had the ABRE element. With regard to Class III members, the most common hormone-responsive element was the TGACG-motif (64), the most common stress-responsive element was the ARE element (47), and the majority of members had both the TGACG-motif and W-box elements. The most common growth-and-development-related element in all three subfamilies was the CAT-Box, and only Class I members had the AACA-motif element (Figure 5).

Figure 5.
Promoter cis-regulatory element analysis of the PtMLP gene family. (A–C) Cis-regulatory elements of PtMLPs in Class I. (A) represents the hormone-responsive elements, (B) represents the abiotic- and biotic-stress-responsive elements and (C) represents the growth-and-development-related elements. (D–F) Cis-regulatory elements of PtMLPs in Class II. (D) represents the hormone-responsive elements, (E) represents the abiotic- and biotic-stress-responsive elements and (F) represents the growth-and-development-related elements. (G–I) Cis-regulatory elements of PtMLPs in Class III. (G) represents the hormone-responsive elements, (H) represents the abiotic- and biotic-stress-responsive element and (I) represents the growth-and-development-related elements.
2.6. Expression Patterns of PsnMLPs in Different Tissues
We performed RNA-Seq analysis using Populus simonii × P. nigra as the plant material and the Populus trichocarpa genome as the reference genome. Based on the 43 PtMLP genes identified from the results above, the MLP genes of Populus simonii × P. nigra were named PsnMLP1–PsnMLP43. In comparison to the leaves and stems, the majority of the PsnMLP genes were significantly expressed in the roots. PsnMLP13 had the greatest expression level, while seven genes (PsnMLP20, PsnMLP21, PsnMLP23, PsnMLP24, PsnMLP25, PsnMLP27, PsnMLP43) were expressed at extremely low levels in all tissues (Figure 6). Members of Class I were expressed in the roots, stems, and leaves, with higher expression in the roots than in the stems and leaves. Most of the Class II members were expressed in all three tissues and at a higher level. Many of the Class III members had very low expression, being nearly undetectable, and the majority of them were expressed in the roots. It is notable that PsnMLP19 was specifically expressed in the leaves, while PsnMLP15 and PsnMLP26 were expressed only in the stems and PsnMLP35 was expressed in the roots only, suggesting that these genes are involved in the regulation of leaf, stem, and root growth and development, respectively.
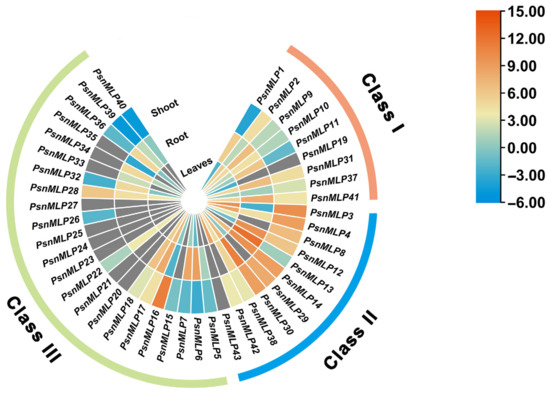
Figure 6.
Expression patterns of PsnMLP genes in different tissues. The gray color indicates that the expression of the gene could not be detected in the RNA-Seq.
2.7. Expression Patterns of PsnMLP Genes Response to Different Abiotic Stresses
As the PsnMLP genes were mainly expressed in the roots, and cis-regulatory elements, such as those responsive to low temperatures and drought, were prevalent in the promoters of the PtMLP genes, the expression patterns under drought, cold, and salt stress in the roots were analyzed using RNA-Seq to further explore the functions of the PsnMLP genes.
With the exception of PsnMLP9 and PsnMLP11, which displayed slight upregulation under cold stress, all of the genes in Class I had downregulated expression. With the exception of PsnMLP2 and PsnMLP37, all genes were downregulated in response to salt stress. In response to drought stress, the expression of five genes was downregulated and that of four genes was upregulated. Under each of the three stresses, the expression levels of PsnMLP1, PsnMLP10, and PsnMLP31 were downregulated. Members of the Class I family showed lower expression overall following their exposure to the three stressors (Figure 7).
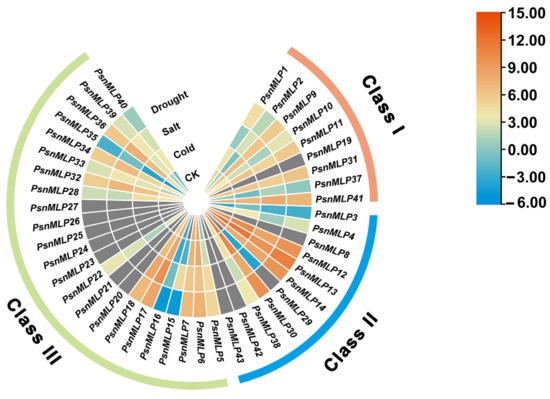
Figure 7.
Expression patterns of PsnMLP genes in response to different abiotic stresses. The gray color indicates that the expression of the gene could not be detected in the RNA-Seq.
With the exception of PsnMLP3, PsnMLP12, and PsnMLP29, which were upregulated, all Class II genes underwent downregulation in response to cold stress. PsnMLP3 and PsnMLP29 were upregulated and the others were downregulated under salt stress; similarly, PsnMLP3 was upregulated and the others were downregulated under drought stress. In all three situations, the comparatively low expression of PsnMLP3 was upregulated (Figure 7).
With the exception of PsnMLP6, PsnMLP7, and PsnMLP16, whose expression was downregulated, the expression of members of the Class III family was generally upregulated following abiotic stress. It is evident that several subfamily members react to abiotic stress in different ways, indicating that the various subfamily members may perform different functions in response to abiotic stress (Figure 7).
A total of 23 PsnMLP genes exhibited significant variations in expression under abiotic stress. The gene with the largest change in expression was PsnMLP15 (log2foldchange = 10.59), and the gene with the smallest change in expression was PsnMLP12 (log2foldchange was −1.010) (Table 1). Following treatment with salt stress, a total of 22 PsnMLP genes (of which 12 were activated and 10 were repressed) exhibited substantial differences regarding changes in their expression. Among them, all 12 PsnMLP genes activated by salt stress were from Class III. In contrast, two of the salt-stress-suppressed PsnMLP genes were from Class I, with two from Class II, and six from Class III. Following drought stress, the expression of eight PsnMLP genes significantly varied; four of these genes were activated by drought stress and the remaining four were repressed. With the exception of PsnMLP30 from Class II, all of them were members of Class III. Following cold stress treatment, the expression of ten distinct PsnMLP genes changed significantly. All of the differential expression genes were induced by cold stress and belonged to Class III, except PsnMLP12 (Figure 8).

Table 1.
PsnMLP genes that exhibited significant variations in expression under abiotic stress.
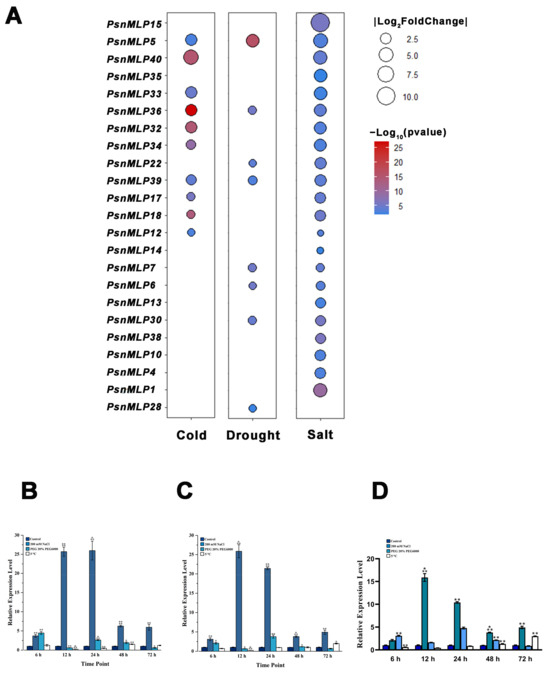
Figure 8.
Expression analysis of PsnMLP genes with significant differences in expression levels. (A) PsnMLP genes with significant variations in expression under abiotic stress. The size of the circle represents the absolute value of log2fold change. The color of the circle indicates the q-value. (B–D) qRT-PCR results of PsnMLP5 (B), PsnMLP36 (C) and PsnMLP39 (D). * represents p < 0.05, ** represents p < 0.01, *** represents p < 0.001, **** represents p < 0.0001.
Three genes, PsnMLP5, PsnMLP36, and PsnMLP39, responded to the three abiotic stresses simultaneously. These genes were all from Class III and were all induced by the three different abiotic stresses. PsnMLP5 displayed the greatest change in expression; thus, we selected it as a candidate gene for further investigation. We next chose all three PsnMLP genes for the qRT-PCR validation of the RNA-Seq data, which demonstrated the plausibility of the RNA-Seq results (Figure 8).
2.8. Response to ABA of PsnMLP5
We cloned PsnMLP5 and proceeded with the analysis. According to a homology study, AT1G24020 (MLP423) is the Arabidopsis homolog of PsnMLP5, and according to GO annotation, AtMLP423 possesses ABA-binding, protein-phosphatase-inhibitory, and ABA receptor activity. The PYR/PYL family of ABA receptors and the MLP family are both protein families with START domains and belong to the START protein superfamily. In addition, upon examining PsnMLP5’s secondary structure, we discovered that it had four α-helices and seven β-folds, a structure shared by the PYR/PYL proteins. The sequence similarity between PsnMLP5 and the AtPYR/PYL receptors was also demonstrated by evolutionary studies, indicating that PsnMLP5 is likely to function as a type of ABA receptor, as well as playing a role in the ABA signaling pathway to regulate the poplar response to salt stress by binding ABA (Figure 9). Consequently, we postulated that PsnMLP5 would respond to ABA. Therefore, we sprayed poplar seedlings with an ABA solution and then detected the expression of PsnMLP5. The results showed that PsnMLP5 could be induced by ABA, and its expression was upregulated maximally in the 4th hour of treatment and then gradually decreased, but it always remained upregulated, which proved that the gene was responsive to ABA.
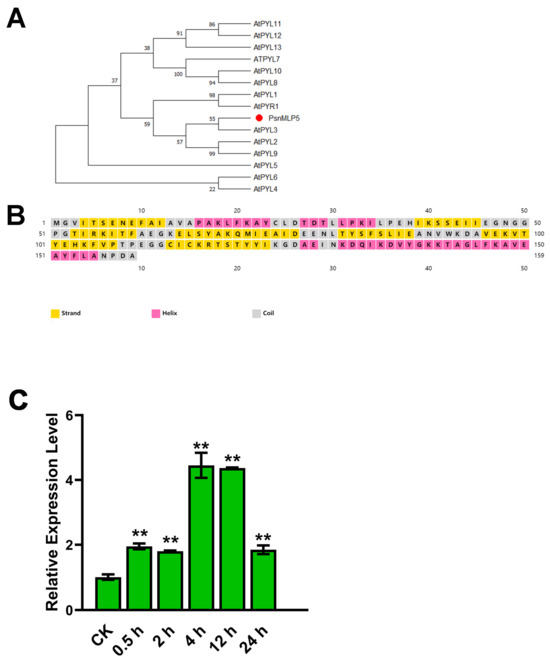
Figure 9.
Response to ABA of PsnMLP5. (A) Evolutionary analysis between PsnMLP5 and AtPYR/PYL receptors. (B) Secondary structure of PsnMLP5. (C) Expression level of PsnMLP5 under ABA treatment. ** represents p < 0.01.
3. Discussion
MLPs are a family of plant-specific proteins that have been demonstrated to play significant roles in both abiotic and biotic stress responses, as well as plant growth and development [9,33,34]. Although MLPs have been found in a wide variety of plants, and some of these have been subjected to related gene family investigations, for poplar, a model plant used in forest tree genomics research, there are not yet any published MLP genes. In this study, the PtMLP genes were screened and identified at the genome-wide level. A total of 43 PtMLP genes were found, and, using bioinformatics techniques, their physicochemical characteristics, gene structures, conserved motifs, protein localization, evolutionary relationships, and promoter cis-acting elements were investigated. In addition, extensive research was carried out on the changes in PsnMLP gene expression in various tissues, as well as in response to low temperature, drought, and salt stress. Finally, PsnMLP5, a gene that responds to these three abiotic stresses at the same time, was screened to investigate its role in abiotic stress and its relationship with ABA. This work provides insights into the role of poplar MLP genes in response to abiotic stimuli and provides the information needed to fully understand the poplar MLP gene family.
In several plants, the MLP gene family has been fully described at the genome level; the number of MLP genes differs among species but not based on the genome size. In the dicotyledonous plant tomato (827 M), 34 were found, as well as 36 in apple (700 M) and 14 in grape (490 M) [3,6,28,29]. However, only two to three MLP genes were identified in the monocotyledons Brachypodium distachyon and Zea mays [9]. The difference in the number of MLP genes in monocots and dicots may indicate that the MLP family diverged after the monocotyledon–dicotyledon division during plant evolution. In this research, we identified a total of 43 PtMLP genes in the Populus trichocarpa genome, which is consistent with the results of previous studies. The 43 PtMLP genes can be classified into three subfamilies, and members of the same subfamily have similar gene structures and conserved motifs. Physicochemical and subcellular localization analyses showed that most of the PtMLP family was located in the cytoplasm, with a small portion in the nucleus and extracellular region, which is also consistent with previous studies [35].
Gene duplication is important for the evolution of physiological and ecological diversity in plants [36]. In this study, the PtMLP gene family experienced 13 tandem duplication pairs and eight segmental duplication pairs, with the majority of the duplication events occurring at the ends of the chromosomes. This result was consistent with earlier research on MLP genes in tomato and peanut, which revealed that some MLP genes were concentrated at the chromosomal ends [35,37]. These findings indicate that replication events, in which tandem and segmental duplications play a major role, are likely to be necessary for the generation of MLP family members.
Cis-acting promoter elements are involved in the regulation of gene expression through interactions between promoter-binding sites and transcription factors [2,38,39]. The majority of the PtMLP gene promoter regions in our study had a great number of ARE and ABRE elements; this finding is consistent with previous research on MLP genes in other plants [5,6]. The promoters of the MLP genes in peanuts and apples both had more ARE and ABRE motifs, indicating that the MLP genes are probably responsive to ABA and implicated in oxidative stress [29,37]. It is interesting to note that, in contrast to earlier research, the current study identified a large number of TGACG-motifs in the promoter regions of PtMLPs. Me-JA, similar to ABA, has been suggested to be involved in plant growth and development, especially in response to abiotic stresses such as cold stress, salt stress, and others [40]. These results suggest that the PtMLP genes play an important role in the plant response to abiotic stress.
MLPs are thought to be involved in the regulation of growth and developmental processes in plants, and MLP family members have different expression patterns in the different tissues of plants. Studies on tomato showed that ten members of the SlMLP family were highly expressed in the roots, four in the stems, six in the leaves, eight in the flowers, five in the fruits, and six in the seeds [35]. Studies on grape found that most of the VvMLPs were highly expressed in the roots as well as in the mature leaves, with lower levels in the stems [6]. In this research, the majority of the PtMLP genes were expressed in the roots; nevertheless, there were variations across the various subfamilies. The genes in Class II were expressed in the roots, stems, and leaves at higher levels than in the other two subfamilies. Furthermore, a few members were exclusively expressed in a particular tissue, indicating that distinct subfamilies might play distinct roles in poplar development and growth.
Although the majority of studies on the MLPs’ response to stress focused on biotic stresses, such as disease, a growing number of studies have also shown that MLPs are involved in plants’ responses to abiotic stress in recent years. Heat, cold, and salt stress all induced the expression of grape VvMLP1/2/3/6/9 [6]. In tomato, SIMLPs could respond to low temperature, high temperature, salt, and drought stress, but the number of upregulated SIMLPs was low [35]. This research revealed that PsnMLP genes belonging to distinct subfamilies had distinct stress response patterns. Specifically, the expression of Class I and II PsnMLP genes was primarily repressed in response to abiotic stimuli, while that of Class III PsnMLP genes was primarily promoted. Furthermore, the results demonstrated that the majority of the PsnMLP genes from Class III that had notable variations in expression were induced following abiotic stress, which suggests that the different subfamilies may exert different functions in response to abiotic stresses. The GO and KEGG analyses indicated that the differential genes were involved in the plant MAPK signaling pathway and phytohormone signaling. Members of Class III may play important roles in the response to abiotic stress in poplar, and their roles may be realized by affecting the MAPK signaling pathway and hormone signaling pathway.
The tertiary structure of the MLPs is similar to that of the ABA receptor, which means that it is likely to have a similar function in binding ABA or participating in the ABA signaling pathway [19,41]. Previous studies have shown that MLPs can participate in ABA synthesis and signaling pathways [28,30]. In our study, PsnMLP5, a gene that responds to three abiotic stresses simultaneously, was screened in the roots of Populus simonii × P. nigra.
Subsequent investigations revealed that ABA could stimulate PsnMLP5 expression, indicating that PsnMLP5 may participate in the ABA signaling pathway [28]. Additionally, its Arabidopsis homolog, AtMLP423, was shown to have ABA-binding and receptor activity. Thus, we hypothesize that PsnMLP5 functions as an ABA receptor and participates in the ABA signaling pathway, regulating poplar’s tolerance to abiotic stress. Based on prior research, which also demonstrated that MLPs can use their cavity structure to bind hydrophobic substances for transport from roots to shoots [17], we hypothesize that PsnMLP5 may bind ABA in plant roots and transfer it to other organs via xylem and phloem conduits, regulating the tolerance of the plant to stress. We will take PsnMLP5 as a candidate gene in subsequent studies to investigate its interactions with ABA and the molecular mechanism involved in regulating abiotic stress resistance in poplar.
4. Materials and Methods
4.1. Plant Materials and Treatments
The plant materials used in this research were derived from Populus simonii × P. nigra, which was obtained from the Northeast Forestry University. Branches from the same asexual line were hydroponically cultivated in a greenhouse and then divided into four groups after new roots, stems, and leaves had grown within two months. These branches were treated with NaCl (200 mM) and PEG-6000 (20.0% w/v) at 5 °C for 48 h and then frozen in liquid nitrogen immediately and stored at −80 °C for RNA extraction and gene expression analysis.
For the ABA treatment, sterile seedling leaves were sprayed with ABA (Sigma-Aldrich, St. Louis, MO, USA) (100 μM with 0.5% Triton-100 (Thermo Fisher, Waltham, MA, USA)) until dripping for 24 h. Samples (roots, stems, and leaves) were harvested at 0 h, 0.5 h, 2 h, 4 h, 12 h, and 24 h and then frozen in liquid nitrogen and stored at −80 °C for subsequent experiments.
For real-time PCR, the materials and treatments were the same as for the RNA-Seq. The samples were harvested at different time points (0 h, 6 h, 12 h, 24 h, 48 h, and 72 h) and then frozen in liquid nitrogen immediately and stored at −80 °C for expression analysis.
4.2. Identification of PtMLP Genes in Populus trichocarpa
The gene files of Populus trichocarpa and Arabidopsis thaliana were obtained from JGI Phytozome 14.0 (https://phytozome-next.jgi.doe.gov/, accessed on 2 May 2023) [42], and the Hidden Markov Model profiles of Bet_v1 were accessed from the Pfam database (https://pfam.xfam.org/, accessed on 2 May 2023) [43], which was used as a query. Hmmsearch [44] was used to search the Bet_v1 domain against the protein sequences of the Populus trichocarpa genome, and the initially screened proteins were subjected to multiple sequence alignment using ClustalOmega (https://www.ebi.ac.uk/Tools/msa/clustalo/, accessed on 3 May 2023). Based on the alignment results, the hmmbuild algorithm was used to construct a more accurate Hidden Markov Model for subsequent querying. Repeating the previous operation using the new model, the MLPs of Populus trichocarpa were screened twice to obtain the final protein sequences. After removing all redundant sequences, candidate family members were submitted to Interpro (https://www.interprobps.com/, accessed on 5 May 2023) and SMART (http://smart.embl-heidelberg.de/, accessed on 5 May 2023) to manually screen members with the Bet_v1 domain for further analysis. All identified putative PtMLPs were named after Populus trichocarpa with the prefix “Pt”, followed by Arabic numerals sequentially starting from 1.
4.3. Characterization of PtMLP Proteins and Genes
The number of amino acids, the molecular weight (MW), and the theoretical isoelectric point (PI) were calculated using the ExPasy site (https://www.interprobps.com/, accessed on 7 May 2023) [45]. The motif analysis was performed using the MEME program (version 5.0.4, http://alternate.meme-suite.org/tools/meme, accessed on 7 May 2023) [46] with the following parameters: the maximum number of motifs was five, the optimum width of motifs was set between 10 and 50, and the distribution of motif occurrences was zero or one per sequence. The subcellular localization analysis of PtMLPs was predicted using WolF PSORT (https://www.genscript.com/wolf-psort/html, accessed on 10 May 2023). The gene structure analysis was performed using TBtools [47].
4.4. Chromosomal Localization and Phylogenetic Analysis of PtMLP Gene Family
Chromosome information and gene density information were extracted based on the gene GFF files from genome of Populus trichocarpa. MG2C (http://mg2c.iask.in/, accessed on 10 May 2023) was used to generate the chromosomal position map of the PtMLP gene family. The full-length protein sequences of the MLPs identified in Populus trichocarpa and 26 MLPs in Arabidopsis thaliana were used for the phylogenetic analysis. Multiple sequence alignments were performed using the ClustalW process. An unrooted maximum likelihood phylogenetic tree was constructed using MEGA 7.0 software with a bootstrap test with 1000 iterations [48].
4.5. Promoter Cis-Regulatory Element and Collinearity Relationship Analysis of the PtMLP Gene Family
Sequences of 2000 bp from the promoters of the PtMLP genes were selected for the cis-regulatory element analysis using PlantCARE (http://bioinformatics.psb.ugent.be/webtools/plantcare/html/, accessed on 1 June 2023). The results were visualized with the BioSequence Viewer from TBtools [47]. MCScanX was used to analyze and identify the duplication events and collinearity relationships of the PtMLP gene family. The ratio of synonymous mutations to non-synonymous mutations (Ka/Ks) was calculated using Tbtools [47].
4.6. Expression Pattern Analysis of PsnMLP Gene Family
The expression patterns of the PsnMLP genes in different tissues (roots, stems, and leaves), under different treatments (salt, drought, and cold), were analyzed based on RNA-Seq.
Total RNA was extracted with an RNA extraction kit (Tiangen, Beijing, China) and subsequently reverse-transcribed into cDNA with the PrimeScript RT reagent kit (Takara, Beijing, China). Then, qPCR was conducted. Real-time PCR was performed on the CFX96 (Bio-Rad, Hercules, CA, USA) using TB Green Premix Ex Taq™ II (Takara, Beijing, China) with three biological replicates. The relative expression levels of the genes were calculated using the 2−δδct method. Primers used in this research were listed in Table S4.
5. Conclusions
In this study, a total of 43 PtMLP genes distributed across 12 chromosomes were identified in the Populus trichocarpa genome. They could be classified into three subfamilies according to their gene structures and conserved motifs. Tandem duplications and segmental duplications played an important role in the formation of the PtMLP gene family, while these gene pairs underwent purification selection during the evolutionary process. The PsnMLP genes had different expression patterns, with most of them expressed in the roots at high levels and with two genes expressed only in the stems, while one was expressed only in the roots and one was expressed only in the leaves. In addition, the PsnMLP genes had different expression patterns under salt stress, cold stress, and drought stress, but members of the same subfamily had similar expression patterns. Most of the expression of the members of Class I and II was suppressed by abiotic stress, while most of the members of Class III were induced by stress. Class III included the majority of the genes exhibiting notable variations in expression before and after stress. PsnMLP5 was chosen as a candidate gene for further research because it could react to all three abiotic stresses simultaneously. The findings indicated that PsnMLP5 was responsive to ABA and may regulate poplar’s resistance to abiotic stresses by functioning within the ABA signaling pathway. The functional mechanisms of the poplar MLP genes in abiotic stress can be further investigated with the help of these findings, which are of great importance for poplar resistance breeding.
Supplementary Materials
The following supporting information can be downloaded at: https://www.mdpi.com/article/10.3390/ijms25052748/s1.
Author Contributions
Conceptualization, X.S.; methodology, X.S.; software, X.S.; validation, X.S.; formal analysis, X.S.; investigation, X.S.; resources, X.S. and Q.W.; data curation, X.S. and Y.S.; writing—original draft preparation, X.S.; writing—review and editing, L.W.; visualization, X.S. and Y.L.; supervision, X.S.; project administration, X.S.; funding acquisition, X.S. All authors have read and agreed to the published version of the manuscript.
Funding
This work was supported by the Department of Finance of Heilongjiang [grant number: CZKYF2023-1-C024] and the Sciences Youth Fund of Heilongjiang Academy [grant number: CXJQ2023GJS01].
Institutional Review Board Statement
Not applicable.
Informed Consent Statement
Not applicable.
Data Availability Statement
Data is contained within the article and Supplementary Materials.
Conflicts of Interest
The authors declare no conflicts of interest.
References
- Nessler, C.L.; Kurz, W.G.W.; Pelcher, L.E. Isolation and analysis of the major latex protein genes of opium poppy. Plant Mol. Biol. 1990, 15, 951–953. [Google Scholar] [CrossRef] [PubMed]
- Strömvik, M.V.; Sundararaman, V.P.; Vodkin, L.O. A novel promoter from soybean that is active in a complex developmental pattern with and without its proximal 650 base pairs. Plant Mol. Biol. 1999, 41, 217–231. [Google Scholar] [CrossRef] [PubMed]
- Chen, J.-Y.; Dai, X.-F. Cloning and characterization of the Gossypium hirsutum major latex protein gene and functional analysis in Arabidopsis thaliana. Planta 2010, 231, 861–873. [Google Scholar] [CrossRef] [PubMed]
- He, S.; Yuan, G.; Bian, S.; Han, X.; Liu, K.; Cong, P.; Zhang, C. Major Latex Protein MdMLP423 Negatively Regulates Defense against Fungal Infections in Apple. Int. J. Mol. Sci. 2020, 21, 1879. [Google Scholar] [CrossRef]
- Yang, C.L.; Liang, S.; Wang, H.Y.; Han, L.B.; Wang, F.X.; Cheng, H.Q.; Wu, X.M.; Qu, Z.L.; Wu, J.H.; Xia, G.X. Cotton major latex protein 28 functions as a positive regulator of the ethylene responsive factor 6 in defense against Verticillium dahliae. Mol. Plant 2015, 8, 399–411. [Google Scholar] [CrossRef] [PubMed]
- Zhang, N.; Li, R.; Shen, W.; Jiao, S.; Zhang, J.; Xu, W. Genome-wide evolutionary characterization and expression analyses of major latex protein (MLP) family genes in Vitis vinifera. Mol. Genet. Genom. 2018, 293, 1061–1075. [Google Scholar] [CrossRef] [PubMed]
- Liu, H.; Du, B.; Ma, X.; Wang, Y.; Cheng, N.; Zhang, Y. Overexpression of major latex protein 423 (NtMLP423) enhances the chilling stress tolerance in Nicotiana tabacum. Plant Sci. 2023, 329, 111604. [Google Scholar] [CrossRef] [PubMed]
- Ruperti, B.; Bonghi, C.; Ziliotto, F.; Pagni, S.; Rasori, A.; Varotto, S.; Tonutti, P.; Giovannoni, J.J.; Ramina, A. Characterization of a major latex protein (MLP) gene down-regulated by ethylene during peach fruitlet abscission. Plant Sci. 2002, 163, 265–272. [Google Scholar] [CrossRef]
- Fujita, K.; Inui, H. Review: Biological functions of major latex-like proteins in plants. Plant Sci. 2021, 306, 110856. [Google Scholar] [CrossRef]
- Aglas, L.; Soh, W.T.; Kraiem, A.; Wenger, M.; Brandstetter, H.; Ferreira, F. Ligand Binding of PR-10 Proteins with a Particular Focus on the Bet v 1 Allergen Family. Curr. Allergy Asthma Rep. 2020, 20, 25. [Google Scholar] [CrossRef]
- Mirza, O.; Henriksen, A.; Ipsen, H.; Larsen, J.N.; Wissenbach, M.; Spangfort, M.D.; Gajhede, M. Dominant Epitopes and Allergic Cross-Reactivity: Complex Formation Between a Fab Fragment of a Monoclonal Murine IgG Antibody and the Major Allergen from Birch Pollen Bet v 11. J. Immunol. 2000, 165, 331–338. [Google Scholar] [CrossRef] [PubMed]
- Spangfort, M.D.; Mirza, O.; Ipsen, H.; Van Neerven, R.J.; Gajhede, M.; Larsen, J.N. Dominating IgE-binding epitope of Bet v 1, the major allergen of birch pollen, characterized by X-ray crystallography and site-directed mutagenesis. J. Immunol. 2003, 171, 3084–3090. [Google Scholar] [CrossRef] [PubMed]
- Choi, S.-H.; Hong, M.-K.; Kim, H.-J.; Ryoo, N.; Rhim, H.; Nah, S.-Y.; Kang, L.-W. Structure of ginseng major latex-like protein 151 and its proposed lysophosphatidic acid-binding mechanism. Acta Crystallogr. Sect. D 2015, 71, 1039–1050. [Google Scholar] [CrossRef] [PubMed]
- Lytle, B.L.; Song, J.; de la Cruz, N.B.; Peterson, F.C.; Johnson, K.A.; Bingman, C.A.; Phillips, G.N., Jr.; Volkman, B.F. Structures of two Arabidopsis thaliana major latex proteins represent novel helix-grip folds. Proteins 2009, 76, 237–243. [Google Scholar] [CrossRef] [PubMed]
- Mattila, K.; Renkonen, R. Modelling of Bet v 1 binding to lipids. Scand. J. Immunol. 2009, 70, 116–124. [Google Scholar] [CrossRef] [PubMed]
- Inui, H.; Sawada, M.; Goto, J.; Yamazaki, K.; Kodama, N.; Tsuruta, H.; Eun, H. A Major Latex-Like Protein Is a Key Factor in Crop Contamination by Persistent Organic Pollutants. Plant Physiol. 2013, 161, 2128–2135. [Google Scholar] [CrossRef] [PubMed]
- Fujita, K.; Sonoda, C.; Chujo, M.; Inui, H. Major latex-like proteins show pH dependency in their binding to hydrophobic organic pollutants. J. Pestic. Sci. 2023, 48, 71–77. [Google Scholar] [CrossRef] [PubMed]
- Śliwiak, J.; Dolot, R.; Michalska, K.; Szpotkowski, K.; Bujacz, G.; Sikorski, M.; Jaskolski, M. Crystallographic and CD probing of ligand-induced conformational changes in a plant PR-10 protein. J. Struct. Biol. 2016, 193, 55–66. [Google Scholar] [CrossRef]
- Park, S.Y.; Fung, P.; Nishimura, N.; Jensen, D.R.; Fujii, H.; Zhao, Y.; Lumba, S.; Santiago, J.; Rodrigues, A.; Chow, T.F.; et al. Abscisic acid inhibits type 2C protein phosphatases via the PYR/PYL family of START proteins. Science 2009, 324, 1068–1071. [Google Scholar] [CrossRef]
- Nakashima, K.; Ito, Y.; Yamaguchi-Shinozaki, K. Transcriptional Regulatory Networks in Response to Abiotic Stresses in Arabidopsis and Grasses. Plant Physiol. 2009, 149, 88–95. [Google Scholar] [CrossRef]
- Nawrot, R.; Lippmann, R.; Matros, A.; Musidlak, O.; Nowicki, G.; Mock, H.P. Proteomic comparison of Chelidonium majus L. latex in different phases of plant development. Plant Physiol. Biochem. 2017, 112, 312–325. [Google Scholar] [CrossRef] [PubMed]
- Song, L.; Wang, J.; Jia, H.; Kamran, A.; Qin, Y.; Liu, Y.; Hao, K.; Han, F.; Zhang, C.; Li, B.; et al. Identification and functional characterization of NbMLP28, a novel MLP-like protein 28 enhancing Potato virus Y resistance in Nicotiana benthamiana. BMC Microbiol. 2020, 20, 55. [Google Scholar] [CrossRef] [PubMed]
- Fujita, K.; Asuke, S.; Isono, E.; Yoshihara, R.; Uno, Y.; Inui, H. MLP-PG1, a major latex-like protein identified in Cucurbita pepo, confers resistance through the induction of pathogenesis-related genes. Planta 2021, 255, 10. [Google Scholar] [CrossRef] [PubMed]
- Kang, Y.; Tong, J.; Liu, W.; Jiang, Z.; Pan, G.; Ning, X.; Yang, X.; Zhong, M. Comprehensive Analysis of Major Latex-Like Protein Family Genes in Cucumber (Cucumis sativus L.) and Their Potential Roles in Phytophthora Blight Resistance. Int. J. Mol. Sci. 2023, 24, 784. [Google Scholar] [CrossRef] [PubMed]
- Carella, P.; Merl-Pham, J.; Wilson, D.C.; Dey, S.; Hauck, S.M.; Vlot, A.C.; Cameron, R.K. Comparative Proteomics Analysis of Phloem Exudates Collected during the Induction of Systemic Acquired Resistance. Plant Physiol. 2016, 171, 1495–1510. [Google Scholar] [CrossRef] [PubMed][Green Version]
- Li, P.; Chen, L.; Zhou, Y.; Xia, X.; Shi, K.; Chen, Z.; Yu, J. Brassinosteroids-Induced Systemic Stress Tolerance was Associated with Increased Transcripts of Several Defence-Related Genes in the Phloem in Cucumis sativus. PLoS ONE 2013, 8, e66582. [Google Scholar] [CrossRef]
- Holmquist, L.; Dölfors, F.; Fogelqvist, J.; Cohn, J.; Kraft, T.; Dixelius, C. Major latex protein-like encoding genes contribute to Rhizoctonia solani defense responses in sugar beet. Mol. Genet. Genom. 2020, 296, 155–164. [Google Scholar] [CrossRef] [PubMed]
- Wang, Y.; Yang, L.; Chen, X.; Ye, T.; Zhong, B.; Liu, R.; Wu, Y.; Chan, Z. Major latex protein-like protein 43(MLP43) functions as a positive regulator during abscisic acid responses and confers drought tolerance inArabidopsis thaliana. J. Exp. Bot. 2016, 67, 421–434. [Google Scholar] [CrossRef]
- Yuan, G.; He, S.; Bian, S.; Han, X.; Liu, K.; Cong, P.; Zhang, C. Genome-wide identification and expression analysis of major latex protein (MLP) family genes in the apple (Malus domestica Borkh.) genome. Gene 2020, 733, 144275. [Google Scholar] [CrossRef]
- Liu, H.; Ma, X.; Liu, S.; Du, B.; Cheng, N.; Wang, Y.; Zhang, Y. The Nicotiana tabacum L. major latex protein-like protein 423 (NtMLP423) positively regulates drought tolerance by ABA-dependent pathway. BMC Plant Biol. 2020, 20, 475. [Google Scholar] [CrossRef]
- Tuskan, G.A.; DiFazio, S.; Jansson, S.; Bohlmann, J.; Grigoriev, I.; Hellsten, U.; Putnam, N.; Ralph, S.; Rombauts, S.; Salamov, A.; et al. The Genome of Black Cottonwood, Populus trichocarpa (Torr. & Gray). Science 2006, 313, 1596–1604. [Google Scholar] [CrossRef]
- Zeng, J.X.; Ruan, Y.X.; Liu, B.; Ruan, Y.; Huang, Y. Genome-wide identification and abiotic stress-responsive expression of MLP family genes in Brassica Rapa. Gene Rep. 2020, 21, 100919. [Google Scholar] [CrossRef]
- Sun, H.; Kim, M.K.; Pulla, R.K.; Kim, Y.J.; Yang, D.C. Isolation and expression analysis of a novel major latex-like protein (MLP151) gene from Panax ginseng. Mol. Biol. Rep. 2010, 37, 2215–2222. [Google Scholar] [CrossRef] [PubMed]
- Fujita, K.; Chitose, N.; Chujo, M.; Komura, S.; Sonoda, C.; Yoshida, M.; Inui, H. Genome-wide identification and characterization of major latex-like protein genes responsible for crop contamination in Cucurbita pepo. Mol. Biol. Rep. 2022, 49, 7773–7782. [Google Scholar] [CrossRef] [PubMed]
- Sun, Z.; Meng, L.; Yao, Y.; Zhang, Y.; Cheng, B.; Liang, Y. Genome-Wide Evolutionary Characterization and Expression Analysis of Major Latex Protein (MLP) Family Genes in Tomato. Int. J. Mol. Sci. 2023, 24, 15005. [Google Scholar] [CrossRef] [PubMed]
- Qiao, X.; Li, Q.; Yin, H.; Qi, K.; Li, L.; Wang, R.; Zhang, S.; Paterson, A.H. Gene duplication and evolution in recurring polyploidization–diploidization cycles in plants. Genome Biol. 2019, 20, 38. [Google Scholar] [CrossRef] [PubMed]
- Li, J.; Zeng, R.; Huang, Z.; Gao, H.; Liu, S.; Gao, Y.; Yao, S.; Wang, Y.; Zhang, H.; Zhang, L.; et al. Genome-wide characterization of major latex protein gene family in peanut and expression analyses under drought and waterlogging stress. Front. Plant Sci. 2023, 14, 1152824. [Google Scholar] [CrossRef]
- Guo, D.; Wong, W.S.; Xu, W.Z.; Sun, F.F.; Qing, D.J.; Li, N. Cis-cinnamic acid-enhanced 1 gene plays a role in regulation of Arabidopsis bolting. Plant Mol. Biol. 2011, 75, 481–495. [Google Scholar] [CrossRef]
- Singh, K.B.; Foley, R.C.; Oñate-Sánchez, L. Transcription factors in plant defense and stress responses. Curr. Opin. Plant Biol. 2002, 5, 430–436. [Google Scholar] [CrossRef]
- Ahmad, P.; Rasool, S.; Gul, A.; Sheikh, S.A.; Akram, N.A.; Ashraf, M.; Kazi, A.M.; Gucel, S. Jasmonates: Multifunctional Roles in Stress Tolerance. Front. Plant Sci. 2016, 7, 813. [Google Scholar] [CrossRef]
- Yoshida, T.; Mogami, J.; Yamaguchi-Shinozaki, K. ABA-dependent and ABA-independent signaling in response to osmotic stress in plants. Curr. Opin. Plant Biol. 2014, 21, 133–139. [Google Scholar] [CrossRef]
- Sreedasyam, A.; Plott, C.; Hossain, M.S.; Lovell, J.T.; Grimwood, J.; Jenkins, J.W.; Daum, C.; Barry, K.; Carlson, J.; Shu, S.; et al. JGI Plant Gene Atlas: An updateable transcriptome resource to improve functional gene descriptions across the plant kingdom. Nucleic Acids Res. 2023, 51, 8383–8401. [Google Scholar] [CrossRef] [PubMed]
- Finn, R.D.; Mistry, J.; Schuster-Böckler, B.; Griffiths-Jones, S.; Hollich, V.; Lassmann, T.; Moxon, S.; Marshall, M.; Khanna, A.; Durbin, R.; et al. Pfam: Clans, web tools and services. Nucleic Acids Res. 2006, 34, D247–D251. [Google Scholar] [CrossRef]
- Robert, D.F.; Jody, C.; Sean, R.E. HMMER web server: Interactive sequence similarity searching. Nucleic Acids Res. 2011, 39, W29–W37. [Google Scholar]
- Wilkins, M.R.; Gasteiger, E.; Bairoch, A.; Sanchez, J.C.; Williams, K.L.; Appel, R.D.; Hochstrasser, D.F. Protein identification and analysis tools in the ExPASy server. Methods Mol. Biol. 1999, 112, 531–552. [Google Scholar] [PubMed]
- Bailey, T.L.; Williams, N.; Misleh, C.; Li, W.W. MEME: Discovering and analyzing DNA and protein sequence motifs. Nucleic Acids Res. 2006, 34, W369–W373. [Google Scholar] [CrossRef] [PubMed]
- Chen, C.; Wu, Y.; Li, J.; Wang, X.; Zeng, Z.; Xu, J.; Liu, Y.; Feng, J.; Chen, H.; He, Y.; et al. TBtools-II: A “one for all, all for one” bioinformatics platform for biological big-data mining. Mol. Plant 2023, 16, 1733–1742. [Google Scholar] [CrossRef]
- Kumar, S.; Stecher, G.; Li, M.; Knyaz, C.; Tamura, K. MEGA X: Molecular Evolutionary Genetics Analysis across Computing Platforms. Mol. Biol. Evol. 2018, 35, 1547–1549. [Google Scholar] [CrossRef]


Disclaimer/Publisher’s Note: The statements, opinions and data contained in all publications are solely those of the individual author(s) and contributor(s) and not of MDPI and/or the editor(s). MDPI and/or the editor(s) disclaim responsibility for any injury to people or property resulting from any ideas, methods, instructions or products referred to in the content. |
© 2024 by the authors. Licensee MDPI, Basel, Switzerland. This article is an open access article distributed under the terms and conditions of the Creative Commons Attribution (CC BY) license (https://creativecommons.org/licenses/by/4.0/).