Article

The Effect of HMGB1 and HMGB2 on Transcriptional Regulation Differs in Neuroendocrine and Adenocarcinoma Models of Prostate Cancer

by
Martín Salamini-Montemurri
1,2,3,
Ángel Vizoso-Vázquez
1,2,3,
Aida Barreiro-Alonso
1,2,3,
Lidia Lorenzo-Catoira
1,2,3,
Esther Rodríguez-Belmonte
1,2,3,
María-Esperanza Cerdán
1,2,3,* and
Mónica Lamas-Maceiras
1,2,3,*
1
Centro Interdisciplinar de Química e Bioloxía (CICA), Campus de Elviña, Universidade da Coruña, As Carballeiras, s/n, 15071 A Coruña, Spain
2
Facultade de Ciencias, Campus de A Zapateira, Universidade da Coruña, A Fraga, s/n, 15071 A Coruña, Spain
3
Instituto de Investigación Biomédica de A Coruña (INIBIC), As Xubias de Arriba 84, 15006 A Coruña, Spain
*
Authors to whom correspondence should be addressed.
Int. J. Mol. Sci. 2024, 25(6), 3106; https://doi.org/10.3390/ijms25063106
Submission received: 23 January 2024 / Revised: 25 February 2024 / Accepted: 5 March 2024 / Published: 7 March 2024
(This article belongs to the Special Issue Recent Molecular Biology on Ovarian Cancer and Prostate Cancer)

Abstract

:
Human high-mobility group-B (HMGB) proteins regulate gene expression in prostate cancer (PCa), a leading cause of oncological death in men. Their role in aggressive PCa cancers, which do not respond to hormonal treatment, was analyzed. The effects of HMGB1 and HMGB2 silencing upon the expression of genes previously related to PCa were studied in the PCa cell line PC-3 (selected as a small cell neuroendocrine carcinoma, SCNC, PCa model not responding to hormonal treatment). A total of 72% of genes analyzed, using pre-designed primer panels, were affected. HMGB1 behaved mostly as a repressor, but HMGB2 as an activator. Changes in SERPINE1, CDK1, ZWINT, and FN1 expression were validated using qRT-PCR after HMGB1 silencing or overexpression in PC-3 and LNCaP (selected as an adenocarcinoma model of PCa responding to hormonal treatment) cell lines. Similarly, the regulatory role of HMGB2 upon SERPINE1, ZWINT, FN1, IGFPB3, and TYMS expression was validated, finding differences between cell lines. The correlation between the expression of HMGB1, HMGB2, and their targets was analyzed in PCa patient samples and also in PCa subgroups, classified as neuroendocrine positive or negative, in public databases. These results allow a better understanding of the role of HMGB proteins in PCa and contribute to find specific biomarkers for aggressive PCa.

Graphical Abstract

1. Introduction

Prostate cancer (PCa) is the second most commonly diagnosed cancer and the fifth leading cause of cancer death among men worldwide, with 1,414,000 new cancer cases and 375,304 deaths reported in 2020 [1]. PCa incidence rates decreased dramatically between 2007 and 2014 due to prostate-specific antigen (PSA) testing. But since 2014, the incidence rates of PCa have increased by 3% each year [1]. The accumulation of inherited or acquired mutations, as well as epigenetic changes determine the development of prostatic intraepithelial neoplasia (PIN), which can progress to PCa. It is thought that early disease mutations affect MAPK or Phosphoinositide 3-Kinase (PI3K), which in turn activates the androgen receptor (AR) [2]. The most frequent PCa tumors are adenocarcinomas characterized by the expression of androgen receptor (AR) and prostate-specific antigen (PSA). These can be initially treated with the hormonal inhibition of AR signaling, although, unfortunately, they can lead to castration-resistant prostate cancer (CRPC) that does not respond to this treatment, and therefore mortality increases. Since 2014, the incidence rates for CRPC have increased by 5% each year [1]. AR is overexpressed in the majority of CRPCs, and it has been demonstrated that AR overexpression increases its binding to chromatin, thus explaining how the AR signaling pathway is reactivated in CRPC cells [3]. As for CRPC, hormonal therapy is not effective for the less frequent type of PCa, small-cell neuroendocrine carcinoma (SCNC), which paradoxically is negative for AR and PSA expression [4]. It has been suggested that CRPC-adeno cells might also evolve to neuroendocrine PCa as a result of selective pressure from androgen deprivation therapy or antiandrogens [5]. High Chromogranin A expression has been related to neuroendocrine PCa [6], and SCNC cells release neuro-hormones and immune factors that affect homeostasis, stimulate tumor development, and lead to very aggressive cancers with bad prognosis [7]. The expression of AR (AR+/AR) or the neuroendocrine characteristics of tumoral cells (NE+/NE) can be used for PCa classification.
Human high-mobility group B (HMGB) proteins HMGB1 and HMGB2 are known regulators of gene expression [8], and both have been associated with PCa. The overexpression of HMGB1 and the receptor for advanced glycation end products (RAGE), its extracellular receptor, have been associated with PCa development [9]. Patients with high HMGB1 levels are associated with a worse prognosis [10]. Conversely, HMGB1 silencing diminishes cell growth in LNCaP prostate cancer cells [11], and the downregulation of RAGE by siRNA causes the inhibition of prostate tumors in nude mice [12]. miR-505 also downregulates HMGB1, as reported in DU-145 PCa cells, and suppresses cell invasion, migration, and epithelial to mesenchymal transition (EMT) [13]. In PCa tumorigenesis, HMGB1 enhances Akt [14] and NF-kB [15] signaling pathways. Regarding HMGB2, high expression was detected using immunohistochemistry in neoplastic lesions, and its prostatic expression in rats was enhanced by carcinogenic chemicals [16].
The study of HMGB proteins in aggressive PCa cancers not responding to hormonal treatment, CRPC and SCNC, is of particular relevance. The development of chemoresistance, especially to docetaxel and paclitaxel, is a major problem in the treatment of PCa not responding to hormonal treatment, since chemotherapy is the most common alternative therapy. HMGB1 release into the extracellular environment promotes this resistance in CRPC cells; however, the molecular mechanisms involved are still unclear [17]. HMGB1 and HMGB2 interact with other proteins encoded by genes whose expression is amplified by increasing copy number (genes with high copy number variations, CNVs) in tumors from patients diagnosed with these aggressive PCa cancers or in metastatic tumors; these genes are not amplified in primary adenocarcinomas [18]. Considering that the reactivation of the AR signaling pathway plays a key role in the development of CRPC, it is remarkable that direct interaction between HMGB1 and the AR protein has been detected, and also that HMGB1 influences the ability of AR to bind to the promoter of prostate-specific antigen (PSA) [19].
The objective of this study is to better understand the role of HMGB1 and HMGB2 in aggressive PCa cancers not responding to hormonal treatment, identifying genes differentially regulated. We silenced HMGB1 and HMGB2 in PC-3 cells considered as a model closer to neuroendocrine PCa [4]. A set of differentially expressed genes was validated and tested in the LNCaP cell line closer to adenocarcinoma models [20]. Several genes showed different regulation between PC-3, and LNCaP cell lines. The clinical relevance of HMGB1 and HMGB2 in the regulation of identified genes was explored in public databases comparing gene expression in PCa patient samples classified as adenocarcinoma or neuroendocrine types.

2. Results

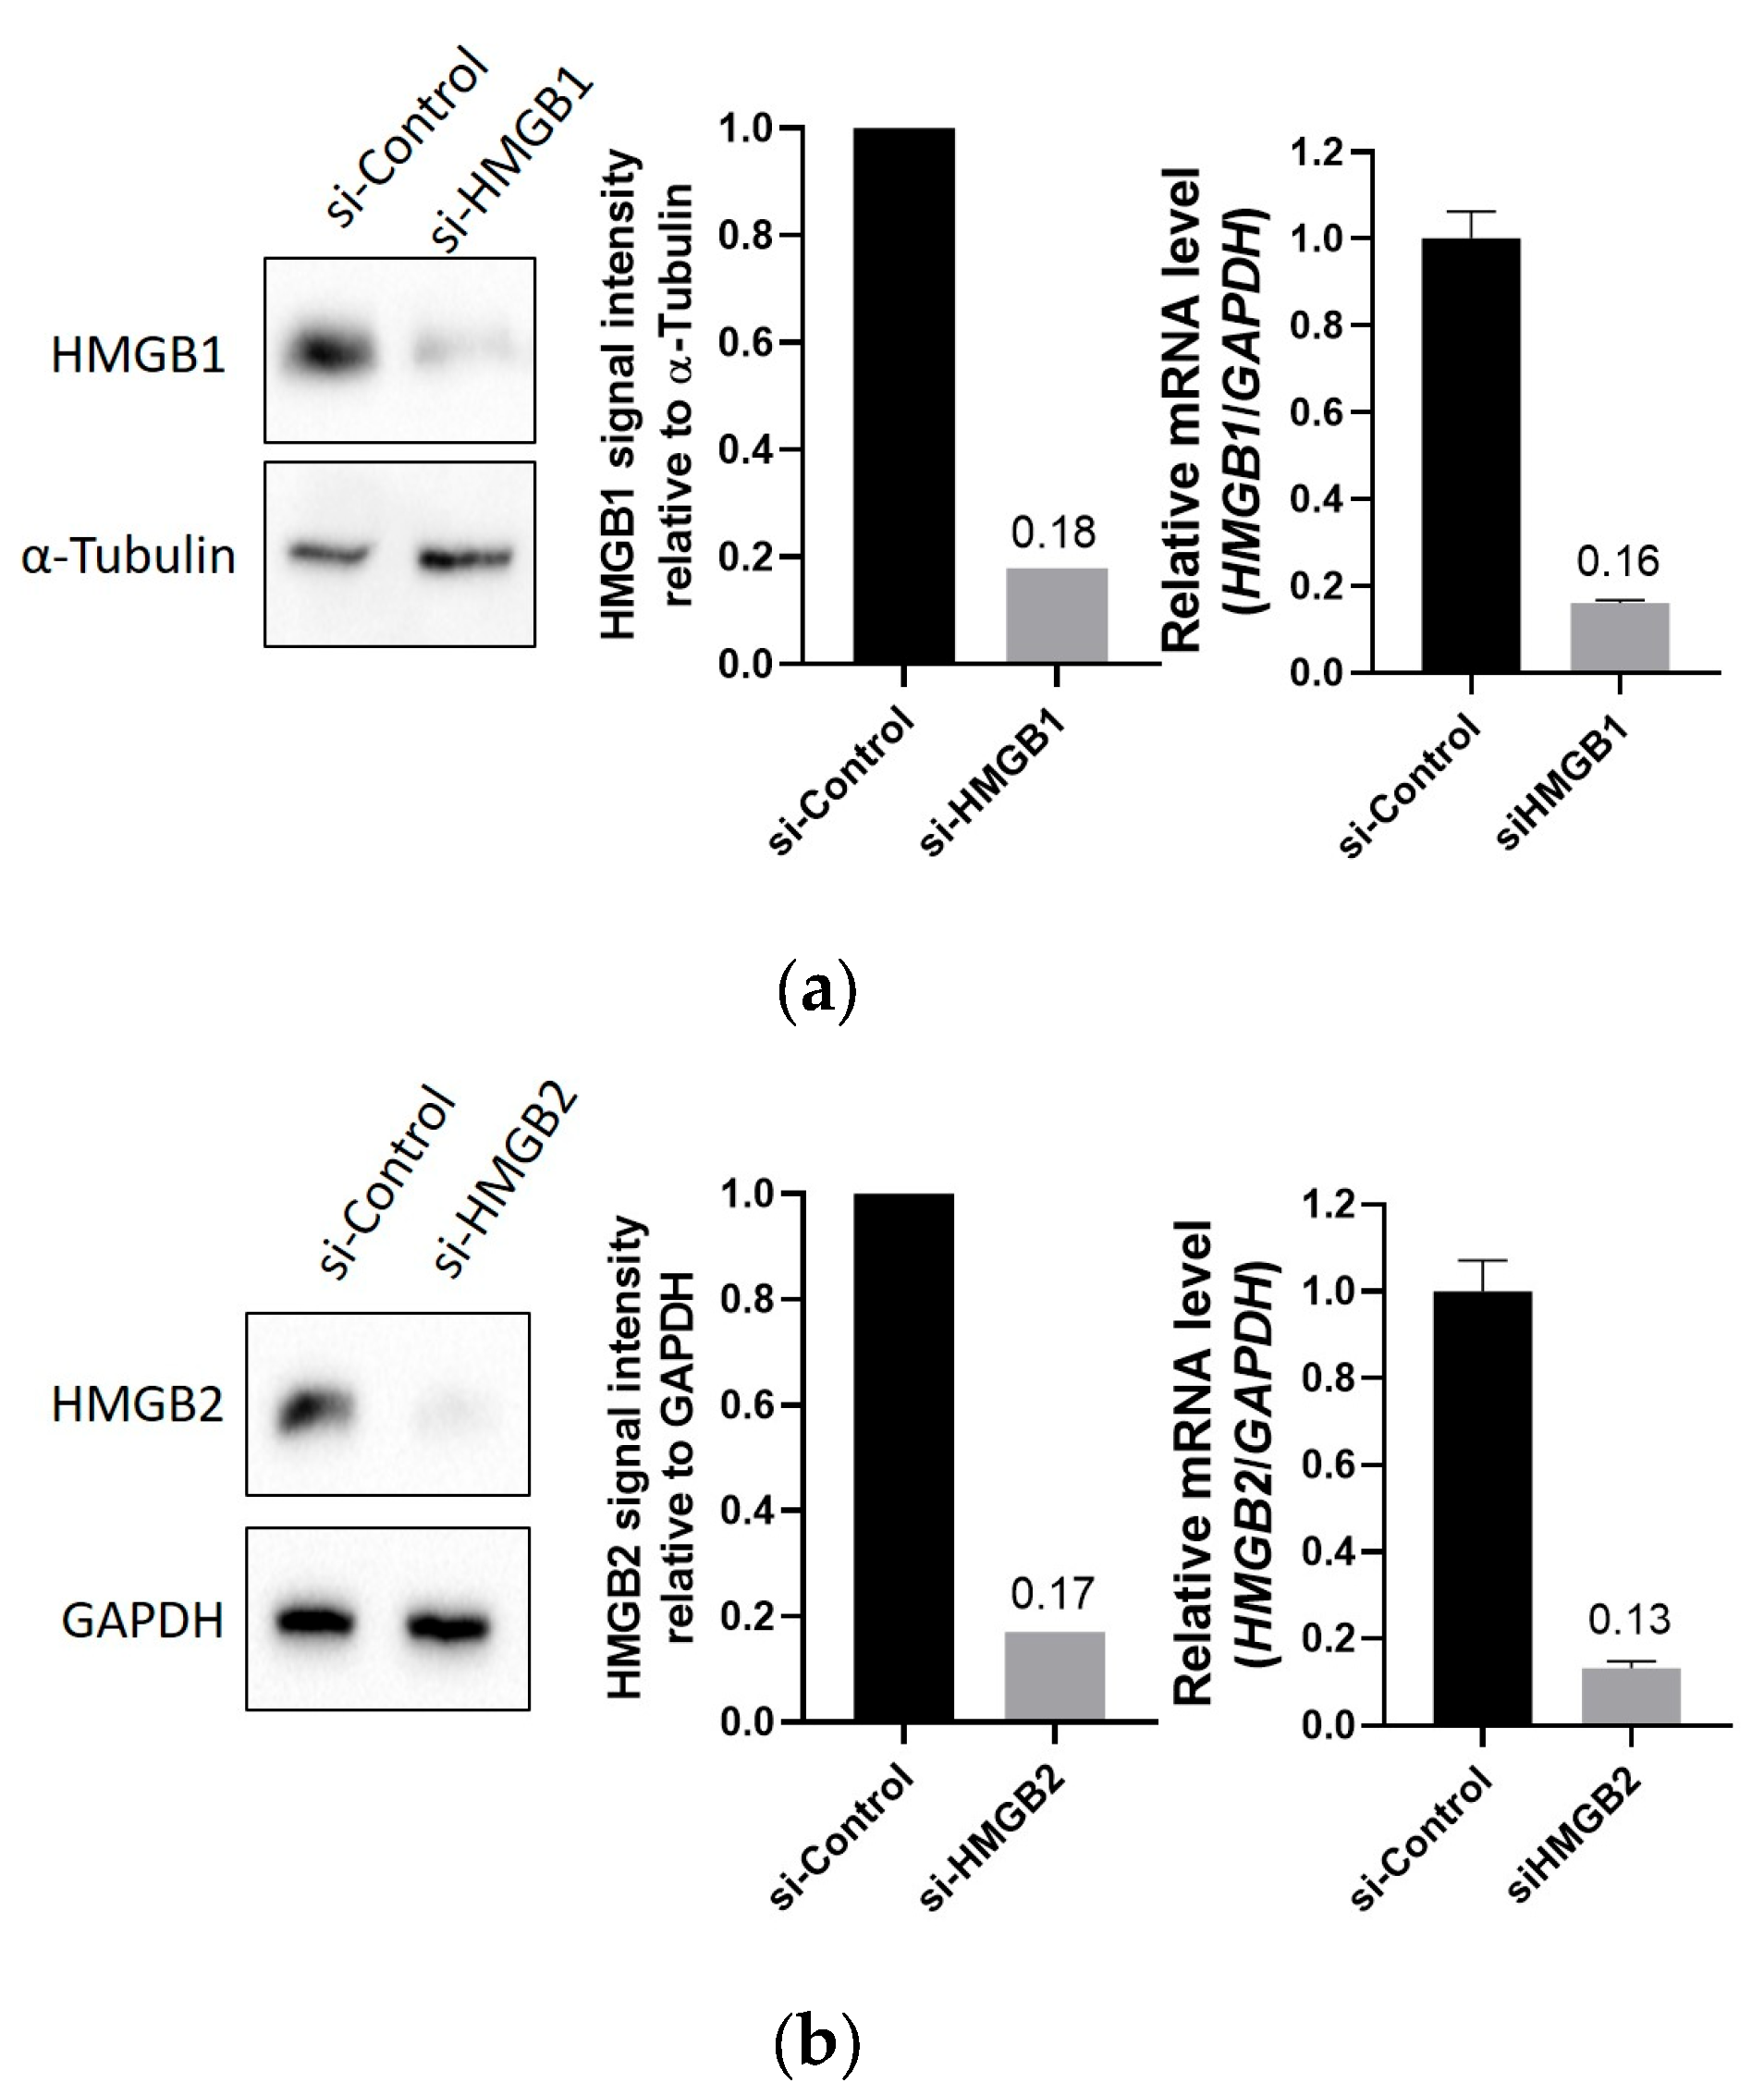
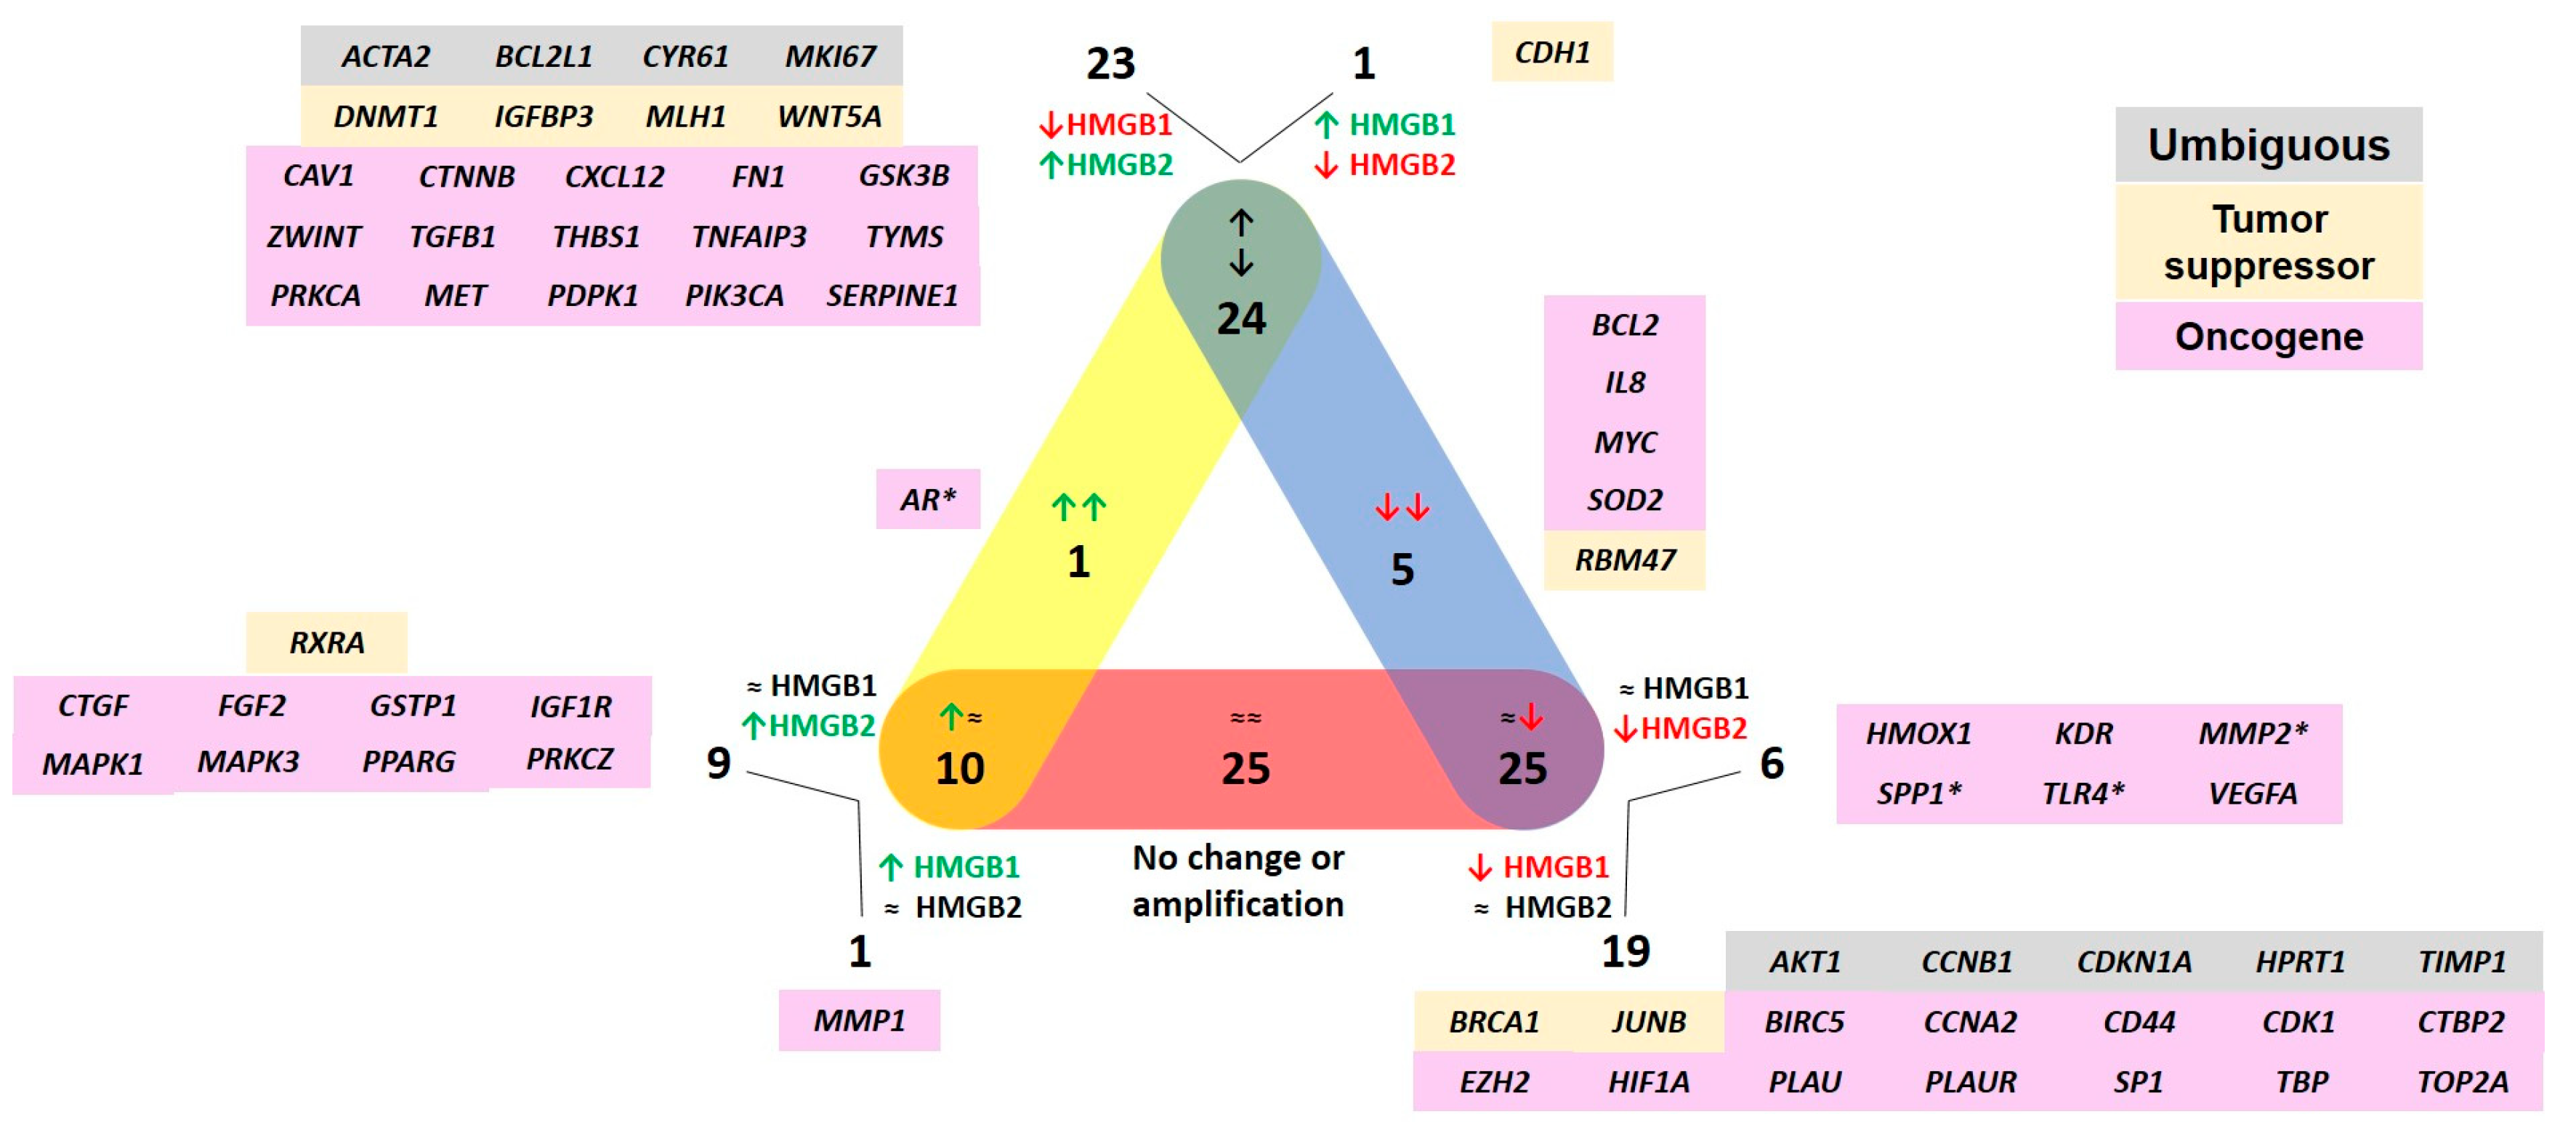
2.1. Transcription of Genes Related to PCa after HMGB1 or HMGB2 Silencing in PC-3

The deregulation of HMGB1 and HMGB2 genes has been reported in PCa, and the silencing of HMGB1 has been previously related to cell viability, proliferation, and migration in different cell lines [10,11,16]. The phenotypes resulting after HMGB2 silencing were not reported in PC-3, but similar results have been obtained in our laboratory (Supplementary Figure S1). HMGB proteins affect gene expression by different mechanisms [8], and we tested the effect of HMGB1 or HMGB2 silencing in PC-3. The PrimePCR Pathway Plate, 96 well Prostatic neoplasms Tier 1 H96, Hsa (Biorad, Hercules, CA, USA) was used in this study. This panel includes probes for 90 genes related to prostate cancer and internal controls for normalization. The genes from this panel are mainly involved in the regulation of cell death, proliferation, and PI3K-Akt signaling pathway. After verifying silencing and analyzing the data, as explained in material and methods, fold changes were calculated (Supplementary Tables S1 and S2) and Volcano plots were drawn (Figure 1). HMGB1 behaves mostly as a repressor of the analyzed genes; 47 genes are repressed by HMGB1 and only 2 are activated. Contrarily, HMGB2 activates 31 genes, while only 9 are repressed. In total, from the 90 genes analyzed in these plate, 65 (72%) are directly or indirectly regulated by these HMGB proteins. Specific genes that are regulated by HMGB1, HMGB2, or both, and their functional relevance in cancer are depicted in Figure 2. Most of the regulated genes have previously been classified as oncogenes, although a small group (CDH1, DNMT1, IGFBP3, MLH1, WNT5A, RBM47, RXRA, BRCA1, and JUNB) act as tumor suppressors. The expression of AR in PC-3 is very low, at the detection limit, and silencing HMGB1 or HMGB2 produces a decrease that makes it undetectable.

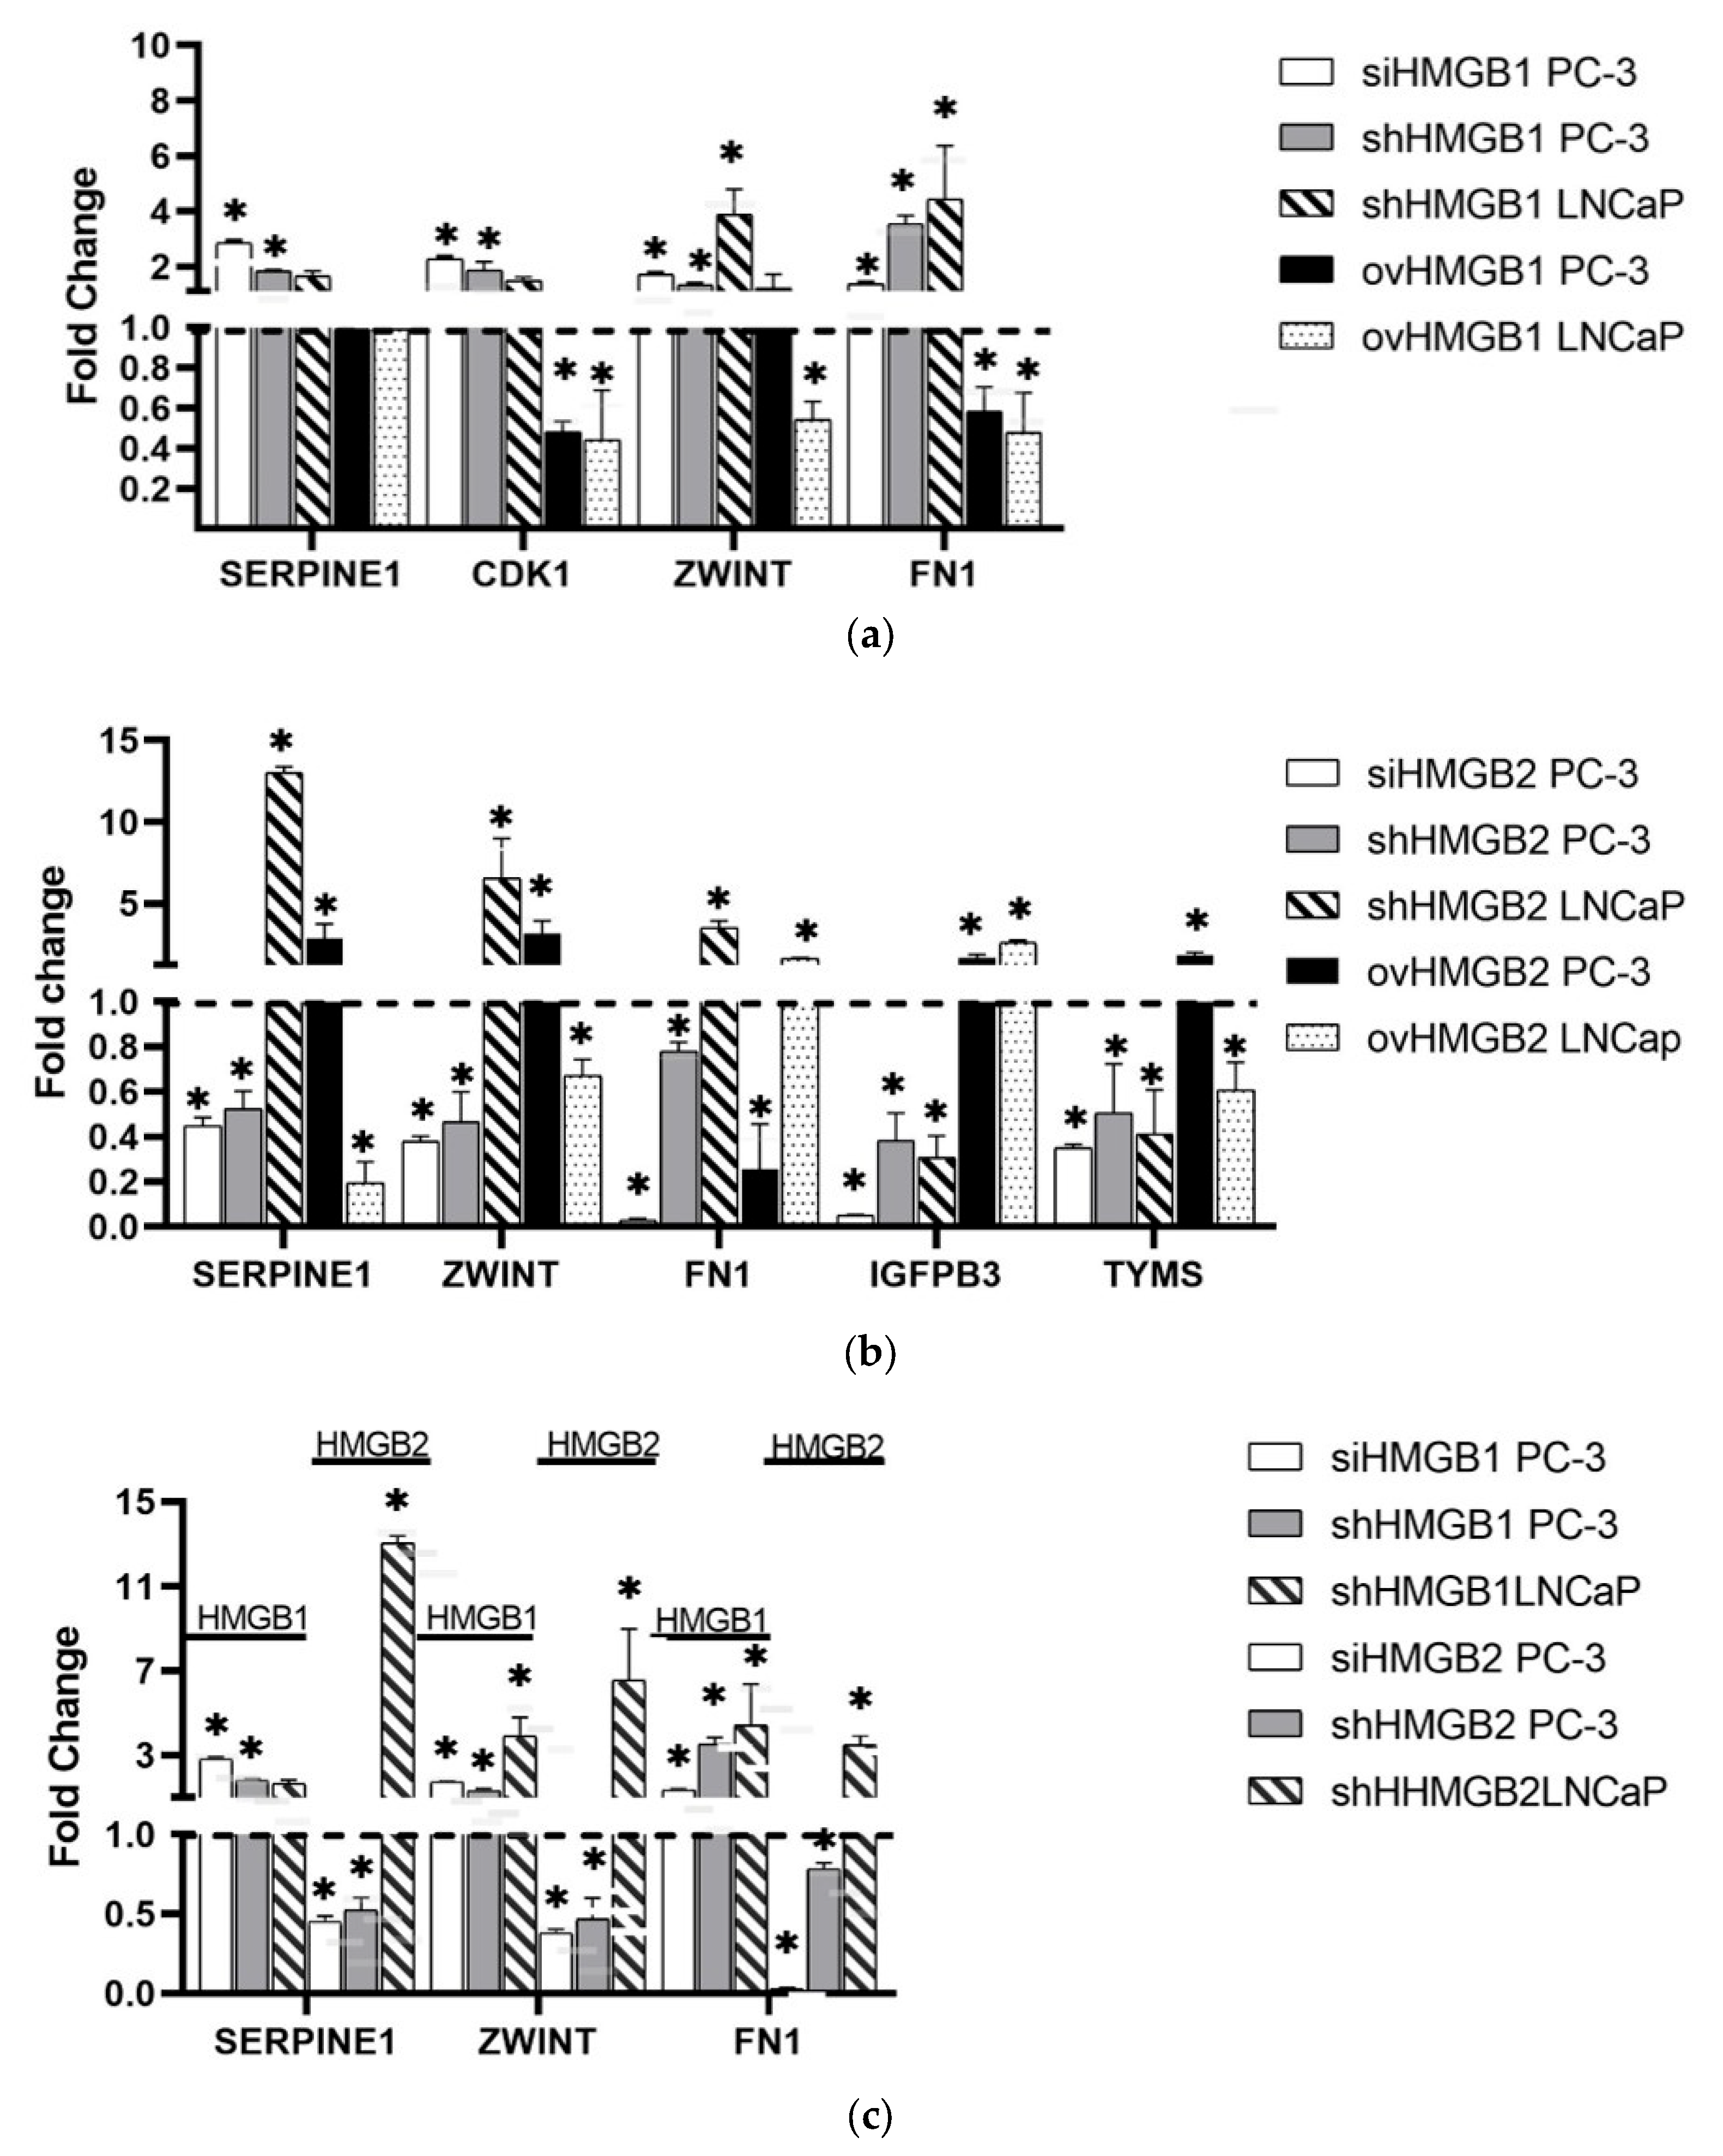
2.2. Validation of Data Array and Differential Regulation in PCa Cell Lines

We selected several oncogenes and one tumor suppressor gene, showing deregulation by HMGB proteins (Figure 2), for independent validation after HMGB1 or HMGB2 shRNA silencing or overexpression in PC-3, considered the model of SCNC PCa [4], and in the LNCaP cell line, considered the adenocarcinoma model [20]. SERPINE1, CDK1, ZWINT, and FN1 were selected for the validation of results after HMGB1 silencing; SERPINE1, ZWINT, FN1, IGFPB3, and TYMS were selected for the validation of results after HMGB2 silencing. Bar graphs represent the media of change folds obtained in qRT-PCRs from different biological replicas after HMGB1 or HMGB2 silencing (Figure 3).
The expression of SERPINE1, CDK1, ZWINT, and FN1 increased after si and sh RNA-mediated HMGB1 silencing in PC-3 (Figure 3). The overexpression of HMGB1 diminished the fold change value in both cell lines for CDK1 and FN1 (Figure 3). A differential survival analysis carried out with GEPIA showed the correlation of ZWINT, CDK1, IGFPB3, and TYMS expression with disease-free survival (DFS) in a database of patients with prostate adenocarcinoma (Supplementary Figure S3). We also analyzed if regulatory effects observed in PCa cell lines are also observed in tumor samples from PCa patients. We looked for a significant negative correlation between HMGB1 expression and the expression of these target genes in eight different studies available in cBioportal (https://www.cbioportal.org/, accessed on 9 September 2023) which included RNA analyses (Supplementary Table S2). A significant correlation was found for CDK1, FN1, SERPINE1, and ZWINT in one or more studies analyzed (Table 1).
The expression of SERPINE1, ZWINT, FN1, IGFPB3, and TYMS diminished after silencing HMGB2 in PC-3, and the overexpression of HMGB2 increased the fold change value except for FN1 (Figure 3). These results confirmed the data obtained using the pre-designed primer panel. To verify whether these observations might be consistent with patient data, we looked for a significant positive correlation between HMGB2 expression and the expression of these target genes in eight different studies from cohorts available in cBioportal (Supplementary Table S3). A significant correlation was found for FN1, IGFBP3, ZWINT, and TYMS in four, five, seven, and eight studies, respectively (Table 2).
Interestingly, the effect of HMGB2 silencing on ZWINT, FN1, and SERPINE1 expression observed in LNCaP (increasing their expression) was opposite to that described in PC-3 (decreasing their expression), while the effect on IGFBP3 and TYMS caused a decrease in expression in both cell lines (Figure 3).

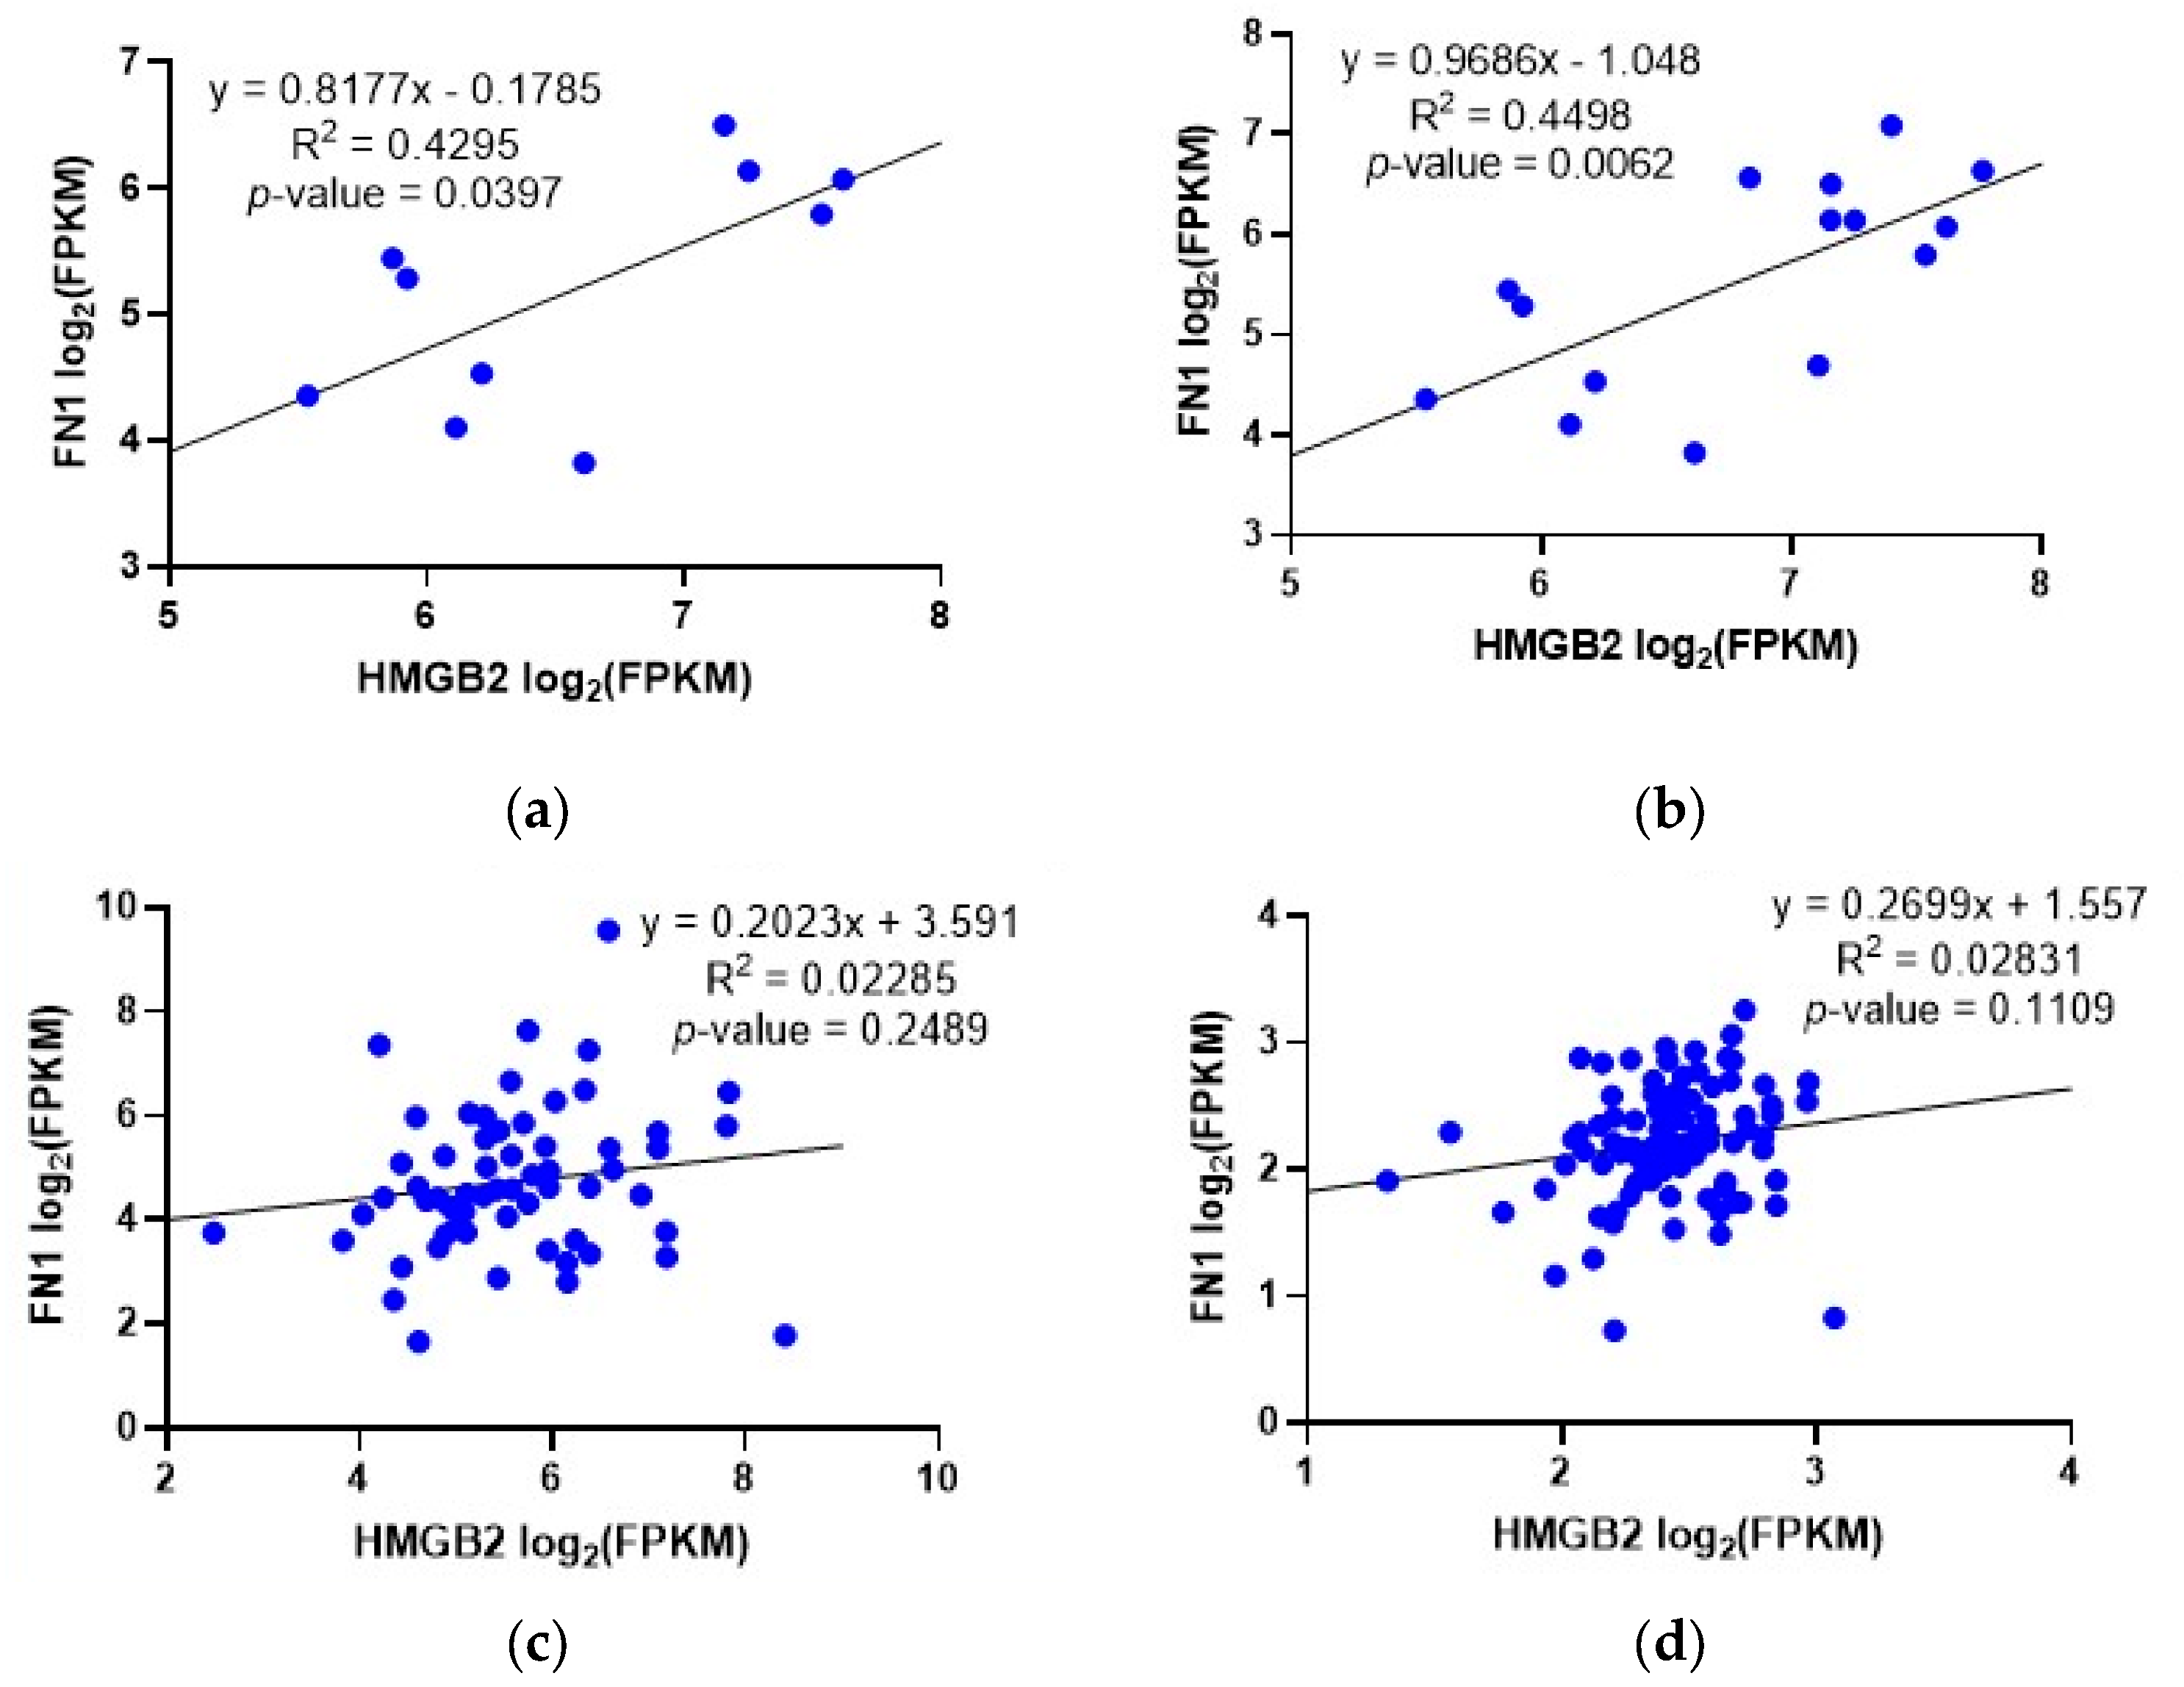
2.3. Correlation between the Expression of HMGB2 and Genes Involved in PCa in Patients Classified as AR-Negative-Neuroendocrine-Positive or AR-Positive-Neuroendocrine-Negative

As described above, the regulatory effects of HMGB2 silencing on some genes related to PCa were opposite (positive or negative) in the two different PCa cell lines analyzed in this study. Differences between PC-3 and LNCaP cell lines could be caused by the fact that PC-3 is closer to an SCNC model [4] and LNCaP to an adenocarcinoma model [20] of PCa. Therefore, we tried to find similar differences between samples from patients diagnosed of SCNC and adenocarcinoma. We found two previously published transcriptomic studies showing expression data from patients clinically diagnosed with adenocarcinoma or neuroendocrine PCa (GSE126078 and GSE147250). We selected subgroups belonging to each PCa type in these studies, and the correlation of HMGB2 expression and FN1, ZWINT, IGFBP3, SERPINE1, and TYMS was analyzed in AR-negative-neuroendocrine-positive (AR/NE+) and AR-positive-neuroendocrine-negative (AR+/NE) patients. A significant positive correlation between HMGB2 and FN1 expression was found in the AR/NE+ group, but not in the AR+/NE group. This result was obtained in the two independent studies analyzed and is in agreement with those found in the PC-3 and LNPaC cell lines (Figure 4). On the contrary, a positive correlation between TYMS and HMGB2 expression was found in the AR+/NE group, but not in the AR/NE+ group. A positive correlation between ZWINT and HMGB2 expression was found in AR/NE+ and AR/NE+ groups. No positive correlation with HMGB2 expression was found for IGFBP3 and SERPINE1 in these studies (Supplementary Figures S4 and S5). In summary, high levels of HMGB2 expression correlated to high levels of FN1 expression might have clinical significance for the differential diagnosis of AR/NE+ PCa, but we did not find the same correlation with the other four genes analyzed. Avaliable transcriptome data in public databases include a limited number of samples from patients diagnosed with SCNC. More analyses of cohorts with a higher number of patients/samples are necessary to confirm this correlation in clinical data and, probably, to find others that are hidden by this limitation of our study.

3. Discussion

In this work, using the PC-3 cell line as a model, we show the role of HMGB1 and HMGB2 in the transcriptional regulation of 65 genes out of 90 selected genes, which were previously related to PCa. A high expression of the HMGB1 and HMGB2 genes has been related to PCa progression [9,10,11,12,13,14,15,16,19] and drug resistance [19,21]. Therefore, these results indicate that the deregulation of these two proteins, which have been previously related to transcriptional regulation [22], affects molecular mechanisms involved in PCa. HMGB1 decreases the expression of the majority of its target genes, while HMGB2 enhances the expression of most of its targets. Moreover, there are 24 target genes that are oppositely regulated by HMGB1 and HMGB2. The expression of these target genes may depend on the relative levels of HMGB1 and HMGB2 proteins, their differential affinity to regulatory DNA sites, or their interactions with proteins involved in the regulation of gene expression. In our previous work, we have already described that the transcriptional effect of silencing HMGB1 or HMGB2 is opposite for other target genes (i.e., DLAT, FLNA, MNAT1, MT2A, SNAPIN, UBE2E3, and UHRF2) encoding proteins that interact with HMGB proteins, and also for PMEPA1 or PSA, which are traditional biomarkers of PCa risk [18].
Six genes were selected for further analysis in LNCaP, a PCa cell line from adenocarcinoma. In the prostate cancer DU145 cell line, also generated from adenocarcinoma, it has been reported that the upregulation of SERPINE1 (a serine protease inhibitor) diminishes cell proliferation and this effect is induced via activation of the AKT pathway after silencing the transcription factor ELK3 [23]. In PCa patients, the connection of HMGB1 with proliferation and metastasis was previously related to the AKT pathway. It was reported that the interaction between HMGB1 and the protein encoded by Brahma-related gene 1 (BRG1), both upregulated in PCa, enhances the AKT signaling pathway and promotes epithelial–mesenchymal transition (EMT) [14]. In this sense, our data supporting the regulation of SERPINE1 by HMGB1 and HMGB2 suggest that this regulation could affect the AKT pathway. CDK1 and AKT are the kinases phosphorylating Ser81 and Ser213, respectively, on the AR protein, and this modification influences AR protein stability and the protein levels of its target gene PSA [24]. Therefore, CDK1 regulation by HMGB1/2 and the subsequent phosphorylation of AR at Ser81 may influence the AKT response in PCa. The phosphorylation of AR on Ser308 by CDK1 during mitosis also regulates the localization and transcriptional activity of AR [25]. In addition to control cell signaling pathways affecting AR expression, we have seen in our study that HMGB1 and HMGB2 silencing or overexpression affect the expression of genes downstream of AR. ZWINT (ZW10 interacting protein) is a component of the kinetochore complex required for the mitotic spindle checkpoint. ZWINT is a target of AR which is upregulated in PCa [4], and it has been also identified with bioinformatics tools as a hub gene in prostate cancer [26].
All these pieces of evidence support the fact that the HMGB1 and HMGB2 proteins control proliferation in PCa via AKT, CDK1, and AR targets. Moreover, they might also control the EMT transition, having a role in invasion and metastasis via the regulation of FN1. HMGB1 has been previously involved in EMT [15]. FN1 encodes fibronectin that forms insoluble fibrils in connective tissues, and also promotes cell proliferation, migration, invasion, and EMT in papillary thyroid carcinoma [27]. FN1 expression is necessary for Focal Adhesion Kinase (FAK)/Extracellular Signal-Regulated Kinase (ERK)/Phosphoinostide 3-kinase (P13K) signaling [27], and its overexpression has been related to extra-capsular extension and lymph node invasion in PCa patients [27].
Our results also suggest that HMGB1/2 affect proliferation in PCa by regulating DNA repair by regulating TYMS. Thymidylate synthase (TYMS) is necessary for dTTP synthesis, which is required for DNA replication and repair [28]. Therefore, the decrease in TYMS expression limits cell proliferation and cancer growth [29]. Interestingly, studies analyzing TYMS expression in cohorts of prostate patients reported a positive correlation with aggressive tumors [30].
The plasma levels of insulin-like growth factor-I (IGF-I) and its main circulating binding protein, IGF binding protein-3 (IGFBP-3), have been associated with the risk of prostate cancer. Approximately 2% of the male population have high levels of IGF-I as well as low levels of IGFBP-3, which is associated with a high risk of suffering advanced prostate cancer with metastasis [31]. In our study, IGFBP3 is one of the genes that exhibits the highest fold change in expression after HMGB1/2 silencing in PC-3 (Figure 1). This anticipates that the HMGB1/2 proteins might affect PCa progression by a wide repertory of molecular mechanisms as deduced from the diverse mechanisms of action already reported for IGFBP-3. In this sense, adding the IGFBP-3 protein to the LNCaP cell growth medium inhibited growth through p21/WAF1 [32]; IGFBP3 and MAPK/ERK signaling mediates melatonin-induced antitumor activity in PCa [33]; and IGFBP-3 also promotes TGFβ-mediated EMT and cell motility in other human cancer cells [34].
Another interesting result derived from our study is that although gene regulation by HMGB1 functions similarly in PC-3 and LNCaP, regulation by HMGB2 behaves differently in the two cell lines. The role of HMGB2 in PCa has been less studied than that of HMGB1, and, as deduced from our in vitro experiments with PCa cell lines, its differential regulatory role in aggressive types of PCa is of interest for the selection of more specific therapeutic targets, which can allow new therapies to be developed for these patients. Remarkably, a significant positive correlation between HMGB2 and FN1 expression was only found in the AR-negative-neuroendocrine-positive group. Recently, the single-cell sequencing of PCa samples has brought into light that FN1 is highly expressed in a subtype of cancer-associated fibroblast (CAFs-C1) characterized in the PCa microenvironment, and a significant enrichment of CAFs-C1 is observed when comparing signatures in castration-resistant samples versus hormone-sensitive samples [35].

4. Materials and Methods

4.1. Biological Materials

PC-3 [4] and LNCaP [20] cell lines, obtained from the ATCC, were maintained at 37 °C in 5% CO2 in air in a humidified incubator, and grown in RPMI 1610 medium (Gibco-Thermo Fisher Scientific, Waltham, MA, USA), supplemented with 10% heat-inactivated fetal bovine serum (Gibco-Thermo Fisher Scientific, Waltham, MA, USA) and 1% penicillin-streptomycin (Gibco-Thermo Fisher Scientific, Waltham, MA, USA). Cell cultures were regularly tested for mycoplasma contamination and were found to be negative in all cases.

4.2. HMGB1 and HMGB2 Silencing by siRNA in PC-3

The PC-3 cell line was transfected with small interfering (si)RNA oligonucleotides using Lipofectamine 2000 (Invitrogen, Carlsbad, CA, USA). siRNA and Lipofectamine 2000 were each diluted separately with Opti-MEM (Gibco-Thermo Fisher Scientific, Waltham, MA, USA), mixed, and incubated for 5 min at RT. The mixture was added to cells plated in 3 mL RPMI 1610 medium (final concentration of siRNA, 50 nM). Cells were collected at 48 h post transfection for further analysis. The following siRNAs (Life Technologies, Carlsbad, CA, USA) were used for the silencing of each gene: s20254 Silencer Select for HMGB1, s6650 for HMGB2, and AS02A5Z3 for the siRNA negative control. Total RNA was extracted from different (siHMGB1, siHMGB2, and siCtrl#2) modified PC-3 cells using the GeneJET RNA Purification Kit (#K0731, Thermo Fisher Scientific, Waltham, MA, USA). The remaining DNA was removed by incubating with DNase I, Rnase-free (#EN0521, Thermo Fisher Scientific, Waltham, MA, USA). DNA-free RNA was finally purified using the GeneJET RNA Cleanup and Concentration Micro Kit (#K0842, Thermo Fisher Scientific, Waltham, MA, USA). HMGB1 and HMGB2 silencing was validated using RT-qPCR and Western blot. RT-qPCR reactions were run in triplicate with 1 ng of RNA per reaction and specific primers (Supplementary Table S4) using the One-step NZYSpeedy RT-qPCR Green kit (Nzytech, Lisboa, Portugal). Reaction conditions for thermal cycling were as follows: 42 °C for 5 min, 95 °C for 5 s, 40 cycles of 95 °C for 3 s, and finally 60 °C for 20 s. For Western blot, cell lysates were extracted with lysis buffer (50 mM Tris-HCl pH 8, 150 mM NaCl, 0.1% NP40, 1 mM ethylenediaminetetraacetic acid disodium salt (EDTA), and 2 mM MgCl2), and protein concentration was quantified using Bradford Reagent (BioRad, Hercules, CA, USA). Protein samples of 25–40 μg were loaded for Western blotting. PVDF membranes were incubated overnight at 4 °C with primary antibodies, anti-HMGB1 (ab18256, Abcam, Cambridge, UK), anti-HMGB2 (ab67282, Abcam, Cambridge, UK), anti-α-tubulin (sc53646, Santa Cruz Biotechnology, Dallas, TX, USA), or anti-GAPDH (sc-47724, Santa Cruz Biotechnology, Dallas, TX, USA).

4.3. Analysis of Gene Expression in siHMGB1 and siHMGB2 PC-3 Cells Using Prime-PCR Panels

Pre-designed plates “PrimePCR Pathway Plate, 96 well Prostatic neoplasms Tier 1 H96, Hsa” were used for this assay according to the manufacturer’s instructions. The design of these plates is shown in Supplementary Figure S6. A total of 1 µg of RNA was retrotranscribed into cDNA using the iScript Advanced cDNA Synthesis Kit (BioRad, Hercules, CA, USA), and then cDNA was diluted to a final volume of 100 µL. qPCR was performed using SsoAdvanced Universal SYBR Green Supermix (BioRad, Hercules, CA, USA), with 1 µL of cDNA per reaction, in a CFX96 Touch equipment (BioRad, Hercules, CA, USA). All internal controls, named genomic DNA contamination, retrotranscription efficiency, amplification efficiency, and quality control, were valid across all the different replicates.

4.4. HMGB1 and HMGB2 Silencing by shRNA in PCa Cell Lines

For lentivirus production and transduction, HEK293T cells were transfected with 5 μg of packaging and envelope lentiviral constructs (psPAX2 and pMD2.G, respectively), as well as 5 μg of shRNA harboring pLKO.1-based vector, using Opti-MEM (Gibco) and polyethylenimine reagent (PEI). The shRNAs used are shown in Supplementary Table S4. Cell supernatants were harvested 48 and 72 h post transfection (with medium renewal in-between), centrifuged, and filtered (0.45 μm membrane). Subject cells were cultured with virus-containing medium with 8 μg/mL polybrene. Three consecutive infections were performed every 12 h. Finally, 48 h after the last infection, positive cells were selected through the addition of 3 μg/mL puromycin. HMGB1 and HMGB2 silencing was validated using RT-qPCR, as already explained.

4.5. HMGB1 and HMGB2 Overexpression in PCa Cell Lines

pCMVHMGB1 or pCMVHMGB2 expression plasmids were obtained by deleting DsRed-monomer-C1 from the plasmids encoding pDsRed-monomer-C1-HMGB1 or pDsRed-monomer-C1-HMGB2 by mutagenesis with the In-Fusion cloning method [36]. A divergent PCR was performed using two primers (Supplementary Table S4) that overlapped by 15 bp at their 5′ ends and did not include DsRed-monomer and Phusion™ High-Fidelity DNA Polymerase (Thermo Fisher Scientific, Waltham, MA, USA). The PCR product was digested with DpnI to remove the remaining template plasmid. The digested PCR products were transformed in XL1-Blue competent cells for recircularization by recombination. The plasmids were verified using sequencing. Approximately 3 × 10⁵ PC-3 or LNCap cells were seeded in each well of a 6-well plate. After 24 h, they were transfected with 4 μg of pDsRed-Monomer-C1 (empty plasmid control, #632466 Takara Bio Inc., Shiga, Japan) pCMVHMGB1 or pCMVHMGB2 plasmid using Lipofectamine 2000 (Invitrogen, Carlsbad, CA, USA), following the manufacturer’s instructions. Cells were collected 48 h after the transfection. HMGB1 and HMGB2 overexpression was validated using RT-qPCR, as already explained.

4.6. Relative Expression Analyses

The differential expression of selected genes in PC-3 and LNCap cells, in which HMGB1 or HMGB2 had been silenced or overexpressed, versus control PCa cell lines was measured using PrimePCR assays or RT-qPCR with specific primers (Supplementary Table S4), as explained above. Relative expression analyses after PrimePCR assays or q-RTPCR were carried out using the 2−ΔΔCt method [37]. Statistical analyses comprised two-tailed t tests.

4.7. Correlation Analyses

Correlation between the expression of HMGB1/HMGB2 genes and their identified target genes was performed using two different approaches. First, the studies (listed in Table 1 and Table 2) containing transcriptomic data from prostate cancer patients in cBioPortal (https://www.cbioportal.org/, accessed on 2 September 2023) were analyzed individually, HMGB1 and HMGB2 were queried, and the “Co-expression” tab was used to obtain the correlation and linear regression parameters with the identified genes. Study information is included in Supplementary Table S3. Second, transcriptomic data from studies GSE147250 (138 samples) and GSE126078 (98 samples) were downloaded; then, they were clustered into groups, according to their AR and NE subtype status; finally, a linear regression study between the expression of HMGB1 or HMGB2 and their identified target genes was performed within each group. An F-test was conducted by linear regressions to check statistical significance using GraphPad Prism v8.2.0.

5. Conclusions

In conclusion, HMGB1 and HMGB2 control the expression of numerous genes related to PCa. Their targets are related to different cancer hallmarks and to the expression of biomarkers commonly used in PCa diagnosis like AR or PSA. Regarding the regulation of FN1 by HMGB2, we have found differences between AR-negative-neuroendocrine-positive and AR-positive-neuroendocrine-negative PCa.

Supplementary Materials

The supporting information can be downloaded at: https://www.mdpi.com/article/10.3390/ijms25063106/s1.

Author Contributions

Conceptualization, Á.V.-V., M.L.-M. and M.-E.C.; investigation, M.S.-M.; formal analysis, M.S.-M.; funding acquisition, M.L.-M., Á.V.-V. and M.-E.C.; methodology, L.L.-C. and Á.V.-V.; project administration, M.L.-M.; resources, A.B.-A. and E.R.-B.; supervision, M.L.-M. and M.-E.C.; writing—original draft, M.S.-M., M.L.-M. and M.-E.C.; writing—review and editing, M.S.-M., M.L.-M., L.L.-C., Á.V.-V., A.B.-A., E.R.-B. and M.-E.C. All authors have read and agreed to the published version of the manuscript.

Funding

This research was funded by the Plan Estatal I + D + i, Instituto de Salud Carlos III (ISCIII, Spain, grant no. PI18/01417 and Fortalece FORT23/00010) and the Ministerio de Ciencia e Innovación (grant no. PID2021-124564OB-I00), and co-funded by the Fondo Europeo de Desarrollo Regional-FEDER (The European Regional Development Fund-ERDF) “A way of Making Europe” and by the Xunta de Galicia (Consolidación Grupos Referencia Competitiva, grant no. ED431C 2020-08). M.S.-M. acknowledges the Ministry of Science, Innovation, and Universities of Spain for funding through an FPU fellowship.

Institutional Review Board Statement

Not applicable.

Informed Consent Statement

Not applicable.

Data Availability Statement

Data are included within the article or Supplementary Material.

Acknowledgments

PrimePCR assays were processed at the Molecular Biology Unit of SAI-UDC, with the assistance of Fernanda Fariña.

Conflicts of Interest

The authors declare no conflicts of interest.

References

  1. Sung, H.; Ferlay, J.; Siegel, R.L.; Laversanne, M.; Soerjomataram, I.; Jemal, A.; Bray, F. Global Cancer Statistics 2020: GLOBOCAN Estimates of Incidence and Mortality Worldwide for 36 Cancers in 185 Countries. CA Cancer J. Clin. 2021, 71, 209–249. [Google Scholar] [CrossRef] [PubMed]
  2. Rubin, M.A.; Maher, C.A.; Chinnaiyan, A.M. Common Gene Rearrangements in Prostate Cancer. J. Clin. Oncol. 2011, 29, 3659–3668. [Google Scholar] [CrossRef] [PubMed]
  3. Urbanucci, A.; Sahu, B.; Seppala, J.; Larjo, A.; Latonen, L.M.; Waltering, K.K.; Tammela, T.L.J.; Vessella, R.L.; Lahdesmaki, H.; Janne, O.A.; et al. Overexpression of Androgen Receptor Enhances the Binding of the Receptor to the Chromatin in Prostate Cancer. Oncogene 2012, 31, 2153–2163. [Google Scholar] [CrossRef] [PubMed]
  4. Tai, S.; Sun, Y.; Squires, J.M.; Zhang, H.; Oh, W.K.; Liang, C.; Huang, J. PC3 is a Cell Line Characteristic of Prostatic Small Cell Carcinoma. Prostate 2011, 71, 1668–1679. [Google Scholar] [CrossRef] [PubMed]
  5. Beltran, H.; Prandi, D.; Mosquera, J.M.; Benelli, M.; Puca, L.; Cyrta, J.; Marotz, C.; Giannopoulou, E.; Chakravarthi, B.V.S.K.; Varambally, S.; et al. Divergent Clonal Evolution of Castration-Resistant Neuroendocrine Prostate Cancer. Nat. Med. 2016, 22, 298–305. [Google Scholar] [CrossRef] [PubMed]
  6. Ostano, P.; Mello-Grand, M.; Sesia, D.; Gregnanin, I.; Peraldo-Neia, C.; Guana, F.; Jachetti, E.; Farsetti, A.; Chiorino, G. Gene Expression Signature Predictive of Neuroendocrine Transformation in Prostate Adenocarcinoma. Int. J. Mol. Sci. 2020, 21, 1078. [Google Scholar] [CrossRef] [PubMed]
  7. Slominski, R.M.; Raman, C.; Chen, J.Y.; Slominski, A.T. How Cancer Hijacks the Body’s Homeostasis through the Neuroendocrine System. Trends Neurosci. 2023, 46, 263–275. [Google Scholar] [CrossRef]
  8. Agresti, A.; Bianchi, M.E. HMGB Proteins and Gene Expression. Curr. Opin. Genet. Dev. 2003, 13, 170–178. [Google Scholar] [CrossRef]
  9. Ishiguro, H.; Nakaigawa, N.; Miyoshi, Y.; Fujinami, K.; Kubota, Y.; Uemura, H. Receptor for Advanced Glycation End Products (RAGE) and its Ligand, Amphoterin are Overexpressed and Associated with Prostate Cancer Development. Prostate 2005, 64, 92–100. [Google Scholar] [CrossRef]
  10. Wu, T.; Zhang, W.; Yang, G.; Li, H.; Chen, Q.; Song, R.; Zhao, L. HMGB1 Overexpression as a Prognostic Factor for Survival in Cancer: A Meta-Analysis and Systematic Review. Oncotarget 2016, 7, 50417–50427. [Google Scholar] [CrossRef]
  11. Gnanasekar, M.; Thirugnanam, S.; Ramaswamy, K. Short Hairpin RNA (shRNA) Constructs Targeting High Mobility Group Box-1 (HMGB1) Expression Leads to Inhibition of Prostate Cancer Cell Survival and Apoptosis. Int. J. Oncol. 2009, 34, 425–431. [Google Scholar] [CrossRef] [PubMed]
  12. Elangovan, I.; Thirugnanam, S.; Chen, A.; Zheng, G.; Bosland, M.C.; Kajdacsy-Balla, A.; Gnanasekar, M. Targeting Receptor for Advanced Glycation End Products (RAGE) Expression Induces Apoptosis and Inhibits Prostate Tumor Growth. Biochem. Biophys. Res. Commun. 2012, 417, 1133–1138. [Google Scholar] [CrossRef] [PubMed]
  13. Zhang, Y.; Lv, F.; Qiao, L.; Zhao, Q. MiR-505 Inhibits Prostate Cancer Cell Invasion, Metastasis and Epithelial-to-Mesenchymal Transition through Targeting HMGB-1. J. BUON 2020, 25, 2036–2044. [Google Scholar] [PubMed]
  14. Lv, D.; Song, X.; Huang, B.; Yu, Y.; Shu, F.; Wang, C.; Chen, H.; Zhang, H.; Zhao, S. HMGB1 Promotes Prostate Cancer Development and Metastasis by Interacting with Brahma-Related Gene 1 and Activating the Akt Signaling Pathway. Theranostics 2019, 9, 5166–5182. [Google Scholar] [CrossRef] [PubMed]
  15. Zhang, J.; Shao, S.; Han, D.; Xu, Y.; Jiao, D.; Wu, J.; Yang, F.; Ge, Y.; Shi, S.; Li, Y.; et al. High Mobility Group Box 1 Promotes the Epithelial-to-Mesenchymal Transition in Prostate Cancer PC3 Cells Via the RAGE/NF-kappaB Signaling Pathway. Int. J. Oncol. 2018, 53, 659–671. [Google Scholar] [CrossRef] [PubMed]
  16. Suzuki, S.; Kato, H.; Fuji, S.; Naiki, T.; Naiki-Ito, A.; Yamashita, Y.; Takahashi, S. Early Detection of Prostate Carcinogens by Immunohistochemistry of HMGB2. J. Toxicol. Sci. 2018, 43, 359–367. [Google Scholar] [CrossRef] [PubMed]
  17. Lei, X.; Hu, X.; Zhang, T.; Zhang, J.; Wu, C.; Hong, W.; Jiang, Y.; Wang, Q.; Xie, Y.; Zhao, Y.; et al. HMGB1 Release Promotes Paclitaxel Resistance in Castration-Resistant Prostate Cancer Cells Via Activating C-Myc Expression. Cell. Signal. 2020, 72, 109631. [Google Scholar] [CrossRef]
  18. Barreiro-Alonso, A.; Camara-Quilez, M.; Salamini-Montemurri, M.; Lamas-Maceiras, M.; Vizoso-Vazquez, A.; Rodriguez-Belmonte, E.; Quindos-Varela, M.; Martinez-Iglesias, O.; Figueroa, A.; Cerdan, M. Characterization of HMGB1/2 Interactome in Prostate Cancer by Yeast Two Hybrid Approach: Potential Pathobiological Implications. Cancers 2019, 11, 1729. [Google Scholar] [CrossRef]
  19. Chen, J.; Xu, D.; Wang, T.; Yang, Z.; Yang, Y.; He, K.; Zhao, L. HMGB1 Promotes the Development of Castration-resistant Prostate Cancer by Regulating Androgen Receptor Activation. Oncol. Rep. 2022, 48, 197. [Google Scholar] [CrossRef]
  20. Horoszewicz, J.S.; Leong, S.S.; Chu, T.M.; Wajsman, Z.L.; Friedman, M.; Papsidero, L.; Kim, U.; Chai, L.S.; Kaka, S.; Arya, S.K.; et al. The LNCaP Cell Line—A New Model for Studies on Human Prostatic Carcinoma. Prog. Clin. Biol. Res. 1980, 37, 115–132. [Google Scholar]
  21. Zhou, J.; Chen, X.; Gilvary, D.L.; Tejera, M.M.; Eksioglu, E.A.; Wei, S.; Djeu, J.Y. HMGB1 Induction of Clusterin Creates a Chemoresistant Niche in Human Prostate Tumor Cells. Sci. Rep. 2015, 5, 15085. [Google Scholar] [CrossRef]
  22. Vizoso-Vázquez, Á.; Barreiro-Alonso, A.; Rico-Díaz, A.; Lamas-Maceiras, M.; Rodríguez-Belmonte, E.; Becerra, M.; González-Siso, M.I.; Cerdán, M.E. Gene Regulation, DNA Repair and Beyond. In Old Yeasts-New Questions; Lucas, C., Pais, C., Eds.; Intech: Berlin, Germany, 2017; Chapter 7. [Google Scholar]
  23. Mao, Y.; Li, W.; Hua, B.; Gu, X.; Pan, W.; Chen, Q.; Xu, B.; Wang, Z.; Lu, C. Silencing of ELK3 Induces S-M Phase Arrest and Apoptosis and Upregulates SERPINE1 Expression Reducing Migration in Prostate Cancer Cells. Biomed. Res. Int. 2020, 2020, 2406159. [Google Scholar] [CrossRef]
  24. Kuo, Y.; Huo, C.; Lin, C.; Lin, H.; Liu, J.; Wang, W.; Chang, C.; Chuu, C. Caffeic Acid Phenethyl Ester Suppresses Androgen Receptor Signaling and Stability Via Inhibition of Phosphorylation on Ser81 and Ser213. Cell. Commun. Signal. 2019, 17, 100–109. [Google Scholar] [CrossRef] [PubMed]
  25. Koryakina, Y.; Knudsen, K.E.; Gioeli, D. Cell-Cycle-Dependent Regulation of Androgen Receptor Function. Endocr. Relat. Cancer 2015, 22, 249–264. [Google Scholar] [CrossRef]
  26. Song, Z.; Chao, F.; Zhuo, Z.; Ma, Z.; Li, W.; Chen, G. Identification of Hub Genes in Prostate Cancer using Robust Rank Aggregation and Weighted Gene Co-Expression Network Analysis. Aging 2019, 11, 4736–4756. [Google Scholar] [CrossRef] [PubMed]
  27. Jiang, Y.; Liu, Y.; Zhang, Y.; Ouyang, J.; Feng, Y.; Li, S.; Wang, J.; Zhang, C.; Tan, L.; Zhong, J.; et al. MicroRNA-142-3P Suppresses the Progression of Papillary Thyroid Carcinoma by Targeting FN1 and Inactivating FAK/ERK/PI3K Signaling. Cell. Signal. 2023, 109, 110792. [Google Scholar] [CrossRef] [PubMed]
  28. Carreras, C.W.; Santi, D.V. The Catalytic Mechanism and Structure of Thymidylate Synthase. Annu. Rev. Biochem. 1995, 64, 721–762. [Google Scholar] [CrossRef]
  29. Rustum, Y.M. Thymidylate Synthase: A Critical Target in Cancer Therapy? Front. Biosci. 2004, 9, 2467–2473. [Google Scholar] [CrossRef]
  30. Burdelski, C.; Strauss, C.; Tsourlakis, M.C.; Kluth, M.; Hube-Magg, C.; Melling, N.; Lebok, P.; Minner, S.; Koop, C.; Graefen, M.; et al. Overexpression of Thymidylate Synthase (TYMS) is Associated with Aggressive Tumor Features and Early PSA Recurrence in Prostate Cancer. Oncotarget 2015, 6, 8377–8387. [Google Scholar] [CrossRef]
  31. Chan, J.M.; Stampfer, M.J.; Ma, J.; Gann, P.; Gaziano, J.M.; Pollak, M.; Giovannucci, E. Insulin-Like Growth Factor-I (IGF-I) and IGF Binding Protein-3 as Predictors of Advanced-Stage Prostate Cancer. J. Natl. Cancer Inst. 2002, 94, 1099–1106. [Google Scholar] [CrossRef]
  32. Boyle, B.J.; Zhao, X.Y.; Cohen, P.; Feldman, D. Insulin-Like Growth Factor Binding Protein-3 Mediates 1 Alpha,25-Dihydroxyvitamin D3 Growth Inhibition in the LNCaP Prostate Cancer Cell Line through p21/WAF1. J. Urol. 2001, 165, 1319–1324. [Google Scholar] [CrossRef] [PubMed]
  33. Mayo, J.C.; Hevia, D.; Quiros-Gonzalez, I.; Rodriguez-Garcia, A.; Gonzalez-Menendez, P.; Cepas, V.; Gonzalez-Pola, I.; Sainz, R.M. IGFBP3 and MAPK/ERK Signaling Mediates Melatonin-Induced Antitumor Activity in Prostate Cancer. J. Pineal Res. 2017, 62, e12373. [Google Scholar] [CrossRef] [PubMed]
  34. Natsuizaka, M.; Ohashi, S.; Wong, G.S.; Ahmadi, A.; Kalman, R.A.; Budo, D.; Klein-Szanto, A.J.; Herlyn, M.; Diehl, J.A.; Nakagawa, H. Insulin-Like Growth Factor-Binding Protein-3 Promotes Transforming Growth Factor-Beta1-Mediated Epithelial-to-Mesenchymal Transition and Motility in Transformed Human Esophageal Cells. Carcinogenesis 2010, 31, 1344–1353. [Google Scholar] [CrossRef] [PubMed]
  35. Pan, J.; Ma, Z.; Liu, B.; Qian, H.; Shao, X.; Liu, J.; Wang, Q.; Xue, W. Identification of Cancer-Associated Fibroblasts Subtypes in Prostate Cancer. Front. Immunol. 2023, 14, 1133160. [Google Scholar] [CrossRef]
  36. Ochman, H.; Gerber, A.S.; Hartl, D.L. Genetic Applications of an Inverse Polymerase Chain Reaction. Genetics 1988, 120, 621–623. [Google Scholar] [CrossRef] [PubMed]
  37. Livak, K.J.; Schmittgen, T.D. Analysis of Relative Gene Expression Data using Real-Time Quantitative PCR and the 2−ΔΔCT Method. Methods 2001, 25, 402–408. [Google Scholar] [CrossRef]
Figure 1. Effect of HMGB1 and HMGB2 on gene expression in PC-3. Silencing of HMGB1 (a) or HMGB2 (b) and Volcano plots (c) of differentially expressed genes. Red dots, repressed genes; green, activated genes; blue, unchanged genes.
Ijms 25 03106 g001aIjms 25 03106 g001b
Figure 2. Display of genes analyzed in the array according to HMGB1 or HMGB2 regulation results and previously assigned oncogenic/tumor suppressor function. * indicates that the expression of AR in PC-3 is very low. Up-green arrows indicate that the HMGB protein activates these target genes. Down-red arrows indicate that the HMGB protein down-regulates these target genes. ≈ indicates that the HMGB protein does not regulate these genes.
Ijms 25 03106 g002
Figure 3. Regulation of target genes by HMGB1 and HMGB2 in PC-3 and LNCaP cell lines. Effect of silencing and overexpression of HMGB1 (a). Effect of silencing and overexpression of HMGB2 on the target genes (b). Comparison of the effect of HMGB1 and HMGB2 silencing on common target genes (c). siRNA-mediated silencing (si); sh silencing (sh); overexpression (ov); * p < 0.05. Verification of HMGB1/2 silencing and overexpression is shown in Supplementary Figure S1 and change folds obtained in different replicas are shown in Supplementary Figure S2. The dotted line (Change fold 1) indicates the limit between up and down regulated genes.
Ijms 25 03106 g003
Figure 4. Correlation between FN1 expression and HMGB2 expression in (a,b) AR4 negative-neuroendocrine-positive (AR/NE+) and (c,d) AR-positive-neuroendocrine-negative patients (AR+/NE) in (a,c) GSE126078 and (b,d) GSE147250 studies. Blue points represent individual samples in the studies.
Ijms 25 03106 g004
Table 1. Negative correlation between the expression of HMGB1 and selected targets in PCa patients.
GENEcBioportal StudySpearman
Coefficient SC
p-Value SCPearson
Coefficient PC
p-Value PC
CDK1MSK, Cancer Cell 2010−0.323.449 × 10−4−0.220.013
FN1DKFZ, Cancer Cell 2018−0.323.712 × 10−4−0.273.282 × 10−3
FN1Fred Hutchinson CRC, Nat Med 2016−0.210.016−0.236.517 × 10−3
FN1TCGA, Firehose Legacy−0.126.638 × 10−3−0.08ns
SERPINE1Fred Hutchinson CRC, Nat Med 2016−0.305.118 × 10−4−0.354.322 × 10−5
SERPINE1TCGA, Cell 2015−0.120.0488−0.09ns
ZWINTDKFZ, Cancer Cell 2018−0.437.12 × 10−7−0.373.14 × 10−5
ns, not significant.
Table 2. Positive correlation between the expression of HMGB2 and selected targets in PCa patients.
GenecBioportal Study Spearman
Coefficient SC
p-Value SCPearson
Coefficient PC
p-Value SC
FN1MSK, Cancer Cell 20100.365.22 × 10−50.403.72 × 10−6
FN1TCGA, Cell 20150.213.43 × 10−40.207.86 × 10−4
FN1TCGA, Firehose Legacy0.212.95 × 10−60.20 4.13 × 10⁻⁶
FN1TCGA, PanCancer Atlas0.225.62 × 10−70.212.83 × 10−6
IGFBP3DKFZ, Cancer Cell 20180.255.78 × 10−30.381.72 × 10−5
IGFBP3MSK, Cancer Cell 20100.16ns0.281.65 × 10−3
IGFBP3TCGA, Cell 20150.408.72 × 10−130.351.37 × 10−9
IGFBP3TCGA, Firehose Legacy0.414.78 × 10−220.361.41 × 10−16
IGFBP3TCGA, PanCancer Atlas0.421.27 × 10−220.372.86 × 10−17
TYMSDKFZ, Cancer Cell 20180.453.11 × 10−70.565.99 × 10−11
TYMSFred Hutchinson CRC, Nat Med 20160.603.75 × 10−140.596.71 × 10−14
TYMSMSK, Cancer Cell 20100.06ns0.404.58 × 10−6
TYMSSUC2C PCF Dream Team Cell 20150.699.03 × 10−180.696.81 × 10−18
TYMSSUC2C PCF Dream Team PNAS 20190.591.02 × 10−200.612.54 × 10−22
TYMSTCGA, Cell 20150.513.51 × 10−200.601.40 × 10−29
TYMSTCGA, Firehose Legacy0.481.99 × 10−300.593.05 × 10−47
TYMSTCGA, PanCancer Atlas0.471.65 × 10−280.583.01 × 10−45
ZWINTDKFZ, Cancer Cell 20180.471.10 × 10−70.604.17 × 10−13
ZWINTFred Hutchinson CRC, Nat Med 20160.672.33 × 10−180.651.52 × 10−17
ZWINTSUC2C PCF Dream Team Cell 20150.621.24 × 10−130.663.83 × 10−16
ZWINTSUC2C PCF Dream Team PNAS 20190.541.80 × 10−170.532.87 × 10−16
ZWINTTCGA, Cell 20150.391.08 × 10−110.501.90 × 10−19
ZWINTTCGA, Firehose Legacy0.354.99 × 10−160.425.98 × 10−23
ZWINTTCGA, PanCancer Atlas0.342.55 × 10−140.411.01 × 10−20
ns, not significant.
Disclaimer/Publisher’s Note: The statements, opinions and data contained in all publications are solely those of the individual author(s) and contributor(s) and not of MDPI and/or the editor(s). MDPI and/or the editor(s) disclaim responsibility for any injury to people or property resulting from any ideas, methods, instructions or products referred to in the content.

