Article

Contrast Agents Based on Human Serum Albumin and Nitroxides for 1H-MRI and Overhauser-Enhanced MRI

1
Institute of Chemical Biology and Fundamental Medicine SB RAS, 630090 Novosibirsk, Russia
2
High-Field Magnetic Resonance Center, Max Planck Institute for Biological Cybernetics, 72076 Tuebingen, Germany
3
N.N. Vorozhtsov Institute of Organic Chemistry SB RAS, 630090 Novosibirsk, Russia
4
Department of Biomedical Magnetic Resonance, Eberhard-Karls University, 72076 Tuebingen, Germany
5
International Tomography Center SB RAS, 630090 Novosibirsk, Russia
*
Authors to whom correspondence should be addressed.
Int. J. Mol. Sci. 2024, 25(7), 4041; https://doi.org/10.3390/ijms25074041
Submission received: 27 February 2024 / Revised: 18 March 2024 / Accepted: 20 March 2024 / Published: 5 April 2024

Abstract

:
In cancer diagnostics, magnetic resonance imaging (MRI) uses contrast agents to enhance the distinction between the target tissue and background. Several promising approaches have been developed to increase MRI sensitivity, one of which is Overhauser dynamic nuclear polarization (ODNP)-enhanced MRI (OMRI). In this study, a macromolecular construct based on human serum albumin and nitroxyl radicals (HSA-NIT) was developed using a new synthesis method that significantly increased the modification to 21 nitroxide residues per protein. This was confirmed by electron paramagnetic resonance (EPR) spectroscopy and matrix-assisted laser desorption/ionization time-of-flight (MALDI ToF) mass spectrometry. Gel electrophoresis and circular dichroism showed no significant changes in the structure of HSA-NITs, and no oligomers were formed during modification. The cytotoxicity of HSA-NITs was comparable to that of native albumin. HSA-NITs were evaluated as potential “metal-free” organic radical relaxation-based contrast agents for 1H-MRI and as hyperpolarizing contrast agents for OMRI. Relaxivities (longitudinal and transversal relaxation rates r1 and r2) for HSA-NITs were measured at different magnetic field strengths (1.88, 3, 7, and 14 T). Phantoms were used to demonstrate the potential use of HSA-NIT as a T1- and T2-weighted relaxation-based contrast agent at 3 T and 14 T. The efficacy of 1H Overhauser dynamic nuclear polarization (ODNP) in liquids at an ultralow magnetic field (ULF, B0 = 92 ± 0.8 μT) was investigated for HSA-NIT conjugates. The HSA-NITs themselves did not show ODNP enhancement; however, under the proteolysis conditions simulating cancer tissue, HSA-NIT conjugates were cleaved into lower-molecular-weight (MW) protein fragments that activate ODNP capabilities, resulting in a maximum achievable enhancement |Emax| of 40–50 and a radiofrequency power required to achieve half of Emax, P1/2, of 21–27 W. The HSA-NIT with a higher degree of modification released increased the number of spin probes upon biodegradation, which significantly enhanced the Overhauser effect. Thus, HSA-NITs may represent a new class of MRI relaxation-based contrast agents as well as novel cleavable conjugates for use as hyperpolarizing contrast agents (HCAs) in OMRI.

1. Introduction

Magnetic resonance imaging (MRI) is one of the most common medical techniques for obtaining high-quality three-dimensional soft tissue images [1,2,3,4,5,6]. 1H-MRI provides information about various biological processes, the diagnosis of diseases, and monitoring therapy efficiency [2,3,6]. MRI is typically performed for water protons. The application of external magnetic field leads to the relatively low thermal equilibrium spin polarization of protons (approximately 0.0003% per Tesla, at body temperature) [7]. Due to the low polarization and relatively slow relaxation of nuclei, magnetic resonance signals are weak, and MRI usually requires strong magnetic fields and lengthy acquisition times.
The most common way to increase MRI sensitivity is an enhancement of the spin relaxation of protons by the addition of a contrast agent (CA). Paramagnetic Gd3+ and Mn2+ complexes, and magnetite nanocomposites, are among the most widely used CA for 1H-MRI [2,5,8,9,10,11,12,13,14]. However, in recent decades, the European Medicines Agency and U.S. Food and Drug Administration (FDA) have prohibited the use of many Gd3+ complexes and magnetite nanoparticles for MRI in clinics [15] due to their side effects and toxicity, including reactive oxygen species generation, neurotoxicity, mitochondrial dysfunction, nucleic acid damage, nephrogenic systemic fibrosis (NSF), etc. [8,9,16,17,18,19,20]. Therefore, there is an extensive interest in the development of “metal-free” CAs.
Stable organic radicals are considered an alternative to paramagnetic metal complexes such as CA for MRI [21]. Organic radical CAs (ORCAs) are compatible with standard imaging protocols, biocompatible, and biodegradable [21,22,23,24,25,26,27]. Although low-molecular radicals demonstrate low relaxivity, fast decay in vivo and are rapidly eliminated [22,28,29,30,31,32,33], the incorporation of multiple radicals into macromolecular or supramolecular structures afforded ORCA, capable of competing with Gd complexes [23,24,25,26,28,33,34,35]. Various nitroxide-based systems, such as encapsulated micelles [36], functionalized polymers [26,27,37], dendrimers [24,25,26,38,39,40,41], and proteins [23], have been developed for 1H-MRI.
Numerous methods are currently being developed to increase the sensitivity of MRI. One effective approach is the use of the dynamic nuclear polarization (DNP) effect at high magnetic fields (>1 T) and temperatures below 5 K [42]. This commercially available technique (dissolution DNP) allows the hyperpolarization of substances such as pyruvate in the form of glassy samples in the solid state, achieving spin polarization levels of up to 80%. After the rapid heating and dissolution of the sample to the liquid state, the resulting hyperpolarized substrate can be introduced into the sample as a biocompatible bolus. One alternative promising avenue is Overhauser dynamic nuclear polarization (ODNP)-enhanced MRI (OMRI). Unlike other dynamic nuclear polarization (DNP) methods that rely on the cross or solid effect, or thermal mixing, OMRI exploits the Overhauser effect [43,44,45].
The Overhauser effect relies on incoherent electron–nuclear cross-relaxation mediated by dipole, scalar, or isotropic hyperfine interactions [14]. Unlike thermal mixing or the solid or cross effect, the Overhauser effect allows the hyperpolarization of liquids at room temperature [46]. This unique advantage allows for continuous in situ, ex vivo, or even in vivo hyperpolarization of the sample itself, eliminating the need for a hyperpolarized bolus. However, ODNP typically results in smaller enhancement factors, of less than 100 for 1H in vivo OMRI applications. Biomedical applications of OMRI include the measurement of tissue oxygen partial pressure, pH, redox status, enzymatic activity, etc. [47,48,49,50,51].
All DNP methods share the common requirement to transfer spin order from free electrons to nearby protons, such as those in water molecules, which requires an RF field with a frequency in the range of the electron Larmor frequency. The latter exceeds the GHz range at the magnetic field of approximately 36 mT (penetration depth around 1 GHz is only a few centimeters, above 10 GHz the penetration depth is less than 1 mm). RF of this frequency is efficiently absorbed by biological tissues, therefore penetration deep into larger samples becomes challenging. Exposure to high-power RF may lead to the overheating of biological tissue. For this reason, in vivo OMRI is generally performed in the low field range, with the optimal field strength depending on the sample geometry and the specific absorption rate (SAR), which must be considered to prevent sample heating [44,52,53]. Nevertheless, in vivo experiments on small animals have been performed using OMRI [46,48]. The success of OMRI depends on the presence of special hyperpolarizing contrast agents (HCAs) that facilitate the transfer of polarization from free electrons, such as free radicals, to nuclear spins, such as water protons, thereby enhancing the MRI signal [14,46]. It is noteworthy that this method is not limited to protons, as the hyperpolarization of other MR-active nuclei, such as 13C, is also possible [54]. Several research groups have already performed OMRI experiments in liquids or small animals using trityl [55] or nitroxyl radicals [46,53,56,57]. Furthermore, radical molecules can be attached to various transport systems for targeted delivery, thereby increasing their half-life in the body.
Here we develop a class of macromolecular CA based on nitroxides (NIT) and human serum albumin (HSA) for 1H-MRI, which also can be used as an HCA for OMRI. Albumin is a major plasma transport protein, which allows accumulation in tumors via passive transport (enhanced permeability and retention effect) or via albumin-binding proteins and receptors [58], making it useful as a delivery system for therapy and diagnostics [8,23,59,60,61,62,63]. HSA as a probe carrier has high biocompatibility and retention time in the body, low immunogenicity, and structural stability toward chemical modification [8,64,65,66,67,68,69,70,71,72,73,74].
These new constructs (HSA-NIT) retain the essential properties of nitroxides, such as paramagnetism, which was demonstrated by room-temperature continuous-wave electronic magnetic resonance (CW EPR) and relaxivities r1 and r2 under various magnetic field studies. To confirm the possibility of MRI signal registration, phantom T1- and T2-relaxation-weighted images were obtained using 3 T and 14 T MRI scanners. HSA-NIT retains the properties of albumin such as low cytotoxicity on breast cancer MCF-7 and human glioblastoma T98G cell cultures using an MTT assay [75,76]. The comprehensive characterization of HSA-NIT conjugates was facilitated by MALDI ToF mass spectrometry, polyacrylamide gel electrophoresis in native (PAGE) and denaturation condition (SDS-PAGE), and circular dichroism (CD) spectroscopy. To confirm the possibility of OMRI signal registration, we digested HSA-NIT using trypsin and studied the efficacy in 1H Overhauser DNP (ODNP) in aqueous solution in an ultralow magnetic field (ULF, B0 = 92 ± 0.8 μT) and polarization field (Bp = 1–10 mT) per time. Under protein proteolysis, which can occur in cells and cancer tissues, EPR spectra contain narrow spectral lines, and highly efficient ODNP enhancement can occur. The results from HSA-NIT studies have shown great promise for dual-modal MRI and enzyme-activated OMRI probe design.

2. Results and Discussion

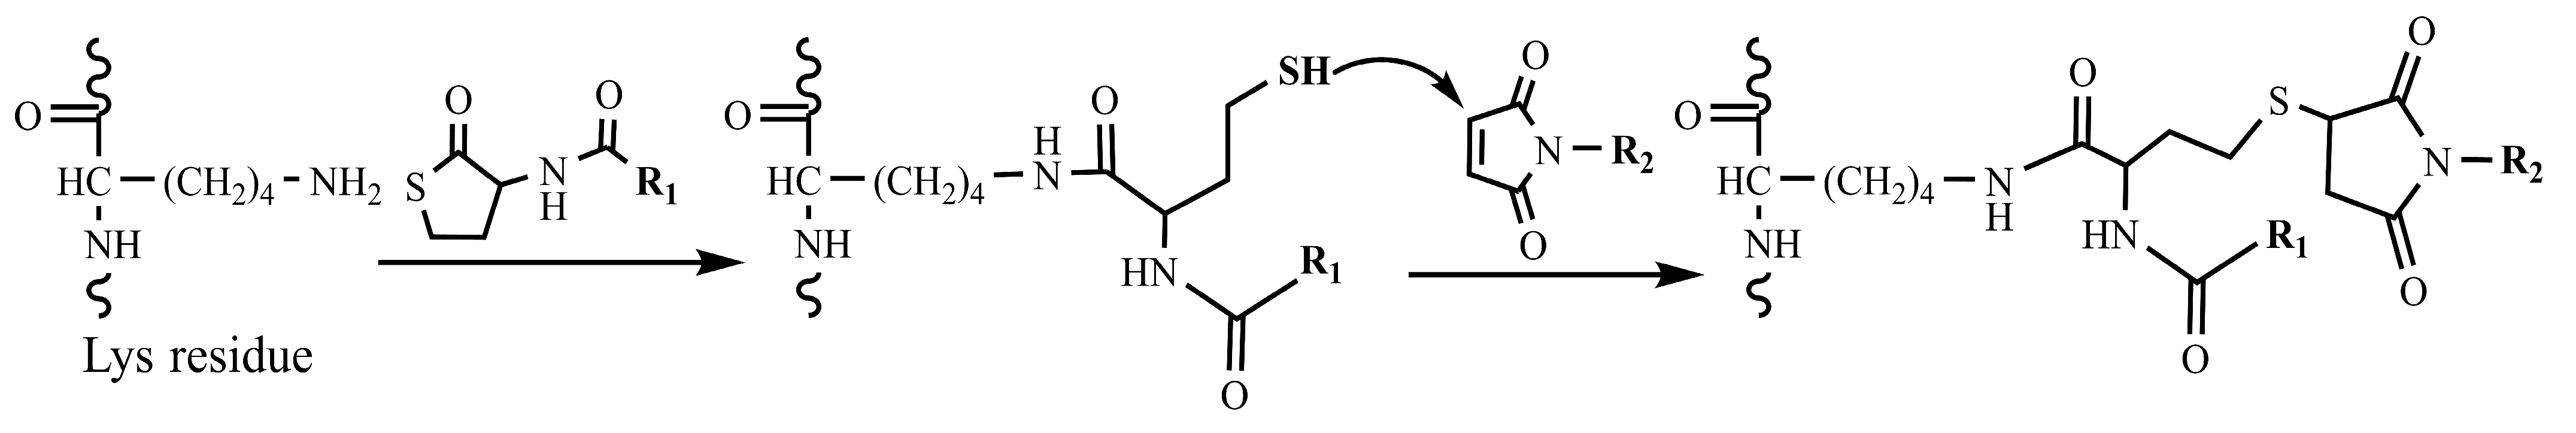
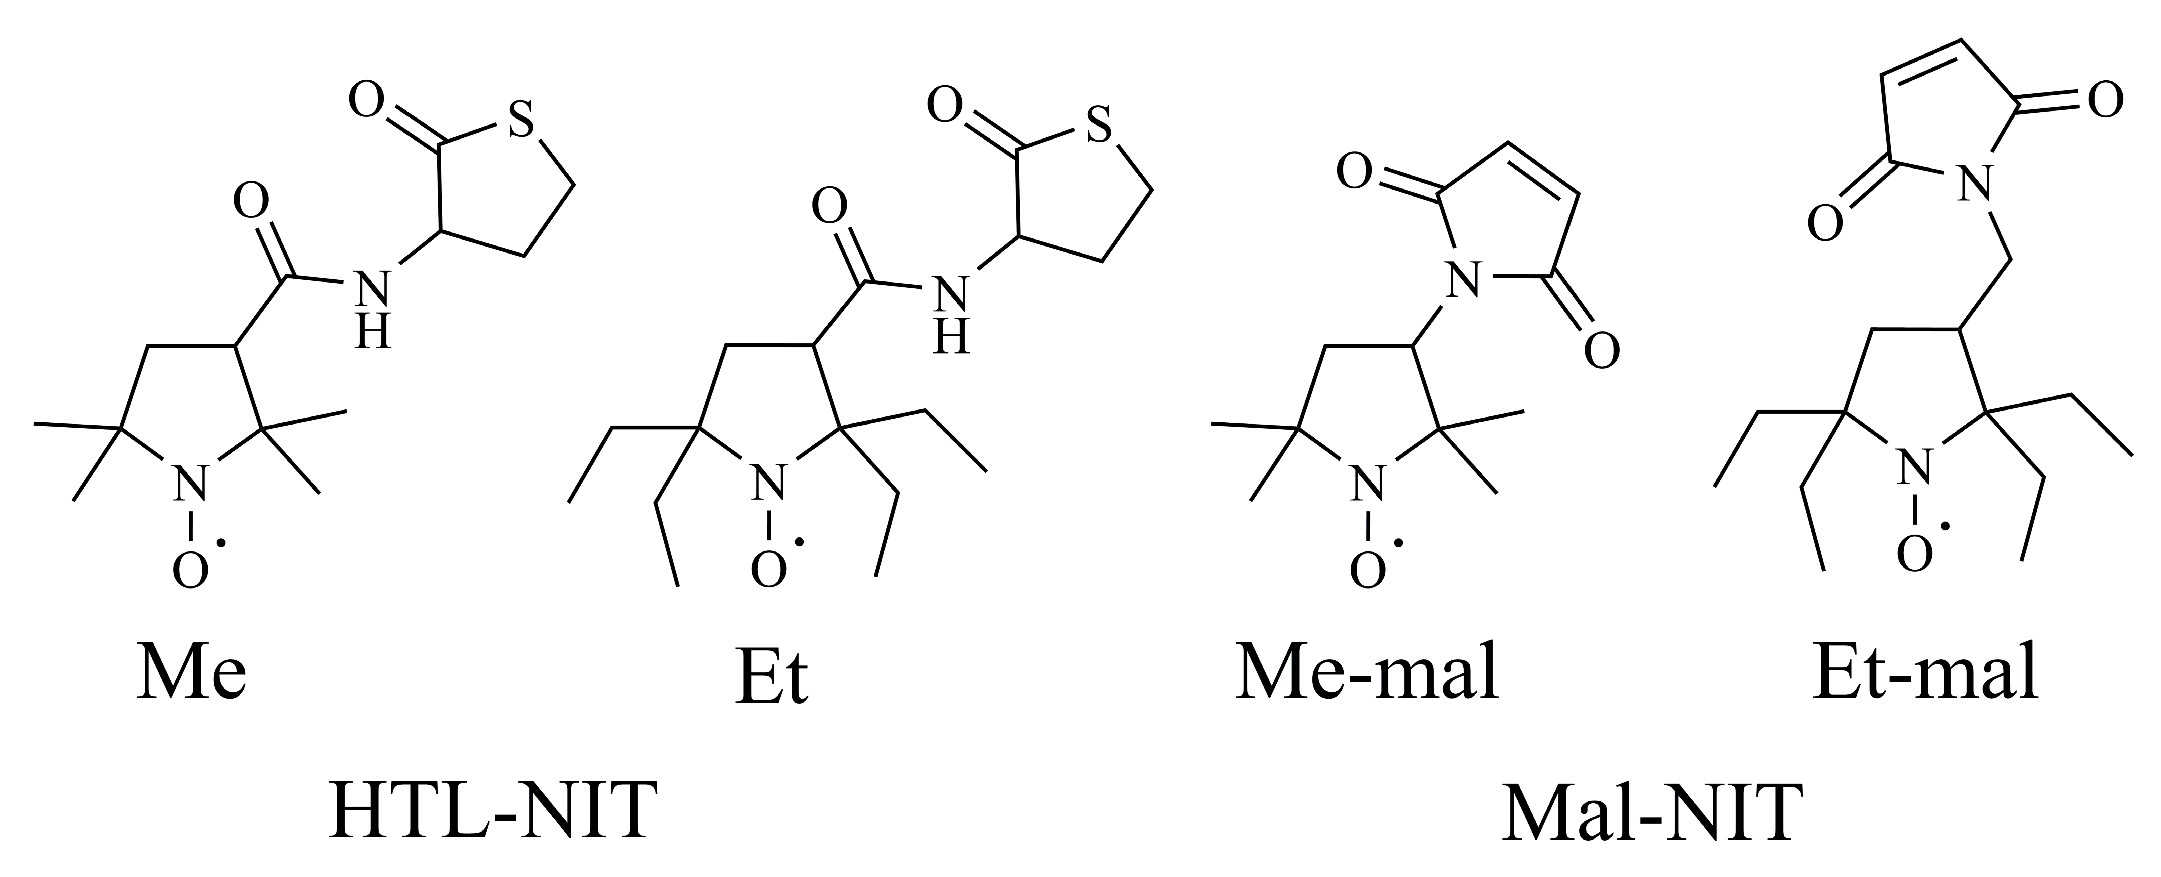
2.1. Design and Synthesis of HSA-NIT Conjugates

Site-specific labeling is most commonly performed on cysteine [23,77,78], lysine [23,79], and tyrosine [77,80] in proteins. However, for MRI applications, many nitroxide residues should be attached to HSA. In this way, the modification of amino groups of lysine seems to be the optimal choice due to the presence of 59 lysine amino acid residues in albumin molecule. Previously, we synthesized albumin conjugates with three to four nitroxides (HSA-NIT) via a site-specific reaction with N-spin-labeled homocysteine thiolactone (HTL) [23]. HTL has a strained five-membered ring, which can react with various nucleophiles (e.g., amino group of lysine residues) [81], leading to ring opening and stable amide bond formation (Figure 1). N-Homocysteinylation is a site-specific reaction that proceeds on seven lysine residues (Lys-525, 212, 205, 159, 137, 12, and 4) [23,63,82,83,84], and it is possible to vary the extent of modification by changing the reaction conditions and obtain new conjugates with specified properties. HSA-NIT conjugates provided good stability, relative to gadolinium chelates relaxivity, and there was no cytotoxicity [23]. However, the homocysteinylation reaction leads to the release of thiol groups in the side chain, which may initiate structural changes in the protein and oligomerization via thiol exchange and oxidation to disulfides.
Herein, we used both thiolactone (HTL-NIT) and maleimide (Mal-NIT) nitroxide derivatives for HSA modification (Figure 2). Maleimides are well-known reagents that rapidly bind SH-groups via the Michael addition reaction [82]. In this alternative method, the SH-groups released in the reaction of lysine residues and HTL-NIT can react with the Mal-NIT, providing the double spin labeling of a single lysine residue in a protein (Figure 1) [85]. This double modification allows the prevention of secondary reactions of SH-groups, which can damage the protein structure.

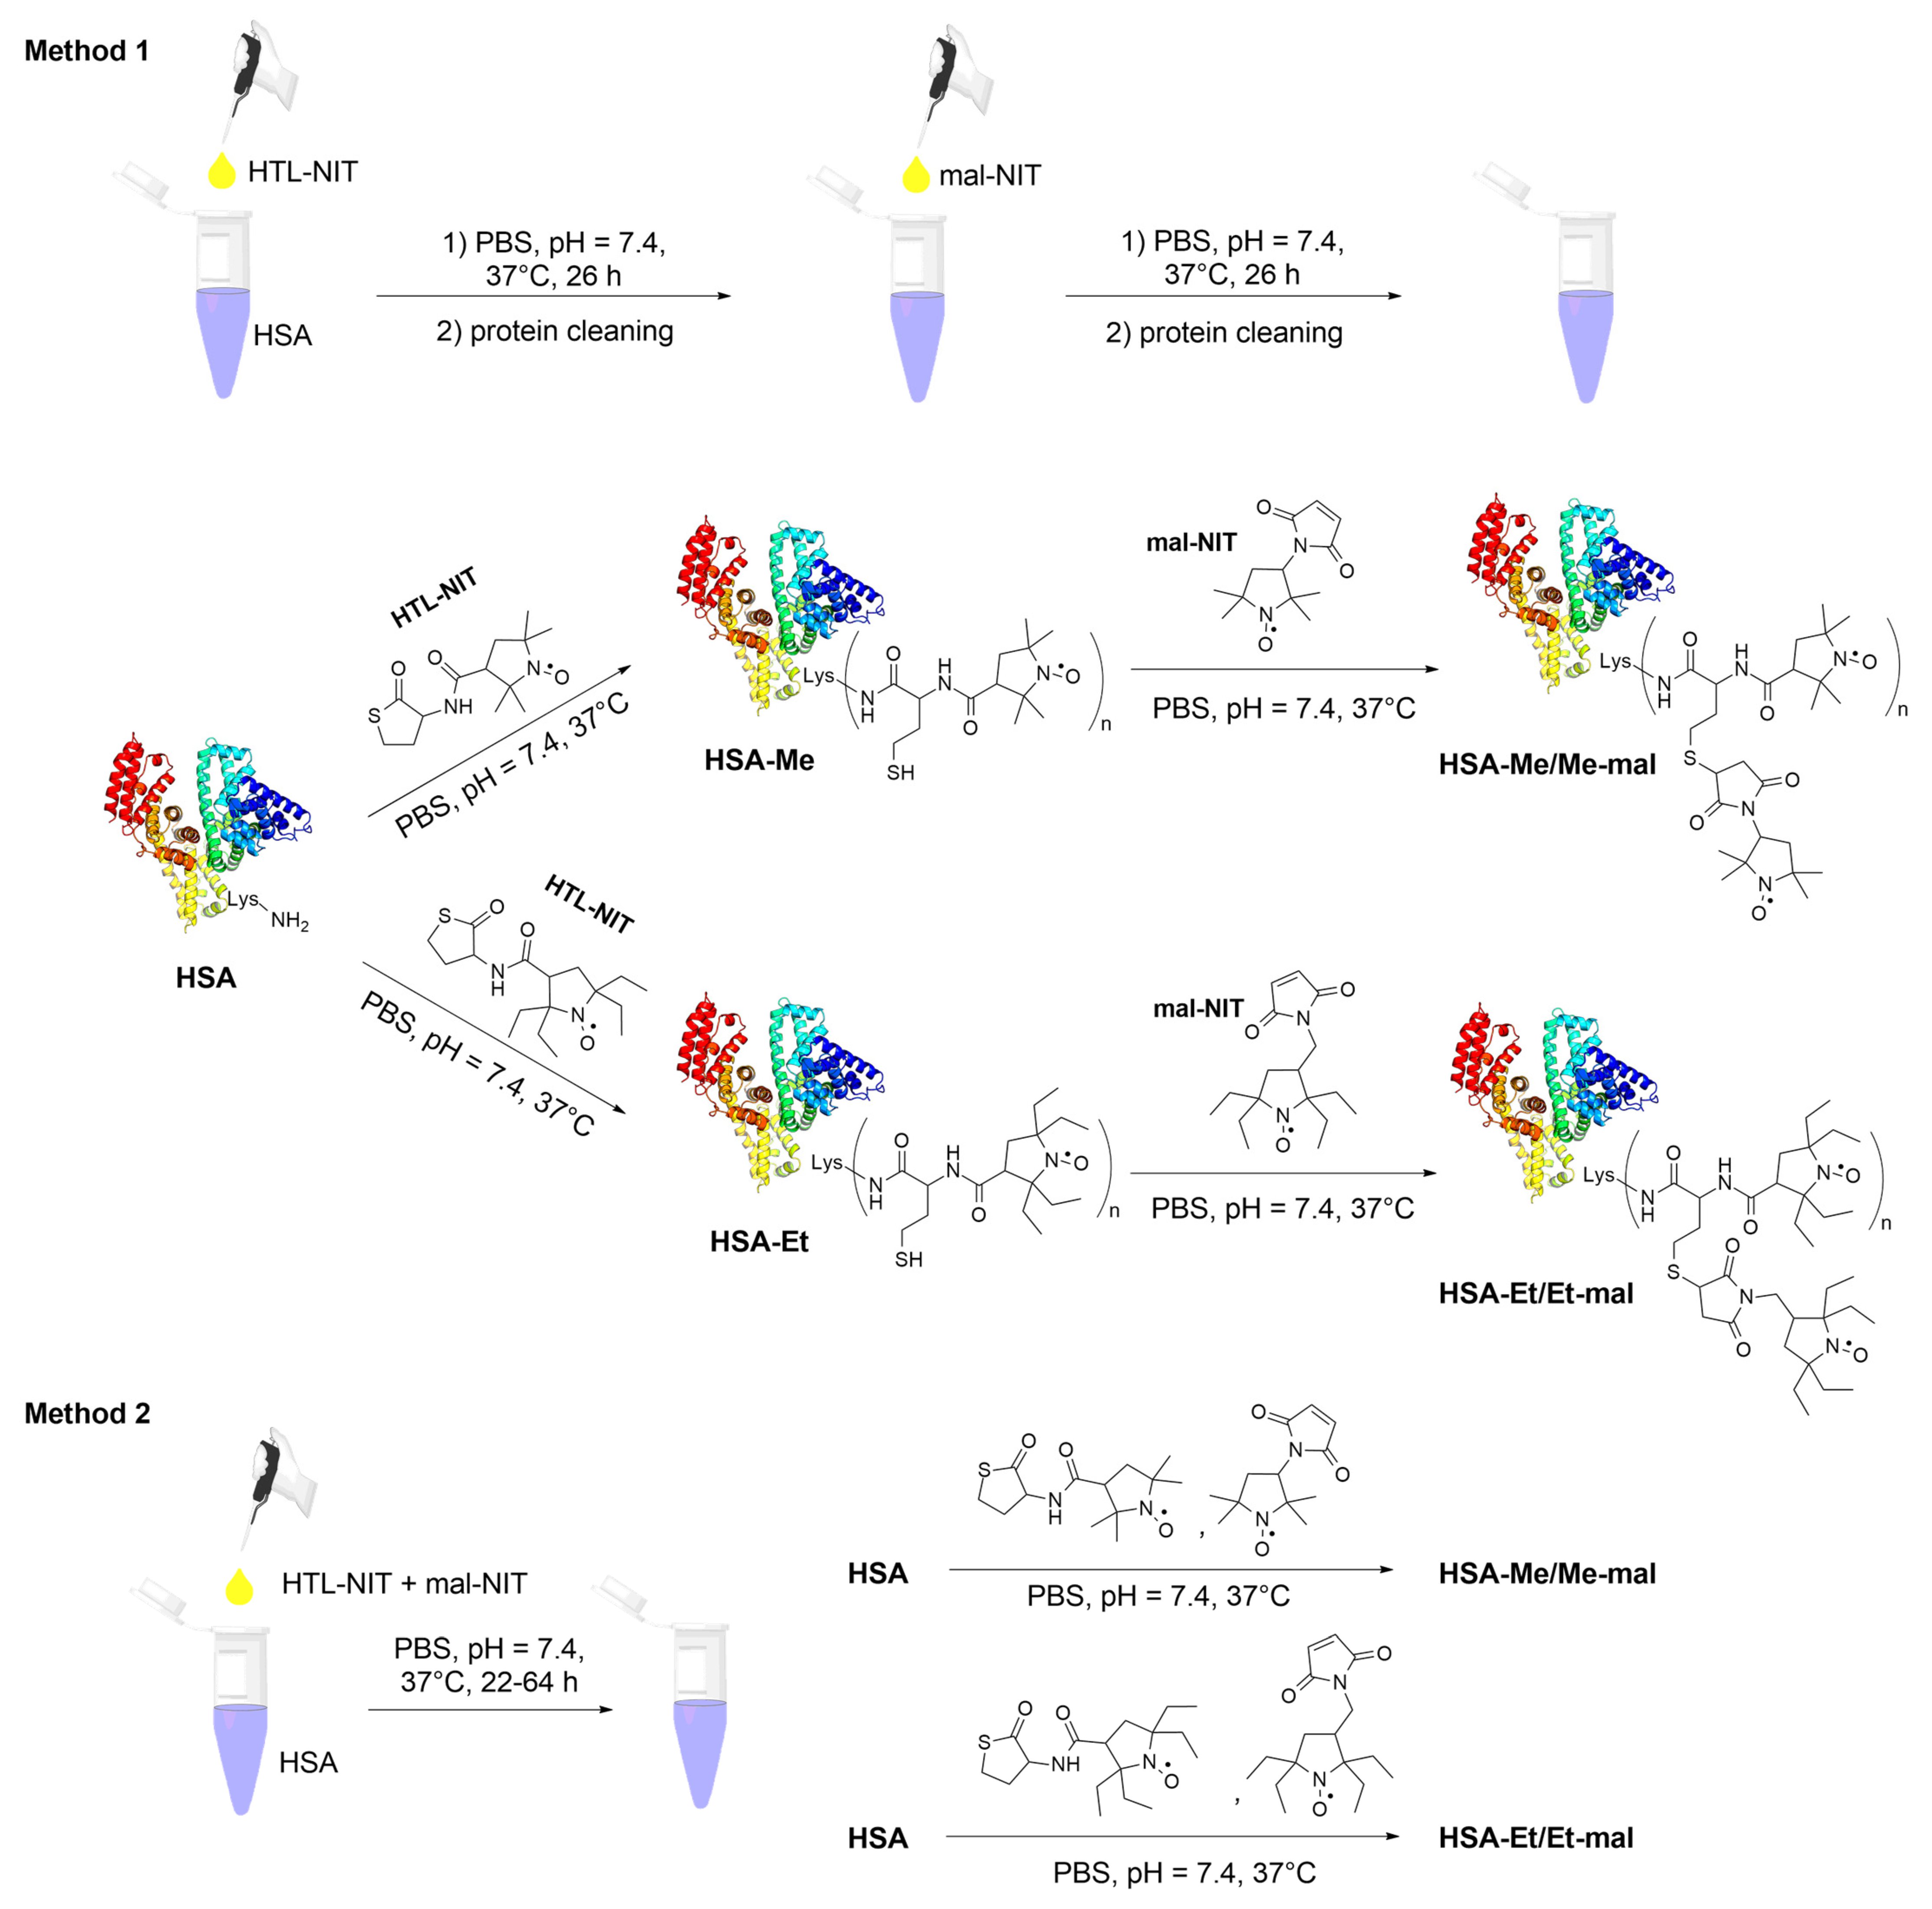
2.2. HSA-NIT Synthesis Method with Sequential and Simultaneous Addition of NIT Derivatives

Two different sets of tetramethyl- (Me) or tetraethyl (Et)-substituted nitroxides were attached to HTL or Mal (Figure 2) and different procedures for the preparation of spin-labeled HSA were compared. The first method we used for conjugate synthesis was albumin acylation by a 30-fold excess of HTL-NIT, with subsequent protein cleaning using Centricon concentrators and PBS as eluent (Figure 3, Method 1).
In the second stage, a 15-fold excess of Mal-NIT compounds was added to HSA-Me and HSA-Et solutions. At each stage, the synthesis was analyzed via gel electrophoresis (SDS-PAGE) and CW EPR. To the HSA-Me and HSA-Et, on average, 4.8 and 5.2 nitroxide residues were attached, respectively, which was calculated by CW EPR. For HSA-Me/Me-mal and HSA-Et/Et-mal conjugates, the average modification degrees are equal to 7.0 and 10.2, which are double those obtained in the HSA-NIT in our group [23].
The bulk structure of HSA can change during modification, which can lead to conformational changes, aggregation, and the formation of potentially toxic oligomers [86,87]. According to SDS-PAGE data (Figure 4), the protein oligomer content in HSA-Me and HSA-Et was 11–12%. New SH-groups introduced in HSA by the reaction with HTL-NIT were partly oxidized, resulting in HSA-S-S-HSA oligomers, as was shown by SDS-PAGE in the presence of the reduction agent dithiothreitol (DTT). Such oligomer formation may be an artifact of the use of DMSO, which is known as a mild oxidizing agent for SH groups [88,89]. Nevertheless, DMSO is a widely used biocompatible solvent; it can cause protein three-dimensional structure disruption, α-helical and β-sheet content changes, oligomerization, and high excess precipitation [23,90]. In this way, we have used as low a dose of DMSO as possible (5%) in the solution for nitroxides poorly soluble in water, which, however, did not stop albumin oligomerization (Figure 4). For HSA-Me/Me-mal and HSA-Et/Et-mal, the oligomers’ contents doubled with 17–20%.
To reduce the amount of oligomers, present in the synthesis of HSA-NIT, it was proposed to carry out the reactions via the simultaneous addition of HTL and maleimide NIT derivatives (Figure 3, Method 2). To compare Method 1 and 2, we used the same reaction conditions, such as 30- and 15-fold excesses of HTL-NIT and Mal-NIT, respectively. Under these conditions, no oligomers were found for HSA-NIT conjugates in Method 2 (Figure 4, lanes 4 and 6). However, fewer nitroxides were attached to albumin (Table S1, e.g., for HSA-Et/Et-mal, 10 and 8 for Methods 1 and 2, respectively). Further analysis shows that the simultaneous presence of two nitroxide derivatives in the tube leads to the precipitation of some compounds due to their low solubility in aqueous solution [91]. We tried to change protein concentration, reagent excess, and reaction time, which allowed us to increase the degree of modification to ~14 nitroxides (Table S1). We are faced with the insurmountable problem of the low solubility of nitroxides in water and the inability to increase the amount of DMSO due to the influence of a high DMSO concentration on the protein structure. An amount of DMSO of more than 15% leads to a decrease in α-helical content with full precipitation of the protein in 40% DMSO solution.
To solve the problem, we adapted Method 2 by adding NIT derivatives in small portions at equal time intervals (Method 3, Figure 5, Table S2). First of all, we mixed the aqueous solution of albumin with a small amount of DMSO, leading to a 7% DMSO solution. Then, the portion of HTL-NIT derivative was added to synthesize the initial amount of HSA-Me and HSA-Et with a free SH-group for further reaction with Mal-NIT. Although maleimides have high thiol specificity under high excess and/or basic pH, they can react with amino acid residues such as lysine, imidazole, and histidine [85,92,93]. To avoid a non-specific reaction, maleimide was added with a 3 h time delay (Figure 5). In the next stages, we added maleimide and HTL derivatives together. This partial, sparing addition of soluble NIT maintains a consistently high concentration in solution in relatively low excess. In such conditions, the first portions of nitroxide derivatives are not precipitated at all, which allows for significant savings in reagents. The yields of HSA-Me/Me-mal and HSA-Et/Et-mal were approximately 85% and 84%, respectively. The HSA-NIT modifications were proven by CW EPR (Figure S1) and MALDI-ToF MS (Figure S2), which showed 17 and 21 nitroxide residues for HSA-Me/Me-mal and HSA-Et/Et-mal, respectively. For comparison, we have synthesized HSA-Me and HSA-Et samples by protein acylation using HTL-NIT derivatives (Table S2). As the modification of HSA-NIT increased (e.g., cf. HSA-Me and HSA-Me/Me-mal), there was a change in the UV spectrum, leading to the disappearance of the distinct absorption maximum of HSA at 278 nm and the minimum at ~253 nm (Figure S3). This effect is caused by the presence of NIT absorption at 240–270 nm. For the comparison and investigation of properties, we have synthesized HSA-Me-mal and HSA-Et-mal samples (Table S2). HSA-Me-mal and HSA-Et-mal conjugates were synthesized by an albumin reaction with pure maleimide derivatives. Interestingly, the high modification degree of 16 and 22 nitroxides was observed for HSA-Me-mal and HSA-Et-mal, respectively, which affirmed the possibility of a non-specific reaction with the protein’s amino acids.

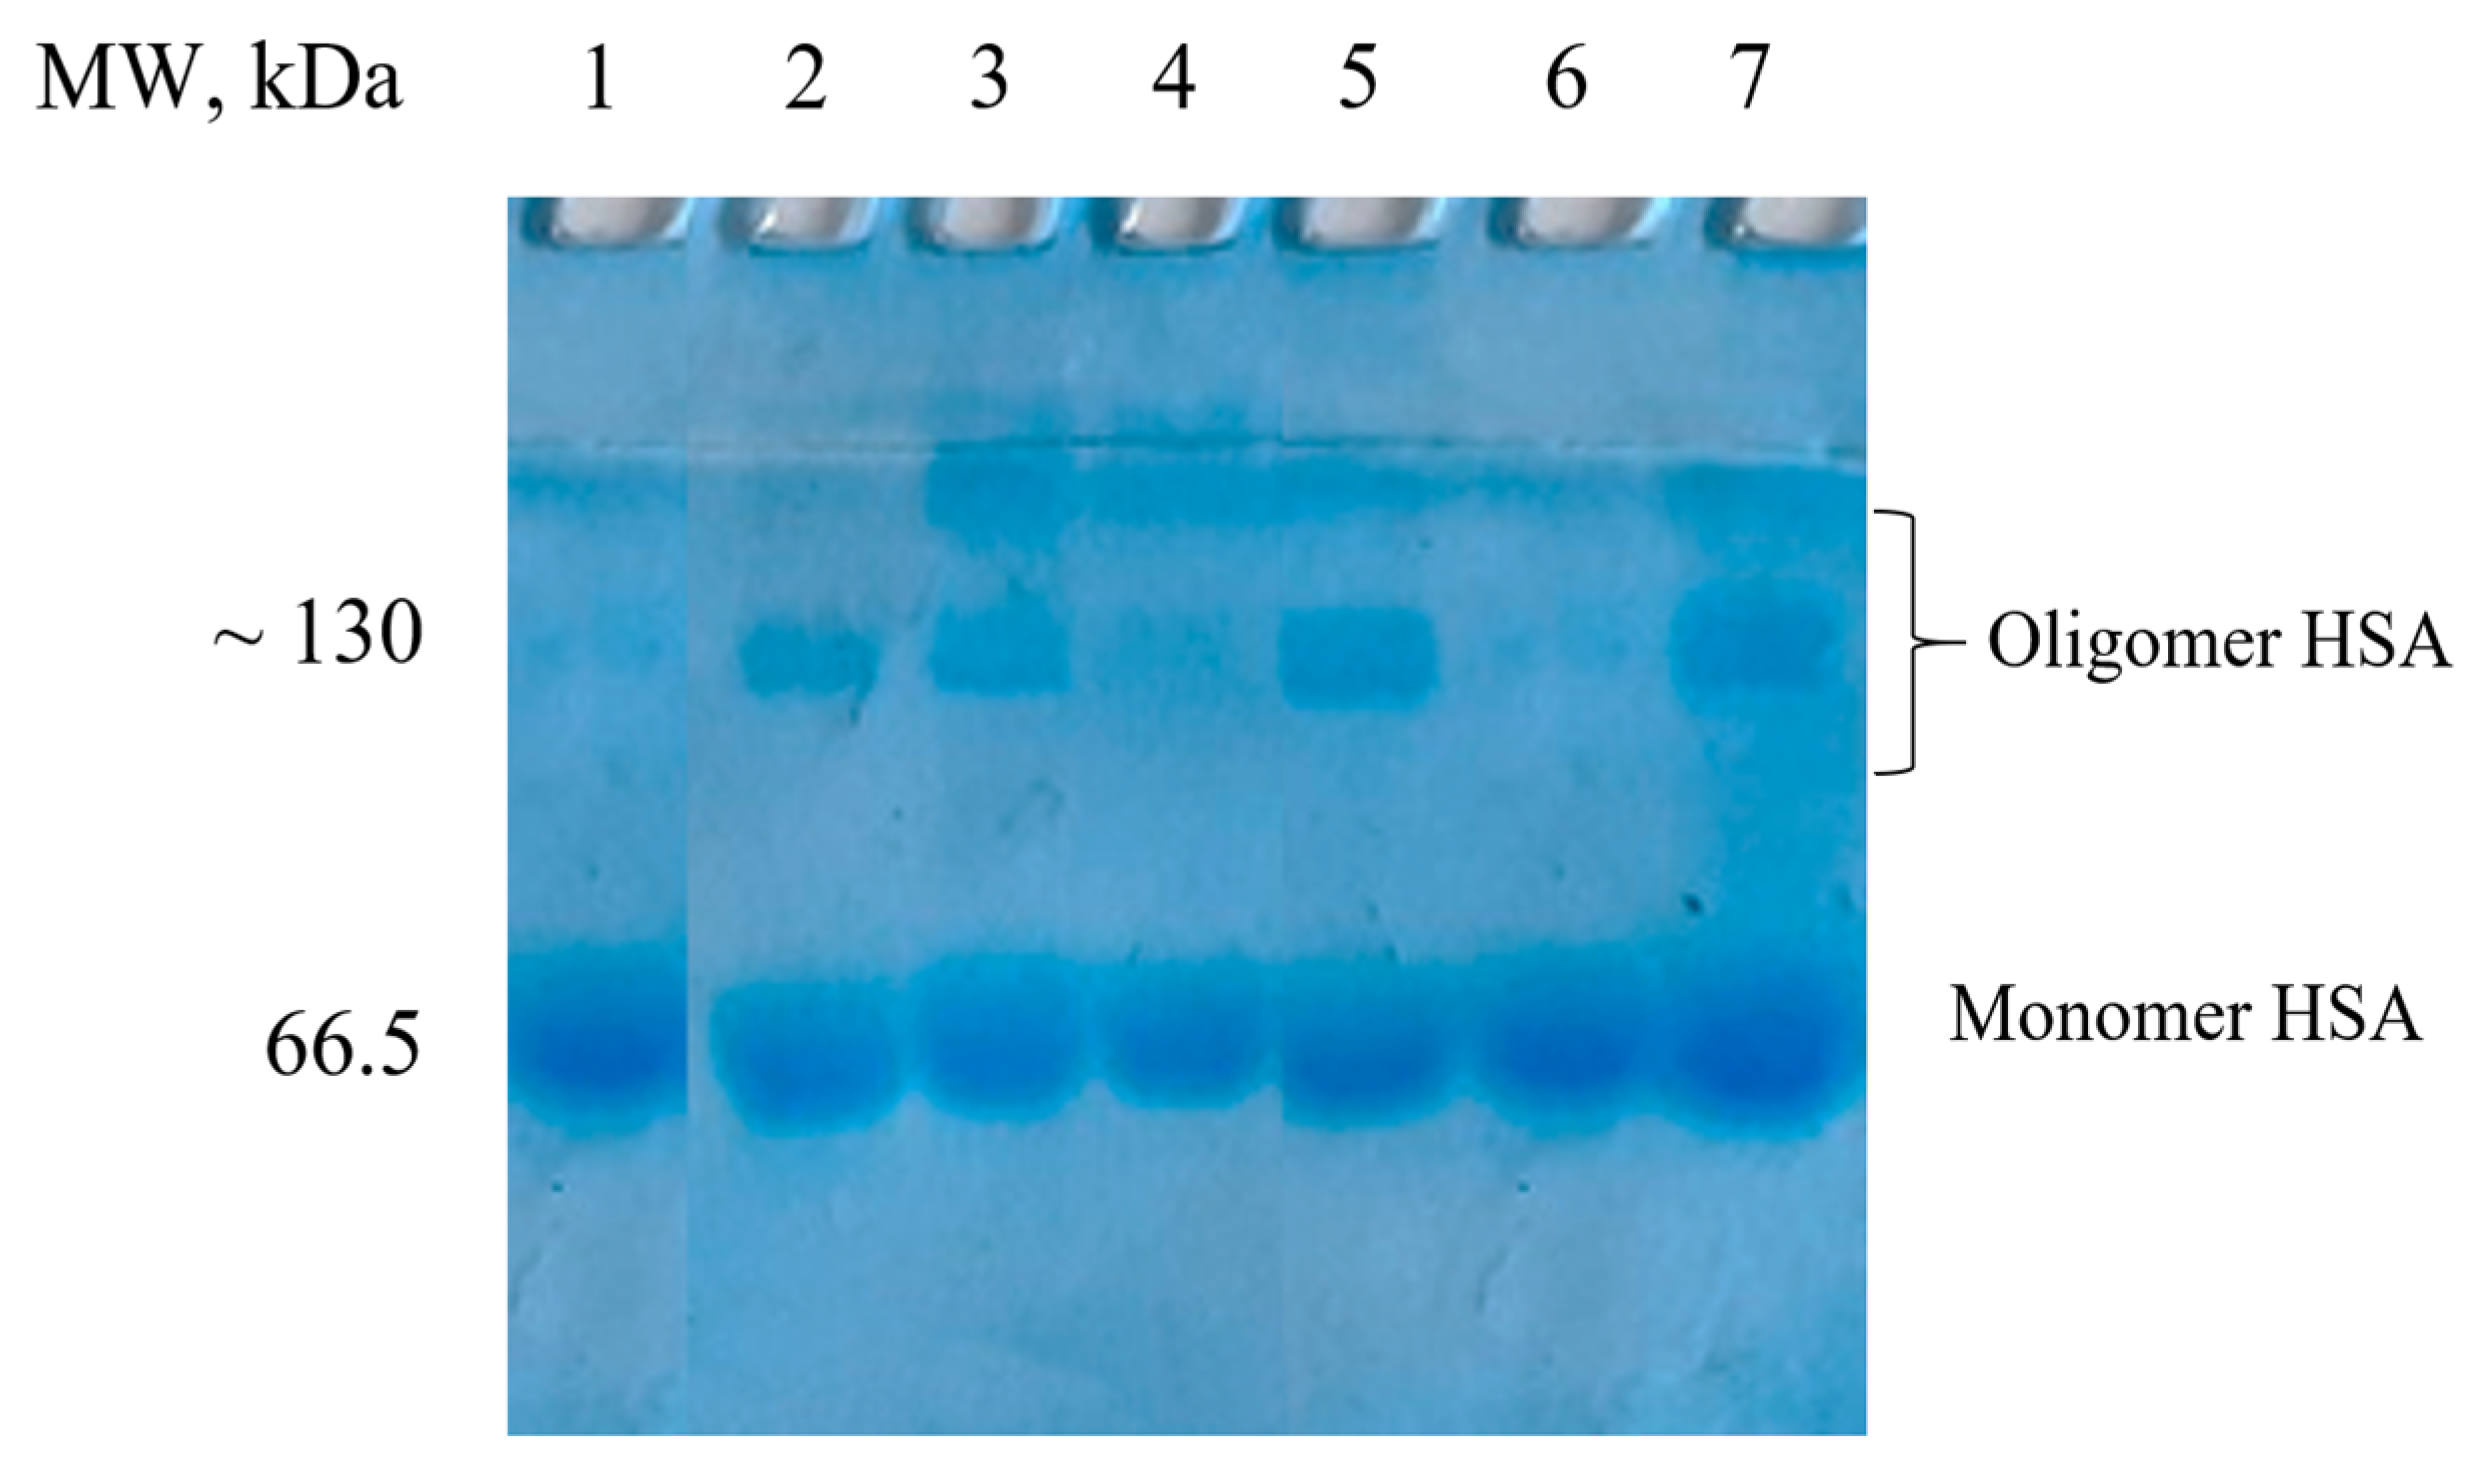
2.3. Characterization of HSA-NIT Conjugates Synthesized by Method 3 Using SDS-PAGE, MALDI-ToF, Circular Dichroism, and EPR

For the synthesis of conjugates by Method 3, we used not a monomer, but a full HSA fraction, with 4% of oligomers (see SDS-PAGE, Figure S4). For HSA-Me and HSA-Et samples, we observed a slight increase in oligomers from 4% to 9% (Figure S4). Conjugates HSA-Me/Me-mal and HSA-Et/Et-mal showed no significant changes from the starting HSA. For extra HSA-NIT characterization, native PAGE with SDS was performed (Figure S5). Native gel electrophoresis can easily provide information about changes in conformation and charge. HSA-NIT modification leads to bands broadening and increasing their electrophoretic mobility compared to native HSA. Moreover, the mobility of HSA-Me/Me-mal and HSA-Et/Et-mal bands is much higher than for HSA-Me and HSA-Et, which can be explained by a lower negative charge of the latter ones. Albumin modification by HTL-NIT enables the disappearance of the positive charge of the ɛ-amino group of lysine to a neutral charge, which leads to an increase in protein negative charge, leading to higher gel electrophoretic mobility.
All samples were analyzed for protein stability by SDS-PAGE for one year. We provide SDS-PAGE after the synthesis (Figure S4), after 3 months, and after 1 year of sample storage in PBS solution at 4 °C (Figure S6). HSA-NIT conjugates were stable for 3 months without any changes in band quality. After one year, some protein fragmentation was observed with ~55 and ~45 kDa bands formation (Figure S6b). The amount of protein fragments was ~5% for HSA-Me and -Et and 15–20% for other conjugates with high nitroxide modification (HSA-Me/Me-mal, HSA-Et/Et-mal, HSA-Me-mal, and HSA-Et-mal) (Figure S6b).
Changes in the three-dimensional structure of HSA-NIT were analyzed by circular dichroism (CD). From CD spectra, α-helices and β-sheets were calculated (Table 1) by the deconvolution of CD spectra using theoretical curves [94,95]. The α-helices decreased from 55% to 48–49% for slightly modified HSA-Me and -Et conjugates. For HSA-Et-mal and HSA-Et/Et-mal, a significant reduction in α-helices to ~43–44% with a slight increase in β-sheets by 3–4% was observed. Protein over-labeling usually leads to significant changes in conformation. In this way, the coupling of up to ~20 molecules without oligomer formation and only moderate secondary structure changes are good results of protein modification.
HSA-NIT conjugates were analyzed by CW EPR. The attachment of a nitroxide to albumin significantly increases its rotation correlation time, leading to line broadening (Figure S1) [23,59]. Using EasySpin software 5.2.35, experimental EPR spectra were separated into three components with different rotational correlation times (τc)—“slow”, “fast” and “free” (Table S3). For example, in the EPR spectrum of HSA-Me, broad (~71%) and narrow (~29%) components, with τc of 8.6 ns (“slow”) and 1.1 ns (“fast”), respectively, can be easily seen. A similar behavior was obtained for HSA-Me/Me-mal, HSA-Et, and HSA-Et/Et-mal, with τc of 7.3–8.6 ns and 0.5–0.9 ns. Most nitroxides have long τc and therefore “slow” behavior, which indicates localization in a non-polar environment inside pockets of the protein [95].

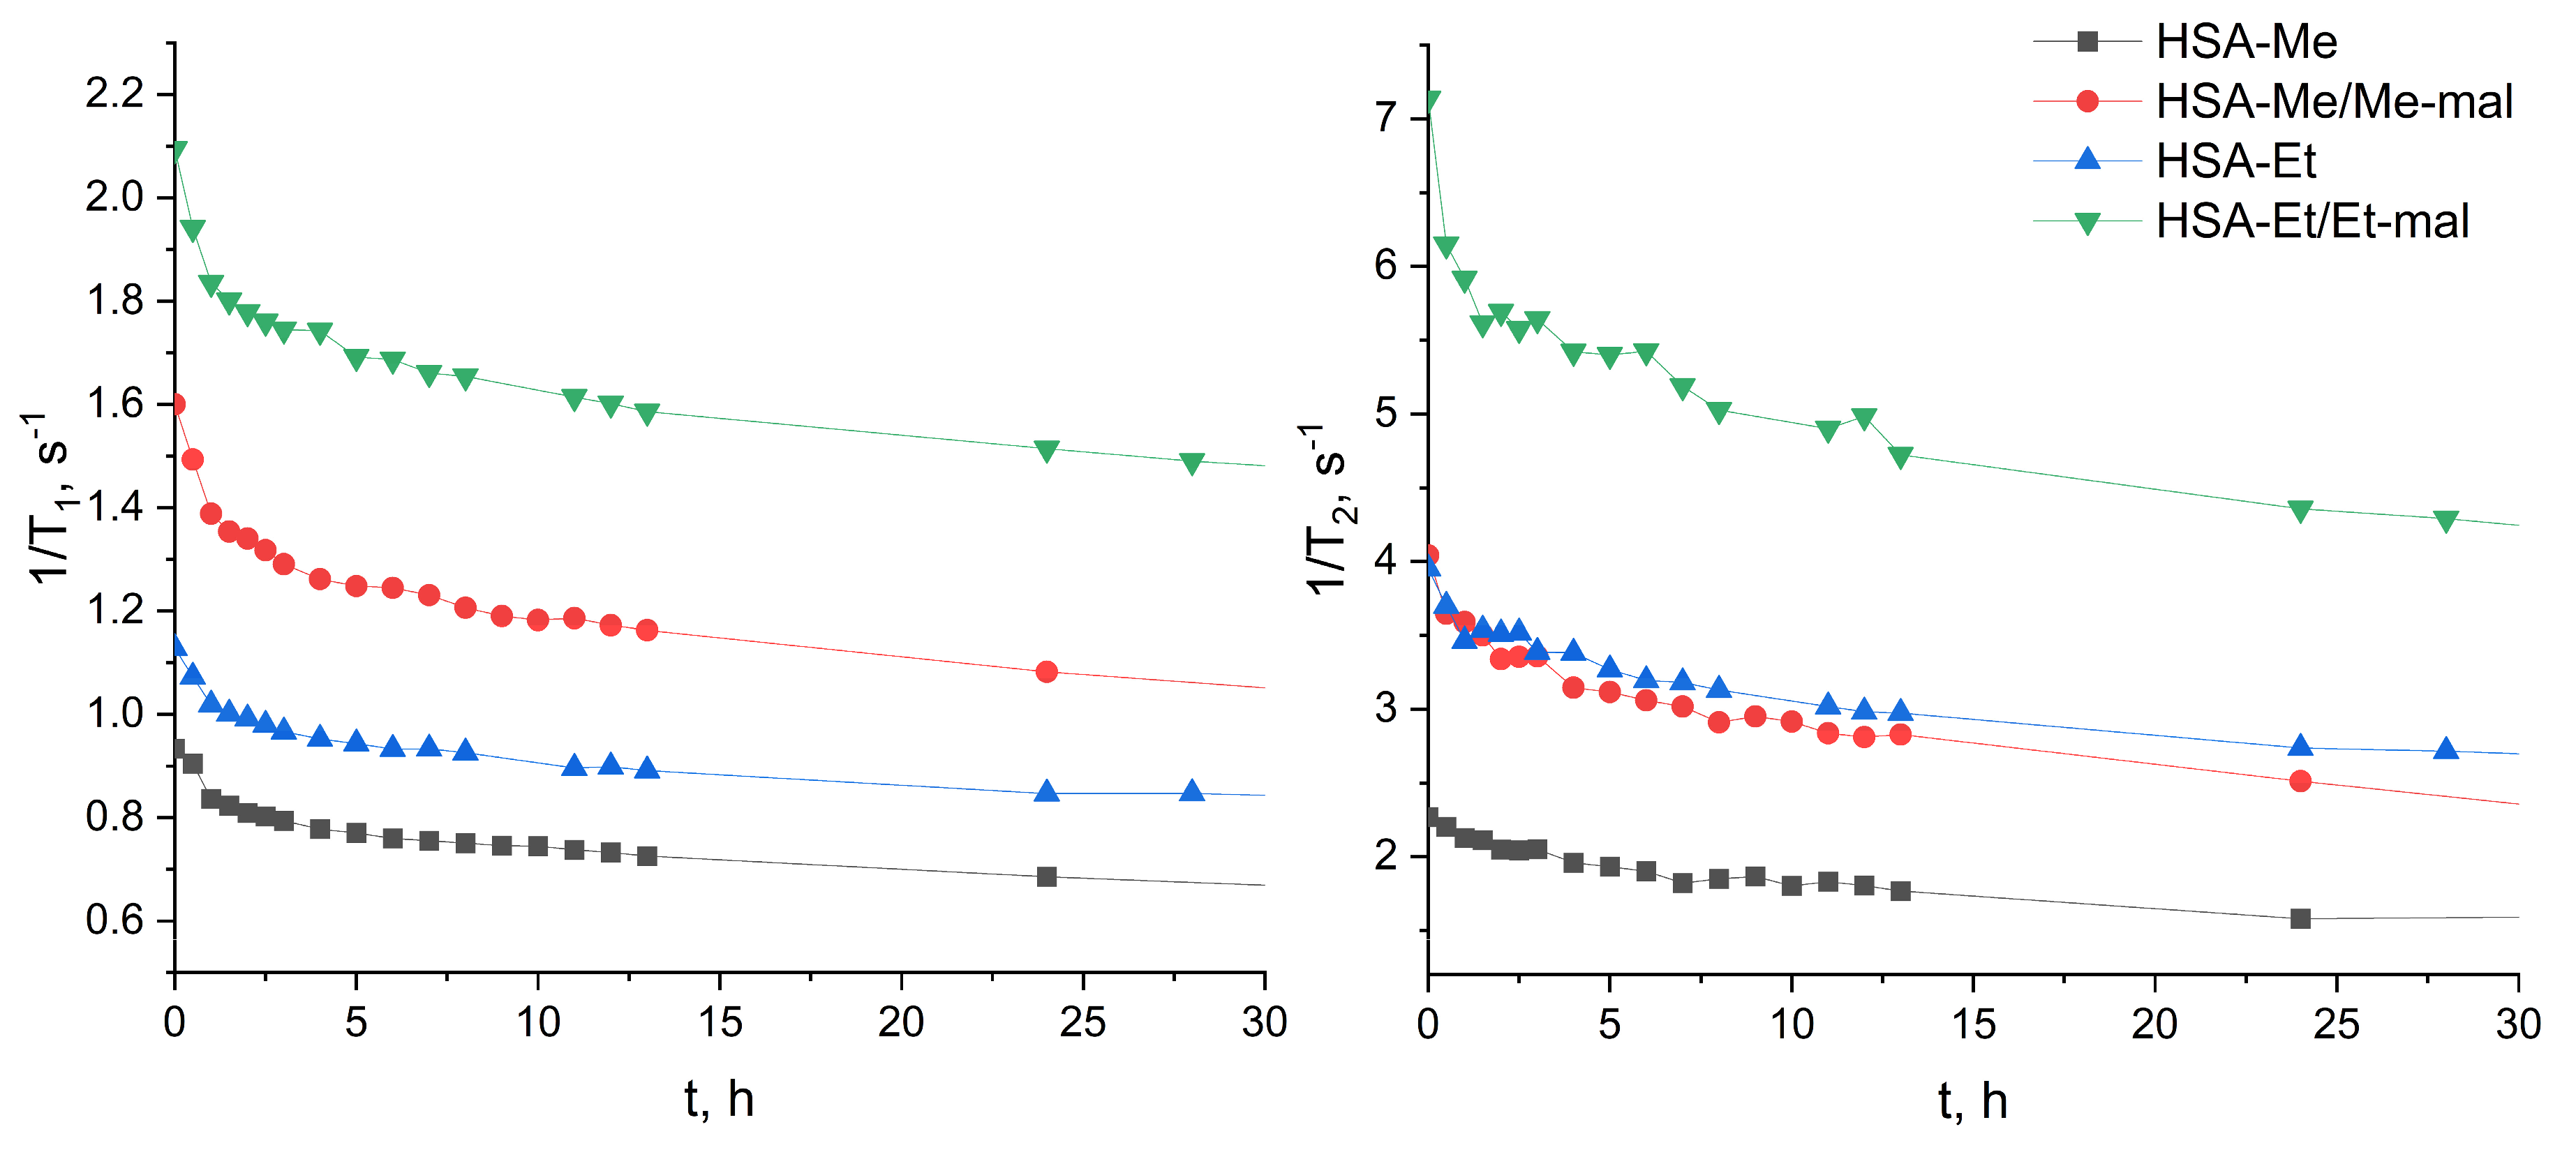
2.4. Reduction Constant Calculation of HSA-NIT

The bioreduction of nitroxides to diamagnetic compounds is a well-known problem encountered in radical-based MRI contrast agent design [23,26,38,96,97]. We evaluated the reduction constants of HSA-NIT conjugates using biogenic reducing agents, such as ascorbic acid and glutathione [23,98,99]. Reduction rates were measured under pseudo-first-order conditions using a high excess of reducing agents in PBS (pH 7.4). We obtained an effective constant, which was recalculated into second-order rate constants (Table 2). Two methods were used for experimental decay analysis, such as CW EPR and T1 relaxation time measurement [23]. We found that attachment to the albumin significantly decreases the reduction constant (cf. free radical and attached, Table 2), which is especially pronounced for Me radicals.
The protein environment alters the reduction constant for “slow” radicals, resulting in their protection from reducing agents. The reduction resistance of nitroxides in HSA-NIT is an essential feature for further MRI applications. The decrease in the reduction constant occurs due to an increase in the proportion of “slow” NIT with the greater modification of HSA-NIT. The lowest reduction rate constant, k = 0.0007 M−1s−1, was obtained by measuring T1 for HSA-Et/Et-mal, which is most deeply modified with nitroxides (~21 nitroxides per molecule). This value is 2.5 times lower than for a similar conjugate obtained previously (k = 0.0018 [23]) with only four nitroxides and an order of magnitude lower than dendrimers-based ORCAs (k = 0.0376 [26]). Thus, albumin-based conjugates with sterically hindered tetraethyl-substituted nitroxide derivatives can maintain the paramagnetic properties of NIT in vivo for a long time.

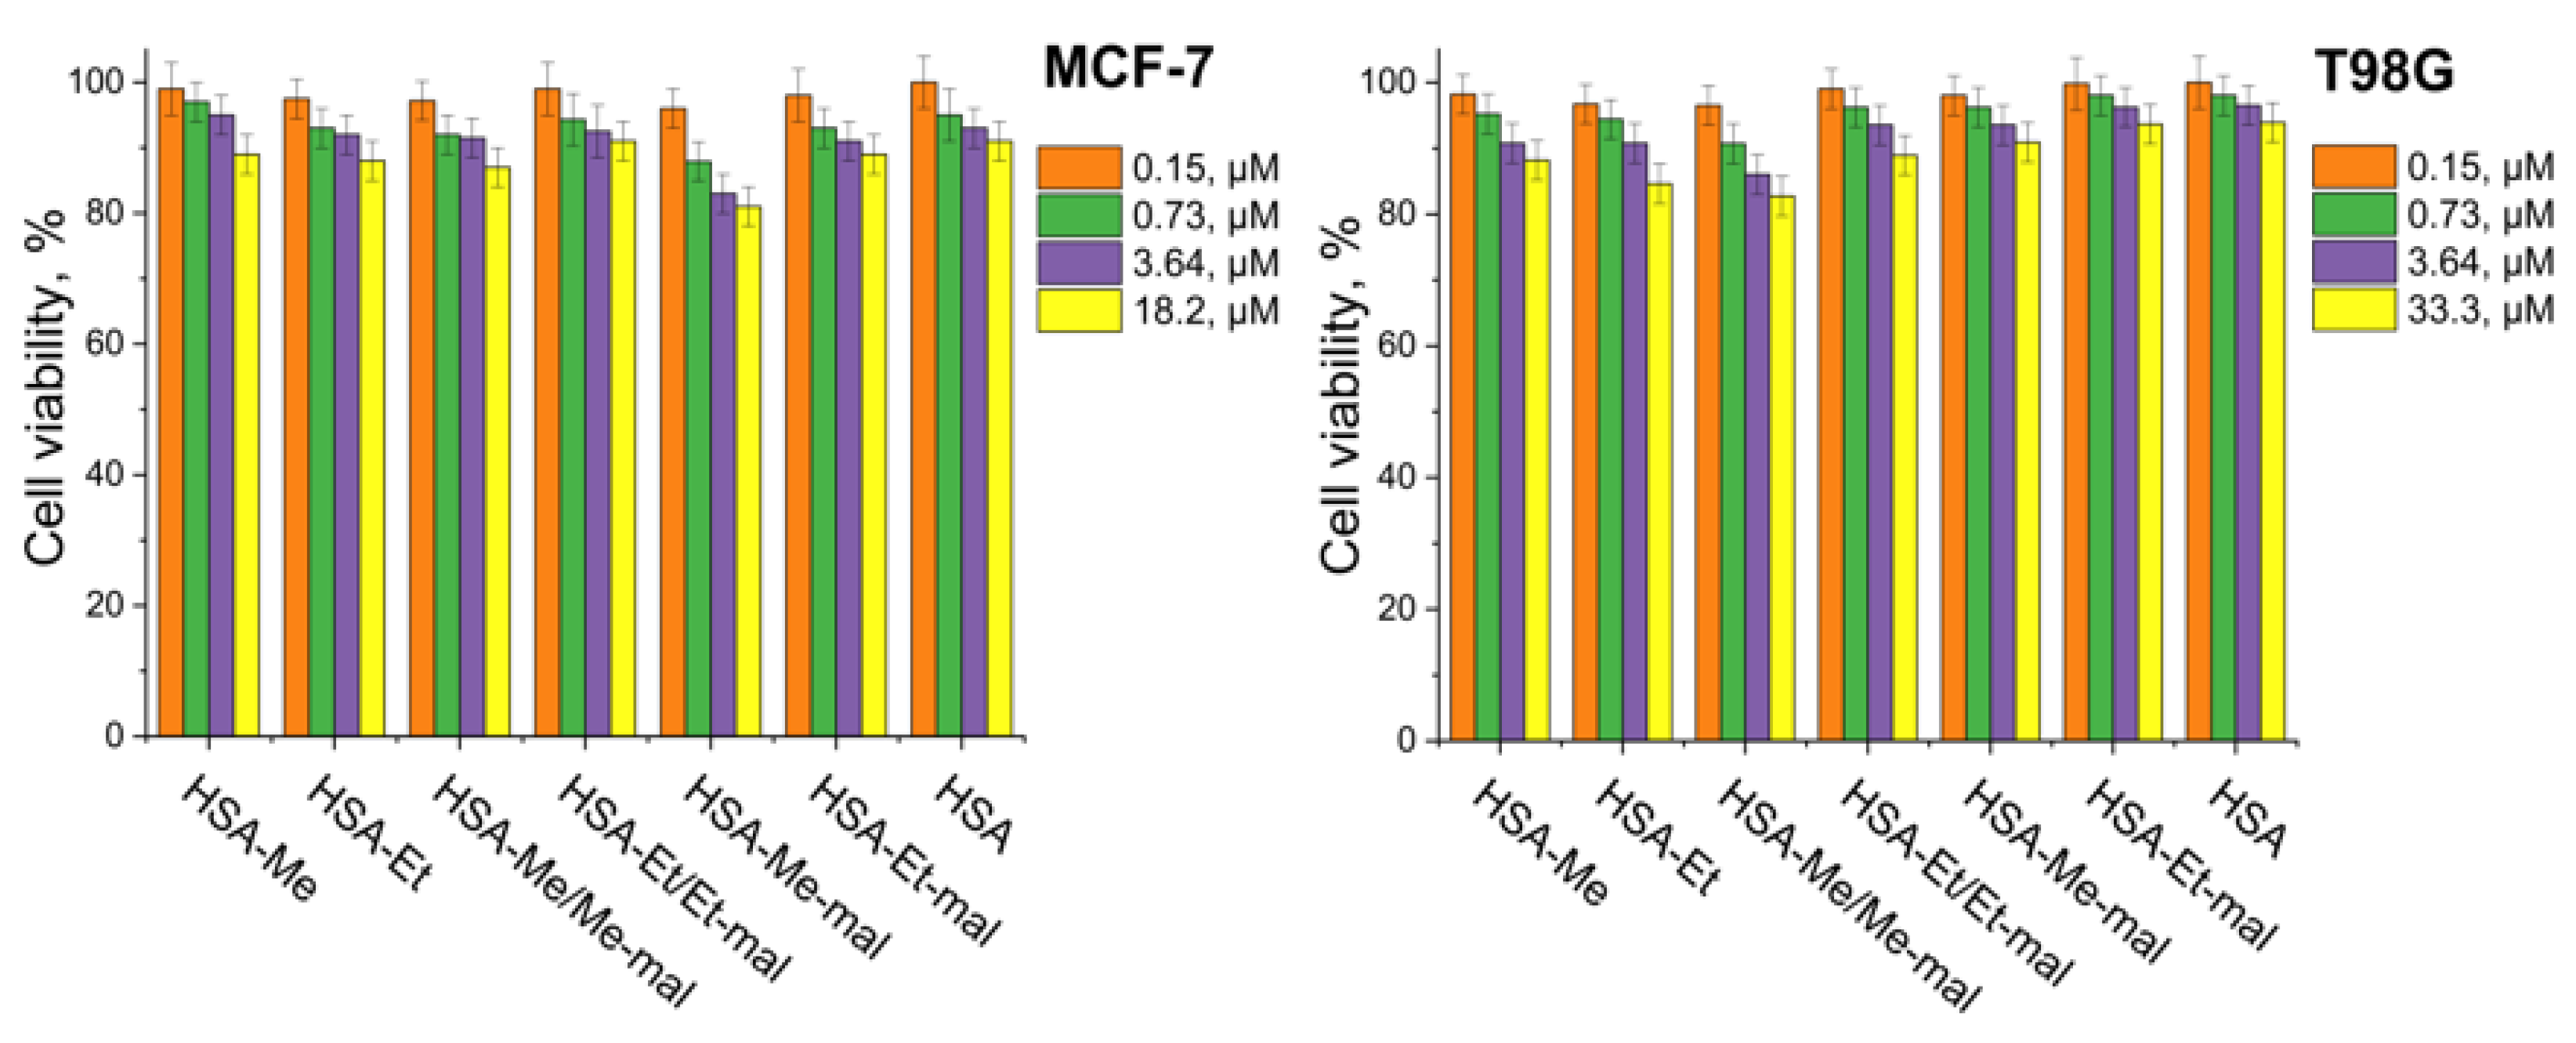
2.5. Cytotoxicity Assay

The colorimetric method using the 3-(4,5-dimethylthiazol-2-yl)-2,5-diphenyltetrazolium bromide (MTT) compound was provided to characterize cellular viability in the presence of HSA-NIT [75,102]. The MTT test was performed on breast cancer MCF-7 and human glioblastoma T98G cell cultures using the standard procedure. Increasing the concentration of conjugates in T98G and MCF-7 cell culture medium from 0.15 μM to 18.20 μM decreased viability for native HSA and HSA-NIT conjugates by similar values (Figure 6), which indicates their low cytotoxicity.

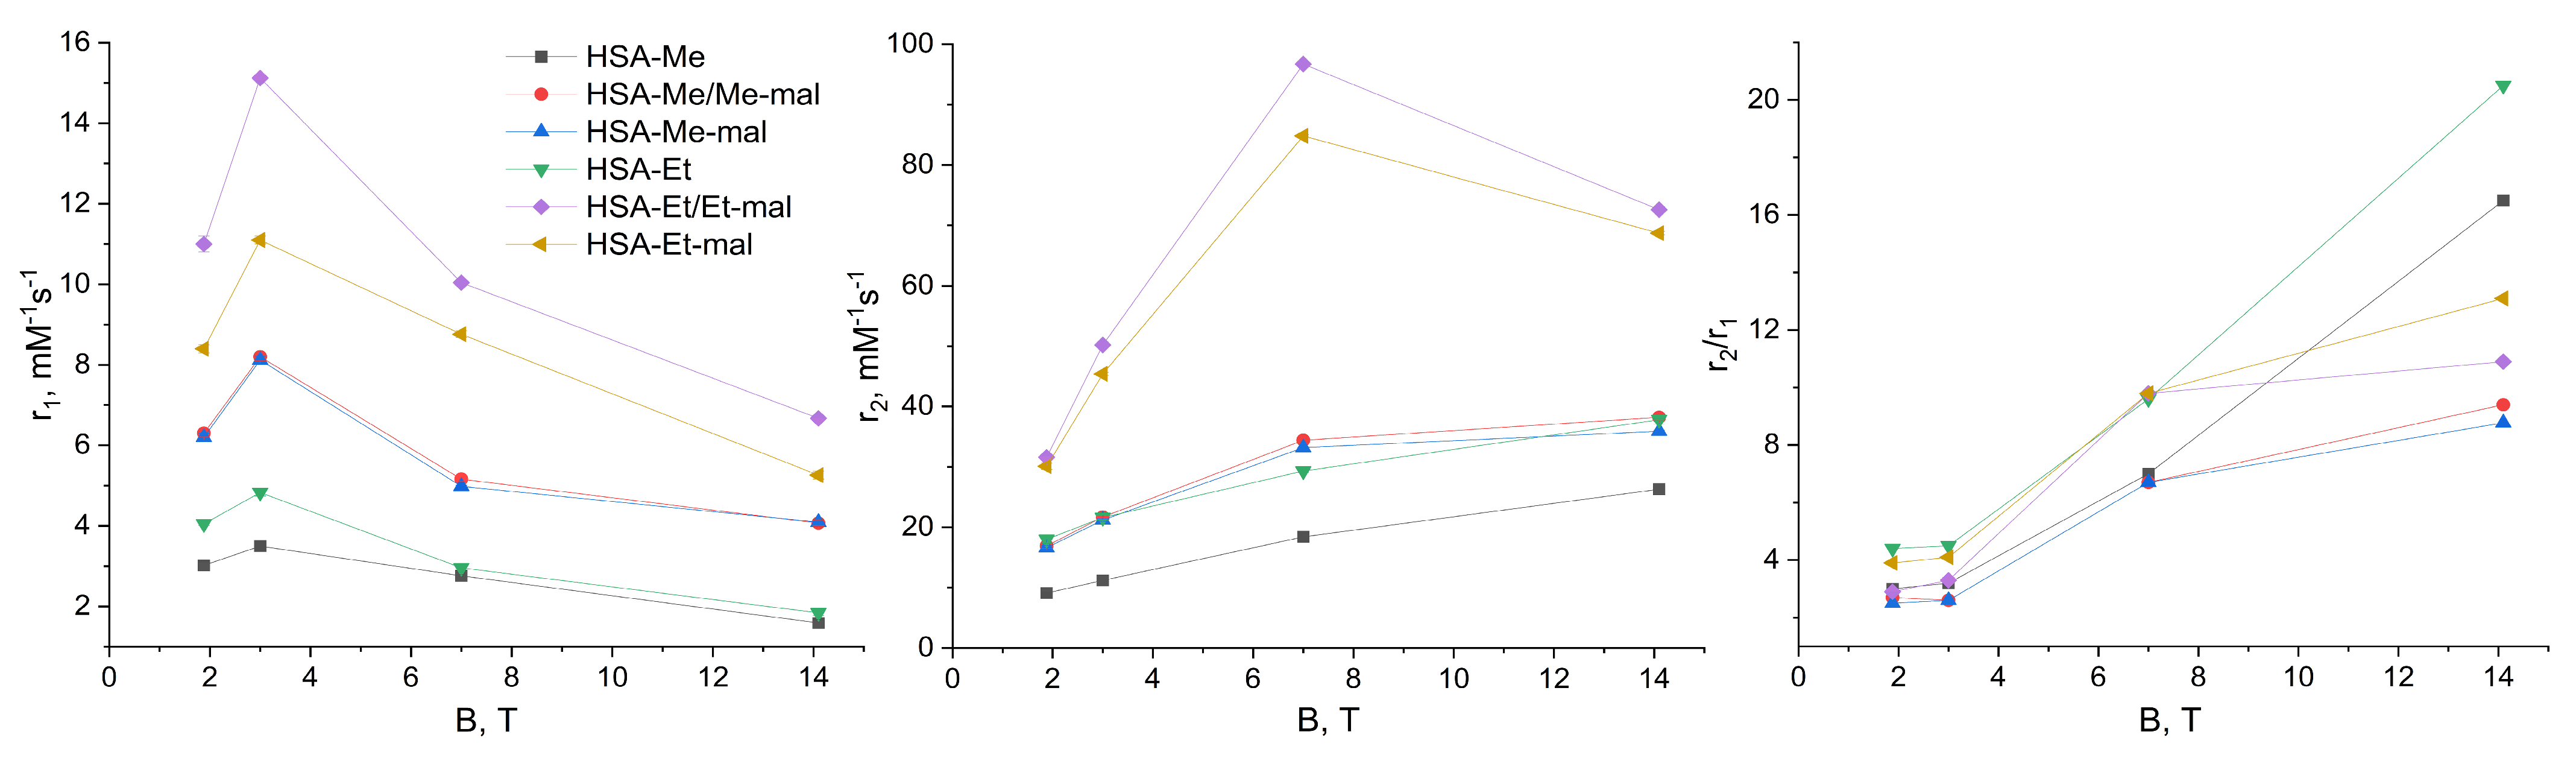
2.6. Relaxaxivities r1 and r2 of HSA-NIT

Relaxivities r1 and r2 highly influence the level of sensitivity in the registration of T1- and T2-weighted MRI. The higher relaxivity indicates a higher contrast of the image. One nitroxide has a low relaxivity due to the presence of only one unpaired electron. However, HSA-NIT has multiple nitroxides per albumin molecule (Table 1), which enhances the relaxivity level. Relaxivity calculation is a highly time-consuming procedure, which requires relaxation time measurement in relation to probe concentration. Furthermore, the essential studies of relaxivity dependence per magnetic field are rare and cannot be routinely performed for the design of new contrast agents in a laboratory with a single high-field NMR magnet [103]. Moreover, the relaxation mechanism is non-linearly dependent on the magnetic field strength, which results in nonlinear relaxivity curves per field and requires a high accuracy of experiments. In this work, we present the relaxivities r1 and r2 of the HSA-NIT conjugates in PBS measured at 25 °C on two NMR spectrometers (1.88 T and 7 T) and two MRI scanners (3 T and 14.1 T) (Figure 7, Tables S4 and S5). The relaxivity r1 of HSA-NIT increases from 1.88 T to 3 T with a further decrease per field increase (Figure 7, on the left). A similar behavior of r1 dependence per field was observed for Gd-based CAs [103,104]. Relaxivity r2 almost linearly increases from 1.88T to 7 T. The same r2 curve behavior was obtained for ferrous oxide [105] and gadolinium CAs [106]. The increase in the magnetic field to 14.1 T resulted in dramatic drops of r2. The explanation of this phenomenon requires additional experiments due to the lack of information about contrast agent studies on modern high-field MRI scanners. The HSA-Et/Et-mal conjugate showed the highest relaxivities r1 and r2 per molecule of probe (Figure 7). Moreover, HSA-Et/Et-mal showed the highest relaxivities per nitroxide residue among HSA-NIT conjugates (Table S5). The tetramethyl-substituted nitroxide conjugates showed a slightly lower relaxivity r1 per nitroxide and a 1.5-fold lower r2 than those of tetraethyl-substituted nitroxides (Table S5).
For commercial Gd-based CAs such as Magnevist, Prohance, Omniscan, Dotarem, etc., in human plasma at 37 °C and 0.47–3 T range, relaxivities r1 and r2 do not exceed 4–6 mM−1 s−1 [10]. HSA-Et/Et-mal exceed the relaxivities of the well-known T1-CA paramagnetic Gd3+ complex (Gadovist) by 2-fold and 14-fold, respectively (r1 = 4.7 mM−1s−1 and r2 = 6.8 mM−1s−1 at 1.5 T) [107]. For Gd CAs, the r2/r1 ratio is ~1 at 0.5–3 T [10]. In the body, water T2 is 5−15 times shorter than T1. In this way, Gd-based complexes are utilized in clinics only as CAs for T1-weighted images. For HSA-Et/Et-mal, the r2/r1 ratio is 2.9 and 3.3 at 1.88 T and 3 T, respectively (Table S4). It seems that at low field HSA-NIT, conjugates can be used as T1- and T2-weighted CAs for standard 1.5 T and 3 T MRI scanners. For HSA-NIT, the r2/r1 ratio significantly increases with magnetic field, indicating the dominance of T2 effects and perspectives for T2-weighted MRI phantom images at high field.

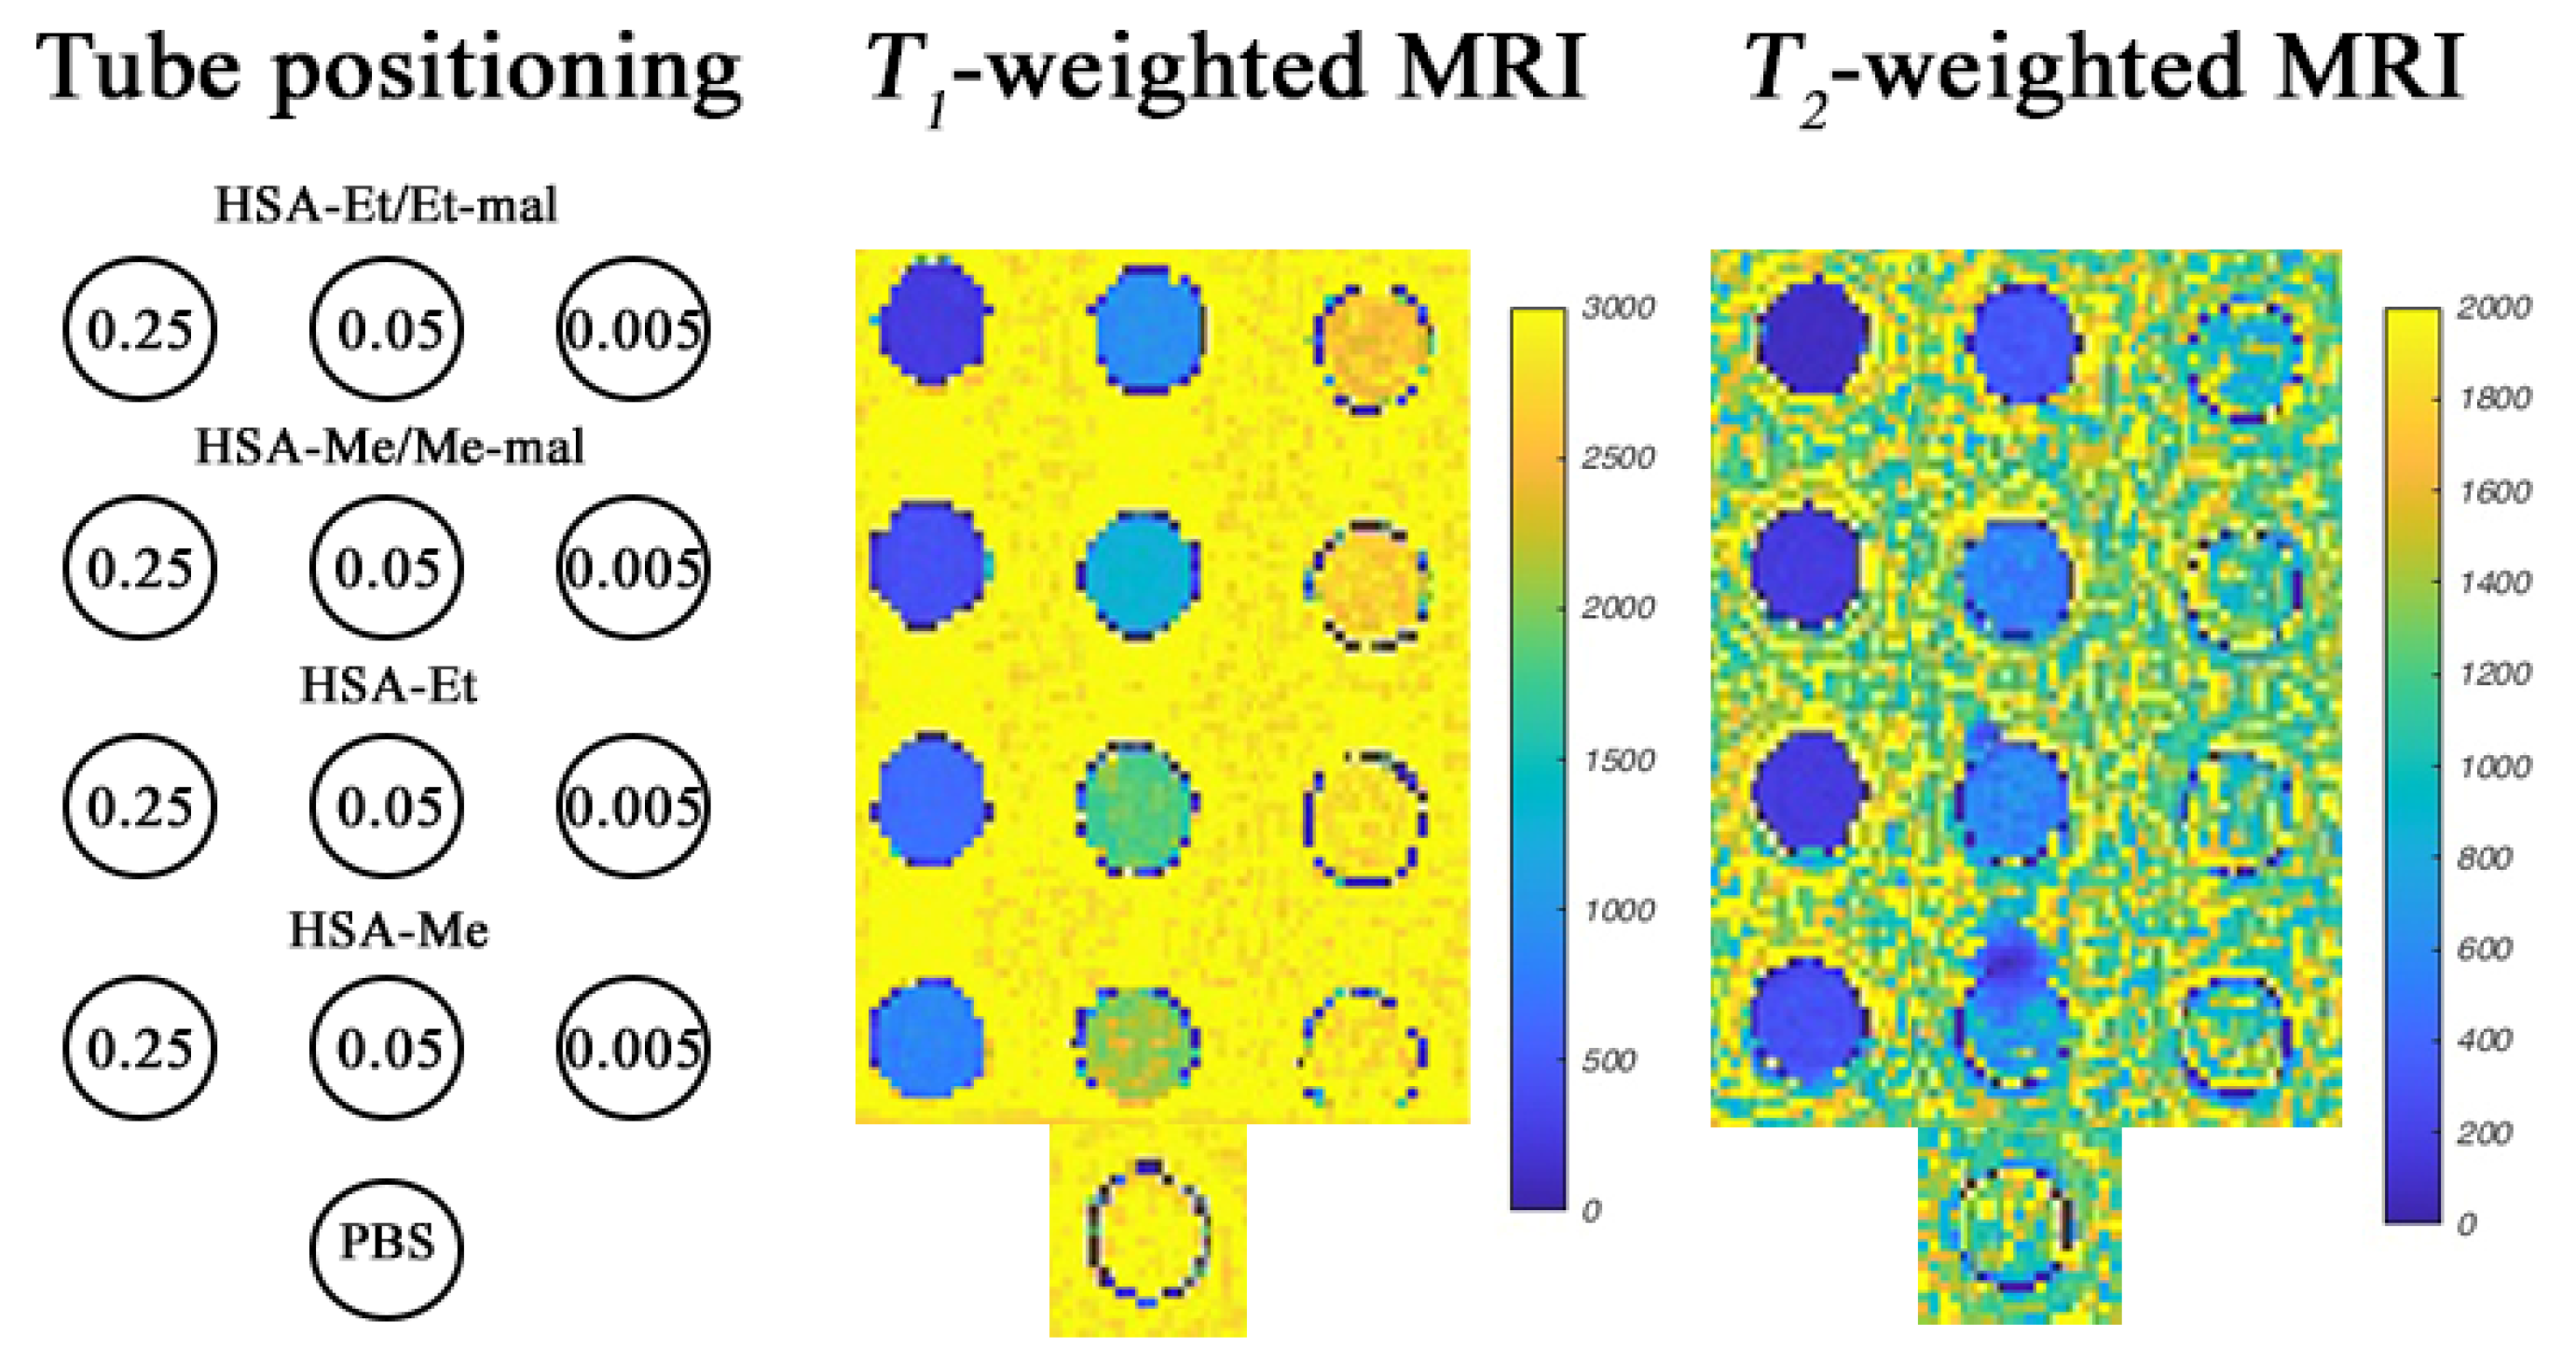
2.7. MRI Phantoms of HSA-NIT at 3 T and 14.1 T

To confirm the possibility of MRI signal registration, phantom images of conjugate solutions were obtained in vitro at protein concentrations from 0.5 mM to 0.005 mM and nitroxide concentration from 0.5 to 0.05 mM in PBS at 3 T in a clinical Siemens 3 T whole body system (Figure 8 and Figure S9).
This method of studying the properties of CAs is widely used due to the ability to perform image registration without the use of living tissues [108]. The presence of contrast efficiency in HSA-NIT for T1- and T2-weighted MRI images was determined by comparison with the control PBS solution (Figure 8 at the bottom). As shown in Figure 8 and Figure S9, all HSA-NIT conjugates exhibit dose-dependent signal enhancements, resulting in brighter images as the CA concentrations increase.
The r2/r1 of 2.6–4.5 obtained at 3 T suggests that HSA-NIT can be used as T1- and T2-CA. The best sensitivity in the registration of phantom images was found for the HSA-Et/Et-Mal sample, which has the highest relaxivity among all conjugates. However, HSA-Me/Me-mal and HSA-Et/Et-mal conjugates were shown to have comparable contrast efficiencies in registering T1- and T2-weighted MRI images. MRI phantoms at 14.1 T were measured using a Magnex (Oxford) ultra-high-field MRI system at 25 °C. Good contrast was obtained for T1-weighted MRI (Figure S10). The best results were provided by HSA-Me/Me-mal and HSA-Et/Et-mal conjugates. T2-weighted images showed a similarly good contrast for all HSA-NIT.
The MRI phantoms of HSA-NITs provide the possibility of excellent contrast because the conjugates showed good relaxivity, and indicate scope for substantial performance increases for this novel class of ORCAs. The high solubility, stability, and biocompatibility of HSA-NIT also demonstrate the advantages of these ORCAs. Furthermore, such properties of albumin as accumulation in tumors via the Enhanced Permeability and Retention effect and receptor interaction, low immunogenicity, and long lifetime in the bloodstream make HSA-NIT promising for cancer MRI.

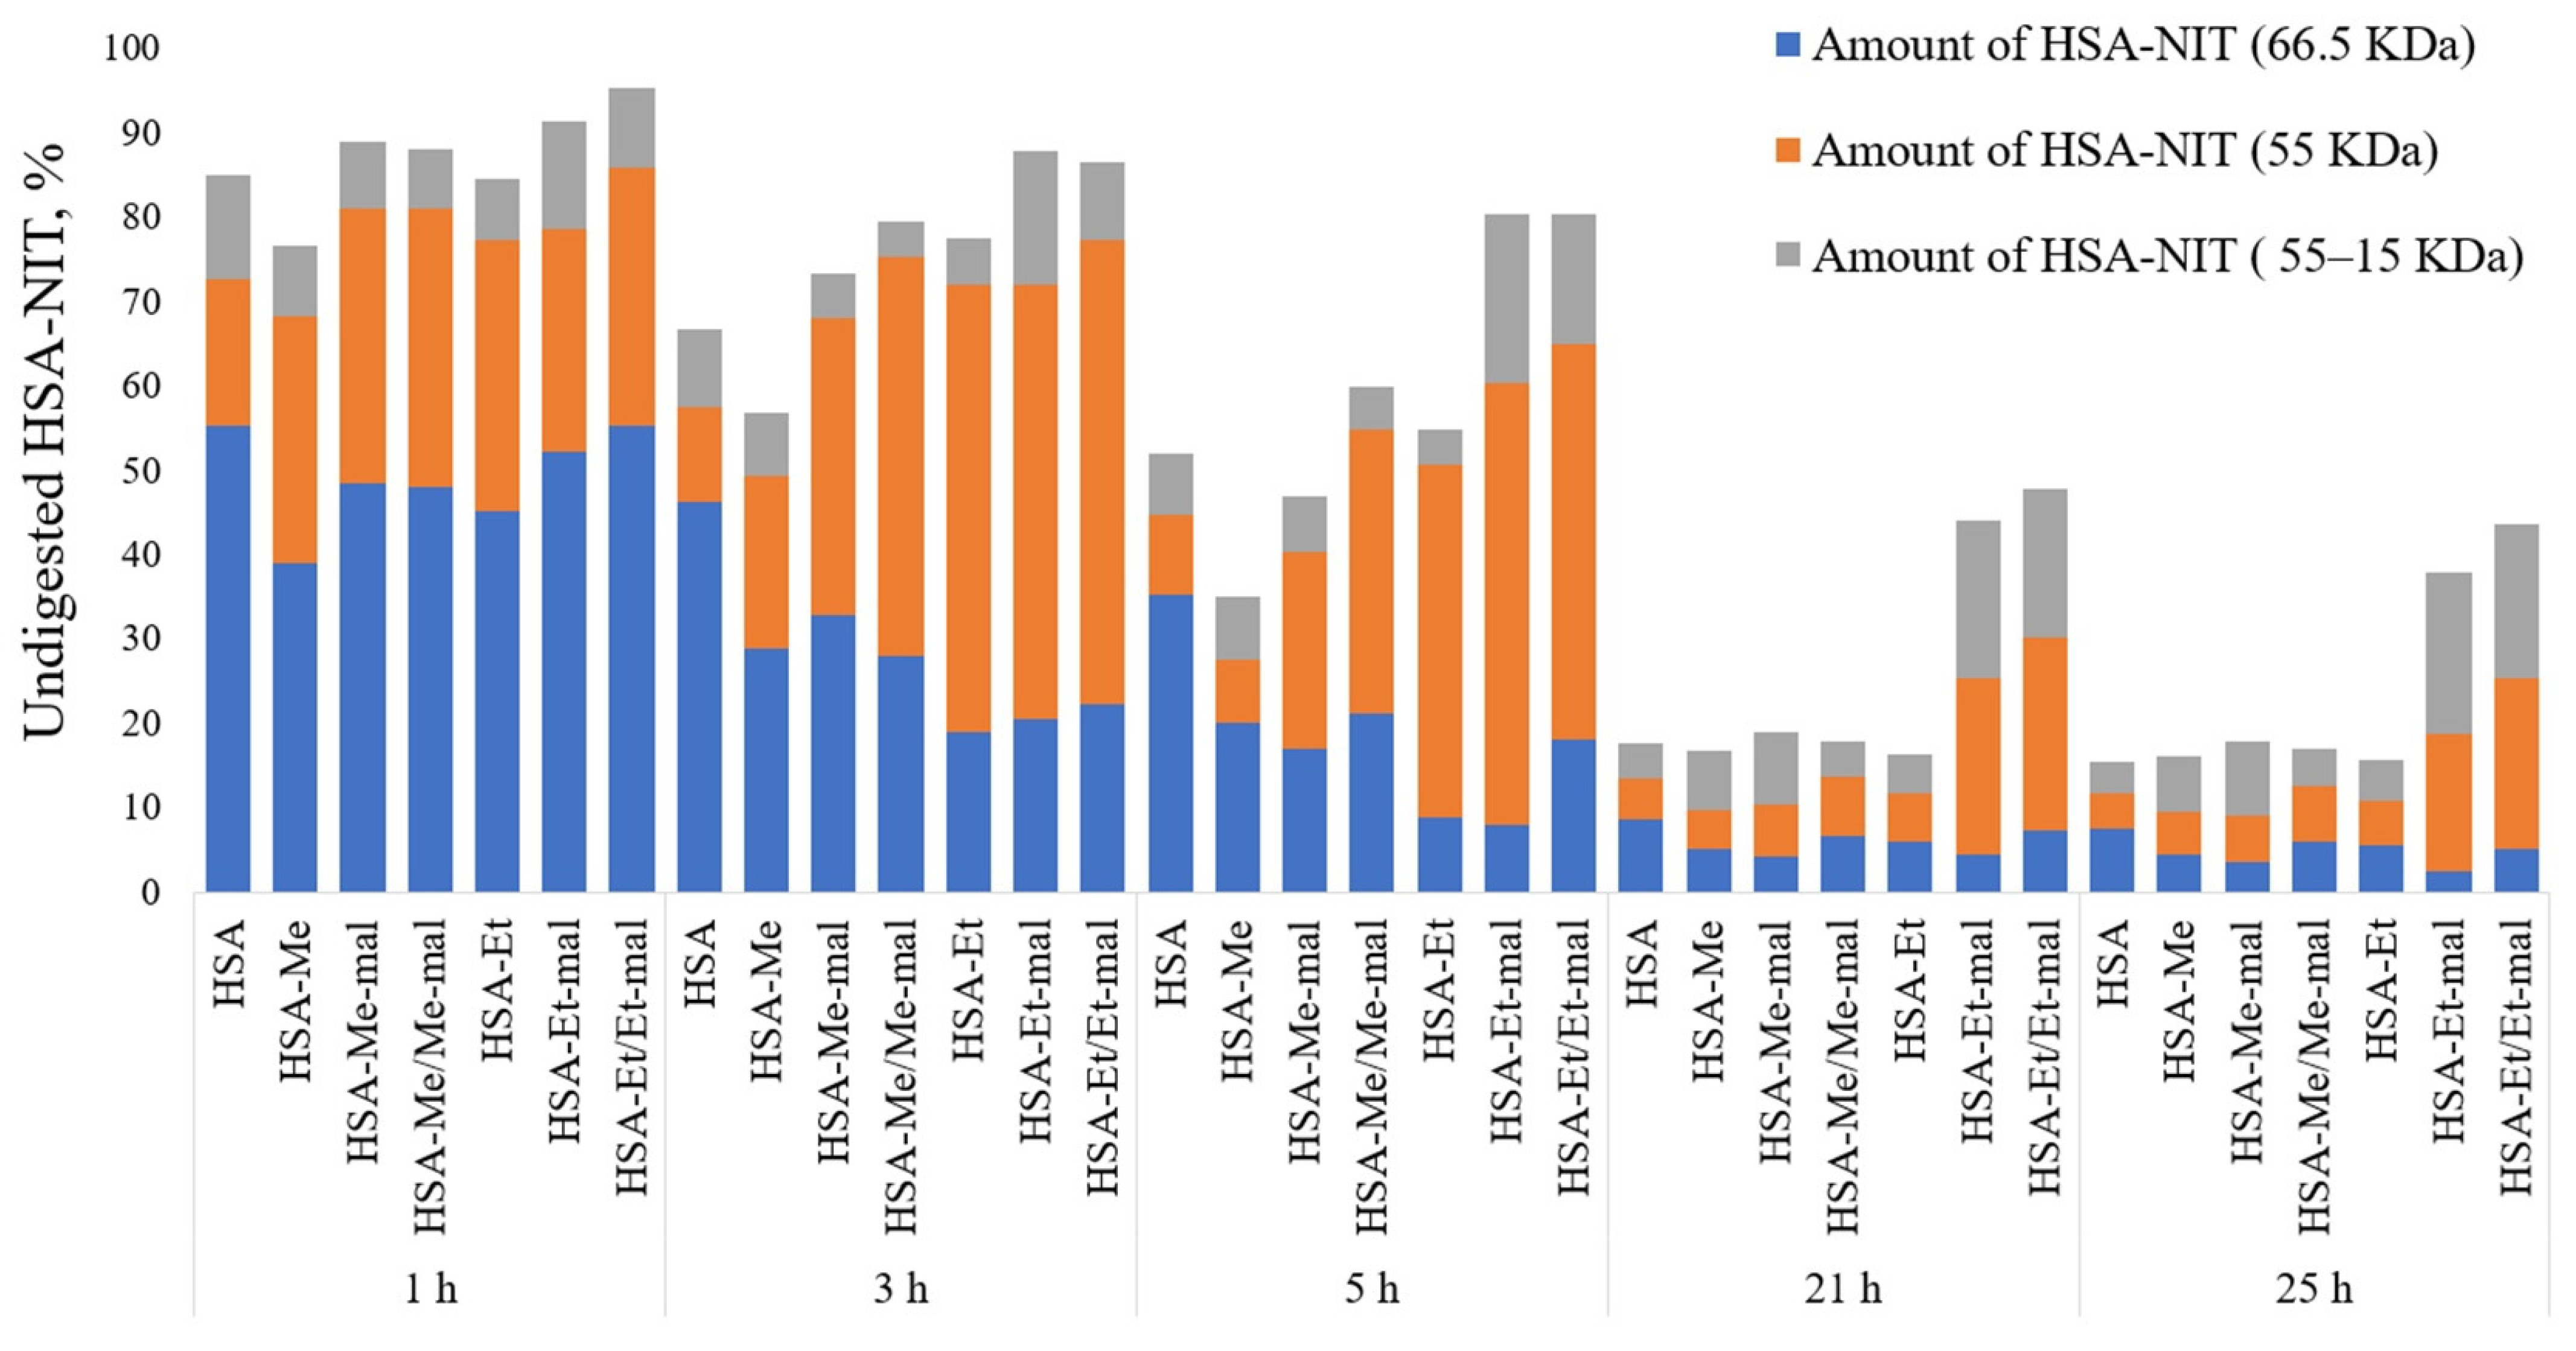
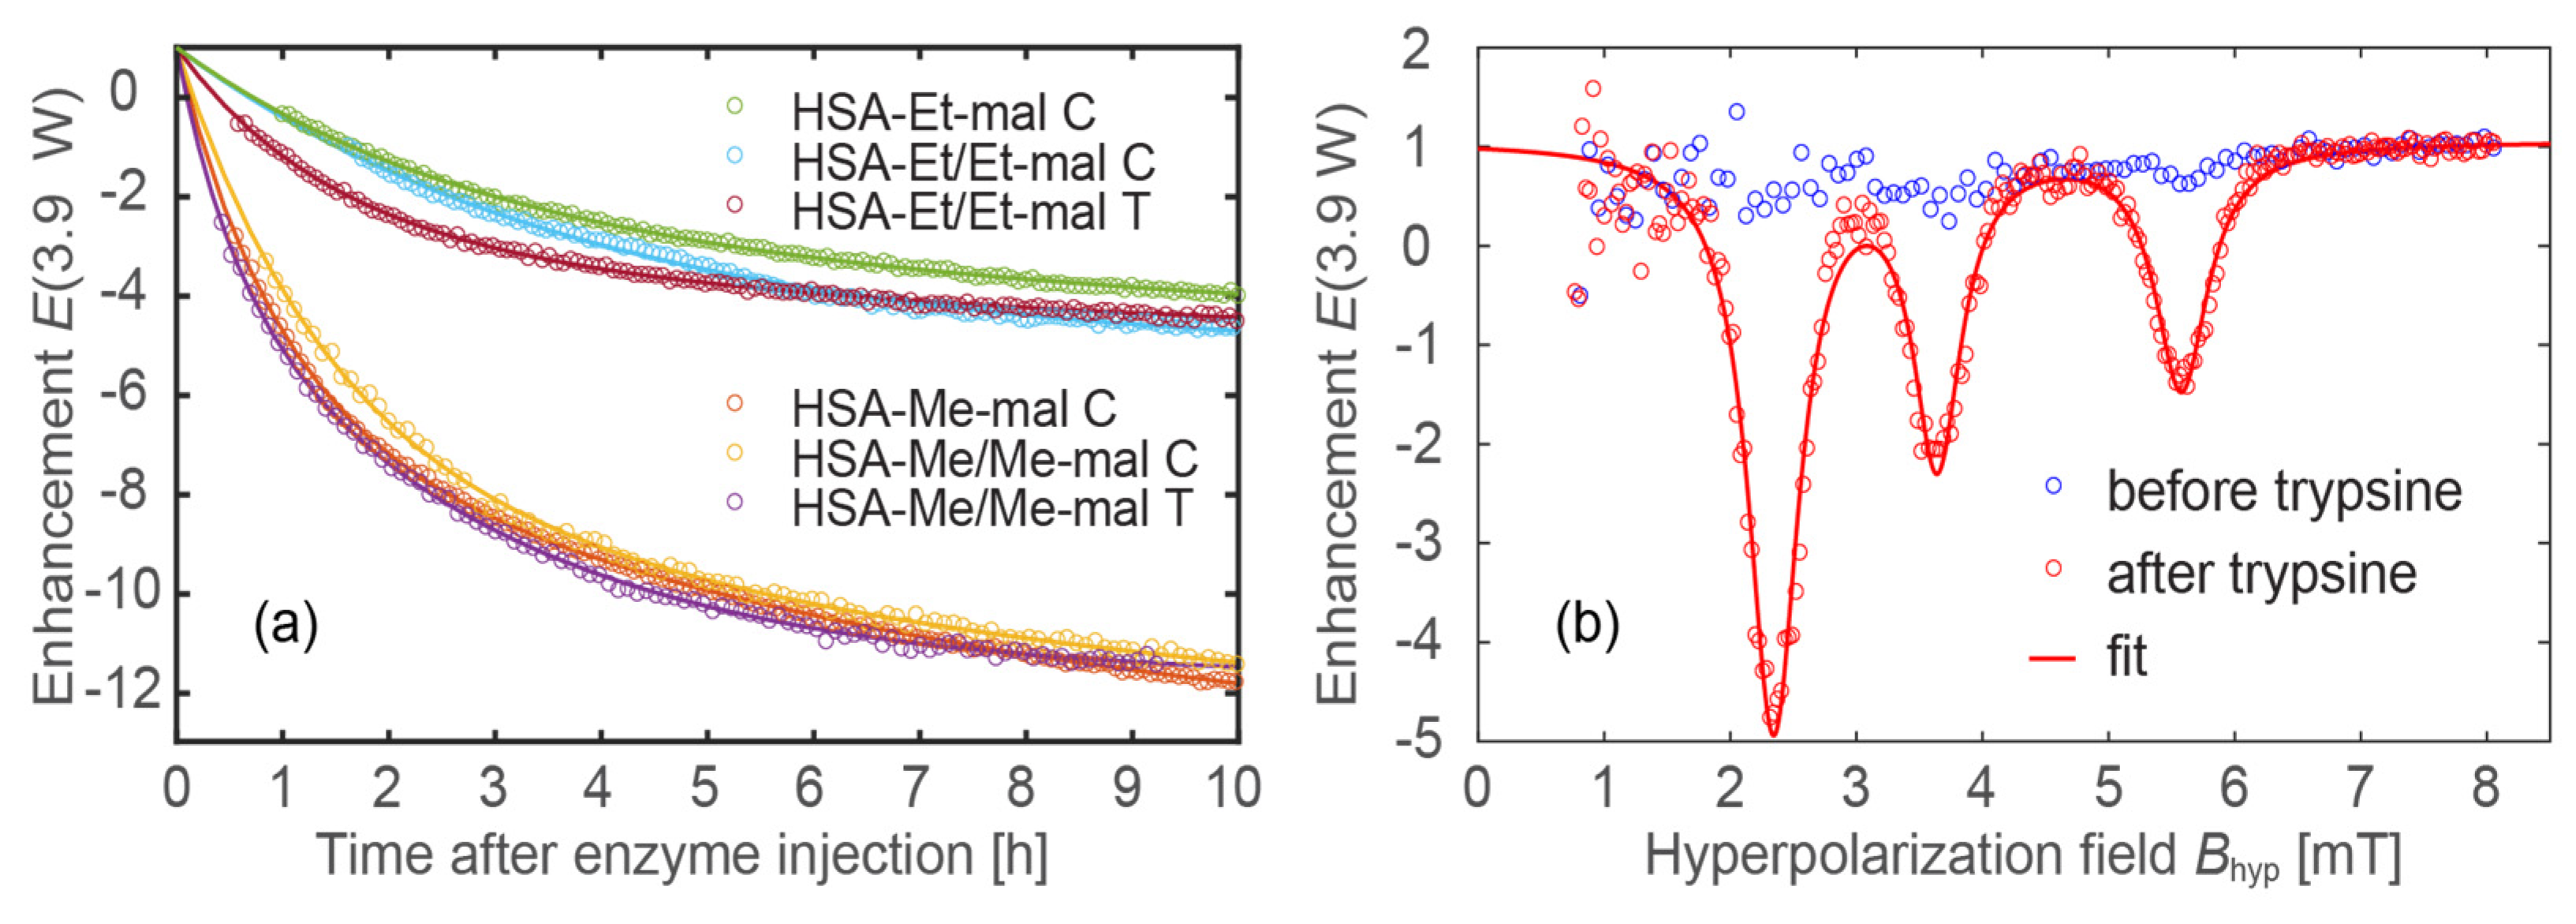
2.8. Trypsinolysis of HSA-NIT Conjugates and OMRI Application

HSA is finally catabolized inside various organs [109], and it is preferentially internalized by tumor cells [110]. The proteolysis of HSA was investigated in PBS (pH 7.4) using the enzyme trypsin, and analyzed by SDS-PAGE (Figure 9 and Figure S11). It could be a concern that, due to excessive modification, the trypsinolysis process could be inactive. As shown in Figure 9, none of the HSA-NIT exhibits any strong inhibition of proteolysis when exposed to trypsin, compared to native HSA.
HSA-NIT conjugates faster than native HSA digested to 15–55 kDa fragments, which correlates with previously published data on N-homocysteinylated HSA conjugates [111]. HSA-NIT was specifically sequentially degraded first to a fragment with an MW of ~55 kDa with greater efficiency than subsequent degradation to smaller fragments with MWs from 45 to 15 kDa. The trypsinolysis of the albumin monomer (66 kDa) into the 55 kDa band is highly efficient for all HSA-NIT conjugates. After 24 h, less than 20% of the protein was undigested, except for two samples (HSA-Et/Et-mal and HSA-Et-mal). This effect may be caused by the blocking of an important cleavage site in the 55 kDa fragment upon protein modification in these two conjugates, leading to a slowdown of the proteolysis at this stage.
Enzymes play vital roles in many essential cellular and tissue processes. The over-expression of enzymes is usually correlated with many pathological conditions and diseases [112]. For example, high proteolytic activities of extracellular and intracellular proteases are observed during tumor growth, invasion, and metastasis [113,114]. Many proteinases are secreted in the cell lysosomal compartment and the extracellular matrix. We hypothesized that HSA-NIT conjugates may accumulate in the tumor by passive transport or due to albumin-binding proteins and receptors [115], degrade by proteases, and release NIT-containing peptides. Upon proteolysis, the MW of NIT-species becomes lower, which leads to a decrease in the correlation time and EPR spectrum line width [32,49,50]. HSA-NIT may serve as an enzyme-activated probe for the in vivo imaging of biological events, and a probe for proteolytic activity. This enzyme-participated cleavage of HSA-NIT would lead to relaxivity r1 and r2 changes and an ODNP activation once the small radicals are free in solution, enabling OMRI. To investigate relaxivity changes under proteolysis, we added trypsin to HSA-NIT at 37 °C and measured T1 and T2 relaxation times per reaction time. The same reaction condition was used as for the previous trypsinolysis experiment (Figure 9, Section 3.8) except that for NMR, a volume of 500 µL of the reaction mixture was used. The values of T1 and T2 increased significantly for the first 3–4 h and reached a plateau after 12 h of degradation by trypsin (Figure 10). Similarly, the observation of the enhancement in relaxation time during digestion was previously made for protein–nitroxide complexes [32,49]. This phenomenon can be exploited to extend the ability of MRI to follow biological processes associated with the cellular uptake and digestion of proteins [32,49].
We decided to calculate the possible relaxation time of the system, based on the assumption that all nitroxides act as a free radical in solution. Nitroxide relaxivity values of 0.2 (r1, Me), 0.26 (r2, Me), 0.24 (r1, Et), and 0.29 (r2, Et) mM−1s−1 at 1.88 T in aqueous solution were measured and used for calculation. Excellent correlations between 1/T1 values after 24 h and the same number of free radicals were obtained for each sample (Table S6). A high correlation between the plateau values of relaxation time T1 and the calculated values indicates the great mobility of nitroxides in proteolysis products, which may facilitate good ODNP enhancement. The 1/T2 values in digested peptides were usually twice as high as those for nitroxides in solution (Table S6).
To simulate this feature in vitro, we added the proteases, chymotrypsin (C) and trypsin (T), to an HSA-NIT aqueous samples at 37 °C. Trypsin is a serine protease that specifically cleaves at the carboxylic side of lysine and arginine residues. Chymotrypsin hydrolyzes the peptide bonds after aromatic amino acids such as tryptophan, leucine, tyrosine, and phenylalanine. The association of proteolytic enzymes with cancer is well established, with different proteolytic families, including serine proteases [116]. Therefore, chymotrypsin and trypsin enzymes were used as commercially available proteases for the model ODNP experiment. The proteases released the small-molecular-weight nitroxide-based radical from HSA-NIT. The cleavage process was tracked in real time by measuring the ODNP enhancement factor for four samples, two of which were tested with C and T (Table 3, Figure 11a). To properly fit the measured enhancement factor E(t) as a function of time after protease injection, a double exponential function was used for most samples (except for sample HSA-Et/Et-mal C):
E t = A 1 1 e t τ 1 + A 2 1 e t τ 2
The accuracy of this method was estimated to be within ~10% (Figure S12).
This indicates that the cleavage process is dominated by a slow (τ1) and a fast (τ2) reaction process. This could explain why the nitroxides are cleaved from the HSA at different positions, resulting in the two different time constants. After 20 h, the cleavage process almost stopped for all samples. An ODNP spectrum before and after the cleavage process is shown in Figure 11b, demonstrating the activation of the spin probes. Two samples were tested for C and T (HSA-Me/Me-mal and HSA-Et/Et-mal), but no significant difference in the kinetics was observed (Table 3 and Figure 11a). To check the ODNP efficacy of the cleaved spin probes, a characterization similar to that used in Ref. [46] was performed (Table 3 and Table S7). For ODNP, the most important parameters are the maximum possible enhancement factor, Emax, and P1/2, the RF power needed to reach Emax/2. Obviously, it would be best to have a high enhancement factor at a low RF power level for future in vivo experiments, since it is mandatory not to heat tissue; therefore, the specific absorption rate of the HF irradiation should be kept as small as possible. As an example, TEMPO free radicals in a buffer solution have an Emax = 153.7 and P1/2 = 6.2 W.
Although the here-presented spin probes after the cleavage processes do not show an equivalently good performance compared to TEMPO free radicals, there are many possibilities for improvements, e.g., the 15N labeling or deuteration of the used spin probes. Nevertheless, the Emax enhancement of 40–50 with a low P1/2 of 10–12 W grounds the high potential applicability of HSA-NIT conjugates for OMRI. Note that P1/2 is different for tetramethyl and tetraethyl substituted nitroxides. The tetramethyl-substituted nitroxides exhibit a P1/2 range of 10–12 W, while the tetraethyl-substituted nitroxides exhibit a P1/2 range of 20–25 W. This is consistent with the findings of reference [46], where the tetraethyl-substituted nitroxides also exhibited a greater P1/2 compared to the tetramethyl-substituted nitroxides. In all experiments shown in Figure 11, the same RF power, P = 3.9 W, was used, so the enhancement E(P = 3.9 W) of the tetraethyl-substituted nitroxides was lower than that of the tetramethyl-substituted nitroxides.
The possible enzymatic hydrolysis and ODNP enhancement make HSA-NIT stimuli-responsive, activatable OMRI HCAs for use in cancer imaging [49,51,117]. Protein digestion switches from a stable, low-signal state to one with a high signal (Figure 11b). HSA-NIT is one of the rare examples of nitroxide-based OMRI systems with high enhancement and low power, which is soluble in aqueous solution, biocompatible, and prospective for use in cancer tissue delivery. However, the sluggish nature of the protease cleavage process (>1 h) requires further investigation. If the decay/clearance rate of the released nitroxides exceeds the duration of the cleavage process, no ODNP effect can be observed. Therefore, the stability of nitroxides is of utmost importance for in vivo experiments.

3. Materials and Methods

3.1. Chemicals

Human serum albumin (HSA) was purchased from Sigma-Aldrich (cat. no. A3782, St. Louis, MO, USA). Ellman’s test indicated that the albumin preparation contained 0.30 ± 0.06 thiol groups per molecule. MS (MALDI ToF) m/z HSA 66.48 kDa. Nitroxyl radical derivatives 3-carboxy-2,2,5,5-tetramethyl-4-[(2-oxothiolan-3-yl)carbamoyl]-2,5-dihydro-1H-pyrrol-1-oxyl (Me) [23], 3-carboxy-2,2,5,5-tetraethyl-4-[(2-oxothiolan-3-yl)carbamoyl]-2,5-dihydro-1H-pyrrol-1-oxyl (Et) [23], 3-maleimido-2,2,5,5-tetramethylpyrrolidine-1-oxyl (Me-mal) [118], and 3-maleimidomethyl-2,2,5,5-tetraethylpyrrolidine-1-oxyl (Et-mal) [119] were prepared and kindly provided by LAS NIOH SB RAS (Novosibirsk, Russia). 5,5′-dithio-bis(2-nitrobenzoic acid) (DTNB), all solvents, and other reagents were purchased from Sigma (St. Louis, MO, USA) at the highest available grade and used without purification. MTT (3-[4,5-dimethylthiazol-2-yl]-2,5-diphenyltetrazolium bromide) was purchased from Invitrogen (Waltham, MA, USA). Centricon concentrators with a 3 kDa molecular weight cut-off were purchased from Millipore. Trypsin for protein trypsinolysis was obtained from Gibco (cat. no. 15090046, Carlsbad, CA, USA). All other chemicals were purchased from Sigma-Aldrich at the highest available grade and used without purification. Aqueous solutions were prepared using bidistilled water, and protein solutions were prepared using phosphate-buffered saline (PBS) (15 mM KH2PO4, 145 mM NaCl, pH = 7.4).

3.2. Methods

Electronic absorption spectra were recorded on a UV-1800 spectrometer (Shimadzu, Tokyo, Japan). The concentrations of HSA solutions in PBS (pH 7.4) were determined by absorption at 278 nm, using the molar extinction coefficient ε = 3.7 × 10⁴ M−1cm−1 [23].
The number of thiol groups per HSA molecule was determined using Ellman’s method with DTNB [120]. A solution of HSA (200 μL, 0.1 mM) in 0.0074 M phosphate buffer (pH = 8.1) was mixed with DTNB (53.3 μL, 0.01 M) in 0.037 M phosphate buffer (pH = 8.0) and EDTA (13 μL, 0.025 M) in 0.0074 M phosphate buffer (pH = 8.1) and incubated for 40 min at room temperature. Unmodified HSA as a control was prepared using 200 μL of 0.0074 M phosphate buffer (pH = 8.1). The concentration of the yellow-colored product was measured using a UV-1800 spectrometer at 412 nm (ε412 = 1.42∙104 M−1cm−1) relative to the comparison solution, and the concentration of thiol groups was calculated.
HSA conjugates were analyzed by 7% and 10% sodium dodecyl sulfate-polyacrylamide gel electrophoresis (SDS-PAGE) under Laemmli conditions with subsequent Coomassie Brilliant Blue staining. For native PAGE, SDS was excluded from the loading buffer and gel solutions. Quantitative data were obtained by digitizing the gel using GelPro Analyzer software 3.0 (Media Cybernetics, Rockville, MD, USA).
Circular dichroism (CD) data were collected for HSA conjugates (50 μM, 100 μL) in PBS at 25 °C with a JASCO J-600 spectrophotometer with a time constant of 4 s and a bandwidth of 1 nm, using a 0.01 cm path length quartz cell. All CD spectra were obtained from 190 to 240 nm, and the final spectrum was obtained as an average of 20 spectra. The obtained CD spectra were processed by extrapolation from the basis spectra of α-helices, β-sheets, and the disordered structures taken from the CCA+ software 32bit 0.2b1. The percentages of secondary structures in HSA were calculated from the obtained data [94].
Matrix-assisted laser desorption/ionization time-of-flight mass spectrometry (MALDI-ToF MS) of HSA conjugates were recorded on a Bruker Autoflex Speed (Bruker, Germany) MALDI-ToF mass spectrometer in a positive linear mode. A smart beam-II laser was used with 2,5-dihydroxyacetophenone (2,5-DHAP) as the matrix. Protein samples were desalted by ZipTip C4 pipette tips. A 2 µL protein sample solution was mixed with 2 µL of 2% TFA (trifluoroacetic acid). For the latter solution, 2 µL of the matrix (2,5-DHAP) was added. The mixture was pipetted up and down until the crystallization started. Approximately 1 µL of the resulting solution was deposited on the 384-grit steel target plate and allowed to dry before being introduced into the mass spectrometer. Mass spectra were obtained by averaging 2500–3000 laser shots. MALDI-ToF data were deconvoluted using the software package mMass 5.5.0 [121,122,123].

3.3. Electron Paramagnetic Resonance (EPR)

Samples were placed in quartz capillary tubes (OD 1.5 mm, ID 0.9 mm). Continuous wave (CW) EPR measurements were performed in the X-band at 25 °C using an X-band Bruker EMX spectrometer. The experimental continuous wave EPR settings were as follows: central field 350.98 mT, sweep width 12 mT, microwave power 6.331 mW, microwave frequency 9.59 GHz, modulation frequency 100 kHz, modulation amplitude 0.15 mT, conversion time 81.92 ms, number of points 1024, and number of scans 10. Double integrals were calculated using the Bruker WinEPR software 4.3. The radical concentration was determined by comparing the spectral double integrals of the sample and a TEMPO ((2,2,6,6-tetramethylpiperidin-1-yl)oxyl) nitroxide solution with a known concentration. The experimental spectra were simulated using EasySpin software 5.2.35 [124,125]. All spectra were simulated in the slow-motion regime with the EasySpin chili function. Experimental EPR spectra were decomposed using EasySpin software 5.2.35 into three components with different rotational correlation times—“slow”, “fast” and “free”. The rotational correlation time shows the mobility of the label: longer times correspond to more immobilized labels and vice versa. The g-tensor and hyperfine tensor A values were the same in all spectra: gxx = 2.009, gyy = 2.006, gzz = 2.0025, Axx = Ayy = 0.5; the values of Azz were varied. Line broadenings were calculated assuming Voigtian line shape—the convolution of Lorentzian and Gaussian line shape.

3.4. Fractionation of HSA by Gel-Filtration Chromatography

The monomer HSA fraction was obtained by gel-filtration chromatography using a Sephadex-G150 superfine according to the previously published procedure [59,126]. The parameters of the chromatography column are 30 cm height, 2 cm diameter, and 5 mm outlet diameter. The Sephadex G-150 was suspended in 0.1 M KCl according to the standard manufacturing procedure. Then, 1 mL of a 1 mM HSA solution in 0.1 M KCl was applied to the Sephadex column. The solution of 0.1 M KCl was then passed through the column. The absorbance of the eluate was monitored with a UV- 1800 spectrometer (Shimadzu, Japan). Each eluate probe was analyzed by SDS-PAGE. After that, HSA fractions were combined and concentrated using Centricon Amicon Ultra 3K concentrators, and PBS buffer was used as an eluent.

3.5. HSA-NIT Conjugates Synthesis Methods

3.5.1. Method 1: HSA-NIT Synthesis Method with Sequential Addition of Nitroxide Derivatives

To 0.15 mL of a 0.5 mM HSA monomer in PBS, a 30-fold molar excess of HTL-NIT dissolved in 7.5 μL DMSO was added. Synthesis was carried out at 37 °C for 26 h under 250 rpm stirring. The reaction mixture was centrifuged at 10,000× g for 15 min to remove the poorly soluble nitroxide excess. The HSA-NIT conjugate was cleaned using Centricon concentrators (3 kDa molecular weight cutoff; Amicon Centriprep YM30, Millipore, Bedford, MA) according to the procedure described by the manufacturer, with PBS as the eluent. The amount of nitroxide label was analyzed by CW EPR. The HSA-Me yield was 95% with a modification degree of 4.8 ± 0.4. The HSA-Et yield was 88%, with a modification degree of 5.2 ± 0.5. According to SDS-PAGE data (Figure 1), the protein oligomer contents in HSA-Me and HSA-Et are 12.8 ± 1.4% and 11.1 ± 1.5%, respectively.
To 0.15 mL of 0.5 mM synthesized HSA-Me and HSA-Et in PBS, 15-fold molar excesses of Me-mal and Et-mal, respectively, dissolved in 7.5 μL DMSO were added. Synthesis was carried out at 37 °C for 26 h under 250 rpm stirring with the same cleaning procedures. The amount of nitroxide label was analyzed by CW EPR. The HSA-Me/Me-mal yield was 94% with a modification degree of 7.0 ± 0.6. The HSA-Et/Et-mal yield was 86% with a modification degree of 10.2 ± 0.8. According to SDS-PAGE data (Figure 1), the protein oligomer contents in HSA-Me/Me-mal and HSA-Et/Et-mal are 20.2 ± 1.5% and 17.3 ± 1.7%, respectively.

3.5.2. Method 2: HSA-NIT Synthesis Method with Simultaneous Addition of Nitroxide Derivatives

To 0.1–0.3 mL of a 0.5, 0.1, or 0.05-mM HSA monomer in PBS, a 30–900-fold molar excess of HTL-NIT and a 15–450-fold molar excess of mal-NIT dissolved in DMSO were added (Table S1). The resulting DMSO amount in the solution was in the 5–10% range. Synthesis was carried out at 37 °C for 22–64 h under 250 rpm stirring. The reaction mixture was centrifuged at 10,000× g for 15 min to remove poorly soluble nitroxide excess. The HSA-NIT conjugate was cleaned using Centricon concentrators (3 kDa molecular weight cutoff; Amicon Centriprep YM30, Millipore, Bedford, MA) according to the procedure described by the manufacturer, with PBS as the eluent. The amount of nitroxide label was analyzed by CW EPR. The yield for HSA-NIT conjugates is in the 85–90% range (Table S1).

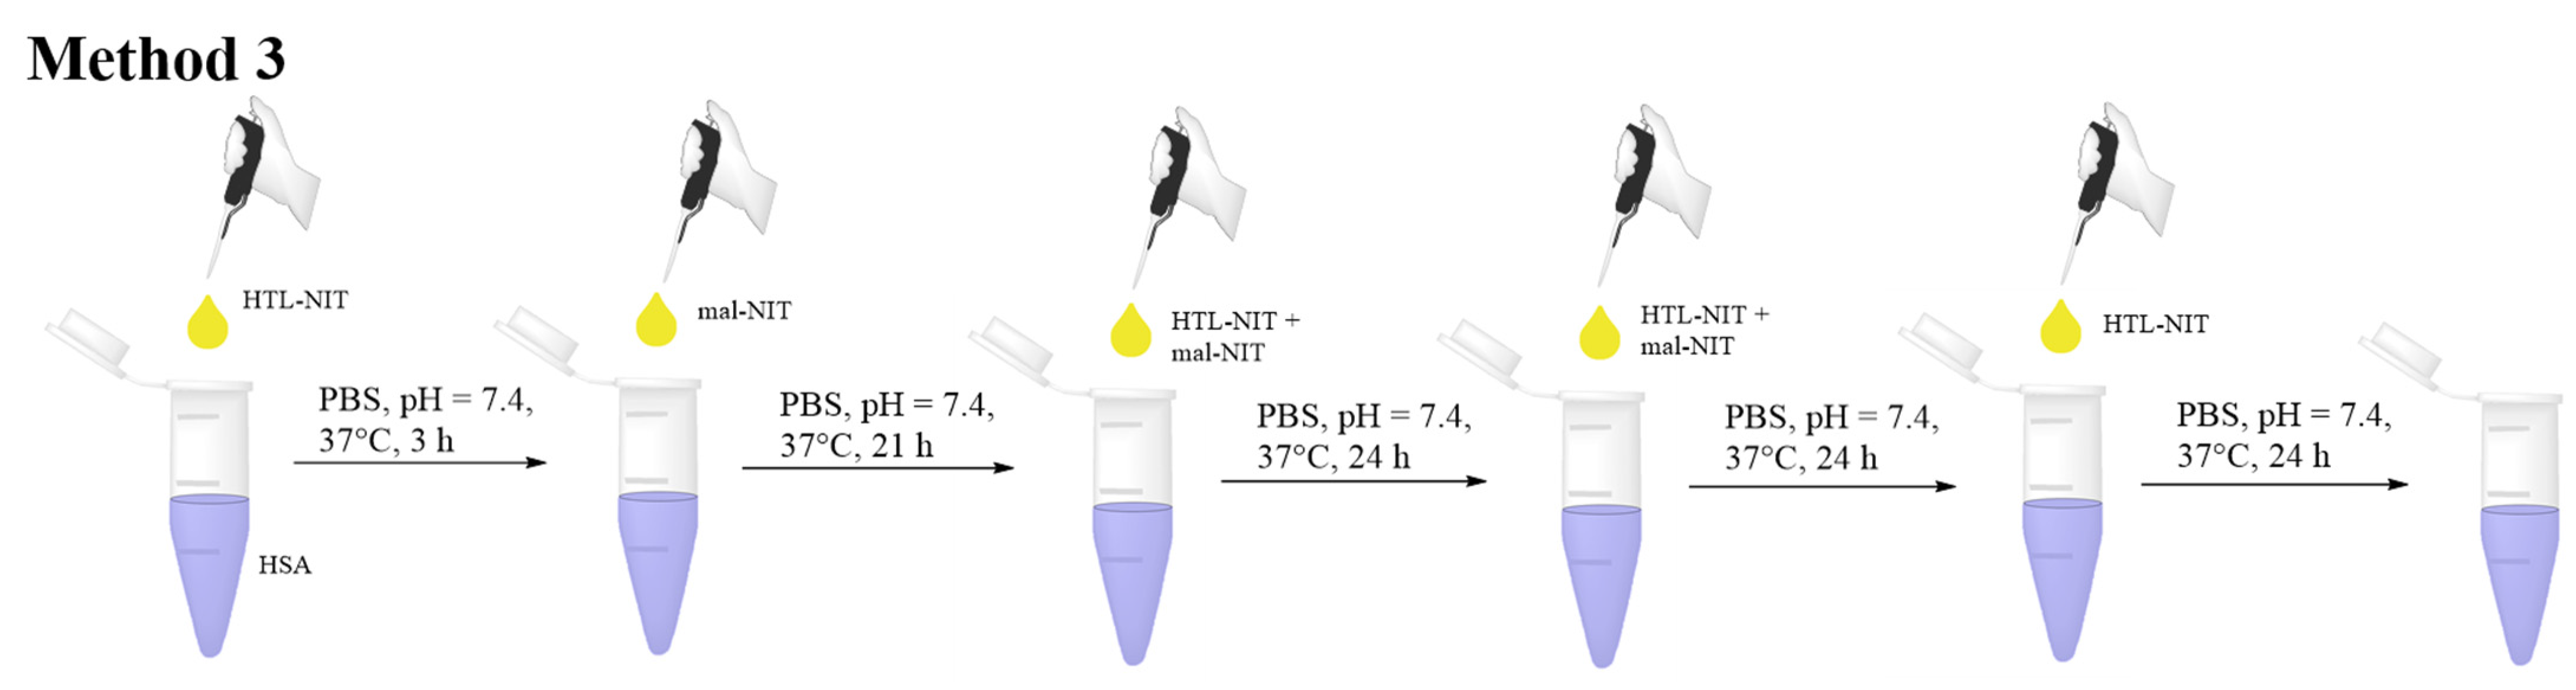
3.5.3. Method 3: HSA-NIT Synthesis Method with Simultaneous Addition of Nitroxide Derivatives Aliquots in Equal Time Intervals

To 0.64 mL of a 0.274 mM HSA monomer in PBS, 50 μL DMSO was added and stirred at 450 rpm for 5 min. To the resulting mixture, 80-fold molar excesses of HTL-NIT and mal-NIT in DMSO were added in aliquots after time intervals set according to Table S2. For comparison, reactions with only HTL-NIT or mal-NIT were carried out. Synthesis was carried out at 37 °C for 96 h under 250 rpm stirring. The reaction mixture was centrifuged at 10,000× g for 15 min to remove poorly soluble nitroxide excess. The HSA-NIT conjugate was cleaned using Centricon concentrators (3 kDa molecular weight cutoff; Amicon Centriprep YM30, Millipore, Bedford, MA) according to the procedure described by the manufacturer, with PBS as the eluent. The amount of nitroxide label was analyzed by CW EPR and MALDI-ToF. The molecular weight of the HSA monomer used in the experiment according to MALDI-TOF was 66.48 kDa.
HSA-Me. The yield was ~94%. MALDI TOF MS m/z 70.585 kDa (~14.4 ± 0.6 NIT residues). The average modification degree calculated by MALDI-TOF MS and CW EPR is 13.7 ± 0.7. HSA-Me/Me-mal. The yield was ~85%. MALDI TOF MS m/z 71.198 kDa (~18.1 ± 0.8 NIT residues). The average modification degree calculated by MALDI-TOF MS and CW EPR is 17.1 ± 1.0. HSA-Me-mal. The yield was ~93%. The modification degree calculated by CW EPR is 16.4 ± 0.9.
HSA-Et. The yield was ~92%. MALDI TOF MS m/z 71.014 kDa (~13.2 ± 0.3 NIT residues). The average modification degree calculated by MALDI-TOF MS and CW EPR is 13.1 ± 0.2. HSA-Et/Et-mal. The yield was ~84%. MALDI TOF MS m/z 73.246 kDa (~20.9 ± 0.8 NIT residues). The average modification degree calculated by MALDI-TOF MS and CW EPR is 21.9 ± 1.0. HSA-Et-mal. The yield was ~90%. The modification degree calculated by CW EPR is 20.8 ± 1.1.

3.6. Relaxivities (r1 and r2) of HSA-NIT Conjugates

Relaxivities of the HSA-NIT were measured at 25 °C and 80 MHz (1.88 T), 128 MHz (3.0 T), 300 MHz (7.0 T), and 600 MHz (14.1 T) in aqueous PBS buffer (pH 7.4) using a Magritek Spinsolve80 spectrometer, a clinical Siemens 3T whole body system, a Bruker Avance III 300 MHz spectrometer, and a Magnex (Oxford) ultra-high-field MRI system, respectively. Inversion recovery (T1) and Car–Purcell–Meiboom–Gill (T2) pulse sequences were used. The relaxivities, r1 and r2, were calculated according to Equation (2) for HSA-NIT in PBS. All reported relaxivity values were the average of three or more independent measurements.
1 T i = 1 T i , d + r i · C H S A N I T ,
where Ti is the measured T1 (i = 1) or T2 (i = 2), Ti,d is the diamagnetic contribution of the solvent and CHSA-NIT is the conjugate concentration.

3.7. Reduction of HSA-NIT Conjugates

The reduction rate constants of HSA conjugates were investigated using two methods: EPR and T1-relaxation time measuring [23]. For a typical experiment, HSA-NIT (0.09 mM), ascorbic acid (39 mM), and glutathione (19.5 mM) concentrations in the reaction mixture were used.

3.7.1. Reduction Studies by T1-Relaxation Time Measuring

The NMR tube with a solution of HSA-NIT was mixed with Asc/GSH in PBS buffer and immediately placed in the Magritek Spinsolve80 NMR spectrometer, and the 1/T1-relaxation rates were measured and calculated using the program MestReNova. The reduction constants were calculated as a pseudo-first-order rate from the dependence of the logarithm of the difference of the relaxation rates (1/T1 and 1/T1,d) versus time, divided by the concentration of ascorbic acid (Equation (3)).
ln 1 T 1 1 T 1 , d = ln r 1 · C N I T 0 k · C A s c · t

3.7.2. Reduction Studies by EPR

The solution of HSA-NIT with Asc/GSH (10 µL) in PBS buffer was drawn into a capillary tube, sealed from both sides, and placed into the resonator of the spectrometer. The double integral of the spectrum was measured as a function of time. The reduction constant was calculated as a pseudo-first-order rate equation.

3.8. Trypsinolysis of HSA-NIT Conjugates

The solution of HSA-NIT 150 μL of 0.2 mM in PBS buffer (pH 7.4) was digested with 6 μL 0.1 mM trypsin («Gibco» cat. No. 15090046) at an enzyme–substrate ratio of 1:50 at 37 °C and 250 rpm on a shaker for 25 h, with aliquots taken after 1, 3, 5, 21 and 25 h. The latter solution aliquot (7.5 µL) was mixed 1:1 with SDS-PAGE sample buffer (50 mM tris hydrochloride pH 6.8, 1% SDS, 10% glycerol, and 0.025% bromophenol blue with or without 0.1% DTT), denatured for 5 min at 95 °C, and subjected to SDS-PAGE. Albumin bands were visualized by Coomassie blue staining. Quantitative data were obtained by digitizing the gel using GelPro Analyzer software 3.0 (Media Cybernetics). Bands in the gel with a molecular weight of 66.5 kDa (HSA monomer) were labeled as undigested albumin.

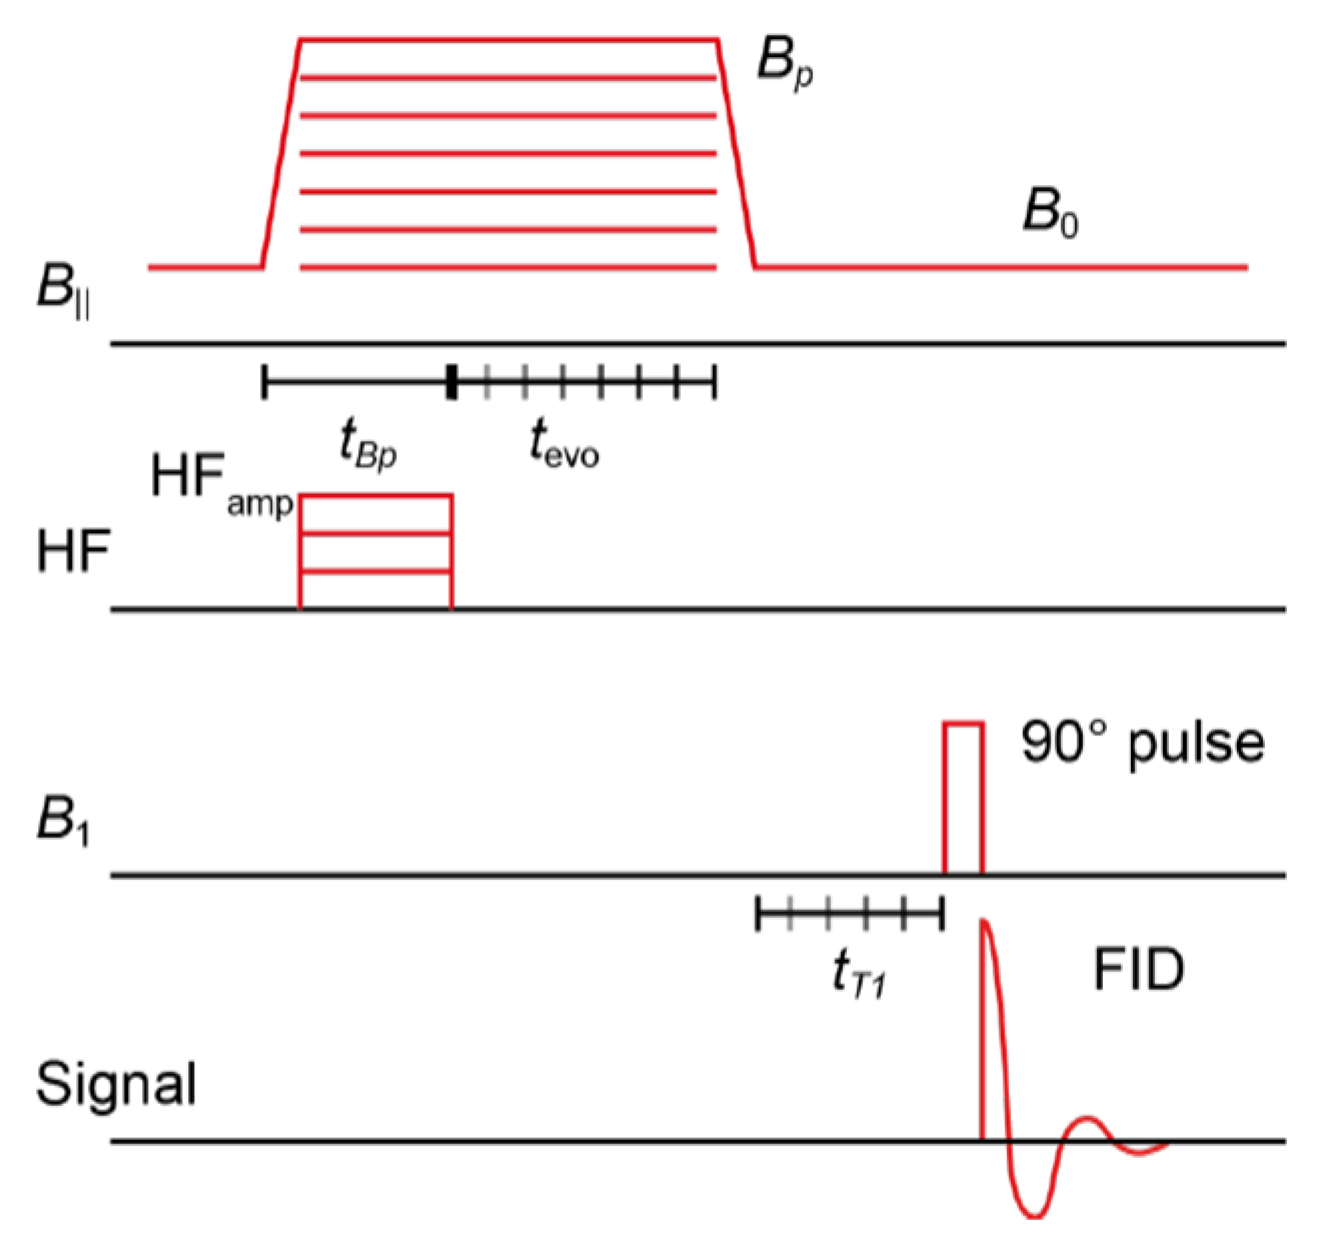
3.9. The Acquisition of OMRI Spectra of HSA-NIT Conjugates

The experimental measurements were performed using a simple free induction decay (FID) sequence following a hyperpolarization phase, as shown in Figure 12.
During the hyperpolarization phase, a magnetic field of magnitude Bp was applied orthogonally to the B0 field (~94 µT), accompanied by an RF pulse of duration tBp and frequency on the scale of the electron Larmor frequency. The FID readout procedure consisted of a 90-degree pulse followed by data acquisition. The acquisition of OMRI spectra involved the use of a radio frequency (RF) pulse with a constant amplitude and frequency (~120 MHz) while varying the magnitude of the magnetic field, Bp, for each data point. The time domain data collected during the acquisition phase were then Fourier-transformed. The resulting integrated MR peak was then plotted as a function of Bp amplitude. To measure the hyperpolarization buildup rate, the length tBp of the hyperpolarization phase is varied. By fitting an exponential buildup function to the integrated MR peak as a function of tBp, the hyperpolarization buildup rate THyp can be determined. Note that THyp cannot be experimentally distinguished from the longitudinal relaxation time T1(Bp).
The longitudinal relaxation time T1 was measured at two different field strengths, Bp and B0. To measure T1(Bp), the additional delay tevo is varied after the RF field is turned off and before the ramp-down of Bp. For the measurement of T1(B0), an additional delay tT1 is inserted after the ramp-down of Bp and before the readout phase is inserted. An exponential decay function was fitted to the integrated MR peak as a function of the delays tevo and tT1. As a result, T1(Bp) and T1(B0) were determined from the fit.
An expression for the power-dependent enhancement factor is given by Equation (4).
E P = E m a x 1 P P 1 2 + P + 1
By varying the RF power P and plotting the integrated MR peak as a function of P, the above dependence can be fitted, and Emax and P1/2 determined. Note that P1/2 is a setup-dependent parameter. A systematic study was performed to compare this parameter with those in other studies. OMRI applications require spin probes with a high Emax and low P1/2.

3.10. Cytotoxicity Assay

Cytotoxicity studies were performed by colorimetric assay using the MTT compound on human breast adenocarcinoma (MCF-7) and human glioblastoma (T98G) tumor cell lines. MCF-7 and T98G cells were cultured in IMDM or EMEM medium, respectively, supplemented with 10% fetal bovine serum (FBS) (Invitrogen), penicillin (100 units/mL) and streptomycin (100 units/mL) at 37 °C and 5% CO2 in a humidified atmosphere. Exponentially growing cells were plated in a 96-well plate (2000 cells per well). After overnight incubation, the cells were treated with media containing HSA-NIT conjugates. The solutions of conjugates were applied to the media for 72 h at 37 °C. An aliquot of MTT solution (10 μL, 25 mg/mL) in PBS was added to each well and incubated at 37 °C for 3 h. The medium was removed and the precipitate was dissolved in 0.1 mL of isopropanol. The absorbance at 570 nm (peak) and 620 nm (baseline) was read using a microplate reader, Multiscan EX (Thermo Electron Corporation). Results have been expressed as a percentage of control survival values obtained for cells without the addition of albumin conjugates. All values in the present study are given as the mean ± standard deviation (SD) values, and all measurements were repeated three times.

Supplementary Materials

The following supporting information can be downloaded at: https://www.mdpi.com/article/10.3390/ijms25074041/s1.

Author Contributions

Conceptualization, A.C.; resources, I.K. and K.S.; data curation, A.C., D.M., F.B., O.K., K.B., S.D., J.E. and M.K.; investigation, A.C., D.M., F.B. and K.B.; writing—original draft preparation, A.C., K.B. and D.M.; writing—review and editing, I.K., O.K. and K.B.; supervision, A.C., K.S. and I.K.; project administration, A.C.; funding acquisition, A.C. and I.K.; All authors have read and agreed to the published version of the manuscript.

Funding

This research was funded by the Russian Science Foundation (synthesis and characterization of HSA-NITs, MRI estimation, grant No. 23-13-00178). K.B. acknowledges funding from the DFG (Free radical hyperpolarizing agents for ultra-low field Overhauser MRI, BU 2694/9-1).

Institutional Review Board Statement

Not applicable.

Informed Consent Statement

Not applicable.

Data Availability Statement

Data are contained within the article and Supplementary Materials.

Acknowledgments

We thank the personnel of the Multi-Access Center of SB RAS for spectral characterization and analyses of nitroxide spin labels.

Conflicts of Interest

The authors declare no conflicts of interest.

References

  1. Yousaf, T.; Dervenoulas, G.; Politis, M. Advances in MRI Methodology, 1st ed.; Elsevier Inc.: Amsterdam, The Netherlands, 2018; Volume 141, ISBN 9780128154182. [Google Scholar]
  2. Kim, H.K.; Lee, G.H.; Chang, Y. Gadolinium as an MRI contrast agent. Future Med. Chem. 2018, 10, 639–661. [Google Scholar] [CrossRef] [PubMed]
  3. Bartusik-Aebisher, D.; Bober, Z.; Zalejska-Fiolka, J.; Kawczyk-Krupka, A.; Aebisher, D. Multinuclear MRI in Drug Discovery. Molecules 2022, 27, 6493. [Google Scholar] [CrossRef]
  4. Caspani, S.; Magalhães, R.; Araújo, J.P.; Sousa, C.T. Magnetic nanomaterials as contrast agents for MRI. Materials 2020, 13, 2586. [Google Scholar] [CrossRef]
  5. Lv, J.; Roy, S.; Xie, M.; Yang, X.; Guo, B. Contrast Agents of Magnetic Resonance Imaging and Future Perspective. Nanomaterials 2023, 13, 2003. [Google Scholar] [CrossRef] [PubMed]
  6. Geraldes, C.F.G.C.; Peters, J.A. MRI Contrast Agents in Glycobiology. Molecules 2022, 27, 8297. [Google Scholar] [CrossRef]
  7. Miloushev, V.Z.; Keshari, K.R.; Holodny, A.I. Hyperpolarization MRI preclinical models and potential applications in neuroradiology. Top. Magn. Reson. Imaging 2016, 25, 31–37. [Google Scholar] [CrossRef]
  8. Chubarov, A.S. Serum Albumin for Magnetic Nanoparticles Coating. Magnetochemistry 2022, 8, 13. [Google Scholar] [CrossRef]
  9. Popova, V.; Dmitrienko, E.; Chubarov, A. Magnetic Nanocomposites and Imprinted Polymers for Biomedical Applications of Nucleic Acids. Magnetochemistry 2023, 9, 12. [Google Scholar] [CrossRef]
  10. Wahsner, J.; Gale, E.M.; Rodríguez-Rodríguez, A.; Caravan, P. Chemistry of MRI contrast agents: Current challenges and new frontiers. Chem. Rev. 2019, 119, 957–1057. [Google Scholar] [CrossRef]
  11. Xiao, Y.D.; Paudel, R.; Liu, J.; Ma, C.; Zhang, Z.S.; Zhou, S.K. MRI contrast agents: Classification and application (Review). Int. J. Mol. Med. 2016, 38, 1319–1326. [Google Scholar] [CrossRef]
  12. Bonnet, C.S.; Tóth, É. Metal-based environment-sensitive MRI contrast agents. Curr. Opin. Chem. Biol. 2021, 61, 154–169. [Google Scholar] [CrossRef]
  13. Zhao, S.; Yu, X.; Qian, Y.; Chen, W.; Shen, J. Multifunctional magnetic iron oxide nanoparticles: An advanced platform for cancer theranostics. Theranostics 2020, 10, 6278–6309. [Google Scholar] [CrossRef]
  14. Biedenbänder, T.; Aladin, V.; Saeidpour, S.; Corzilius, B. Dynamic Nuclear Polarization for Sensitivity Enhancement in Biomolecular Solid-State NMR. Chem. Rev. 2022, 122, 9738–9794. [Google Scholar] [CrossRef] [PubMed]
  15. European Medicines Agency. European Medicines Agency EMA’s Final Opinion Confirms Restrictions on Use of Linear Gadolinium Agents in Body Scans. Recommendations Conclude EMA’s Scientific Review of Gadolinium Deposition; European Medicines Agency: Amsterdam, The Netherlands, 2017. [Google Scholar]
  16. Ramalho, J.; Ramalho, M. Gadolinium Deposition and Chronic Toxicity. Magn. Reson. Imaging Clin. N. Am. 2017, 25, 765–778. [Google Scholar] [CrossRef] [PubMed]
  17. Malikova, H.; Holesta, M. Gadolinium contrast agents—Are they really safe? J. Vasc. Access 2017, 18, s1–s7. [Google Scholar] [CrossRef] [PubMed]
  18. Pasquini, L.; Napolitano, A.; Visconti, E.; Longo, D.; Romano, A.; Tomà, P.; Espagnet, M.C.R. Gadolinium-Based Contrast Agent-Related Toxicities. CNS Drugs 2018, 32, 229–240. [Google Scholar] [CrossRef] [PubMed]
  19. Rogosnitzky, M.; Branch, S. Gadolinium-based contrast agent toxicity: A review of known and proposed mechanisms. BioMetals 2016, 29, 365–376. [Google Scholar] [CrossRef] [PubMed]
  20. Weinreb, J.C.; Rodby, R.A.; Yee, J.; Wang, C.L.; Fine, D.; McDonald, R.J.; Perazella, M.A.; Dillman, J.R.; Davenport, M.S. Use of intravenous gadolinium-based contrast media in patients with kidney disease: Consensus statements from the American college of radiology and the national kidney foundation. Radiology 2021, 298, 28–35. [Google Scholar] [CrossRef] [PubMed]
  21. Fu, C.; Yu, Y.; Xu, X.; Wang, Q.; Chang, Y.; Zhang, C.; Zhao, J.; Peng, H.; Whittaker, A.K. Functional polymers as metal-free magnetic resonance imaging contrast agents. Prog. Polym. Sci. 2020, 108, 101286. [Google Scholar] [CrossRef]
  22. Akakuru, O.U.; Iqbal, M.Z.; Saeed, M.; Liu, C.; Paunesku, T.; Woloschak, G.; Hosmane, N.S.; Wu, A. The Transition from Metal-Based to Metal-Free Contrast Agents for T1 Magnetic Resonance Imaging Enhancement. Bioconjug. Chem. 2019, 30, 2264–2286. [Google Scholar] [CrossRef]
  23. Dobrynin, S.; Kutseikin, S.; Morozov, D.; Krumkacheva, O.; Spitsyna, A.; Gatilov, Y.; Silnikov, V.; Angelovski, G.; Bowman, M.K.; Kirilyuk, I.; et al. Human Serum Albumin Labelled with Sterically-Hindered Nitroxides as Potential MRI Contrast Agents. Molecules 2020, 25, 1709. [Google Scholar] [CrossRef]
  24. Rajca, A.; Wang, Y.; Boska, M.; Paletta, J.T.; Olankitwanit, A.; Swanson, M.A.; Mitchell, D.G.; Eaton, S.S.; Eaton, G.R.; Rajca, S. Organic Radical Contrast Agents for Magnetic Resonance Imaging. J. Am. Chem. Soc. 2012, 134, 15724–15727. [Google Scholar] [CrossRef] [PubMed]
  25. Nguyen, H.V.T.; Detappe, A.; Gallagher, N.M.; Zhang, H.; Harvey, P.; Yan, C.; Mathieu, C.; Golder, M.R.; Jiang, Y.; Ottaviani, M.F.; et al. Triply Loaded Nitroxide Brush-Arm Star Polymers Enable Metal-Free Millimetric Tumor Detection by Magnetic Resonance Imaging. ACS Nano 2018, 12, 11343–11354. [Google Scholar] [CrossRef] [PubMed]
  26. Nguyen, H.V.T.; Chen, Q.; Paletta, J.T.; Harvey, P.; Jiang, Y.; Zhang, H.; Boska, M.D.; Ottaviani, M.F.; Jasanoff, A.; Rajca, A.; et al. Nitroxide-Based Macromolecular Contrast Agents with Unprecedented Transverse Relaxivity and Stability for Magnetic Resonance Imaging of Tumors. ACS Cent. Sci. 2017, 3, 800–811. [Google Scholar] [CrossRef] [PubMed]
  27. Zhao, C.; Chen, Q.; Garcia-Hernandez, J.D.; Watanabe, L.K.; Rawson, J.M.; Rao, J.; Manners, I. Uniform and Length-Tunable, Paramagnetic Self-Assembled Nitroxide-Based Nanofibers for Magnetic Resonance Imaging. Macromolecules 2023, 56, 263–270. [Google Scholar] [CrossRef]
  28. Bye, N.; Hutt, O.E.; Hinton, T.M.; Acharya, D.P.; Waddington, L.J.; Moffat, B.A.; Wright, D.K.; Wang, H.X.; Mulet, X.; Muir, B.W. Nitroxide-loaded hexosomes provide MRI contrast in vivo. Langmuir 2014, 30, 8898–8906. [Google Scholar] [CrossRef] [PubMed]
  29. Davis, R.M.; Mitchell, J.B.; Krishna, M.C. Nitroxides as Cancer Imaging Agents. Anticancer Agents Med. Chem. 2012, 11, 347–358. [Google Scholar] [CrossRef] [PubMed]
  30. Soikkeli, M.; Horkka, K.; Moilanen, J.O.; Timonen, M.; Kavakka, J.; Heikkinen, S. Synthesis, stability and relaxivity of teepo-met: An organic radical as a potential tumour targeting contrast agent for magnetic resonance imaging. Molecules 2018, 23, 1034. [Google Scholar] [CrossRef] [PubMed]
  31. Soikkeli, M.; Sievänen, K.; Peltonen, J.; Kaasalainen, T.; Timonen, M.; Heinonen, P.; Rönkkö, S.; Lehto, V.P.; Kavakka, J.S.; Heikkinen, S. Synthesis and in vitro phantom NMR and MRI studies of fully organic free radicals, TEEPO-glucose and TEMPO-glucose, potential contrast agents for MRI. RSC Adv. 2015, 5, 15507–15510. [Google Scholar] [CrossRef]
  32. Chan, H.C.; Sun, K.Q.; Magin, R.L.; Swartz, H.M. Potential of Albumin Labeled with Nitroxides as a Contrast Agent for Magnetic Resonance Imaging and Spectroscopy. Bioconjug. Chem. 1990, 1, 32–36. [Google Scholar] [CrossRef]
  33. Lee, H.; Shahrivarkevishahi, A.; Lumata, J.L.; Luzuriaga, M.A.; Hagge, L.M.; Benjamin, C.E.; Brohlin, O.R.; Parish, C.R.; Firouzi, H.R.; Nielsen, S.O.; et al. Chemical Science enhancement of metal-free magnetic resonance imaging contrast agents. Chem. Sci. 2020, 11, 2045–2050. [Google Scholar] [CrossRef]
  34. Eisele, K.; Gropeanu, R.; Musante, A.; Glasser, G.; Li, C.; Muellen, K.; Weil, T. Tailored Albumin-based Copolymers for Receptor-Mediated Delivery of Perylenediimide Guest Molecules. Macromol. Rapid Commun. 2010, 31, 1501–1508. [Google Scholar] [CrossRef]
  35. Alvaradejo, G.G.; Nguyen, H.V.-T.; Harvey, P.; Gallagher, N.M.; Le, D.; Ottaviani, M.F.; Jasanoff, A.; Delaittre, G.; Johnson, J.A. Polyoxazoline-Based Bottlebrush and Brush-Arm Star Polymers via ROMP: Syntheses and Applications as Organic Radical Contrast Agents. Physiol. Behav. 2017, 176, 139–148. [Google Scholar] [CrossRef]
  36. Nagura, K.; Takemoto, Y.; Yoshino, F.; Bogdanov, A.; Chumakova, N.; Vorobiev, A.K.; Imai, H.; Matsuda, T.; Shimono, S.; Kato, T.; et al. Magnetic mixed micelles composed of a non-ionic surfactant and nitroxide radicals containing a D-glucosamine unit: Preparation, stability, and biomedical application. Pharmaceutics 2019, 11, 42. [Google Scholar] [CrossRef]
  37. Guo, S.; Wang, X.; Li, Z.; Pan, D.; Dai, Y.; Ye, Y.; Tian, X.; Gu, Z.; Gong, Q.; Zhang, H.; et al. A nitroxides-based macromolecular MRI contrast agent with an extraordinary longitudinal relaxivity for tumor imaging via clinical T1WI SE sequence. J. Nanobiotechnol. 2021, 19, 244. [Google Scholar] [CrossRef]
  38. Zhang, S.; Lloveras, V.; Lope-piedra, S.; Calero-p, P.; Wu, S.; Candiota, A.P.; Vidal-gancedo, J. Metal-Free Radical Dendrimers as MRI Contrast Agents for Glioblastoma Diagnosis: Ex Vivo and In Vivo Approaches. Biomacromolecules 2022, 23, 2767–2777. [Google Scholar] [CrossRef]
  39. Guo, S.; Wang, X.; Dai, Y.; Dai, X.; Li, Z.; Luo, Q.; Zheng, X.; Gu, Z.; Zhang, H.; Gong, Q.; et al. Enhancing the Efficacy of Metal-Free MRI Contrast Agents via Conjugating Nitroxides onto PEGylated Cross-Linked Poly(Carboxylate Ester). Adv. Sci. 2020, 7, 2000467. [Google Scholar] [CrossRef] [PubMed]
  40. Pinto, L.F.; Lloveras, V.; Zhang, S.; Liko, F.; Veciana, J.; Muñoz-Gómez, J.L.; Vidal-Gancedo, J. Fully Water-Soluble Polyphosphorhydrazone-Based Radical Dendrimers Functionalized with Tyr-PROXYL Radicals as Metal-Free MRI T1 Contrast Agents. ACS Appl. Bio Mater. 2020, 3, 369–376. [Google Scholar] [CrossRef] [PubMed]
  41. Niidome, T.; Gokuden, R.; Watanabe, K.; Mori, T.; Naganuma, T.; Utsumi, H.; Ichikawa, K.; Katayama, Y. Nitroxyl radicals-modified dendritic poly(l-lysine) as a contrast agent for Overhauser-enhanced MRI. J. Biomater. Sci. Polym. Ed. 2014, 25, 1425–1439. [Google Scholar] [CrossRef] [PubMed]
  42. Jannin, S.; Dumez, J.N.; Giraudeau, P.; Kurzbach, D. Application and methodology of dissolution dynamic nuclear polarization in physical, chemical and biological contexts. J. Magn. Reson. 2019, 305, 41–50. [Google Scholar] [CrossRef] [PubMed]
  43. Eills, J.; Budker, D.; Cavagnero, S.; Chekmenev, E.Y.; Elliott, S.J.; Jannin, S.; Lesage, A.; Matysik, J.; Meersmann, T.; Prisner, T.; et al. Spin Hyperpolarization in Modern Magnetic Resonance. Chem. Rev. 2023, 123, 1417–1551. [Google Scholar] [CrossRef]
  44. Corzilius, B. High-Field Dynamic Nuclear Polarization. Annu. Rev. Phys. Chem. 2020, 71, 143–170. [Google Scholar] [CrossRef]
  45. Gunther, U.L. Topics in Current Chemistry 335 Modern NMR Methodology. In Modern NMR Methodology; Springer: Berlin/Heidelberg, Germany, 2013; pp. 23–69. ISBN 9783642379901. [Google Scholar]
  46. Fehling, P.; Buckenmaier, K.; Dobrynin, S.A.; Morozov, D.A.; Polienko, Y.F.; Khoroshunova, Y.V.; Borozdina, Y.; Mayer, P.; Engelmann, J.; Scheffler, K.; et al. The effects of nitroxide structure upon 1H Overhauser dynamic nuclear polarization efficacy at ultralow-field. J. Chem. Phys. 2021, 155, 144203. [Google Scholar] [CrossRef]
  47. Zamora, P.L.; Villamena, F.A.; Zamora, P.L.; Villamena, F.A. Measuring Oxidants and Oxidative Stress in Biological Systems; Springer: Berlin/Heidelberg, Germany, 2020; Volume 34, ISBN 9783030473174. [Google Scholar]
  48. Takakusagi, Y.; Kobayashi, R.; Saito, K.; Kishimoto, S.; Krishna, M.C.; Murugesan, R.; Matsumoto, K.I. EPR and Related Magnetic Resonance Imaging Techniques in Cancer Research. Metabolites 2023, 13, 69. [Google Scholar] [CrossRef]
  49. Koonjoo, N.; Parzy, E.; Massot, P.; Lepetit-Coiffé, M.; Marque, S.R.A.; Franconi, J.M.; Thiaudiere, E.; Mellet, P. In vivo Overhauser-enhanced MRI of proteolytic activity. Contrast Media Mol. Imaging 2014, 9, 363–371. [Google Scholar] [CrossRef]
  50. Parzy, E.; Bouchaud, V.; Massot, P.; Voisin, P.; Koonjoo, N.; Moncelet, D.; Franconi, J.M.; Thiaudière, E.; Mellet, P. Overhauser-Enhanced MRI of Elastase Activity from In Vitro Human Neutrophil Degranulation. PLoS ONE 2013, 8, e57946. [Google Scholar] [CrossRef]
  51. Jugniot, N.; Duttagupta, I.; Rivot, A.; Massot, P.; Cardiet, C.; Pizzoccaro, A.; Jean, M.; Vanthuyne, N.; Franconi, J.M.; Voisin, P.; et al. An elastase activity reporter for Electronic Paramagnetic Resonance (EPR) and Overhauser-enhanced Magnetic Resonance Imaging (OMRI) as a line-shifting nitroxide. Free Radic. Biol. Med. 2018, 126, 101–112. [Google Scholar] [CrossRef] [PubMed]
  52. Buckenmaier, K.; Rudolph, M.; Fehling, P.; Steffen, T.; Back, C.; Bernard, R.; Pohmann, R.; Bernarding, J.; Kleiner, R.; Koelle, D.; et al. Mutual benefit achieved by combining ultralow-field magnetic resonance and hyperpolarizing techniques. Rev. Sci. Instrum. 2018, 89, 125103. [Google Scholar] [CrossRef]
  53. Waddington, D.E.J.; Sarracanie, M.; Salameh, N.; Herisson, F.; Ayata, C.; Rosen, M.S. An Overhauser-enhanced-MRI platform for dynamic free radical imaging in vivo. NMR Biomed. 2018, 31, e3896. [Google Scholar] [CrossRef] [PubMed]
  54. Bennati, M.; Orlando, T. Overhauser DNP in liquids on 13C nuclei. eMagRes 2019, 8, 11. [Google Scholar] [CrossRef]
  55. Shankar Palani, R.; Mardini, M.; Quan, Y.; Griffin, R.G. Dynamic nuclear polarization with trityl radicals. J. Magn. Reson. 2023, 349, 107411. [Google Scholar] [CrossRef]
  56. Ichikawa, K.; Yamato, M.; Naganuma, T. Biomedical Overhauser Magnetic Resonance Imaging (OMRI): Noninvasive Imaging of Redox Processes; Springer: Berlin/Heidelberg, Germany, 2020; pp. 221–229. [Google Scholar] [CrossRef]
  57. Kosem, N.; Naganuma, T.; Ichikawa, K.; Phumala Morales, N.; Yasukawa, K.; Hyodo, F.; Yamada, K.I.; Utsumi, H. Whole-body kinetic image of a redox probe in mice using Overhauser-enhanced MRI. Free Radic. Biol. Med. 2012, 53, 328–336. [Google Scholar] [CrossRef]
  58. Spada, A.; Emami, J.; Tuszynski, J.A.; Lavasanifar, A. The Uniqueness of Albumin as a Carrier in Nanodrug Delivery. Mol. Pharm. 2021, 18, 1862–1894. [Google Scholar] [CrossRef]
  59. Chubarov, A.; Spitsyna, A.; Krumkacheva, O.; Mitin, D.; Suvorov, D.; Tormyshev, V.; Fedin, M.; Bowman, M.K.; Bagryanskaya, E. Reversible Dimerization of Human Serum Albumin. Molecules 2021, 26, 108. [Google Scholar] [CrossRef]
  60. Ishima, Y.; Maruyama, T.; Otagiri, M.; Ishida, T. Drug delivery system for refractory cancer therapy via an endogenous albumin transport system. Chem. Pharm. Bull. 2020, 68, 583–588. [Google Scholar] [CrossRef]
  61. Lamichhane, S.; Lee, S. Albumin nanoscience: Homing nanotechnology enabling targeted drug delivery and therapy. Arch. Pharm. Res. 2020, 43, 118–133. [Google Scholar] [CrossRef] [PubMed]
  62. Chubarov, A.S.; Zakharova, O.D.; Koval, O.A.; Romaschenko, A.V.; Akulov, A.E.; Zavjalov, E.L.; Razumov, I.A.; Koptyug, I.V.; Knorre, D.G.; Godovikova, T.S. Design of protein homocystamides with enhanced tumor uptake properties for 19F magnetic resonance imaging. Bioorg. Med. Chem. 2015, 23, 6943–6954. [Google Scholar] [CrossRef]
  63. Lisitskiy, V.A.; Khan, H.; Popova, T.V.; Chubarov, A.S.; Zakharova, O.D.; Akulov, A.E.; Shevelev, O.B.; Zavjalov, E.L.; Koptyug, I.V.; Moshkin, M.P.; et al. Multifunctional human serum albumin-therapeutic nucleotide conjugate with redox and pH-sensitive drug release mechanism for cancer theranostics. Bioorg. Med. Chem. Lett. 2017, 27, 3925–3930. [Google Scholar] [CrossRef]
  64. Belinskaia, D.A.; Voronina, P.A.; Shmurak, V.I.; Jenkins, R.O.; Goncharov, N.V. Serum Albumin in Health and Disease: Esterase, Antioxidant, Transporting and Signaling Properties. Int. J. Mol. Sci. 2021, 22, 10318. [Google Scholar] [CrossRef] [PubMed]
  65. Asanbaeva, N.B.; Sukhanov, A.A.; Diveikina, A.A.; Rogozhnikova, O.Y.; Trukhin, D.V.; Tormyshev, V.M.; Chubarov, A.S.; Maryasov, A.G.; Genaev, A.M.; Shernyukov, A.V.; et al. Application of W-band 19F electron nuclear double resonance (ENDOR) spectroscopy to distance measurement using a trityl spin probe and a fluorine label. Phys. Chem. Chem. Phys. 2022, 24, 5982–6001. [Google Scholar] [CrossRef] [PubMed]
  66. Chubarov, A.S.; Shakirov, M.M.; Koptyug, I.V.; Sagdeev, R.Z.; Knorre, D.G.; Godovikova, T.S. Synthesis and characterization of fluorinated homocysteine derivatives as potential molecular probes for 19F magnetic resonance spectroscopy and imaging. Bioorg. Med. Chem. Lett. 2011, 21, 4050–4053. [Google Scholar] [CrossRef]
  67. Nishi, K.; Yamasaki, K.; Otagiri, M. Serum Albumin, Lipid and Drug Binding; Springer: Berlin/Heidelberg, Germany, 2020; Volume 94, ISBN 9783030417680. [Google Scholar]
  68. Vusse, G.J. van der Albumin as Fatty Acid Transporter. Drug Metab. Pharmacokinet. 2009, 24, 300–307. [Google Scholar] [CrossRef]
  69. Otagiri, M.; Giam Chuang, V.T. Albumin in Medicine: Pathological and Clinical Applications; Springer: Berlin/Heidelberg, Germany, 2016; pp. 1–277. [Google Scholar] [CrossRef]
  70. Kratz, F. Albumin as a drug carrier: Design of prodrugs, drug conjugates and nanoparticles. J. Control. Release 2008, 132, 171–183. [Google Scholar] [CrossRef]
  71. Kragh-Hansen, U. Albumin in Medicine; Springer: Berlin/Heidelberg, Germany, 2016; ISBN 978-981-10-2115-2. [Google Scholar]
  72. Sleep, D.; Cameron, J.; Evans, L.R. Albumin as a versatile platform for drug half-life extension. Biochim. Biophys. Acta 2013, 1830, 5526–5534. [Google Scholar] [CrossRef]
  73. Larsen, M.T.; Kuhlmann, M.; Hvam, M.L.; Howard, K.A. Albumin-based drug delivery: Harnessing nature to cure disease. Mol. Cell. Ther. 2016, 4, 3. [Google Scholar] [CrossRef] [PubMed]
  74. Sockolosky, J.T.; Szoka, F.C. The neonatal Fc receptor, FcRn, as a target for drug delivery and therapy. Adv. Drug Deliv. Rev. 2015, 91, 109–124. [Google Scholar] [CrossRef]
  75. Präbst, K.; Engelhardt, H.; Ringgeler, S.; Hübner, H. Basic Colorimetric Proliferation Assays: MTT, WST, and Resazurin. Methods Mol. Biol. 2017, 1601, 1–17. [Google Scholar] [CrossRef] [PubMed]
  76. Mosmann, T. Rapid colorimetric assay for cellular growth and survival: Application to proliferation and cytotoxicity assays. J. Immunol. Methods 1983, 65, 55–63. [Google Scholar] [CrossRef] [PubMed]
  77. Torricella, F.; Pierro, A.; Mileo, E.; Belle, V.; Bonucci, A. Nitroxide spin labels and EPR spectroscopy: A powerful association for protein dynamics studies. Biochim. Biophys. Acta-Proteins Proteom. 2021, 1869, 140653. [Google Scholar] [CrossRef]
  78. Ackermann, K.; Chapman, A.; Bode, B.E. A comparison of cysteine-conjugated nitroxide spin labels for pulse dipolar epr spectroscopy. Molecules 2021, 26, 7534. [Google Scholar] [CrossRef] [PubMed]
  79. Ahn, M.; Waudby, C.A.; Bernardo-Gancedo, A.; De Genst, E.; Dhulesia, A.; Salvatella, X.; Christodoulou, J.; Dobson, C.M.; Kumita, J.R. Application of Lysine-specific Labeling to Detect Transient Interactions Present during Human Lysozyme Amyloid Fibril Formation. Sci. Rep. 2017, 7, 15018. [Google Scholar] [CrossRef]
  80. Dharmarwardana, M.; Martins, A.F.; Chen, Z.; Palacios, P.M.; Nowak, C.M.; Welch, R.P.; Li, S.; Luzuriaga, M.A.; Bleris, L.; Pierce, B.S.; et al. Nitroxyl Modified Tobacco Mosaic Virus as a Metal-Free High-Relaxivity MRI and EPR Active Superoxide Sensor. Mol. Pharm. 2018, 15, 2973–2983. [Google Scholar] [CrossRef]
  81. Petrov, K.D.; Chubarov, A.S. Magnetite Nanoparticles for Biomedical Applications. Encyclopedia 2022, 2, 1811–1828. [Google Scholar] [CrossRef]
  82. Sikora, M.; Marczak, Ł.; Kubalska, J.; Graban, A.; Jakubowski, H. Identification of N-homocysteinylation sites in plasma proteins. Amino Acids 2014, 46, 235–244. [Google Scholar] [CrossRef]
  83. Marczak, L.; Sikora, M.; Stobiecki, M.; Jakubowski, H. Analysis of site-specific N-homocysteinylation of human serum albumin in vitro and in vivo using MALDI-ToF and LC-MS/MS mass spectrometry. J. Proteom. 2011, 74, 967–974. [Google Scholar] [CrossRef]
  84. Sikora, M.; Marczak, Ł.; Twardowski, T.; Stobiecki, M.; Jakubowski, H. Direct monitoring of albumin lysine-525 N-homocysteinylation in human serum by liquid chromatography/mass spectrometry. Anal. Biochem. 2010, 405, 132–134. [Google Scholar] [CrossRef]
  85. Popova, T.V.; Krumkacheva, O.A.; Burmakova, A.S.; Spitsyna, A.S.; Zakharova, O.D.; Lisitskiy, V.A.; Kirilyuk, I.A.; Silnikov, V.N.; Bowman, M.K.; Bagryanskaya, E.G.; et al. Protein modification by thiolactone homocysteine chemistry: A multifunctionalized human serum albumin theranostic. RSC Med. Chem. 2020, 11, 1314–1325. [Google Scholar] [CrossRef]
  86. Iannuzzi, C.; Irace, G.; Sirangelo, I. Role of Glycation in Amyloid: Effect on the Aggregation Process and Cytotoxicity. In Exploring New Findings on Amyloidosis; Intechopen: London, UK, 2016. [Google Scholar] [CrossRef]
  87. Watanabe, H.; Imafuku, T.; Otagiri, M.; Maruyama, T. Clinical Implications Associated With the Posttranslational Modification–Induced Functional Impairment of Albumin in Oxidative Stress–Related Diseases. J. Pharm. Sci. 2017, 106, 2195–2203. [Google Scholar] [CrossRef] [PubMed]
  88. Yiannios, C.N.; Karabinos, J.V. Oxidation of Thiols by Dimethyl Sulfoxide. J. Org. Chem. 1963, 28, 3246–3248. [Google Scholar] [CrossRef]
  89. Papanyan, Z.K. Interaction of L-cysteine with dimethyl sulfoxide in mild conditions. Proc. Yerevan State Univ. 2013, 2, 11–14. [Google Scholar]
  90. Sterling, H.J.; Prell, J.S.; Cassou, C.A.; Williams, E.R. Protein conformation and supercharging with DMSO from aqueous solution. J. Am. Soc. Mass Spectrom. 2011, 22, 1178–1186. [Google Scholar] [CrossRef] [PubMed]
  91. Taratayko, A.I.; Glazachev, Y.I.; Eltsov, I.V.; Chernyak, E.I.; Kirilyuk, I.A. 3,4-Unsubstituted 2-tert-Butyl-pyrrolidine-1-oxyls with Hydrophilic Functional Groups in the Side Chains. Molecules 2022, 27, 1922. [Google Scholar] [CrossRef] [PubMed]
  92. Brewer, C.F.; Riehm, J.P. Evidence for possible nonspecific reactions between N-ethylmaleimide and proteins. Anal. Biochem. 1967, 18, 248–255. [Google Scholar] [CrossRef]
  93. Cornell, C.N.; Chang, R.; Kaplan, L.J. The environment of the sulfhydryl group in human plasma albumin as determined by spin labeling. Arch. Biochem. Biophys. 1981, 209, 1–6. [Google Scholar] [CrossRef]
  94. Perczel, A.; Hollósi, M.; Tusnády, G.; Fasman, G.D. Convex constraint analysis: A natural deconvolution of circular dichroism curves of proteins. Protein Eng. 1991, 4, 669–679. [Google Scholar] [CrossRef]
  95. Varkovitzky, R.L. Assimilation, accommodation, and overaccommodation: An examination of information processing styles in female victims of adolescent and adult sexual assault. ProQuest Diss. Theses 2012, 1, 218. [Google Scholar] [CrossRef]
  96. Sowiński, M.P.; Gahlawat, S.; Lund, B.A.; Warnke, A.L.; Hopmann, K.H.; Lovett, J.E.; Haugland, M.M. Conformational tuning improves the stability of spirocyclic nitroxides with long paramagnetic relaxation times. Commun. Chem. 2023, 6, 4–11. [Google Scholar] [CrossRef]
  97. Soule, B.P.; Hyodo, F.; Matsumoto, K.-I.; Simone, N.L.; Cook, J.A.; Krishna, M.C.; Mitchell, J.B. The chemistry and biology of nitroxide compounds. Free Radic. Biol. Med. 2007, 42, 1632–1650. [Google Scholar] [CrossRef]
  98. Paletta, J.T.; Pink, M.; Foley, B.; Rajca, S.; Rajca, A. Synthesis and reduction kinetics of sterically shielded pyrrolidine nitroxides. Org. Lett. 2012, 14, 5322–5325. [Google Scholar] [CrossRef]
  99. Bobko, A.A.; Kirilyuk, I.A.; Grigor’ev, I.A.; Zweier, J.L.; Khramtsov, V.V. Reversible reduction of nitroxides to hydroxylamines: Roles for ascorbate and glutathione. Free Radic. Biol. Med. 2007, 42, 404–412. [Google Scholar] [CrossRef]
  100. Kirilyuk, I.A.; Polienko, Y.F.; Krumkacheva, O.A.; Strizhakov, R.K.; Gatilov, Y.V.; Grigor’ev, I.A.; Bagryanskaya, E.G. Synthesis of 2,5-bis(spirocyclohexane)-substituted nitroxides of pyrroline and pyrrolidine series, including thiol-specific spin label: An analogue of MTSSL with long relaxation time. J. Org. Chem. 2012, 77, 8016–8027. [Google Scholar] [CrossRef]
  101. Jagtap, A.P.; Krstic, I.; Kunjir, N.C.; Hänsel, R.; Prisner, T.F.; Sigurdsson, S.T. Sterically shielded spin labels for in-cell EPR spectroscopy: Analysis of stability in reducing environment. Free Radic. Res. 2015, 49, 78–85. [Google Scholar] [CrossRef]
  102. Koyanagi, M.; Kawakabe, S.; Arimura, Y. A comparative study of colorimetric cell proliferation assays in immune cells. Cytotechnology 2016, 68, 1489–1498. [Google Scholar] [CrossRef]
  103. Chou, C.; Abdesselem, M.; Bouzigues, C.; Chu, M.; Guiga, A.; Huang, T.; Ferrage, F.; Gacoin, T.; Alexandrou, A. Ultra-wide range field-dependent measurements of the relaxivity of Gd1−xEuxVO4 nanoparticle contrast agents using a mechanical sample-shuttling relaxometer. Sci. Rep. 2017, 7, 44770. [Google Scholar] [CrossRef]
  104. Hagberg, G.E.; Schef, K. Effect of r 1 and r 2 relaxivity of gadolinium-based contrast agents on the T 1 -weighted MR signal at increasing magnetic fi eld strengths. Contrast Media Mol. Imaging 2013, 8, 456–465. [Google Scholar] [CrossRef]
  105. Ta, H.T.; Li, Z.; Wu, Y.; Cowin, G.; Zhang, S.; Yago, A.; Whittaker, A.K. Effects of magnetic field strength and particle aggregation on relaxivity of ultra-small dual contrast iron oxide nanoparticles. Mater. Res. Express 2017, 4, 116105. [Google Scholar] [CrossRef]
  106. Blockley, N.P.; Jiang, L.; Gardener, A.G.; Ludman, C.N.; Francis, S.T.; Gowland, P.A. Field strength dependence of R1 and R2* relaxivities of human whole blood to ProHance, vasovist, and deoxyhemoglobin. Magn. Reson. Med. 2008, 60, 1313–1320. [Google Scholar] [CrossRef] [PubMed]
  107. Pintaske, J.; Martirosian, P.; Graf, H.; Erb, G.; Lodemann, K.-P.; Claussen, C.D.; Schick, F. Relaxivity of Gadopentetate Dimeglumine (Magnevist), Gadobutrol (Gadovist), and Gadobenate Dimeglumine (MultiHance) in human blood plasma at 0.2, 1.5, and 3 Tesla. Investig. Radiol. 2006, 41, 213–221. [Google Scholar] [CrossRef] [PubMed]
  108. Cox, B.; Ludwig, K.; Adamsom, E.; Eliceiri, K.; Fain, S. An open source, 3D printed preclinical MRI phantom for repeated measures of contrast agents and reference standards. Biomed. Phys. Eng. Express 2018, 4, 027005. [Google Scholar] [CrossRef] [PubMed]
  109. Fanali, G.; di Masi, A.; Trezza, V.; Marino, M.; Fasano, M.; Ascenzi, P. Human serum albumin: From bench to bedside. Mol. Asp. Med. 2012, 33, 209–290. [Google Scholar] [CrossRef] [PubMed]
  110. Parodi, A.; Miao, J.; Soond, S.M.; Rudzińska, M.; Zamyatnin, A.A. Albumin nanovectors in cancer therapy and imaging. Biomolecules 2019, 9, 218. [Google Scholar] [CrossRef]
  111. Mitin, D.E.; Chubarov, A.S. Fluorinated Human Serum Albumin as Potential 19F Magnetic Resonance Imaging Probe. Molecules 2023, 28, 1695. [Google Scholar] [CrossRef]
  112. Mei, J.; Tian, H. Most recent advances on enzyme-activatable optical probes for bioimaging. Aggregate 2021, 2, e32. [Google Scholar] [CrossRef]
  113. Solomon, M.; Berezin, Y.; Achilefu, S. Optical Imaging in Cancer Research: Basic Principles, Tumor Detectio, and Therapeutic Monitoring. Med. Princ. Pract. 2011, 63110, 397–415. [Google Scholar] [CrossRef]
  114. Vizovisek, M.; Ristanovic, D.; Menghini, S.; Christiansen, M.G.; Schuerle, S. The Tumor Proteolytic Landscape: A Challenging Frontier in Cancer Diagnosis and Therapy. Int. J. Mol. Sci. 2021, 22, 2514. [Google Scholar] [CrossRef]
  115. Sleep, D.; Sleep, D. Albumin and its application in drug delivery. Expert Opin. Drug Deliv. 2015, 12, 793–812. [Google Scholar] [CrossRef] [PubMed]
  116. Park, K.C.; Dharmasivam, M.; Richardson, D.R. The role of extracellular proteases in tumor progression and the development of innovative metal ion chelators that inhibit their activity. Int. J. Mol. Sci. 2020, 21, 6805. [Google Scholar] [CrossRef] [PubMed]
  117. Fan, Y.; Chen, L.; Zheng, Y.; Li, A.; Lin, H.; Gao, J. Nanoparticle-Based Activatable MRI Probes for Disease Imaging and Monitoring. Chem. Biomed. Imaging 2023, 1, 192–204. [Google Scholar] [CrossRef]
  118. Karthikeyan, G.; Bonucci, A.; Casano, G.; Gerbaud, G.; Abel, S.; Thomé, V.; Kodjabachian, L.; Magalon, A.; Guigliarelli, B.; Belle, V.; et al. A Bioresistant Nitroxide Spin Label for In-Cell EPR Spectroscopy: In Vitro and In Oocytes Protein Structural Dynamics Studies. Angew. Chem. 2018, 130, 1380–1384. [Google Scholar] [CrossRef]
  119. Dobrynin, S.A.; Usatov, M.S.; Zhurko, I.F.; Morozov, D.A.; Polienko, Y.F.; Glazachev, Y.I.; Parkhomenko, D.A.; Tyumentsev, M.A.; Gatilov, Y.V.; Chernyak, E.I.; et al. A Simple Method of Synthesis of 3-Carboxy-2,2,5,5-Tetraethylpyrrolidine-1-oxyl and Preparation of Reduction-Resistant Spin Labels and Probes of Pyrrolidine Series. Molecules 2021, 26, 5761. [Google Scholar] [CrossRef]
  120. Ellman, G.L. Tissue Sulfhydryl Groups. Arch. Biochem. Biophys. 1959, 82, 70–77. [Google Scholar] [CrossRef] [PubMed]
  121. Niedermeyer, T.H.J.; Strohalm, M. mMass as a Software Tool for the Annotation of Cyclic Peptide Tandem Mass Spectra. PLoS ONE 2012, 7, e44913. [Google Scholar] [CrossRef] [PubMed]
  122. Strohalm, M.; Kavan, D.; Novák, P.; Volný, M.; Havlíček, V. MMass 3: A cross-platform software environment for precise analysis of mass spectrometric data. Anal. Chem. 2010, 82, 4648–4651. [Google Scholar] [CrossRef]
  123. Marinas, M.; Sa, E.; Rojas, M.M.; Moalem, M.; Urbano, F.J.; Guillou, C.; Rallo, L. A nuclear magnetic resonance (1H and 13C) and isotope ratio mass spectrometry (δ13C, δ2H and δ18O) study of Andalusian olive oils. Rapid Commun. Mass Spectrom. 2010, 24, 1457–1466. [Google Scholar] [CrossRef]
  124. Stoll, S.; Schweiger, A. EasySpin, a comprehensive software package for spectral simulation and analysis in EPR. J. Magn. Reson. 2006, 178, 42–55. [Google Scholar] [CrossRef]
  125. Stoll, S.; Schweiger, A. EasySpin: Simulating cw ESR spectra. Biol. Magn. Reson. 2007, 27, 299–321. [Google Scholar]
  126. Krumkacheva, O.A.; Timofeev, I.O.; Politanskaya, L.V.; Polienko, Y.F.; Tretyakov, E.V.; Rogozhnikova, O.Y.; Trukhin, D.V.; Tormyshev, V.M.; Chubarov, A.S.; Bagryanskaya, E.G.; et al. Triplet Fullerenes as Prospective Spin Labels for Nanoscale Distance Measurements by Pulsed Dipolar EPR. Angew. Chem. Int. Ed. 2019, 58, 13271–13275. [Google Scholar] [CrossRef] [PubMed]
Figure 1. Protein acylation by HTL with subsequent reaction with a maleimide derivative.
Ijms 25 04041 g001
Figure 2. Homocysteine thiolactone and maleimide nitroxide derivatives.
Ijms 25 04041 g002
Figure 3. HSA-NIT conjugate synthesis schemes. HSA is shown schematically as a helical ribbon structure.
Ijms 25 04041 g003
Figure 4. SDS-PAGE of HSA-NIT under Laemmli conditions with subsequent Coomassie blue staining. Control monomer fraction of HSA (lane 1). Method 1 synthesis: HSA-Et (lane 2), HSA-Me (lane 3), HSA-Me/Me-mal (lane 5), HSA-Et/Et-mal (lane 7). Method 2: HSA-Me/Me-mal (lane 4), HSA-Et/Et-mal (lane 6).
Ijms 25 04041 g004
Figure 5. Method 3 of HSA-Me/Me-mal and HSA-Et/Et-mal synthesis.
Ijms 25 04041 g005
Figure 6. Cytotoxicity assay on MCF-7 and T98G cell cultures for HSA-NIT conjugates. Cell viability was normalized using cells treated with PBS buffer as a 100% viability control.
Ijms 25 04041 g006
Figure 7. Relaxivities r1 and r2 (per protein molecule concentration, mM−1s−1), and r2/r1 ratio for HSA-NIT conjugates per magnetic field. The legend for three pictures is presented on the left.
Ijms 25 04041 g007
Figure 8. T1- and T2-weighted MRI images of HSA-NIT containing phantoms at 25 °C in a 3 T MRI scanner in three HSA-NIT concentrations (0.25 mM, 0.05 mM, and 0.005 mM). MRI images of phantoms at various HSA-NIT concentrations (0.25–0.005 mM per HSA and 0.5–0.05 mM per nitroxide) are presented in Figure S9.
Ijms 25 04041 g008
Figure 9. Susceptibility of HSA or HSA-NIT to trypsinolysis analyzed by SDS-PAGE (Figure S11).
Ijms 25 04041 g009
Figure 10. T1 and T2 relaxation time changes for trypsinolysis of HSA-NIT per time.
Ijms 25 04041 g010
Figure 11. (a) Real-time measurement of ODNP enhancement during proteolysis. Circles represent measurement points and lines the fitted exponential curves (Equation (1); for fitting parameters see Table 3). (b) ODNP spectra of HSA-Et/Et-mal T before and after the cleavage process (~20 h after injection of trypsin). The sample name has been extended to include the type of protease, either C or T.
Ijms 25 04041 g011
Figure 12. Schematic of the used sequences for the ODNP efficacy characterization.
Ijms 25 04041 g012
Table 1. HSA-NIT conjugate secondary structure.
SampleNIT Residue Per HSA MoleculeCD Spectral Analysis
α-Helix, %β-Sheet, %
Monomer HSA-55.0 ± 1.04.8 ± 1.0
HSA-Me13.7 ± 0.749.2 ± 1.55.9 ± 0.6
HSA-Me-mal16.4 ± 0.944.3 ± 1.78.1 ± 0.6
HSA-Me/Me-mal17.1 ± 1.043.7 ± 2.07.8 ± 0.8
HSA-Et13.1 ± 0.248.8 ± 1.46.4 ± 0.6
HSA-Et-mal21.9 ± 1.044.1 ± 1.710.9 ± 0.7
HSA-Et/Et-mal20.8 ± 1.143.5 ± 2.09.7 ± 0.8
Table 2. Second-order rate constants *, k (M−1s−1) of HSA-NIT reduction in PBS (pH 7.4) at 25 °C by EPR and T1 relaxation time measuring.
SampleMethodkinit, M−1s−1k“free” NIT, M−1s−1
HSA-MeEPR0.044 ± 0.0060.097 [100],
0.063 [98]
T1-meas.0.027 ± 0.005
HSA-Me-MalEPR0.041 ± 0.006
HSA-Me/Me-MalEPR0.043 ± 0.008
T1-meas.0.033 ± 0.006
HSA-EtEPR0.0019 ± 0.00050.001 [98],
0.002 [101]
T1-meas.0.0015 ± 0.0001
HSA-Et-MalEPR0.0016 ± 0.0004
HSA-Et/Et-MalEPR0.0015 ± 0.0004
T1-meas.0.0007 ± 0.0001
* The kinetics of nitroxide reduction in the presence of ascorbate/glutathione are summarized in Figures S7 and S8.
Table 3. Characterization of ODNP efficacy and reaction kinetics of HSA-NIT conjugates after proteolysis.
SampleA1A2τ1 [1/h]τ2 [1/h]P1/2 [W]|Emax|
HSA-Me-mal C *−7.4 ± 0.1−7.2 ± 0.16.9 ± 0.20.9 ± 0.110.8 ± 1.254 ± 3
HSA-Me/Me-mal C−5.7 ± 0.3−8.4 ± 0.38.3 ± 0.91.4 ± 0.110.3 ± 1.250 ± 3
HSA-Me/Me-mal T−8.7 ± 0.4−4.0 ± 0.52.8 ± 0.20.5 ± 0.110.9 ± 1.147 ± 2
HSA-Et-mal C−2.8 ± 0.1−3.9 ± 0.318.2 ± 7.42.7 ± 0.322.6 ± 3.945 ± 5
HSA-Et/Et-mal C−6.2 ± 0.13.9 ± 0.121.2 ± 4.039 ± 5
HSA-Et/Et-mal T−2.4 ± 0.1−3.6 ± 0.16.9 ± 0.61.4 ± 0.124.3 ± 3.142 ± 3
* The sample name has been extended to include the type of protease, either C or T, for which the reaction kinetics were monitored.
Disclaimer/Publisher’s Note: The statements, opinions and data contained in all publications are solely those of the individual author(s) and contributor(s) and not of MDPI and/or the editor(s). MDPI and/or the editor(s) disclaim responsibility for any injury to people or property resulting from any ideas, methods, instructions or products referred to in the content.

