Abstract
Pancreatic ductal adenocarcinoma (PDAC) is highly malignant, with a 5-year survival rate of less than 10%. Furthermore, the acquisition of anticancer drug resistance makes PDAC treatment difficult. We established MIA-GEM cells, a PDAC cell line resistant to gemcitabine (GEM), a first-line anticancer drug, using the human PDAC cell line—MIA-PaCa-2. Microtubule-associated serine/threonine kinase-4 (MAST4) expression was increased in MIA-GEM cells compared with the parent cell line. Through inhibitor screening, dysregulated AKT signaling was identified in MIA-GEM cells with overexpression of AKT3. MAST4 knockdown effectively suppressed AKT3 overexpression, and both MAST4 and AKT3 translocation into the nucleus, phosphorylating forkhead box O3a (FOXO3) in MIA-GEM cells. Modulating FOXO3 target gene expression in these cells inhibited apoptosis while promoting stemness and proliferation. Notably, nuclear MAST4 demonstrated higher expression in GEM-resistant PDAC cases compared with that in the GEM-sensitive cases. Elevated MAST4 expression correlated with a poorer prognosis in PDAC. Consequently, nuclear MAST4 emerges as a potential marker for GEM resistance and poor prognosis, representing a novel therapeutic target for PDAC.
1. Introduction
Pancreatic cancer is the third commonest cause of cancer-related deaths in Japan and the United States. In Japan, 44,000 people develop the disease, and 38,000 die annually [1], whereas in the United States, 64,050 people develop the disease and 50,550 die annually [2]. Pancreatic cancer incidence continues to increases and is predicted to become the second leading cause of cancer-related deaths in 10 years [3]. Pancreatic ductal adenocarcinoma (PDAC) is highly malignant, with distant metastasis in 50% of presenting cases and curative resection achieved in only 15–20% of cases [4,5]. PDAC has a poor prognosis, even with multidisciplinary treatment, with an overall 5-year survival rate of only 8.5% [1]. Consequently, anticancer drugs are becoming crucial. However, anticancer drug resistance frequently occurs during PDAC chemotherapy, making treatment difficult [6].
Resistance to gemcitabine (GEM), one of major anticancer drugs against PDAC, develops soon after its administration [6]. Cancer cell stemness significantly contributes to its resistance despite the multifactorial underlying mechanism [7]. In our previous study, we examined GEM-resistant PDAC cell lines induced by continuous GEM treatment and observed multiple drug resistance; however, we did not observe the induction of known resistance genes, such as multiple drug resistant gene or deoxycytidine kinase [8,9]. Furthermore, altered energy metabolism and enhanced stemness in these resistant cell lines contribute to anticancer drug resistance in PDAC [8,9].
MAST4 is a microtubule-associated serine/threonine kinase family gene with unclear substrates, although a few have been reported, including sox9 (SRY-box9), ERM (erythromycin ribosome methylase), and Rhotekin [10,11,12]. MAST4 mutations are associated with neurodevelopmental disorders, developmental delay, and infantile spasms [13]. MAST4 maintains and enhances stemness, such as in sperm stem cells [14], suppresses mesenchymal stem cell differentiation, and promotes β-catenin nuclear translocation [15]. Some reports of its association with cancer exist. Estrogen signaling negatively regulates multiple myeloma-associated bone lesions through MAST4. The reason behind this is the regulation of the PI3-kinase and mTOR pathways by MAST4 [16]. Underexpression of MAST4 is associated with survival in breast cancer patients [17]. Moreover, suppression of MAST4 was found to be correlated with treatment outcome in breast cancer [18].
Thus, to date, no common multifactorial genetic changes have been associated with GEM resistance acquisition in PDAC. Therefore, we established a GEM-resistant PDAC cell line and searched for genes responsible for the differences in gene expression profiles compared with those in the parent line.
2. Results
2.1. Establishment of GEM-Resistant PDAC Cells
MIA-GEM cells were established by continuously treating MIA-PaCa-2 cells with low-dose GEM to induce resistance. GEM IC50 was increased to 3.5 μM, compared with 0.2 nM for the parent cell line (MIA-P cells) (Figure 1A). MIA-GEM cells were spindle-shaped compared with polygonal MIA-P cells (Figure 1B), and their proliferation rate was reduced to 62% of that of MIA-P cells (Figure 1C). Inducing apoptosis by GEM was reduced in MIA-GEM cells; however, the invasive ability of MIA-GEM cells was enhanced (Figure 1D,E). Sphere-forming ability of MIA-GEM cells was higher than that of MIA-P cells. Spheres of MIA-GEM cells showed resistance to GEM (Figure 1F). The expression of stemness markers, and E-cadherin expression decreased in MIA-GEM cells, while CD44, CD24, and nucleostemin (NS) expression increased (Figure 1G,H). Therefore, MIA-GEM cells acquired GEM resistance, enhanced stemness, and induced epithelial–mesenchymal transition.
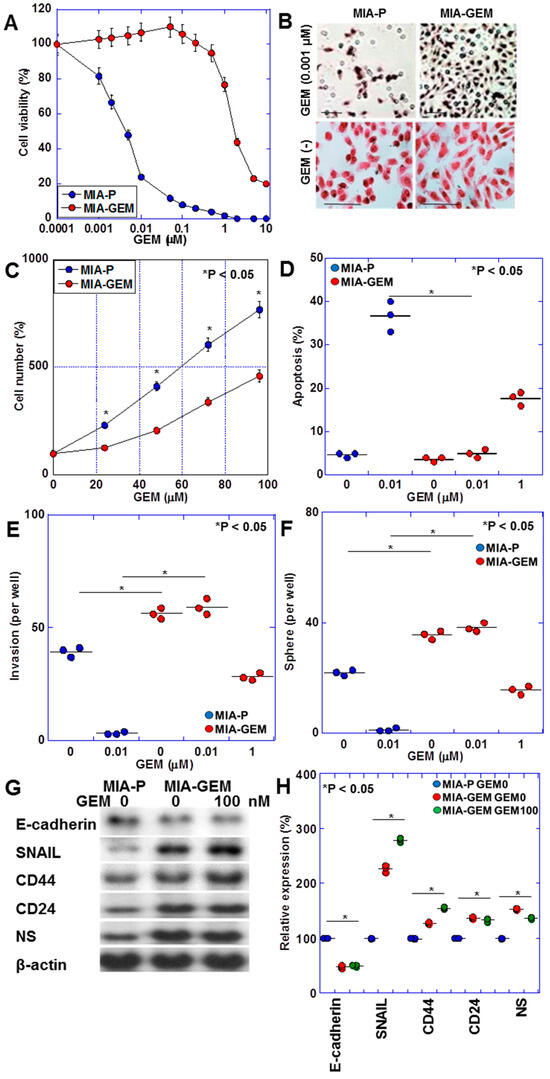
Figure 1.
GEM-resistant cell line derived from human PDAC cell line—MIA-PaCa-2. (A) GEM sensitivity of MIA-P and MIA-GEM cells. (B–G) Characteristics of MIA-GEM cells in comparison with MIA-P cells: morphology (B), cell growth (C), GEM-induced apoptosis (D), in vitro invasion (E), sphere formation (F), and expression of stemness-related genes (G) with the semi-quantification (H). Scale bar, 50 μm. Error bars represent the standard deviations from three independent trials. Statistical differences were calculated using Student’s t-test. PDAC, pancreatic ductal adenocarcinoma; MIA-P, parental MIA-PaCa-2; MIA-GEM, gemcitabine-resistant MIA-PaCa-2; GEM, gemcitabine; NS, nucleostemin.
2.2. Gene Expression Changes in GEM-Resistant PDAC Cells
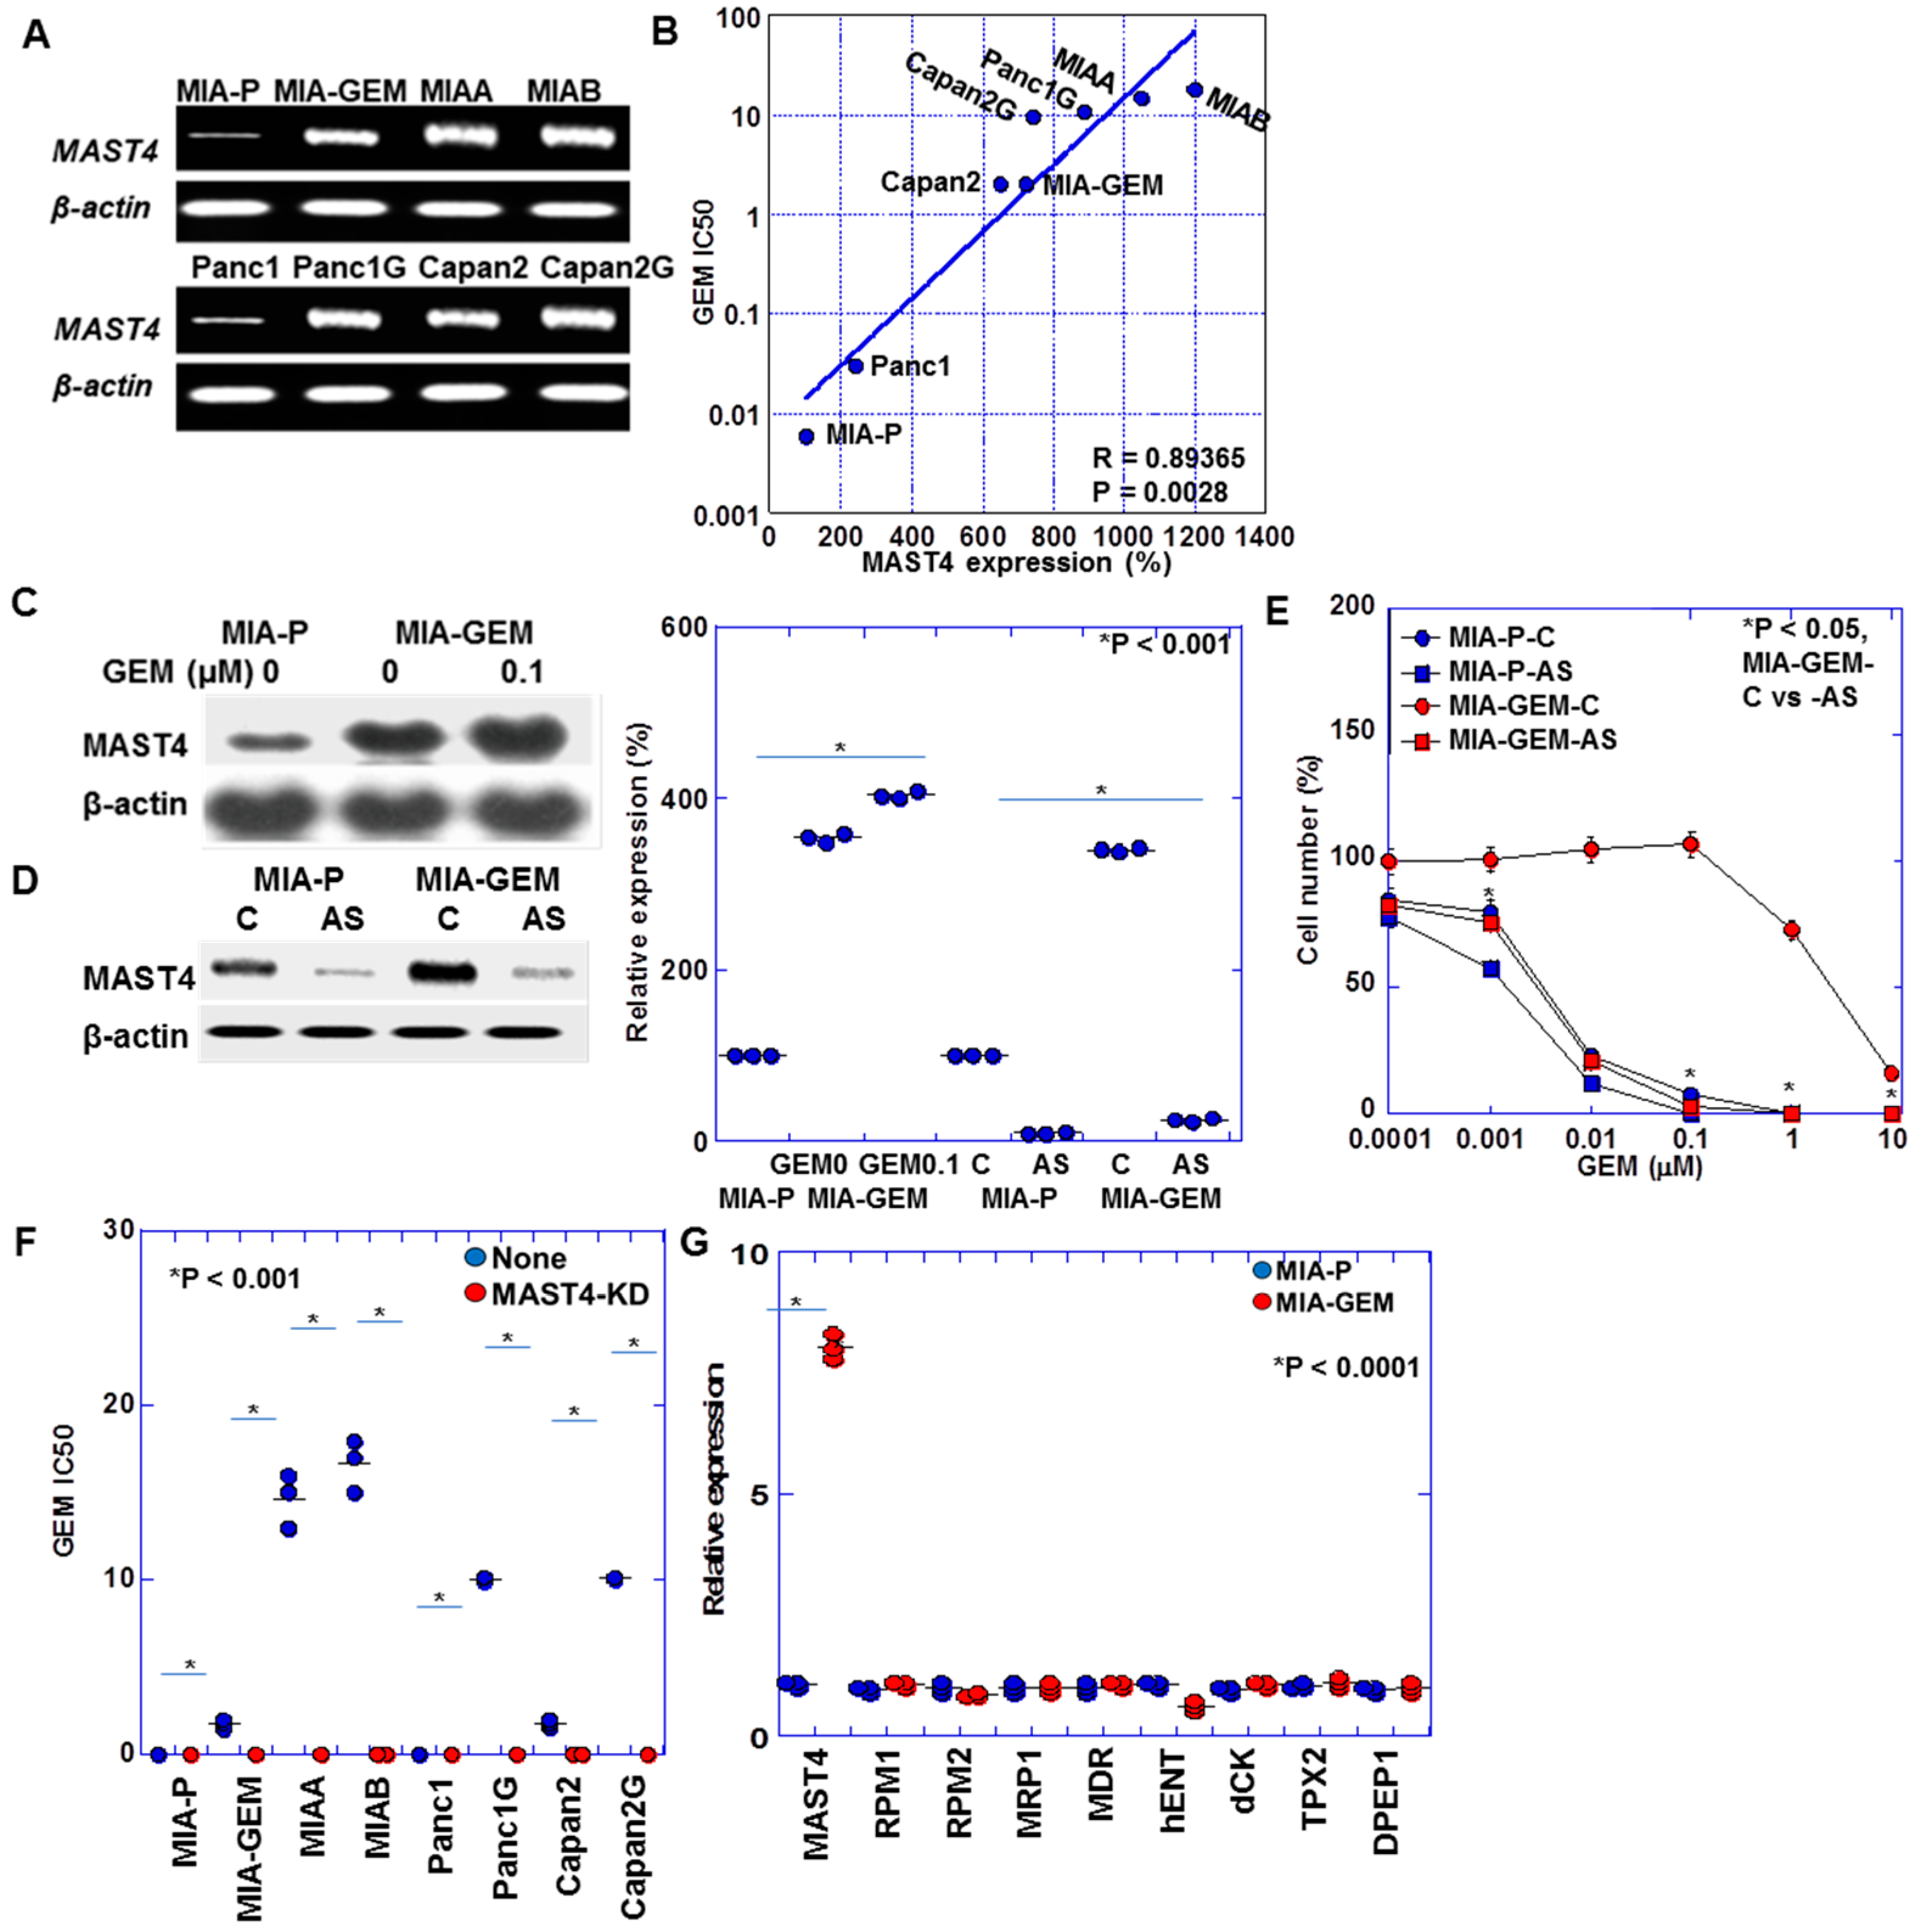
Table 1 summarizes the gene expression profile differences between MIA-GEM and MIA-P cells. A 7.18-fold increase in MAST4 expression occurred in MIA-GEM cells. Furthermore, a 7.9-fold increase in MAST4 expression was observed in MIA-GEM cells compared with that in MIA-P cells after reverse transcription polymerase chain reaction (Figure 2A). The other altered gene expression changes downregulated and upregulated patterns, which were 5–7-fold increased and 0.12–0.24-fold decreased. We investigated MAST4, which showed the most significant increase. Further examination of MAST4 expression in other established GEM-resistant cell lines [8] revealed a MAST4 overexpression in comparison to all parental cells. Increased MAST4 expression correlated with increased IC50 after GEM sensitivity evaluation (Figure 2B). Furthermore, GEM treatment increased MAST4 expression in the MIA-GEM cells (Figure 2C). The GEM sensitivity of MIA-GEM cells was equivalent to that of MIA-P cells after subsequent MAST4 knockdown using antisense phosphorothioate (S)-oligodeoxynucleotide DNA (Figure 2D,E). When MAST4 was knocked down in five GEM-resistant cell lines including MIA-G, GEM sensitivity increased to the level of the parent strain in all cell lines (Figure 2F). No significant increase in known GEM resistance-related gene expression in PDAC was observed in MIA-GEM cells (Figure 2G) [19,20,21,22].

Table 1.
Altered gene expression in MIA-GEM cells from MIA-P cells.
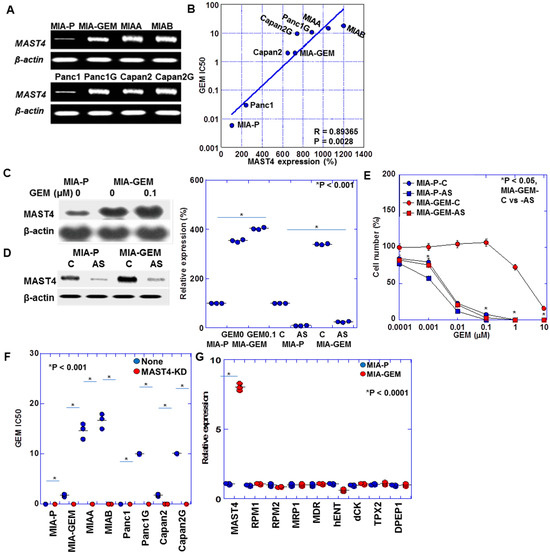
Figure 2.
MAST4 expression in PDAC cells. (A) MAST4 expression in GEM-resistant human PDAC cells. (B) Relationship between MAST4 expression and GEM IC50. (C) MAST4 protein in GEM-treated MIA-GEM cells. (D) MAST4 knockdown by AS. Right panel, semi-quantification of (C,D). (E) GEM sensitivity in MAST4-knocked down MIA-GEM cells. (F) GEM sensitivity in MAST4-knocked down PDAC cells. (G) Expression of known GEM-resistant genes. Error bar, standard deviation from three independent trials. Statistical differences were calculated using Student’s t-test. PDAC, pancreatic ductal adenocarcinoma; MIA-P, parental MIA-PaCa-2; MIA-GEM, GEM-resistant MIA-PaCa-2; GEM, gemcitabine; MAST4, microtubule-associated serine/threonine kinase family member 4; MIAA, MIAB; GEM-resistant MIA-PaCa-2 [8]; Panc1G, GEM-resistant Panc1 [8]; Capan2G, GEM-resistant Capan2 [8]; IC50, 50% inhibition concentration; C, sense S-oligonucleotide; AS, antisense S-oligonucleotide; RPM, NB-ARC domain-containing disease resistance protein; MRP, melittin-derived peptide; MDR, multiple drug resistance; hENT, human equilibrative nucleoside transporter; dCK, deoxycytidine kinase.
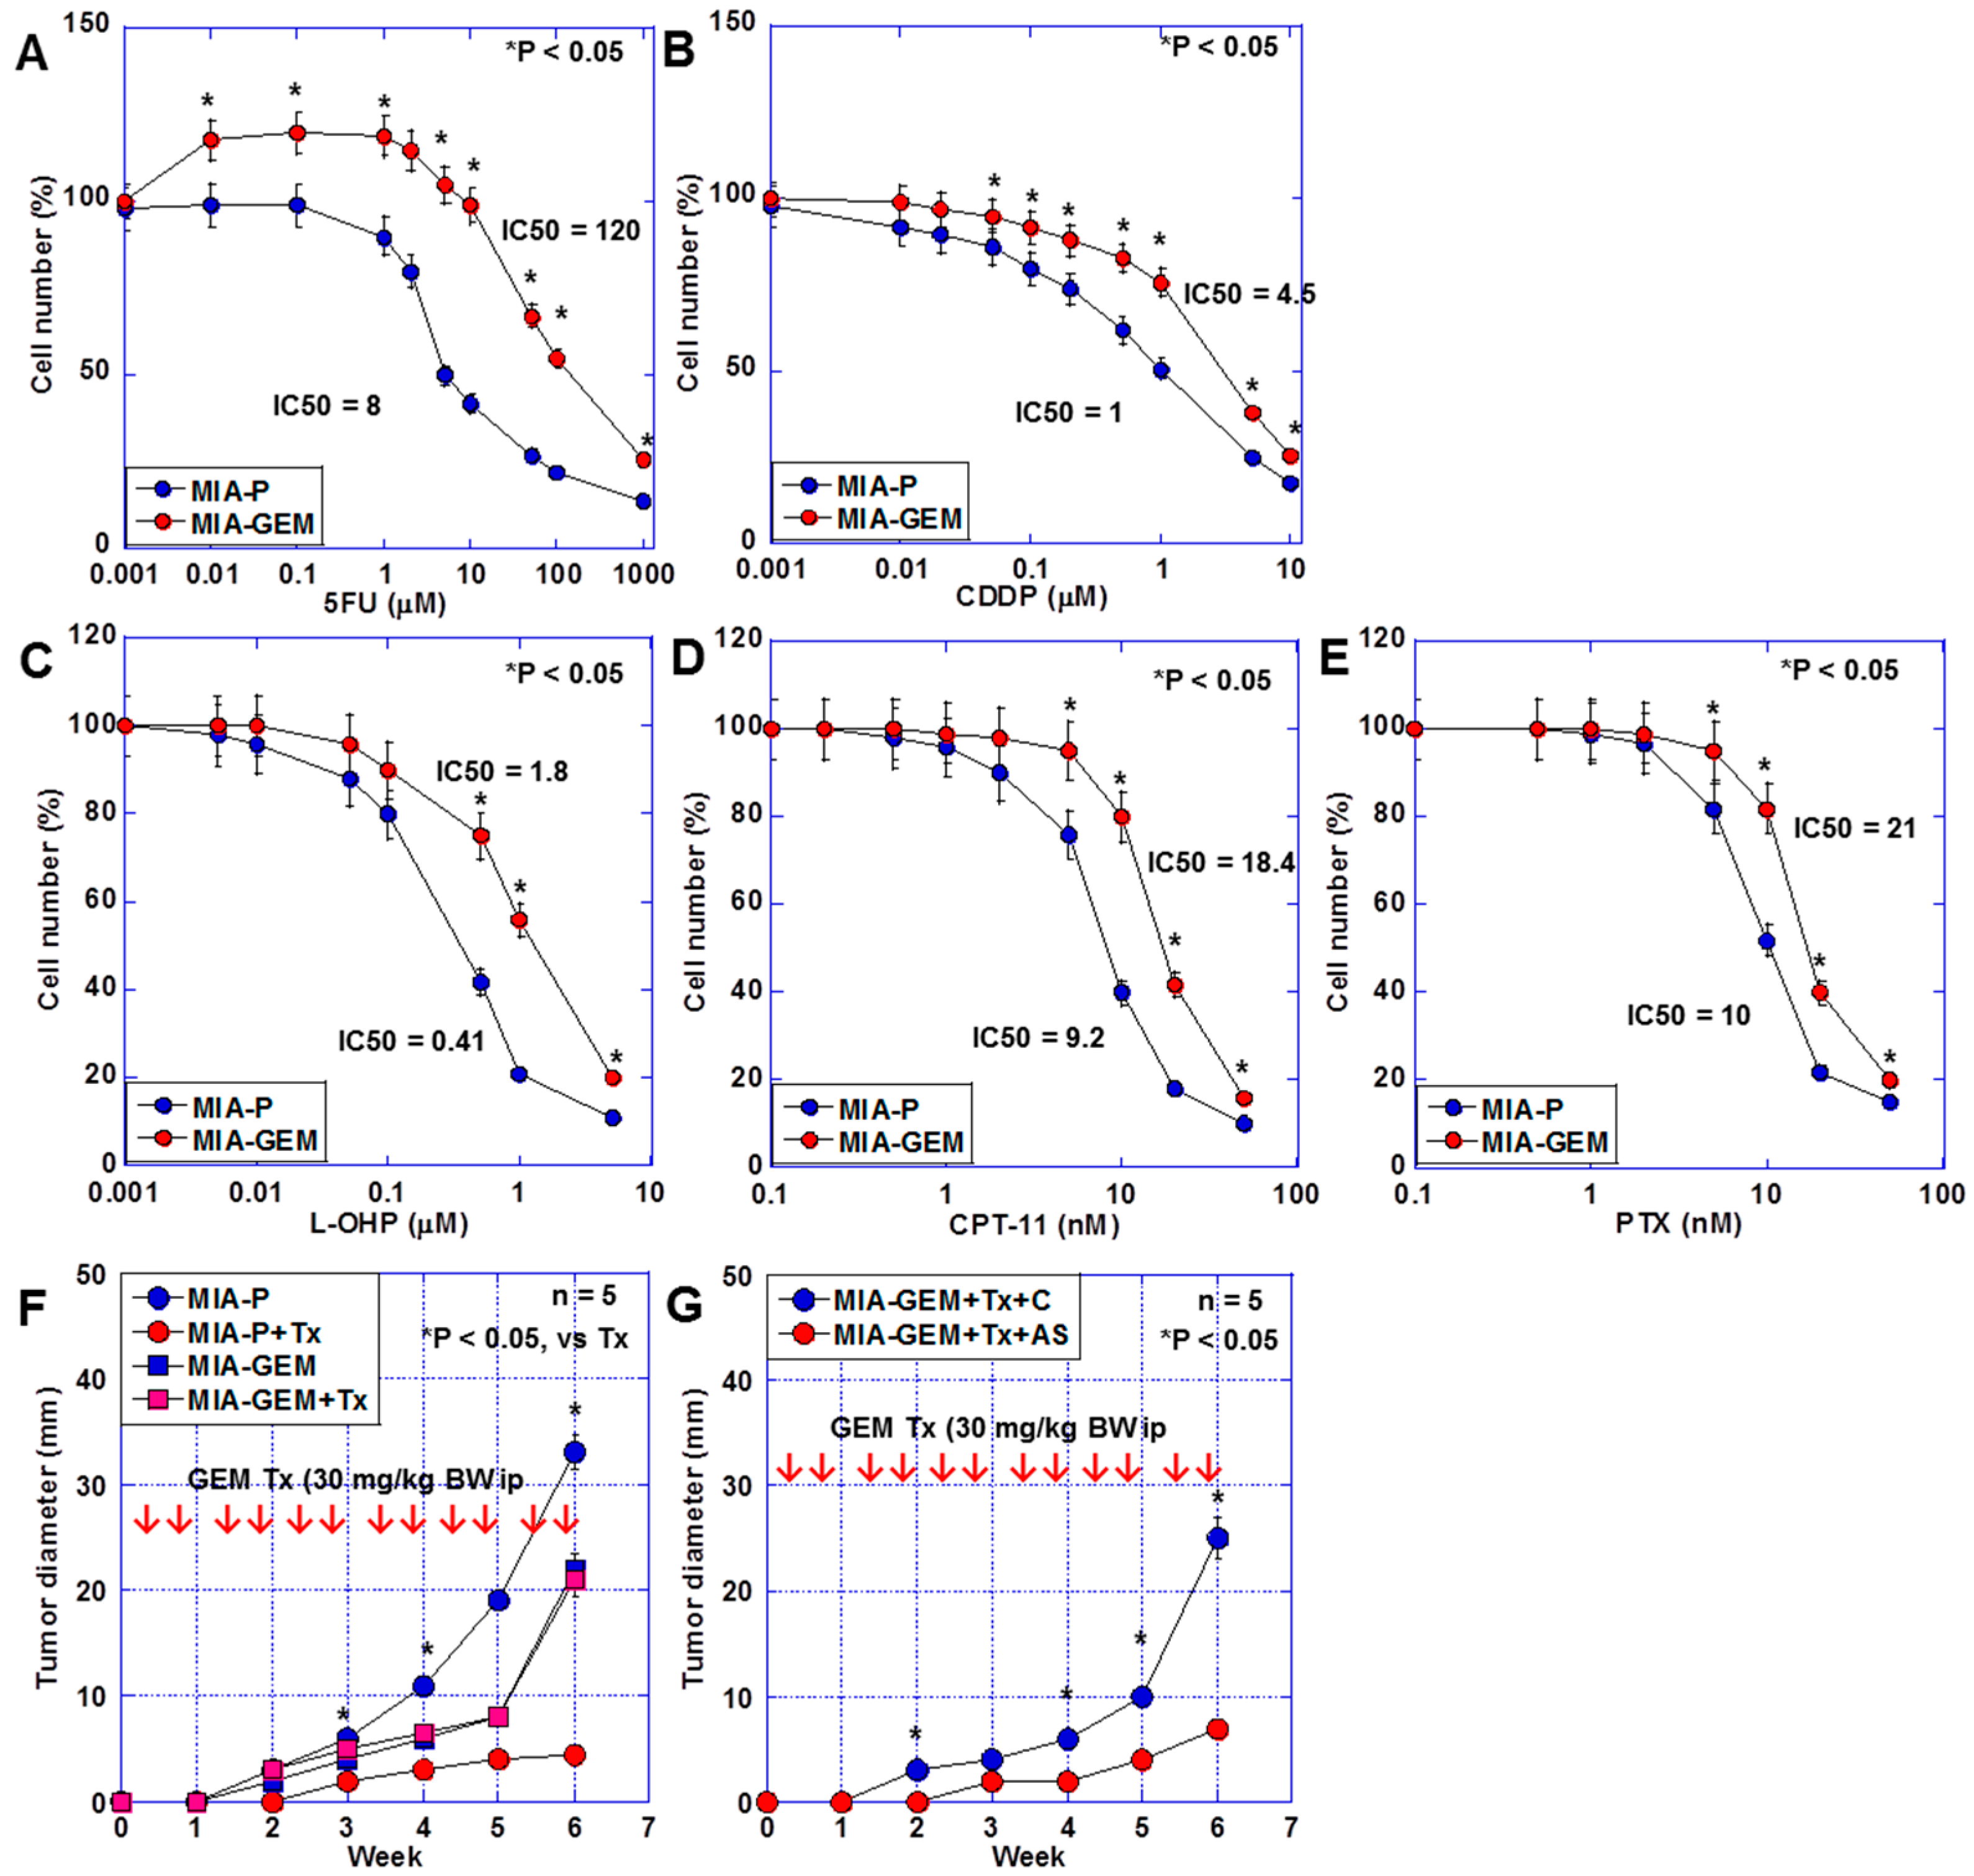
The sensitivity of MIA-GEM cells to 5-fluorouracil (5FU), cisplatin (CDDP), oxaliplatin (L-OHP), irinotecan (CPT-11), and paclitaxel (PTX) was also lower than that of MIA-P cells (Figure 3A,B). Furthermore, the effect of GEM on MIA-GEM cells was reduced to one-sixth of that on MIA-P cells after examination using a nude mouse subcutaneous tumor model (Figure 3C). However, the GEM resistance level of MIA-GEM cells was reduced to that of MIA-P cells after MAST4 knockdown (Figure 3D).
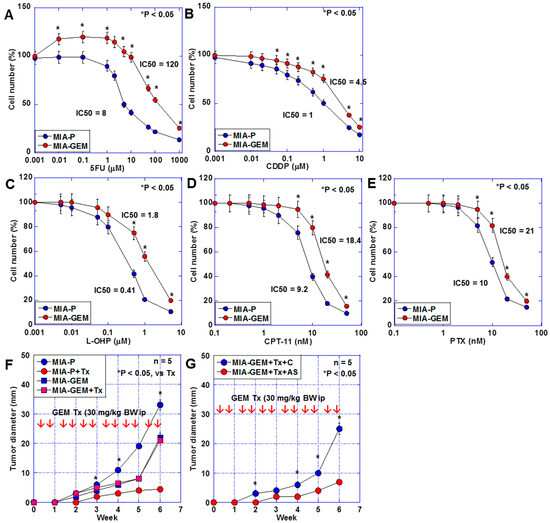
Figure 3.
Multiple drug resistance in MIA-GEM cells. (A–E) Drug sensitivity of MIA-GEM cells to 5FU (A), CDDP, L-OHP, CPT-11, and PTX. (B). (F) Growth of subcutaneous tumors in nude mice. (G) Effect of MAST4 knockdown on tumor growth. Red arrows indicate GEM administration (F,G). Error bar, standard deviation from three independent trials or five mice. Statistical differences were calculated using Student’s t-test. PDAC, pancreatic ductal adenocarcinoma; MIA-P, parental MIA-PaCa-2; MIA-GEM, GEM-resistant MIA-PaCa-2; GEM, gemcitabine; MAST4, microtubule-associated serine/threonine kinase family member 4; C, sense S oligonucleotide; AS, antisense S oligonucleotide; Tx, GEM treatment; 5FU, 5-fluorouracil; CDDP, cisplatin; L-OHP, oxaliplatin; CPT-11, irinotecan; PTX, paclitaxel.
2.3. Identification of MAST4-Related Signals
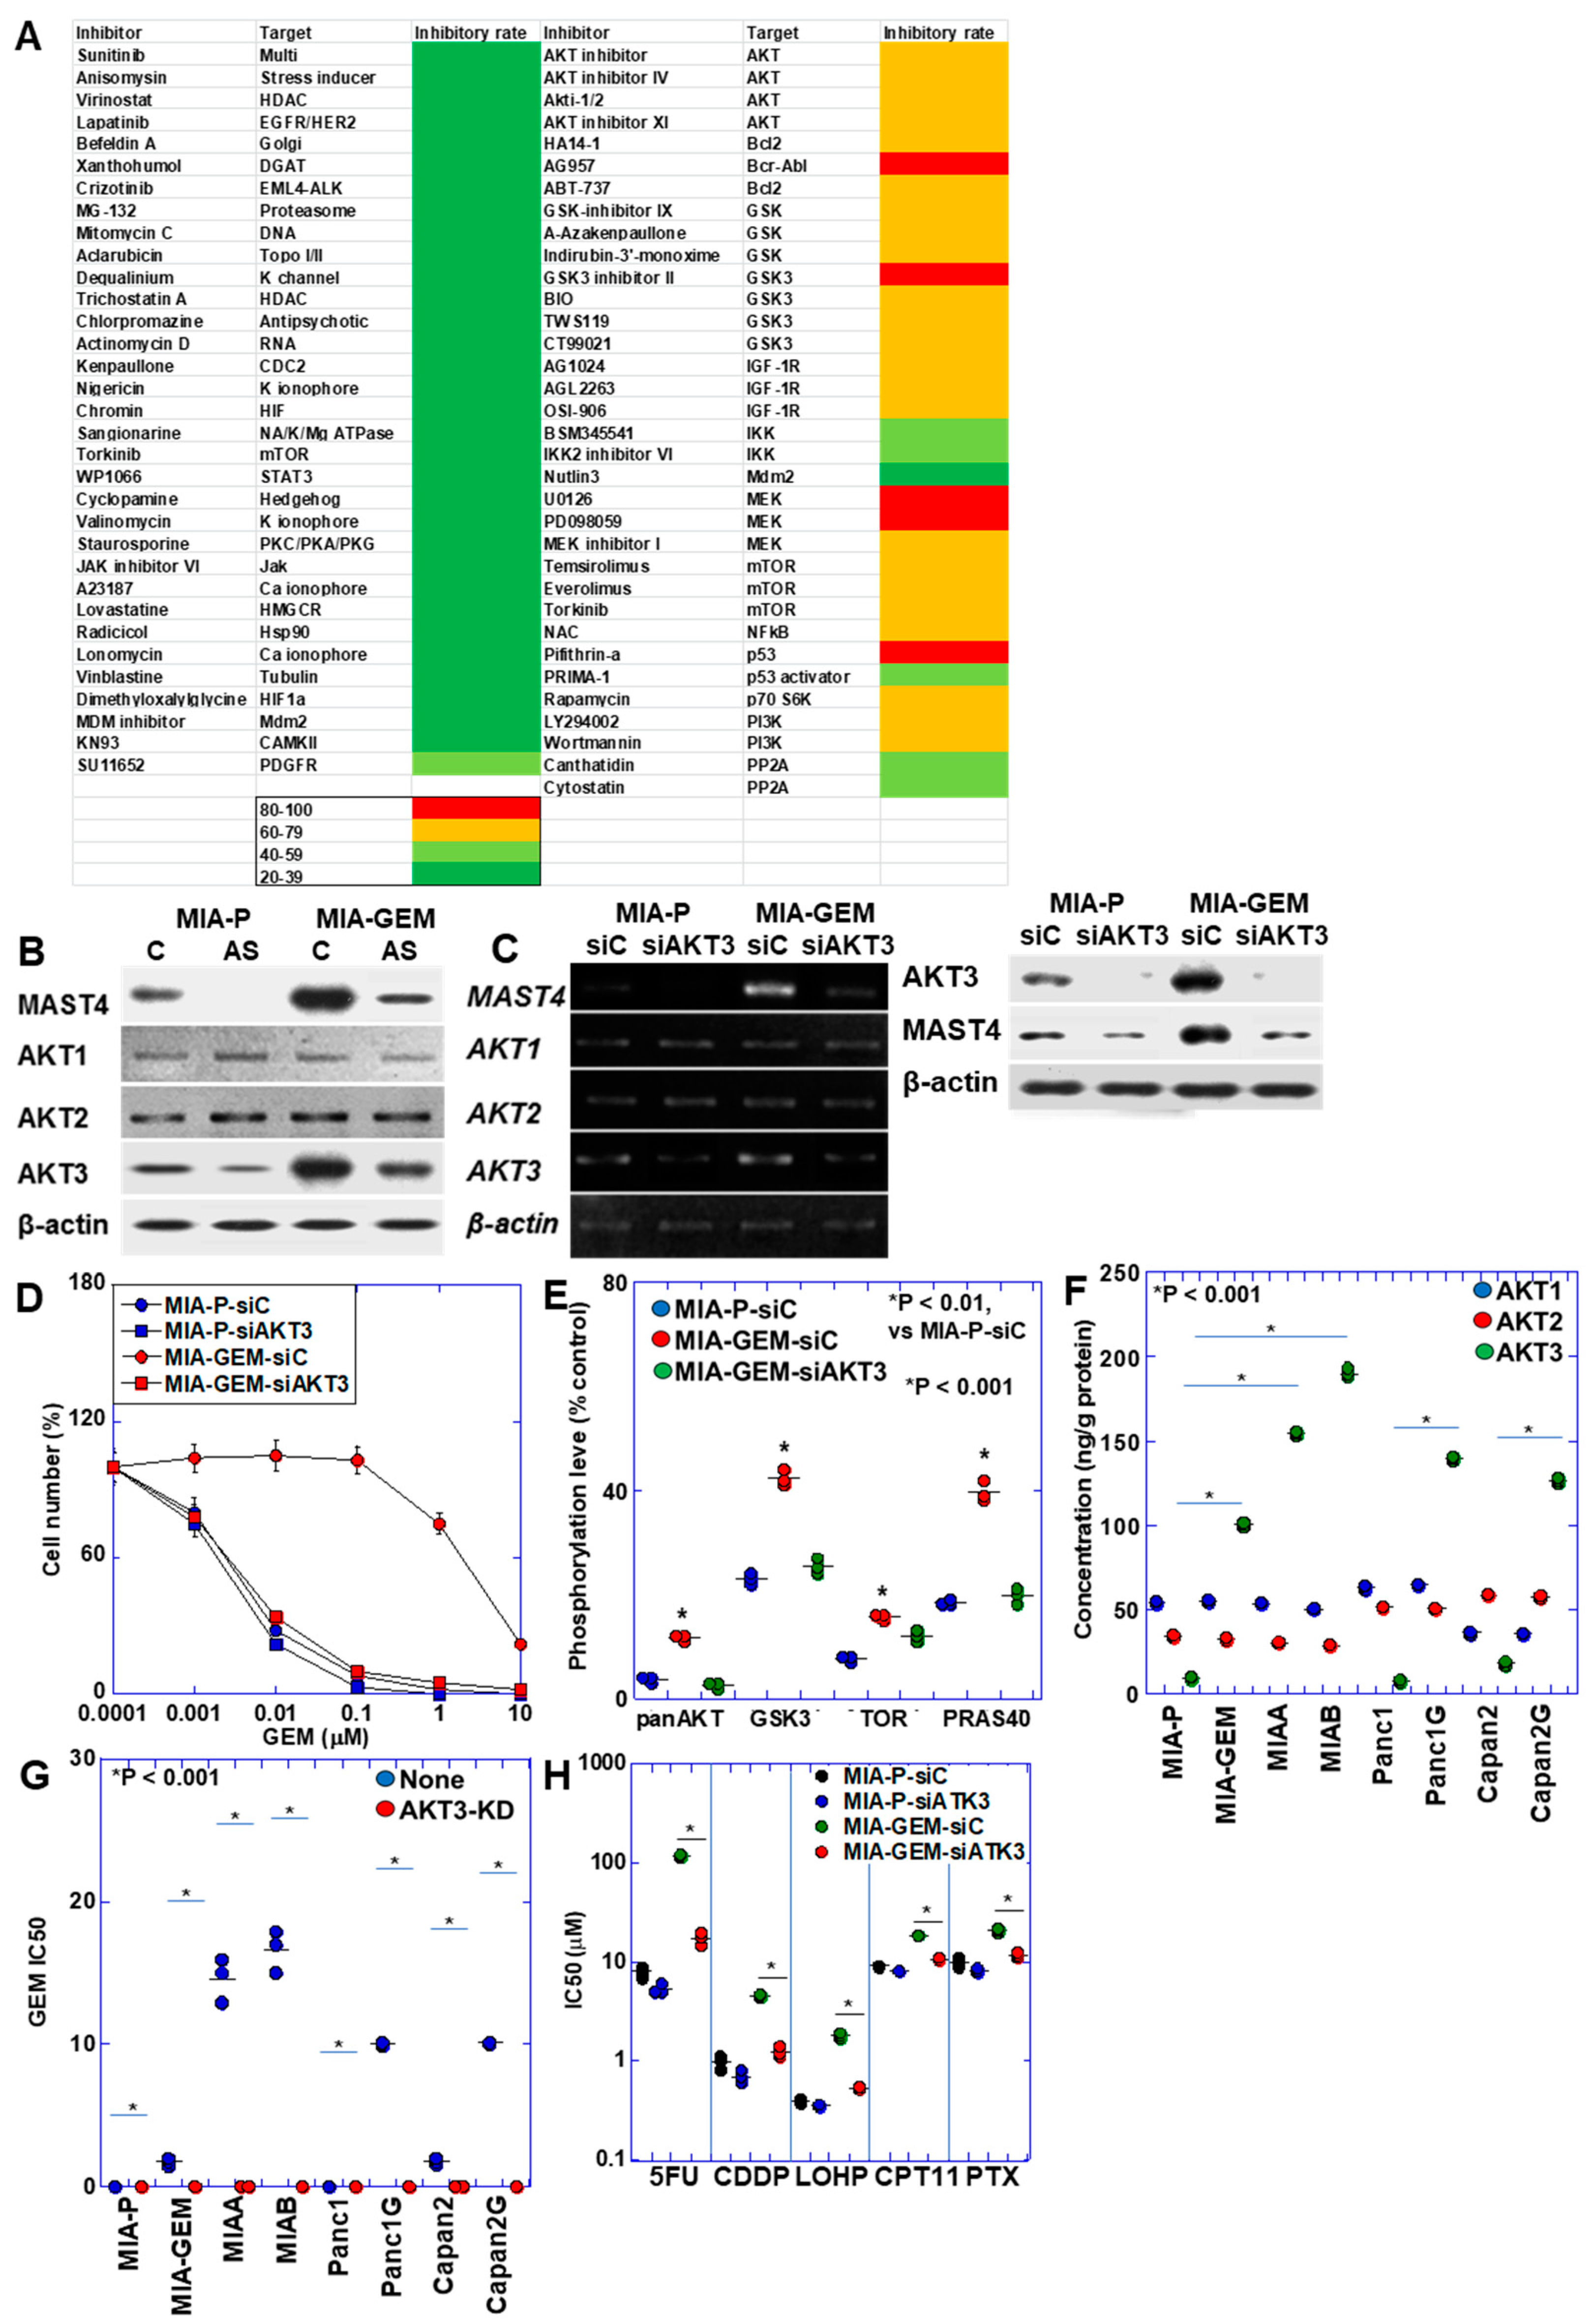
The results above suggest that MAST4 is responsible for GEM resistance in MIA-GEM cells. Therefore, by screening various inhibitors, we extracted compounds with growth-inhibitory effects on MIA-GEM cells and analyzed MAST4-related signals (Figure 4A). Consequently, inhibitors of AKT and its related signaling pathways were identified. AKT exists in three isoforms; hence, we examined its protein levels (Figure 4B). AKT1 and AKT2 were similarly expressed in MIA-GEM and MIA-P cells, whereas AKT3 expression increased in MIA-GEM cells decreased by MAST4 knockdown. Furthermore, AKT3 expression was substantially suppressed after knockdown with siRNA, and MAST4 expression decreased (Figure 4C). AKT3 knockdown decreased MAST4 protein levels, restored the GEM sensitivity of MIA-GEM cells to a level similar to that of MIA-P cells (Figure 4C,D) and suppressed the phosphorylation level of AKT downstream signals, which were enhanced in MIA-GEM cells (Figure 4E). Next, we examined the protein levels of the AKT family in the five GEM-resistant cell lines (Figure 4F). No changes were observed in the levels of AKT1 and AKT2 in the resistant cells. In contrast, AKT3 protein levels increased in all resistant cells. Knockdown of AKT3 increased GEM sensitivity in all cells (Figure 4G). In MIA-GEM cells, knockdown of AKT3 increased the sensitivities to 5FU, CDDP, L-OHP, COT-11 and PTX (Figure 4H).

Figure 4.
AKT3 in MIA-GEM cells. (A) Heat map of MIA-GEM cell-inhibitory effect of signal blockers. Inhibitors unrelated to AKT are shown in the left column, and AKT-related inhibitors are shown in the right column. Heatmap values indicate cell growth inhibition rate. (B) Effect of MAST4 knockdown on protein expression of AKT family. (C) Effect of AKT3 knockdown on mRNA expression (upper) and protein (lower) of MAST4 and AKT family. (D) GEM sensitivity in AKT3-knocked down MIA-GEM cells. (E) Phosphorylation levels of AKT3 signal proteins. (F) Protein levels of AKT family in GEM-resistant PDAC cells. (G) GEM sensitivity in AKT3-knocked down PDAC cells. (H) Effect of AKT3 knockdown on other anti-cancer drugs. Error bar, standard deviation from three independent trials. Statistical differences were calculated using Student’s t-test. PDAC, pancreatic ductal adenocarcinoma; MIA-P, parental MIA-PaCa-2; MIA-GEM, GEM-resistant MIA-PaCa-2; MIAA, MIAB; GEM-resistant MIA-PaCa-2 [8]; Panc1G, GEM-resistant Panc1 [8]; Capan2G, GEM-resistant Capan2 [8]; GEM, gemcitabine; MAST4, microtubule-associated serine/threonine kinase family member 4; C, sense S-oligonucleotide; AS, antisense S-oligonucleotide; siC, control short interfering RNA; siAKT3, short interfering RNA to AKT3; GSK3β, glycogen synthase kinase 3β; TOR, target of rapamycin; PRAS40, proline-rich AKT substrate of 40-kDa; 5FU, 5-fluorouracil; CDDP, cisplatin; L-OHP, oxaliplatin; CPT-11, irinotecan; PTX, paclitaxel.
2.4. Regulation of MAST4 and AKT3 Expression
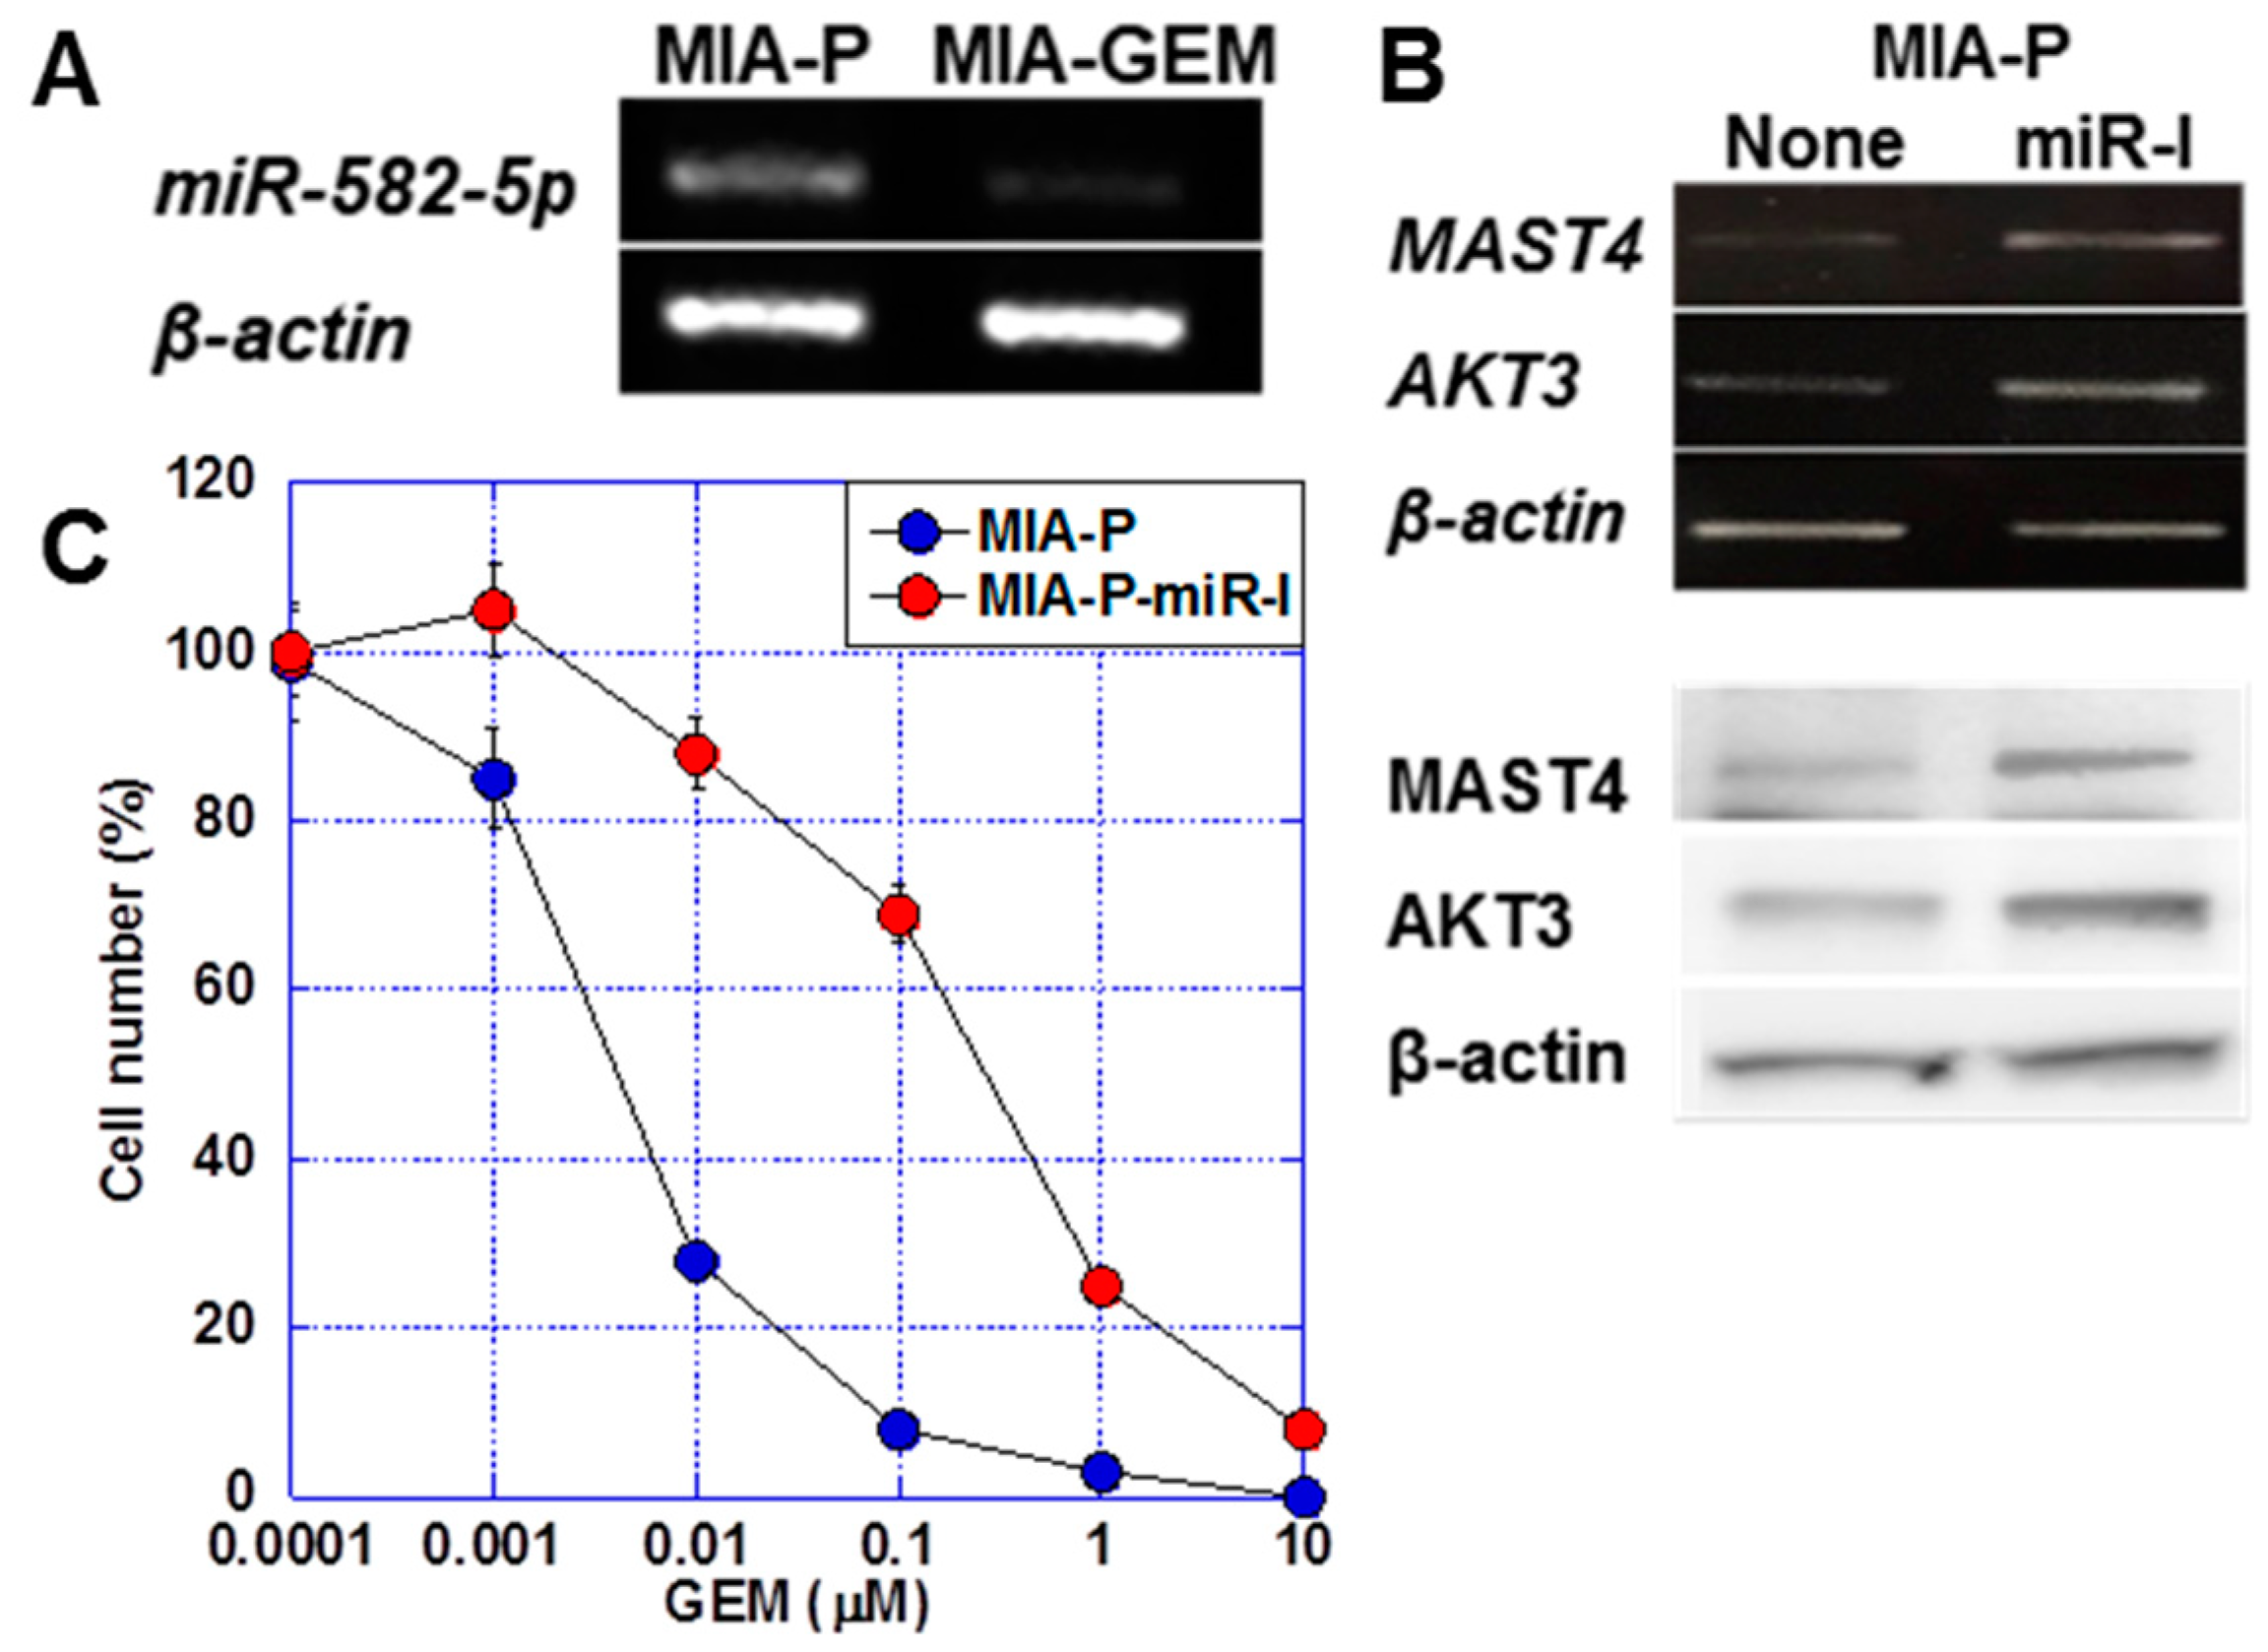
miR-582-5p is a microRNA that regulates AKT3 expression [23,24]. We observed a 6.0-fold increase in miR-582-5p expression in MIA-P cells compared with that in A-GEM cells (Figure 5A). The treatment of MIA-P cells with miR-582-5p inhibitor induced MAST4 and AKT3 expression at the mRNA and protein levels (Figure 5B). Furthermore, the treatment of MIA-P cells with miR-582-5p reduced the GEM sensitivity of MIA-P cells to a level comparable to that of MIA-GEM cells (Figure 5C).
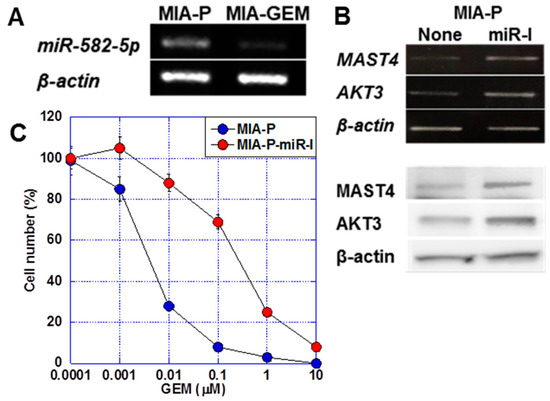
Figure 5.
Role of miR-582-5p on MAST4 and AKT3 expression. (A) Expression of miR-582-5p in MIA-GEM cells. (B) Effect of inhibition of miR-582-5p on expression of MAST4 and AKT3. Upper, mRNA, lower, protein. (C) Effect of inhibition of miR-582-5p on GEM sensitivity in MIA-GEM cells. Error bar, standard deviation from three independent trials. Statistical differences were calculated using Student’s t-test. PDAC, pancreatic ductal adenocarcinoma; MIA-P, parental MIA-PaCa-2; MIA-GEM, GEM-resistant MIA-PaCa-2; GEM, gemcitabine; MAST4, microtubule-associated serine/threonine kinase family member 4; miR-I, miR-582-5p inhibitor.
2.5. Nuclear Translocation of MAST4 and AKT3
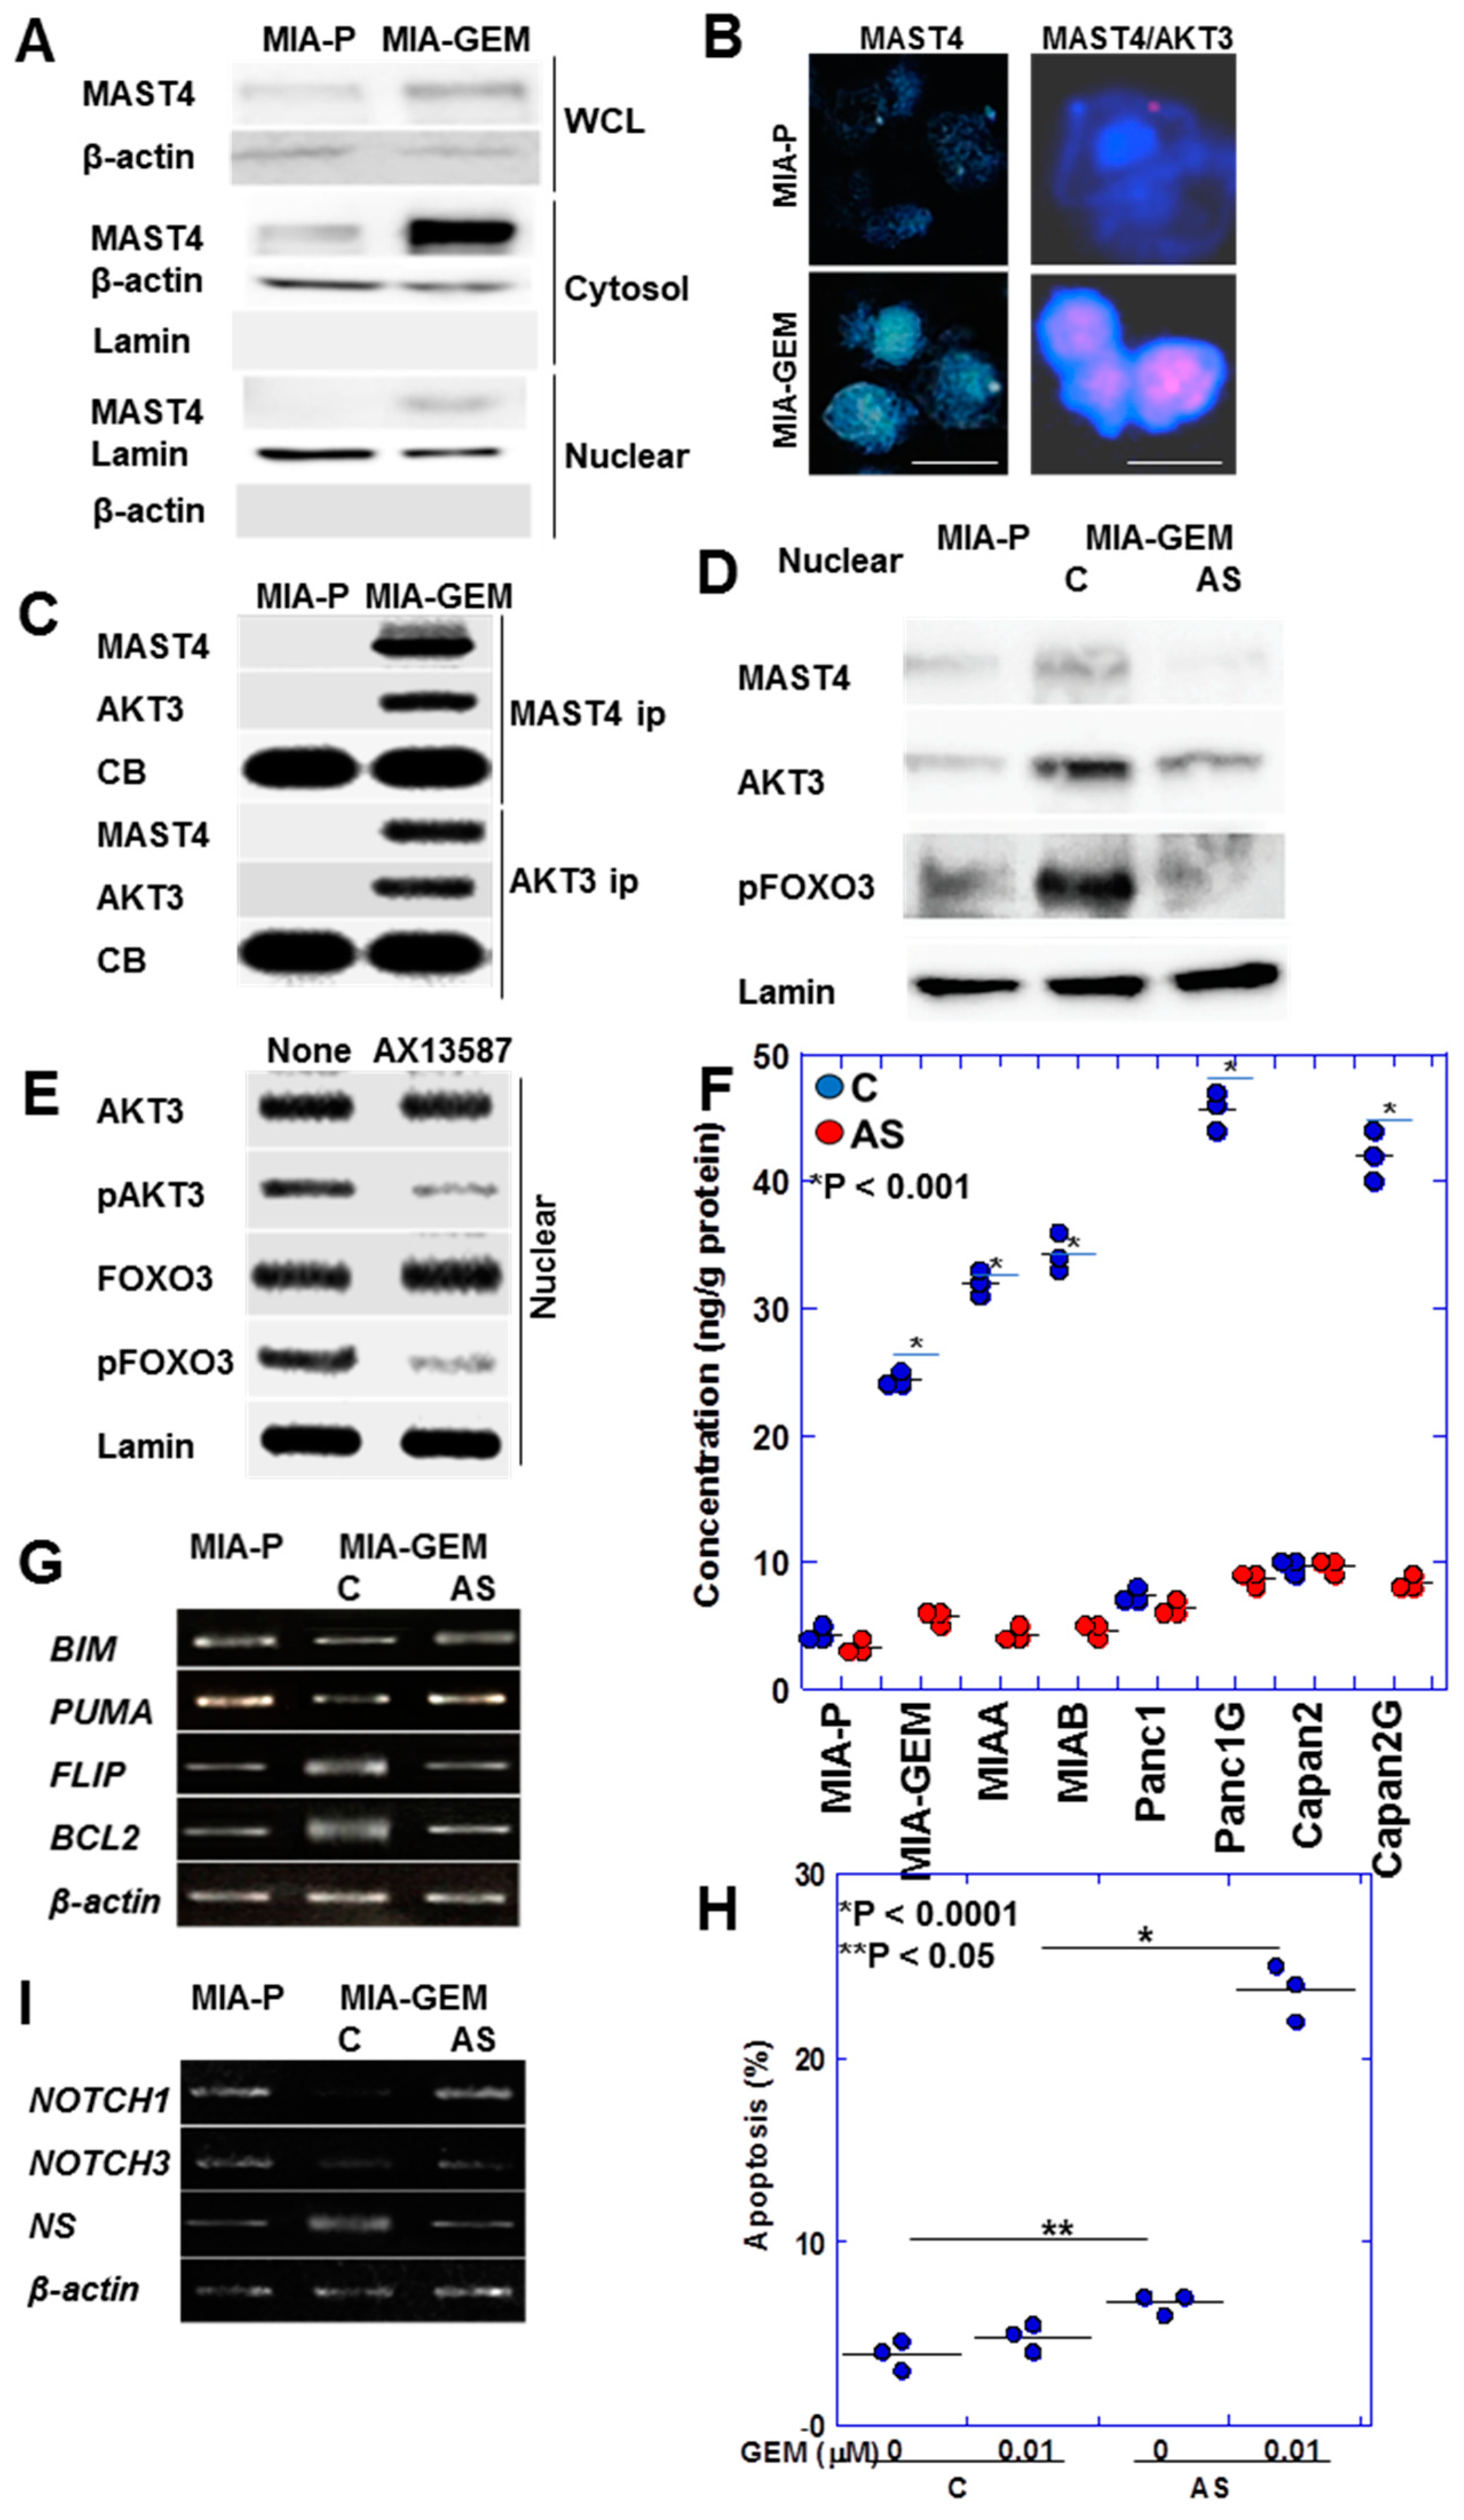
MAST4 was intracellularly localized at a low cytoplasmic level in MIA-P cells; however, in MIA-GEM cells, it showed a substantial intracellular increase and was translocated into the nuclei (Figure 6A). Immunostaining revealed MAST4 overexpression and nuclear translocation in MIA-GEM cells (Figure 6B). In addition, the Duolink® proximity ligation assay revealed that MAST4 and AKT3 were proximal in the nuclei (Figure 6B). Furthermore, in MIA-GEM cells, MAST4 and AKT3 binding in the nucleus was confirmed via immunoprecipitation (Figure 6C). Investigating nuclear proteins revealed that FOXO3 (forkhead box O3a), an AKT3 downstream signal, was inactivated with a 4.5-fold increase in phosphorylation levels in MIA-GEM cells. Phosphorylated FOXO3, MAST4, and AKT3 levels were reduced in the nucleus after MAST4 knockdown (Figure 6D). Furthermore, the treatment of MIA-GEM cells with the MAST4 kinase inhibitor—AX13587—[25] inhibited AKT3 and FOXO3 phosphorylation (Figure 6E). This suggests that FOXO3 induces GEM resistance via nuclear MAST4/AKT3. To confirm this relationship, we examined nuclear pFoxO3 protein levels in five GEM-resistant PDAC cells (Figure 6F). Nuclear pFoxO3 protein was increased in all resistant cells and decreased by MAST4 knockdown. Therefore, we examined the expression of apoptosis-related FOXO3 target genes (Figure 6G). MIA-GEM cells had decreased expression of BCL2 like 11 (BIM) and p53 upregulated modulator of apoptosis (PUMA) (pro-apoptotic) and increased expression of B-cell lymphoma 2 (BCL2 and Fas-associated death domain-like interleukin-1-converting enzyme-like inhibitory protein (FLIP) (anti-apoptotic), respectively, compared to that in MIA-P cells; however, these effects ended after MAST4 knockdown. MAST4 knockdown also enhanced GEM-induced apoptosis (Figure 6H). Furthermore, we examined stemness-related gene expression among FOXO3 target genes (Figure 6I) owing to its association with dormant stemness maintenance [26,27]. NOTCH1 and NOTCH3 expression decreased in MIA-GEM cells compared with that in MIA-P cells but increased with MAST4 knockdown. Concurrently, the expression of nucleostemin (NS), a stemness with proliferation marker [28], decreased with MAST4 knockdown.
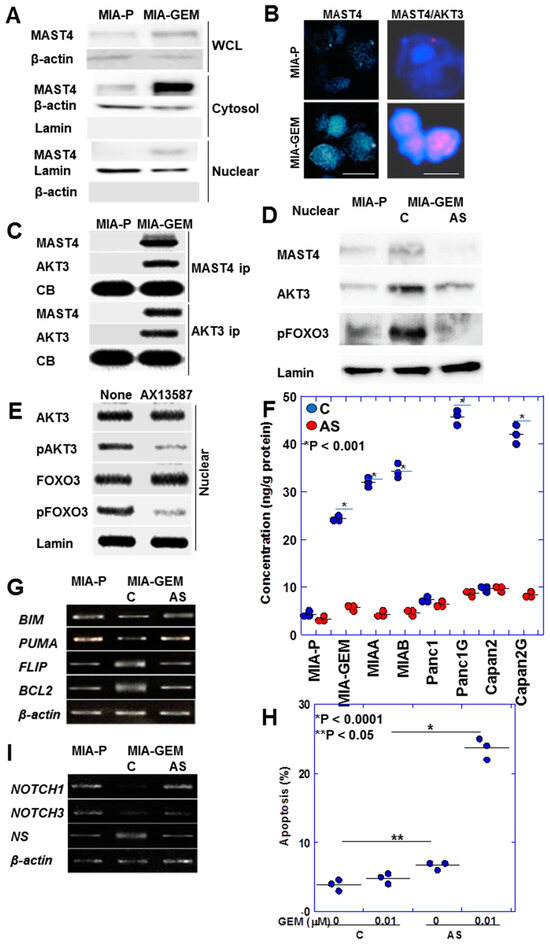
Figure 6.
Intranuclear association between MAST4 and AKT3. (A) Intracellular localization of MAST4. (B) Nuclear localization of MAST4 (left) and proximity assay of MAST4 and AKT3 (right). Scale bar, 20 μm. (C) Physical interaction between MAST4 and AKT3 in the nuclei. (D) Phosphorylation of FOXO3 in the nuclei. (E) Effect of inhibition of MAST4 kinase by AX13587 on AKT3 phosphorylation. (F) Effect of MAST4 knockdown on phosphorylation of FOXO3 in the nuclei in PDAC cells. (G) Expression of apoptosis-associated genes of FOXO3 targets. (H) Effect of MAST4 knockdown on GEM-induced apoptosis. (I) Expression of stemness-associated genes of FOXO3 targets. Error bar, standard deviation from three independent trials. Statistical differences were calculated using Student’s t-test. PDAC, pancreatic ductal adenocarcinoma; MIA-P, parental MIA-PaCa-2; MIA-GEM, GEM-resistant MIA-PaCa-2; MIAA, MIAB; GEM-resistant MIA-PaCa-2 [8]; Panc1G, GEM-resistant Panc1 [8]; Capan2G, GEM-resistant Capan2 [8]; GEM, gemcitabine; MAST4, microtubule associated serine/threonine kinase family member 4; WCL, whole cell lysate; cytosol, cytosol fraction; nuclear, nuclear fraction; ip, immunoprecipitant, C, sense S-oligonucleotide; AS, antisense S-oligonucleotide; CB, Coomassie blue; FOXO3, forkhead box protein O3; pFOX3, phosphorylated FOXO3; pAKT3, phosphorylated AKT3; BIM, BCL2 like 11; PUMA, p53 upregulated modulator of apoptosis; FLIP, Fas-associated death domain-like interleukin-1-converting enzyme-like inhibitory protein; BCL2, B cell lymphoma 2; NS, nucleostemin.
2.6. Role of MAST4 in PDAC Cases
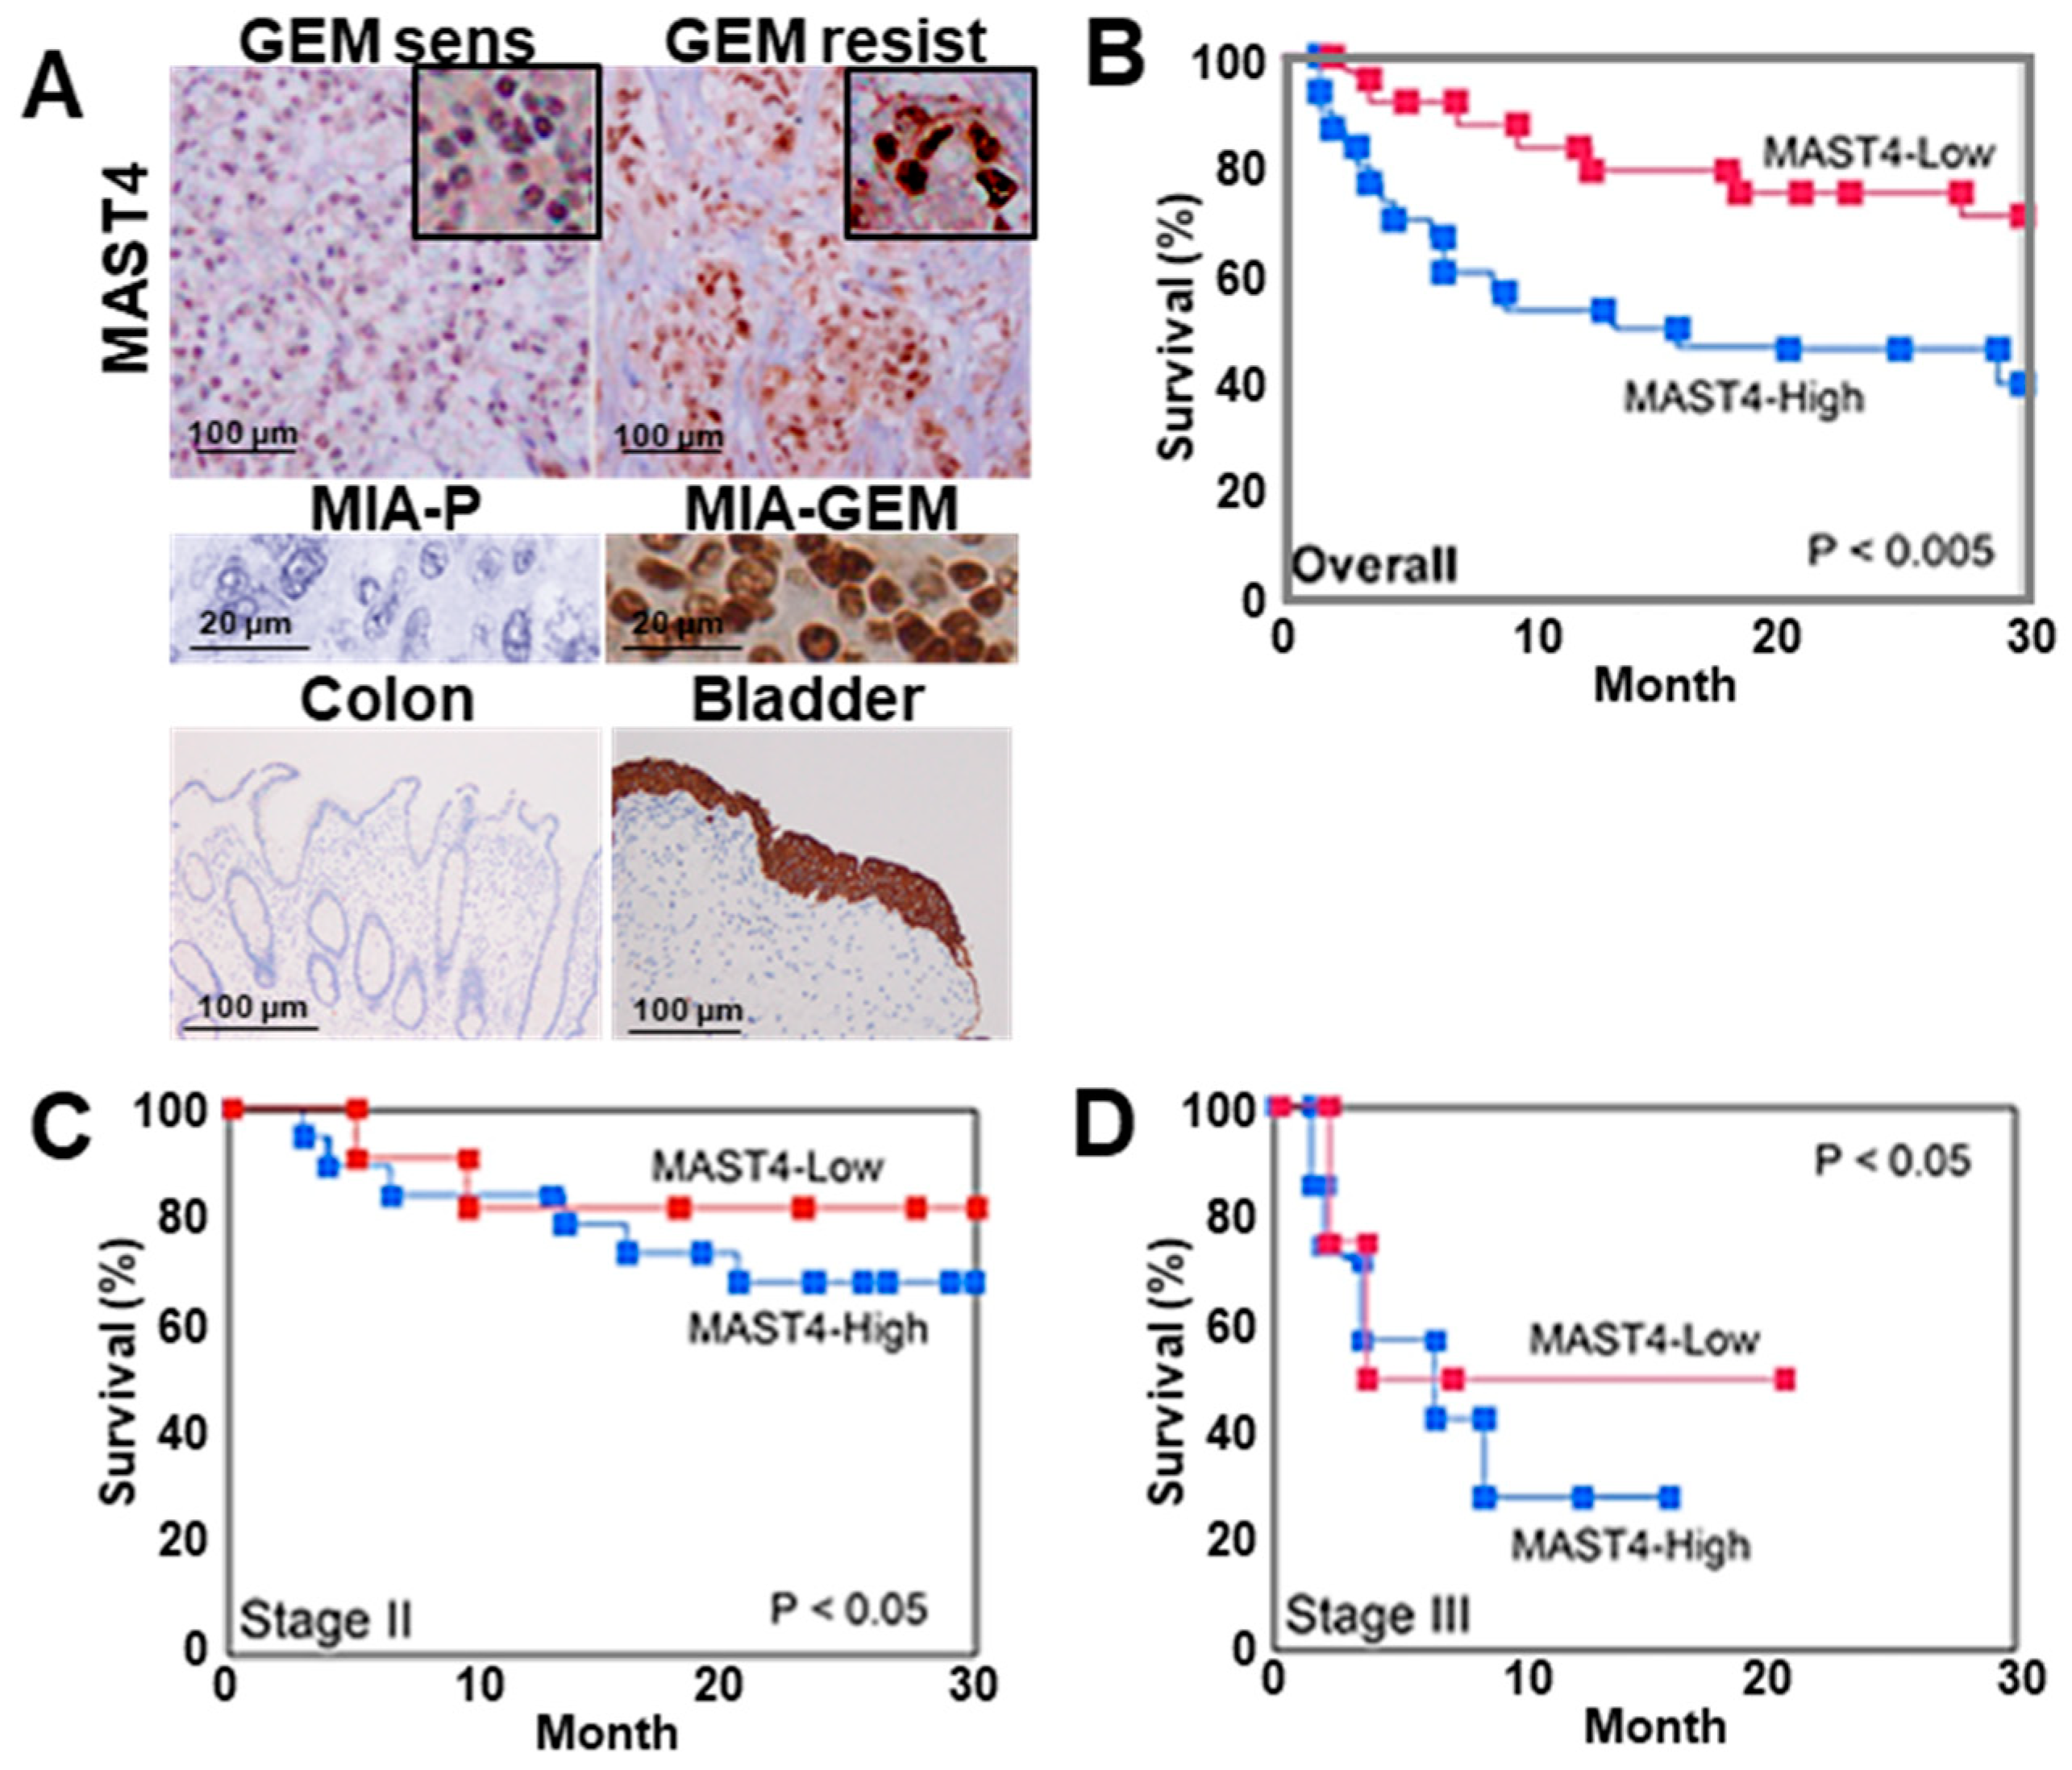
We examined nuclear MAST4 expression in 91 PDAC samples using immunostaining, which revealed distinct nuclear staining (Figure 7A). Immunocytochemistry images of MIA-P and MIA-GEM are shown as negative control and positive control, respectively. Furthermore, the colon mucosal epithelium and bladder urothelial epithelium are shown as negative control and positive control, respectively [29]. Of note, MAST4 expression is high in the bladder urothelium, but positive in the cytoplasm and negative in the nucleus. This indicates that nuclear MAST4 in PDAC has an abnormal subcellular distribution. The nuclear MAST4 labeling index is correlated with differentiation grade, T factor, N factor, and PDAC stage (Table 2). Furthermore, significantly higher nuclear MAST4 labeling was observed in chemoresistant cases (Table 2). Chemotherapy was administered to 88 patients excluding stage I, and MAST4 was significantly expressed in progressive disease (PD) patients. In 43 cases that received GEM alone treatment, higher nuclear MAST4 labeling was observed in resistant cases than in susceptible cases (Table 2 and Figure 7A). The 27 cases with known prognosis were divided into two groups based on the median nuclear MAST4 expression. The clinicopathological parameters of each group are shown in Table 3. There were no differences between the two groups in parameters other than RECIST, while RECIST was worse in the MAST4-H group. In multivariate analysis, MAST4 showed the most significant correlation with prognosis (Table 4). In addition, high nuclear MAST4 indicated a significantly worse prognosis in all cases at stage II and stage III (Figure 7B–D).
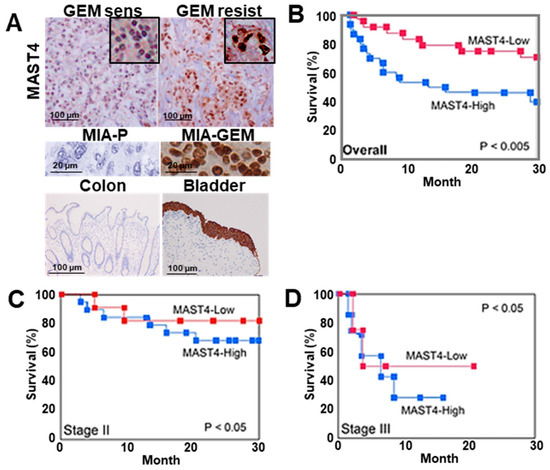
Figure 7.
MAST4 expression in human PDAC cases. (A) Immunohistochemical detection of MAST4 in the nuclei of PDAC cases. Insets show high magnification. Middle panels, MAST4 immunohistochemistry images in mouse tumors of MIA-P (negative control) and MIA-GEM (positive control). Lower panels, MAST4 immunohistochemistry images in colon mucosa (negative control) and bladder urothelium (positive control). (B–D) Survivals between MAST4-high and -low cases; overall (B), stage II (C), and stage III (D). The MAST4-high and MAST4-low groups were divided based on the median MAST4 expression. Survival curves were calculated using the Kaplan–Meier method. Statistical differences were calculated using the log-rank test. PDAC, pancreatic ductal adenocarcinoma; MIA-P, parental MIA-PaCa-2; MIA-GEM, GEM-resistant MIA-PaCa-2; GEM, gemcitabine; MAST4, microtubule-associated serine/threonine kinase family member 4.
Table 2.
Nuclear MAST4 expression in 91 PDAC cases.
Table 3.
Relationship of nuclear MAST4 expression with survival in 27 PDAC cases.
Table 4.
Multivariate analysis.
3. Discussion
GEM-resistant MIA-GEM cells had enhanced stemness and anti-apoptotic survival, which also provide resistance to 5FU and CDDP. MAST4 expression was higher in MIA-GEM cells than in MIA-P cells. MAST4 translocated into the nucleus, bound to AKT3 in the nucleus, inactivated the AKT3 downstream signal, FOXO3, suppressed apoptosis, and promoted stemness with proliferation.
Our study revealed that AKT3 exists in the nucleus bound to MAST4. Nuclear translocation of AKT is dependent on PI3K phosphorylation [30,31]. AKT counteracts apoptosis by blocking caspase-activated DNase after translocation to the nucleus and is involved in cell cycle progression control, cell differentiation, mRNA transport, DNA repair, and tumorigenesis [32]. AKT also promotes stemness, sphere formation, aldehyde dehydrogenase activity, and increased stemness marker expression [33].
FOXO3, a member of the FOXO family located downstream of the PI3K/AKT pathway, binds to the DNA consensus sequence as a transcription factor [34]. FOXO3 promotes apoptosis by upregulating the pro-apoptotic factors—BIM and PUMA, and downregulating the anti-apoptotic factors—FLIP and BCL2 [35,36,37]. Therefore, it acts as a tumor suppressor gene in cancer [38]. Nuclear FOXO3 phosphorylation is correlated with high-grade and recurrent bladder cancer [39]. FOXO3 suppresses cancer stem cell propagation and improves disease prognosis [40]. In addition, FOXO3 maintains dormant stemness [26,27] and suppresses cancer stem cells [41]. Our results suggest that nuclear MAST4/AKT3 inactivates FOXO3, increases apoptosis resistance, and induces stemness with proliferation, resulting in GEM resistance.
MAST4 has a single C-terminus PDZ domain [42] through which it forms a protein complex [43]. It also promotes interactions between bound proteins [44,45,46]. These findings suggest that MAST4 may enable FOXO3 phosphorylation by AKT3. MAST1-3 bind to PTEN [47] through the PDZ domain [48,49]; however, to our knowledge, our study is the first to report binding between MAST4 and AKT3. MAST4 also binds PTEN in multiple myeloma [16]. These findings suggest a close relationship between MAST4 and PI3K/AKT signaling. However, a detailed examination of the binding possibility and three-dimensional structures of MAST4, AKT3, and FOXO3 is required. Knocking down one of MAST4 and AKT3 reduces the expression of the other, suggesting the possibility of a feedback loop. This also requires future consideration.
We added knock down of the MIA-P. It is a good idea to introduce the MAST4 vector into MIA-P and create an overexpression model, and this is a topic for future research. In our data, a detailed examination of the mechanism of MAST4 relies on the comparison of MIA-P and MIA-GEM. Several examinations are also performed in the other six cell lines. In the future, multiple mechanistic analyses will be necessary for other resistant cell lines. Among the cases we analyzed, all at stage II-IV received some form of chemotherapy. Cases other than GEM alone are also receiving chemotherapy, and MAST4 overexpression induces drug resistance to 5FU, L-OHP, PTX, and COT-11, which are used in these cases. Therefore, it is difficult to establish a complete control cohort without the MAST4 effect in our data. Future analysis through prospective studies is required.
Our data revealed that nuclear MAST4 is highly expressed in GEM-resistant PDAC cells and clinical GEM-resistant PDAC cases, highlighting its importance in PDAC GEM resistance. Nuclear MAST4 is associated with disease progression and poor prognosis owing to stemness promotion by MAST4/AKT3/FOXO3. Our data corroborate nuclear MAST4 as a predictive marker for GEM resistance. MAST4 expression was induced by GEM in a concentration-dependent manner, suggesting that nuclear translocation was accelerated during GEM chemotherapy. However, obtaining cancer tissues from PDAC is clinically challenging, and developing more clinically convenient markers, such as blood MAST4, is necessary. The MAST4 inhibitor—AX13587—inhibited the nuclear phosphorylation of AKT3 and FOXO3. This suggests that targeting MAST4 may be effective in overcoming GEM resistance. AX13587 also inhibits JNK [25]. Therefore, developing an inhibitor with higher specificity for MAST4 that is applied clinically is recommended.
4. Materials and Methods
4.1. Cell Lines
The MIA-PaCa-2 human PDAC cell line was purchased from Dainihon Pharmaceutical Co. (Tokyo, Japan). PANC-1 and Capan-2 cells were obtained from the American Type Culture Collection. Cells were cultured in Dulbecco’s modified Eagle’s medium supplemented with 10% fetal bovine serum at 37 °C in 5% CO2. GEM-resistant MIA-GEM, a MIAA, MIAB, PANC1G, and Capan2G cells were established by continuous treatment with GEM (1 μM, Sigma-Aldrich Inc., St. Louis, MO, USA) and CoCl2 (150 μM, Wako, Osaka, Japan), exceeding 40 passages. [8]. These cell lines are passaged to ensure that MIA-P cells and MIA-GEM cells have the same passage. Additionally, miR-873 inhibitors (Invitrogen, Carlsbad, CA, USA) and AX13587 (LookChem, Zhejiang, China) were purchased. We performed all experiments in triplicate. For cell assays, 1 x 10⁵ cells were seeded on 6-well plate and treated for 48 h. The identity of the resistant cell lines and the parent cell lines was confirmed by an STR profiling service (Wako).
4.2. Cell Growth and Apoptosis
We assessed cell growth using the 3-(4,5-Dimethylthiazol-2-yl)-5-(3-Carboxymethoxyphenyl)-2-(4-Sulfophenyl)-2 H-tetrazolium (MTS) assay [9]. MTS assays were performed using a CellTiter 96 Aqueous One Solution Cell Proliferation Assay kit (Promega, Madison, WI, USA). Generally, cells (1 × 10⁶) were seeded on 6-well plate and treated for 48 h. The plates were read using a Multiskan FC microplate photometer (Thermo Fisher Scientific Inc, Tokyo, Japan) at a wavelength of 490 nm. Cells cultured with oligonucleotides were used as controls in the MTS assay. Apoptotic cells were stained with Hoechst 33343 dye (Dojindo, Kumamoto, Japan), and stained cells were counted from 1000 cells using a KEYENCE all-in-one microscope (Osaka, Japan).
4.3. Sphere Assay
We seeded 1000 cells per well on uncoated bacteriological 35-mm dishes (Corning Inc., Corning, NY, USA) in 3D Tumorsphere Medium XF (Sigma-Aldrich). Digital images of the spheres were subsequently captured and measured using a BZ-X710 all-in-one fluorescence microscope (KEYENCE) and an NIH ImageJ software (version 1.52, Bethesda, MD, USA), respectively, after 7 d. We performed all experiments in triplicate.
4.4. Chamber Invasion Assay
A modified Boyden chamber assay was performed to examine the in vitro invasive ability of the PDAC cells [50]. The filters were carefully removed from the inserts, stained with hematoxylin for 10 min, and mounted on microscope slides after incubation at 37 °C for 24 h. The number of stained cells in each insert was counted at 100× magnification. Invasive activity was quantified by calculating the average number of cells per insert well. We performed all experiments in triplicate.
4.5. Mouse Models
Four-week-old male Slc-nu/nu BALB/c mice (SLC Japan, Shizuoka, Japan) were maintained in accordance with institutional guidelines approved by the Committee for Animal Experimentation of Nara Medical University and the current regulations and standards established by the Ministry of Health, Labor, and Welfare (approval number 11716, 20 July 2016). MIA-P or MIA-GEM cells (1 × 10⁷) in 100 mL HBSS (Wako) were mixed with 100 mL of Matrigel solution (#356234, Corning Inc., Corning, NY, USA) and inoculated into mouse scapular tissue subcutaneously. [51]. Cells were pretreated with 3 µM of antisense or control S-ODN (Table 5) for 3 d. Thereafter, the mice were treated with GEM (30 mg/kg body weight) intraperitoneally, twice weekly. In each treatment, 5 mice were used. Tumor sized was measured with calipers once a week.
Table 5.
Primer sets, antisense, antibodies and ELISA kits.
4.6. Antisense Phosphorothioate(S)-Oligodeoxynucleotide Assay
An 18-mer S-ODN targeting MAST4 was synthesized and purified using reverse-phase high-performance liquid chromatography (Espec Oligo Service, Tsukuba, Japan) (Table 4). Each cell line was pretreated with 3 µM of antisense or control S-ODN for 2 d with medium exchange. Subsequently, the cells were used for further experiments [50].
4.7. mRNA Profiling
According to the manufacturer’s instructions, total RNA was extracted from MIA-P and MIA-GEM cells using TRI Reagent (Molecular Research Center, Inc., Cincinnati, OH, USA). Subsequently, mRNA profiling from the RNA was performed using a DNA array service (Filgen Inc., Nagoya, Japan). mRNA quality control revealed that OD280/260 ratio > 1.8, OD230 > 1.6, and S28/S18 ratio > 2.0. In the service, materials were analyzed using GeneChipTM Arrays (Applied Biosystems, Waltham, MA, USA). Data were analyzed using Transcriptome Analysis Console software (version 4.0.1.36, Applied Biosystems), from which genes with gene expression of more than 2-fold and less than 1/2-fold and whose ANOVA p-value was less than 0.05 were isolated.
4.8. Inhibitor Assay
A SCADS inhibitor kit (https://www.molpro.jp/explore/library/#hyoujun, accessed on 24 May 2018) was used for inhibitor assays. The kit was kindly provided by the Screening Committee of Anticancer Drugs, supported by a Grant-in-Aid for Scientific Research on Innovative Areas, Scientific Support Programs for Cancer Research, from the Ministry of Education, Culture, Sports, Science, and Technology, Japan.
4.9. Western Blotting
Whole-cell lysates were prepared using Radio-Immunoprecipitation Assay buffer supplemented with 0.1% sodium dodecyl sulfate (SDS) (Thermo Fisher) [52]. A Minute Cytoplasmic and Nuclear Extraction Kit (Invent, Biotechnologies, Inc., Bloomington, IN, USA) was used to extract the nuclear and cytosolic fractions. Protein assays were performed using a Protein Assay Rapid Kit (Wako). Lysates were separated using 7.5% or 10.0% SDS-polyacrylamide gel electrophoresis and transferred to nitrocellulose membranes. The membranes were inoculated with primary antibodies (Table 5) and subsequently incubated with a polyclonal rabbit/mouse anti-IgG antibody (DAKO, Glastrup, Denmark) at room temperature for 2 h. β-Actin was used as a loading control. Immune complexes were visualized using Fusion Solo (M&S Instruments, Osaka, Japan). Images were captured on a computer, and the signal strength was measured using the NIH ImageJ software.
4.10. Immunoprecipitation
Immunoprecipitation was performed using a previously described method [53]. Lysates were pre-cleaned in lysis buffer containing protein A/G agarose (Santa Cruz Biotechnology, Santa Cruz, CA, USA) for 1 h at 4 °C and subsequently centrifuged. The supernatants were inoculated with antibodies to AKT3 or MAST4 (Table 4) and protein A/G agarose and incubated for 1.5 h at 4 °C. Centrifugation precipitates were washed three times with wash buffer and solubilized in 4× Laemmli Sample Buffer (Bio-Rad, Hercules, CA, USA) and 2-mercaptoethanol (Sigma-Aldrich). Thereafter, immunoblotting was performed using appropriate antibodies (Table 5).
4.11. Reverse Transcription–Polymerase Chain Reaction (RT–PCR)
RT–PCR was performed with 0.5 µg total RNA extracted from the three cell lines using an RNeasy kit (Qiagen, Germantown, MD, USA) to assess human and murine mRNA expression. The primer sets used are listed in Table 5 and were synthesized using Sigma Genosys (St. Louis, MO, USA). PCR products were electrophoresed on a 2% agarose gel and stained with ethidium bromide. β-Actin mRNA was amplified and used as the internal control.
4.12. Small Interfering RNA
Stealth-select RNAi interference (siRNA) targeting human AKT3 was purchased from Sigma-Aldrich. AllStars Negative Control siRNA (Qiagen) was used as a control. The cells were transfected with 10 nM siRNA using Lipofectamine 3000 (Thermo Fisher) according to the manufacturer’s recommendations.
4.13. Duolink® Proximity Ligation Assay
The assay was performed following the manufacturer’s instructions. The following is a brief description: MIA-GEM or MIA-P cells (1 × 10⁵) were seeded and incubated for 24 h on Nunc chamber slides (Thermo Fisher), and then incubated with Duolink® (Sigma-Aldrich) Blocking Solution for 24 h and 60 min at 37 °C, respectively. Anti-AKT3 (mouse monoclonal, 0.5 μg/mL, Santa Cruz) and anti-MAST4 antibodies (rabbit polyclonal, 0.5 μg/mL, Merck, Tokyo, Japan) were incubated with the Duolink® Antibody Diluent. The antibody mixture (40 μL) was added to the cell plate after removing the blocking solution and incubated at 37 °C for 2 h. Subsequently, MINUS and PLUS probe solutions (8 μL each) were added, and the plate was incubated at 37 °C for 1 h. A mixture of ligase and ligation buffer (40 μL) was added to the plate, which was subsequently incubated at 37 °C for 30 min after removing the probe solution and washing. Thereafter, a mixture of polymerase and amplification buffer (40 μL) was added, and the plate was incubated at 37 °C for 100 min. The cell plates were subsequently mounted with Duolink® In Situ Mounting Media containing 4’,6-diamidino-2-phenylindole. Finally, the cells were observed under a BZ-X710 microscope (KEYENCE).
4.14. Enzyme-Linked Immunosorbent Assay (ELISA) and Fluorometric Assay
Whole-cell lysates and a nuclear fraction were prepared as described above. Protein assays were performed using a Protein Assay Rapid Kit (Wako Pure Chemical Corporation, Osaka, Japan). Using the extracted proteins, an ELISA kit was used to measure the target proteins according to the manufacturer’s instructions. The kits that were used are listed in Table 5.
4.15. Patients
Ninety-one patients with PDAC, diagnosed and operated on at Nara Medical University Hospital, were randomly selected, and 27 were followed up to investigate survival. Table 2 summarizes the basic patient information. Sample anonymization was performed prior to analysis to ensure strict privacy protection (unlinkable anonymization) because written informed consent was not obtained. All procedures were performed in accordance with the Ethical Guidelines for Human Genome/Gene Research enacted by the Japanese Government and were approved by the Ethics Committee of Nara Medical University (Approval Number 937, 10 October 2010). For survival analysis, We divided MAST4-high and MAST4-low groups based on the median MAST4 expression.
4.16. Immunohistochemistry
Consecutive 4-μm sections were immunohistochemically stained using the immunoperoxidase technique [51]. We used 0.2 µg/mL of anti-MAST4, anti-AKT3 (Table 5), and secondary antibodies (Medical and Biological Laboratories, Nagoya, Japan). Tissue sections were color-developed using diaminobenzidine hydrochloride (DAKO) and counterstained with Meyer’s hematoxylin (Sigma-Aldrich). Cells with 1000 nuclei immunoreactions were counted to determine the labeling index (%).
4.17. Statistical Analysis
Statistical significance was calculated with two-tailed Chi-square tests, ANOVA, and unpaired Mann–Whitney tests using InStat software (version 3.1, GraphPad, Los Angeles, CA, USA). Cox proportional hazard analysis was performed using the EZR program [54]. Survival curves were generated and statistical differences were calculated using the Kaplan–Meier method and log-rank test, respectively. Significance was defined as a two-sided p-value of <0.05.
Author Contributions
Study concept and design: H.K. Acquisition of data: R.F.-T., T.S., U.K.B., S.M., R.O., R.S. and A.I. Analysis and interpretation of data: R.F.-T., K.F. and H.O. Technical support: S.K. Resources: M.S. Drafting and editing of the manuscript: R.F.-T. Critical revision of the manuscript: H.K. All authors have read and agreed to the published version of the manuscript.
Funding
This work was supported by MEXT KAKENHI Grant Numbers 19K16564 (RFT), 20K21659 (H.K.), 23K10481 (H.O.), 22K11396 (T.S.), 21K11223 (K.F.). The SCADS inhibitor kit was kindly provided by the Screening Committee of Anticancer Drugs, supported by a Grant-in-Aid for Scientific Research on Innovative Areas, Scientific Support Programs for Cancer Research, from the Ministry of Education, Culture, Sports, Science, and Technology, Japan (22H04922).
Institutional Review Board Statement
All procedures were performed in accordance with the Ethical Guidelines for Human Genome/Gene Research enacted by the Japanese Government and were approved by the Ethics Committee of Nara Medical University (Approval Number 937, 10 October 2010). Animal experiments were performed in accordance with institutional guidelines approved by the Committee for Animal Experimentation of Nara Medical University and the current regulations and standards established by the Ministry of Health, Labor, and Welfare (approval number 11716, 20 July 2016).
Informed Consent Statement
Sample anonymization was performed prior to analysis to ensure strict privacy protection (unlinkable anonymization) because written informed consent was not obtained.
Data Availability Statement
Data are contained within the article.
Acknowledgments
The authors thank Tomomi Masutani for expert assistance with the preparation of this manuscript.
Conflicts of Interest
The authors have no conflicts of interest to declare.
Abbreviations
PDAC, pancreatic ductal adenocarcinoma; MIA-P, parental MIA-PaCa-2; MIA-GEM, gemcitabine-resistant MIA-PaCa-2; GEM, gemcitabine; NS, nucleostemin; MAST4, microtubule-associated serine/threonine kinase family member 4; 5FU, 5-fluorouracil; CDDP, cisplatin; GSK3β, glycogen synthase kinase 3β; FOXO3, forkhead box protein O3; BIM, BCL2 like 11; PUMA, p53 upregulated modulator of apoptosis; FLIP, Fas-associated death domain-like interleukin-1-converting enzyme-like inhibitory protein; BCL2, B cell lymphoma 2; PI3K, phosphatidylinositol-3 kinase; JNK, c-Jun N-terminal kinase.
References
- Higashi, T.; Ishii, T.; Katanoda, K.; Fujishita, M.; Matsuda, T. Cancer Statistics in Japan, 2023; Foundation for Promotion of Cancer Research: Tokyo, Japan, 2013. [Google Scholar]
- Howlander, N.; Noone, A.; Krapcho, M. SEER Cancer Statistics Review, 1975–2017. Available online: https://seer.cancer.gov/csr/1975_2017/ (accessed on 7 November 2023).
- Kleeff, J.; Korc, M.; Apte, M.; La Vecchia, C.; Johnson, C.D.; Biankin, A.V.; Neale, R.E.; Tempero, M.; Tuveson, D.A.; Hruban, R.H.; et al. Pancreatic cancer. Nat. Rev. Dis. Primers 2016, 2, 16022. [Google Scholar] [CrossRef] [PubMed]
- Park, W.; Chawla, A.; O’Reilly, E.M. Pancreatic Cancer: A Review. JAMA 2021, 326, 851–862. [Google Scholar] [CrossRef] [PubMed]
- Mizrahi, J.D.; Surana, R.; Valle, J.W.; Shroff, R.T. Pancreatic cancer. Lancet 2020, 395, 2008–2020. [Google Scholar] [CrossRef] [PubMed]
- Binenbaum, Y.; Na’ara, S.; Gil, Z. Gemcitabine resistance in pancreatic ductal adenocarcinoma. Drug Resist. Updates 2015, 23, 55–68. [Google Scholar] [CrossRef] [PubMed]
- Zhou, P.; Li, B.; Liu, F.; Zhang, M.; Wang, Q.; Liu, Y.; Yao, Y.; Li, D. The epithelial to mesenchymal transition (EMT) and cancer stem cells: Implication for treatment resistance in pancreatic cancer. Mol. Cancer 2017, 16, 52. [Google Scholar] [CrossRef] [PubMed]
- Takagi, T.; Fujiwara-Tani, R.; Mori, S.; Kishi, S.; Nishiguchi, Y.; Sasaki, T.; Ogata, R.; Ikemoto, A.; Sasaki, R.; Ohmori, H.; et al. Lauric Acid Overcomes Hypoxia-Induced Gemcitabine Chemoresistance in Pancreatic Ductal Adenocarcinoma. Int. J. Mol. Sci. 2023, 24, 7506. [Google Scholar] [CrossRef] [PubMed]
- Fujiwara-Tani, R.; Sasaki, T.; Takagi, T.; Mori, S.; Kishi, S.; Nishiguchi, Y.; Ohmori, H.; Fujii, K.; Kuniyasu, H. Gemcitabine Resistance in Pancreatic Ductal Carcinoma Cell Lines Stems from Reprogramming of Energy Metabolism. Int. J. Mol. Sci. 2022, 23, 7824. [Google Scholar] [CrossRef] [PubMed]
- Bell, D.M.; Leung, K.K.; Wheatley, S.C.; Ng, L.J.; Zhou, S.; Ling, K.W.; Sham, M.H.; Koopman, P.; Tam, P.P.; Cheah, K.S. SOX9 directly regulates the type-II collagen gene. Nat. Genet. 1997, 16, 174–178. [Google Scholar] [CrossRef]
- Lee, S.J.; Park, J.; Lee, D.J.; Otsu, K.; Kim, P.; Mizuno, S.; Lee, M.J.; Kim, H.Y.; Harada, H.; Takahashi, S.; et al. Mast4 knockout shows the regulation of spermatogonial stem cell self-renewal via the FGF2/ERM pathway. Cell Death Differ. 2021, 28, 1441–1454. [Google Scholar] [CrossRef]
- Gongol, B.; Marin, T.L.; Jeppson, J.D.; Mayagoitia, K.; Shin, S.; Sanchez, N.; Kirsch, W.M.; Vinters, H.V.; Wilson, C.G.; Ghribi, O.; et al. Cellular hormetic response to 27-hydroxycholesterol promotes neuroprotection through AICD induction of MAST4 abundance and kinase activity. Sci. Rep. 2017, 7, 13898. [Google Scholar] [CrossRef]
- Zhang, X.; Xiao, N.; Cao, Y.; Peng, Y.; Lian, A.; Chen, Y.; Wang, P.; Gu, W.; Xiao, B.; Yu, J.; et al. De novo variants in MAST4 related to neurodevelopmental disorders with developmental delay and infantile spasms: Genotype-phenotype association. Front. Mol. Neurosci. 2023, 16, 1097553. [Google Scholar] [CrossRef] [PubMed]
- Lee, S.J.; Kim, K.H.; Lee, D.J.; Kim, P.; Park, J.; Kim, S.J.; Jung, H.S. MAST4 controls cell cycle in spermatogonial stem cells. Cell Prolif. 2023, 56, e13390. [Google Scholar] [CrossRef]
- Kim, P.; Park, J.; Lee, D.J.; Mizuno, S.; Shinohara, M.; Hong, C.P.; Jeong, Y.; Yun, R.; Park, H.; Park, S.; et al. Mast4 determines the cell fate of MSCs for bone and cartilage development. Nat. Commun. 2022, 13, 3960. [Google Scholar] [CrossRef]
- Cui, Y.; Wang, F.; Zhang, D.; Huang, J.; Yang, Y.; Xu, J.; Gao, Y.; Ding, H.; Qu, Y.; Zhang, W.; et al. Estrogen-Responsive Gene MAST4 Regulates Myeloma Bone Disease. J. Bone Miner. Res. 2022, 37, 711–723. [Google Scholar] [CrossRef]
- Rodrigues-Ferreira, S.; Morin, M.; Guichaoua, G.; Moindjie, H.; Haykal, M.M.; Collier, O.; Stoven, V.; Nahmias, C. A Network of 17 Microtubule-Related Genes Highlights Functional Deregulations in Breast Cancer. Cancers 2023, 15, 4870. [Google Scholar] [CrossRef] [PubMed]
- Nguyen, T.T.L.; Gao, H.; Liu, D.; Philips, T.J.; Ye, Z.; Lee, J.H.; Shi, G.X.; Copenhaver, K.; Zhang, L.; Wei, L.; et al. Glucocorticoids unmask silent non-coding genetic risk variants for common diseases. Nucleic Acids Res. 2022, 50, 11635–11653. [Google Scholar] [CrossRef] [PubMed]
- Di Giacomo, S.; Gullì, M.; Facchinetti, R.; Minacori, M.; Mancinelli, R.; Percaccio, E.; Scuderi, C.; Eufemi, M.; Di Sotto, A. Sorafenib Chemosensitization by Caryophyllane Sesquiterpenes in Liver, Biliary, and Pancreatic Cancer Cells: The Role of STAT3/ABC Transporter Axis. Pharmaceutics 2022, 14, 1264. [Google Scholar] [CrossRef]
- Cao, J.; Yang, J.; Ramachandran, V.; Arumugam, T.; Deng, D.; Li, Z.; Xu, L.; Logsdon, C.D. TM4SF1 Promotes Gemcitabine Resistance of Pancreatic Cancer In Vitro and In Vivo. PLoS ONE 2015, 10, e0144969. [Google Scholar] [CrossRef]
- Sierzega, M.; Pach, R.; Kulig, P.; Legutko, J.; Kulig, J. Prognostic Implications of Expression Profiling for Gemcitabine-Related Genes (hENT1, dCK, RRM1, RRM2) in Patients with Resectable Pancreatic Adenocarcinoma Receiving Adjuvant Chemotherapy. Pancreas 2017, 46, 684–689. [Google Scholar] [CrossRef]
- Guenther, M.; Surendran, S.A.; Haas, M.; Heinemann, V.; von Bergwelt-Baildon, M.; Engel, J.; Werner, J.; Boeck, S.; Ormanns, S. TPX2 expression as a negative predictor of gemcitabine efficacy in pancreatic cancer. Br. J. Cancer 2023, 129, 175–182. [Google Scholar] [CrossRef]
- Zhang, Y.; Huang, W.; Ran, Y.; Xiong, Y.; Zhong, Z.; Fan, X.; Wang, Z.; Ye, Q. miR-582-5p inhibits proliferation of hepatocellular carcinoma by targeting CDK1 and AKT3. Tumour Biol. 2015, 36, 8309–8316. [Google Scholar] [CrossRef] [PubMed]
- Jin, Y.; Tao, L.P.; Yao, S.C.; Huang, Q.K.; Chen, Z.F.; Sun, Y.J.; Jin, S.Q. MicroRNA-582-5p suppressed gastric cancer cell proliferation via targeting AKT3. Eur. Rev. Med. Pharmacol. Sci. 2017, 21, 5112–5120. [Google Scholar] [PubMed]
- Li, B.; Cociorva, O.M.; Nomanbhoy, T.; Weissig, H.; Li, Q.; Nakamura, K.; Liyanage, M.; Zhang, M.C.; Shih, A.Y.; Aban, A.; et al. Hit-to-lead optimization and kinase selectivity of imidazo[1,2-a]quinoxalin-4-amine derived JNK1 inhibitors. Bioorg. Med. Chem. Lett. 2013, 23, 5217–5222. [Google Scholar] [CrossRef] [PubMed]
- Miyamoto, K.; Araki, K.Y.; Naka, K.; Arai, F.; Takubo, K.; Yamazaki, S.; Matsuoka, S.; Miyamoto, T.; Ito, K.; Ohmura, M.; et al. Foxo3a is essential for maintenance of the hematopoietic stem cell pool. Cell Stem Cell 2007, 1, 101–112. [Google Scholar] [CrossRef] [PubMed]
- Gopinath, S.D.; Webb, A.E.; Brunet, A.; Rando, T.A. FOXO3 promotes quiescence in adult muscle stem cells during the process of self-renewal. Stem Cell Rep. 2014, 2, 414–426. [Google Scholar] [CrossRef] [PubMed]
- Tamase, A.; Muraguchi, T.; Naka, K.; Tanaka, S.; Kinoshita, M.; Hoshii, T.; Ohmura, M.; Shugo, H.; Ooshio, T.; Nakada, M.; et al. Identification of tumor-initiating cells in a highly aggressive brain tumor using promoter activity of nucleostemin. Proc. Natl. Acad. Sci. USA 2009, 106, 17163–17168. [Google Scholar] [CrossRef] [PubMed]
- Uhlén, M.; Fagerberg, L.; Hallström, B.M.; Lindskog, C.; Oksvold, P.; Mardinoglu, A.; Sivertsson, Å.; Kampf, C.; Sjöstedt, E.; Asplund, A.; et al. Human Protein Atlas—MAST4. Science 2015, 347, 1260419. Available online: https://v20.proteinatlas.org/search/MAST4 (accessed on 4 March 2018). [CrossRef]
- Missiroli, S.; Etro, D.; Buontempo, F.; Ye, K.; Capitani, S.; Neri, L.M. Nuclear translocation of active AKT is required for erythroid differentiation in erythropoietin treated K562 erythroleukemia cells. Int. J. Biochem. Cell Biol. 2009, 41, 570–577. [Google Scholar] [CrossRef] [PubMed]
- Xuan Nguyen, T.L.; Choi, J.W.; Lee, S.B.; Ye, K.; Woo, S.D.; Lee, K.H.; Ahn, J.Y. Akt phosphorylation is essential for nuclear translocation and retention in NGF-stimulated PC12 cells. Biochem. Biophys. Res. Commun. 2006, 349, 789–798. [Google Scholar] [CrossRef]
- Martelli, A.M.; Tabellini, G.; Bressanin, D.; Ognibene, A.; Goto, K.; Cocco, L.; Evangelisti, C. The emerging multiple roles of nuclear Akt. Biochim. Biophys. Acta 2012, 1823, 2168–2178. [Google Scholar] [CrossRef]
- Jain, M.V.; Jangamreddy, J.R.; Grabarek, J.; Schweizer, F.; Klonisch, T.; Cieślar-Pobuda, A.; Łos, M.J. Nuclear localized Akt enhances breast cancer stem-like cells through counter-regulation of p21(Waf1/Cip1) and p27(kip1). Cell Cycle 2015, 14, 2109–2120. [Google Scholar] [CrossRef] [PubMed]
- Furuyama, T.; Nakazawa, T.; Nakano, I.; Mori, N. Identification of the differential distribution patterns of mRNAs and consensus binding sequences for mouse DAF-16 homologues. Biochem. J. 2000, 349 Pt 2, 629–634. [Google Scholar] [CrossRef] [PubMed]
- Skurk, C.; Maatz, H.; Kim, H.S.; Yang, J.; Abid, M.R.; Aird, W.C.; Walsh, K. The Akt-regulated forkhead transcription factor FOXO3a controls endothelial cell viability through modulation of the caspase-8 inhibitor FLIP. J. Biol. Chem. 2004, 279, 1513–1525. [Google Scholar] [CrossRef] [PubMed]
- Wang, J.; Liu, S.; Yin, Y.; Li, M.; Wang, B.; Yang, L.; Jiang, Y. FOXO3-mediated up-regulation of Bim contributes to rhein-induced cancer cell apoptosis. Apoptosis 2015, 20, 399–409. [Google Scholar] [CrossRef] [PubMed]
- Zhao, Z.; Wang, J.; Tang, J.; Liu, X.; Zhong, Q.; Wang, F.; Hu, W.; Yuan, Z.; Nie, C.; Wei, Y. JNK- and Akt-mediated Puma expression in the apoptosis of cisplatin-resistant ovarian cancer cells. Biochem. J. 2012, 444, 291–301. [Google Scholar] [CrossRef] [PubMed]
- Tsuji, T.; Maeda, Y.; Kita, K.; Murakami, K.; Saya, H.; Takemura, H.; Inaki, N.; Oshima, M.; Oshima, H. FOXO3 is a latent tumor suppressor for FOXO3-positive and cytoplasmic-type gastric cancer cells. Oncogene 2021, 40, 3072–3086. [Google Scholar] [CrossRef] [PubMed]
- Yu, D.S.; Chen, Y.T.; Wu, C.L.; Yu, C.P. Expression of p-FOXO3/FOXO3 in bladder cancer and its correlation with clinicopathology and tumor recurrence. Int. J. Clin. Exp. Pathol. 2017, 10, 11069–11074. [Google Scholar] [PubMed]
- Liu, H.; Song, Y.; Qiu, H.; Liu, Y.; Luo, K.; Yi, Y.; Jiang, G.; Lu, M.; Zhang, Z.; Yin, J.; et al. Downregulation of FOXO3a by DNMT1 promotes breast cancer stem cell properties and tumorigenesis. Cell Death Differ. 2020, 27, 966–983. [Google Scholar] [CrossRef] [PubMed]
- Audesse, A.J.; Karashchuk, G.; Gardell, Z.A.; Lakis, N.S.; Maybury-Lewis, S.Y.; Brown, A.K.; Leeman, D.S.; Teo, Y.V.; Neretti, N.; Anthony, D.C.; et al. FOXO3 regulates a common genomic program in aging and glioblastoma stem cells. Aging Cancer 2021, 2, 137–159. [Google Scholar] [CrossRef]
- Garland, P.; Quraishe, S.; French, P.; O’Connor, V. Expression of the MAST family of serine/threonine kinases. Brain Res. 2008, 1195, 12–19. [Google Scholar] [CrossRef]
- Songyang, Z.; Fanning, A.S.; Fu, C.; Xu, J.; Marfatia, S.M.; Chishti, A.H.; Crompton, A.; Chan, A.C.; Anderson, J.M.; Cantley, L.C. Recognition of unique carboxyl-terminal motifs by distinct PDZ domains. Science 1997, 275, 73–77. [Google Scholar] [CrossRef]
- Hung, A.Y.; Sheng, M. PDZ domains: Structural modules for protein complex assembly. J. Biol. Chem. 2002, 277, 5699–5702. [Google Scholar] [CrossRef]
- Jeleń, F.; Oleksy, A.; Smietana, K.; Otlewski, J. PDZ domains—Common players in the cell signaling. Acta Biochim. Pol. 2003, 50, 985–1017. [Google Scholar] [CrossRef] [PubMed]
- Harris, B.Z.; Lim, W.A. Mechanism and role of PDZ domains in signaling complex assembly. J. Cell Sci. 2001, 114 Pt 18, 3219–3231. [Google Scholar] [CrossRef]
- Valiente, M.; Andrés-Pons, A.; Gomar, B.; Torres, J.; Gil, A.; Tapparel, C.; Antonarakis, S.E.; Pulido, R. Binding of PTEN to specific PDZ domains contributes to PTEN protein stability and phosphorylation by microtubule-associated serine/threonine kinases. J. Biol. Chem. 2005, 280, 28936–28943. [Google Scholar] [CrossRef]
- Lee, H.J.; Zheng, J.J. PDZ domains and their binding partners: Structure, specificity, and modification. Cell Commun. Signal 2010, 8, 8. [Google Scholar] [CrossRef] [PubMed]
- Préhaud, C.; Wolff, N.; Terrien, E.; Lafage, M.; Mégret, F.; Babault, N.; Cordier, F.; Tan, G.S.; Maitrepierre, E.; Ménager, P.; et al. Attenuation of rabies virulence: Takeover by the cytoplasmic domain of its envelope protein. Sci. Signal 2010, 3, ra5. [Google Scholar] [CrossRef] [PubMed]
- Kuniyasu, H.; Oue, N.; Wakikawa, A.; Shigeishi, H.; Matsutani, N.; Kuraoka, K.; Ito, R.; Yokozaki, H.; Yasui, W. Expression of receptors for advanced glycation end-products (RAGE) is closely associated with the invasive and metastatic activity of gastric cancer. J. Pathol. 2002, 196, 163–170. [Google Scholar] [CrossRef]
- Kishi, S.; Fujiwara-Tani, R.; Honoki, K.; Sasaki, R.; Mori, S.; Ohmori, H.; Sasaki, T.; Miyagawa, Y.; Kawahara, I.; Kido, A.; et al. Oxidized high mobility group B-1 enhances metastability of colorectal cancer via modification of mesenchymal stem/stromal cells. Cancer Sci. 2022, 113, 2904–2915. [Google Scholar] [CrossRef]
- Kuniyasu, H.; Luo, Y.; Fujii, K.; Sasahira, T.; Moriwaka, Y.; Tatsumoto, N.; Sasaki, T.; Yamashita, Y.; Ohmori, H. CD10 enhances metastasis of colorectal cancer by abrogating the anti-tumoural effect of methionine-enkephalin in the liver. Gut 2010, 59, 348–356. [Google Scholar] [CrossRef]
- Kuniyasu, H.; Yasui, W.; Pettaway, C.A.; Yano, S.; Oue, N.; Tahara, E.; Fidler, I.J. Interferon-alpha prevents selection of doxorubicin-resistant undifferentiated-androgen-insensitive metastatic human prostate cancer cells. Prostate 2001, 49, 19–29. [Google Scholar] [CrossRef] [PubMed]
- Kanda, Y. Investigation of the freely available easy-to-use software ’EZR’ for medical statistics. Bone Marrow Transplant. 2013, 48, 452–458. [Google Scholar] [CrossRef] [PubMed]

Disclaimer/Publisher’s Note: The statements, opinions and data contained in all publications are solely those of the individual author(s) and contributor(s) and not of MDPI and/or the editor(s). MDPI and/or the editor(s) disclaim responsibility for any injury to people or property resulting from any ideas, methods, instructions or products referred to in the content. |
© 2024 by the authors. Licensee MDPI, Basel, Switzerland. This article is an open access article distributed under the terms and conditions of the Creative Commons Attribution (CC BY) license (https://creativecommons.org/licenses/by/4.0/).