
Effect of Empagliflozin with or without the Addition of Evolocumab on HDL Subspecies in Individuals with Type 2 Diabetes Mellitus: A Post Hoc Analysis of the EXCEED-BHS3 Trial
 , , , , , , , , and
on behalf of the EXCEED-BHS3 Group
, , , , , , , , and
on behalf of the EXCEED-BHS3 Group
Abstract
:1. Introduction
2. Results
3. Discussion
4. Materials and Methods
4.1. Study Design
4.2. HDL Subspecies Isolation and Cholesterol Dosage
4.3. Statistical Analysis
5. Conclusions
Author Contributions
Funding
Institutional Review Board Statement
Informed Consent Statement
Data Availability Statement
Conflicts of Interest
References
- Gupta, R.; Lodha, S.; Sharma, K.K.; Sharma, S.K.; Makkar, J.S.; Bana, A.; Natani, V.; Kumar, S.; Bharati, S.; Sharma, S.K.; et al. Association of type 2 diabetes with coronary risk factors, clinical presentation, angiography, coronary interventions and follow-up outcomes: A single centre prospective registry. Diabetes Metab. Syndr. 2023, 17, 102709. [Google Scholar] [CrossRef] [PubMed]
- Khanam, A.; Ahmad, S.; Husain, A. A Perspective on the Impact of Advanced Glycation End Products in the Progression of Diabetic Nephropathy. Curr. Protein Pept. Sci. 2023, 24, 2–6. [Google Scholar] [CrossRef] [PubMed]
- Ormazabal, V.; Nair, S.; Elfeky, O.; Aguayo, C.; Salomon, C.; Zuñiga, F.A. Association between insulin resistance and the development of cardiovascular disease. Cardiovasc. Diabetol. 2018, 17, 122. [Google Scholar] [CrossRef] [PubMed]
- Bonilha, I.; Zimetti, F.; Zanotti, I.; Papotti, B.; Sposito, A.C. Dysfunctional High-Density Lipoproteins in Type 2 Diabetes Mellitus: Molecular Mechanisms and Therapeutic Implications. J. Clin. Med. 2021, 10, 2233. [Google Scholar] [CrossRef] [PubMed]
- Sabatine, M.S.; Giugliano, R.P.; Keech, A.C.; Honarpour, N.; Wiviott, S.D.; Murphy, S.A.; Kuder, J.F.; Wang, H.; Liu, T.; Wasserman, S.M.; et al. Evolocumab and Clinical Outcomes in Patients with Cardiovascular Disease. N. Engl. J. Med. 2017, 376, 1713–1722. [Google Scholar] [CrossRef] [PubMed]
- Girona, J.; Ibarretxe, D.; Plana, N.; Guaita-Esteruelas, S.; Amigo, N.; Heras, M.; Kuder, J.F.; Wang, H.; Liu, T.; Wasserman, S.M.; et al. Circulating PCSK9 levels and CETP plasma activity are independently associated in patients with metabolic diseases. Cardiovasc. Diabetol. 2016, 15, 107. [Google Scholar] [CrossRef] [PubMed]
- Robinson, J.G.; Farnier, M.; Krempf, M.; Bergeron, J.; Luc, G.; Averna, M.; Stroes, E.S.; Langslet, G.; Raal, F.J.; El Shahawy, M.; et al. Efficacy and safety of alirocumab in reducing lipids and cardiovascular events. N. Engl. J. Med. 2015, 372, 1489–1499. [Google Scholar] [CrossRef] [PubMed]
- Blom, D.J.; Hala, T.; Bolognese, M.; Lillestol, M.J.; Toth, P.D.; Burgess, L.; Ceska, R.; Roth, E.; Koren, M.J.; Ballantyne, C.M.; et al. A 52-week placebo-controlled trial of evolocumab in hyperlipidemia. N. Engl. J. Med. 2014, 370, 1809–1819. [Google Scholar] [CrossRef] [PubMed]
- Sabatine, M.S.; Giugliano, R.P.; Wiviott, S.D.; Raal, F.J.; Blom, D.J.; Robinson, J.; Ballantyne, C.M.; Somaratne, R.; Legg, J.; Wasserman, S.M.; et al. Efficacy and safety of evolocumab in reducing lipids and cardiovascular events. N. Engl. J. Med. 2015, 372, 1500–1509. [Google Scholar] [CrossRef] [PubMed]
- Fitchett, D.; Zinman, B.; Wanner, C.; Lachin, J.M.; Hantel, S.; Salsali, A.; Johansen, O.E.; Woerle, H.J.; Broedl, U.C.; Inzucchi, S.E. Heart failure outcomes with empagliflozin in patients with type 2 diabetes at high cardiovascular risk: Results of the EMPA-REG OUTCOME® trial. Eur. Heart J. 2016, 37, 1526–1534. [Google Scholar] [CrossRef]
- Lund, S.S.; Sattar, N.; Salsali, A.; Neubacher, D.; Ginsberg, H.N. Potential contribution of haemoconcentration to changes in lipid variables with empagliflozin in patients with type 2 diabetes: A post hoc analysis of pooled data from four phase 3 randomized clinical trials. Diabetes Obes. Metab. 2021, 23, 2763–2774. [Google Scholar] [CrossRef] [PubMed]
- Sposito, A.C.; Breder, I.; Barreto, J.; Breder, J.; Bonilha, I.; Lima, M.; Oliveira, A.; Wolf, V.; Luchiari, B.; Carmo, H.R.D.; et al. Evolocumab on top of empagliflozin improves endothelial function of individuals with diabetes: Randomized active-controlled trial. Cardiovasc. Diabetol. 2022, 21, 147. [Google Scholar] [CrossRef] [PubMed]
- Hirose, S.; Nakajima, S.; Iwahashi, Y.; Seo, A.; Takahashi, T.; Tamori, Y. Impact of the 8-week Administration of Tofogliflozin for Glycemic Control and Body Composition in Japanese Patients with Type 2 Diabetes Mellitus. Intern. Med. 2016, 55, 3239–3245. [Google Scholar] [CrossRef] [PubMed]
- Kashyap, S.R.; Osme, A.; Ilchenko, S.; Golizeh, M.; Lee, K.; Wang, S.; Bena, J.; Previs, S.F.; Smith, J.D.; Kasumov, T. Glycation Reduces the Stability of ApoAI and Increases HDL Dysfunction in Diet-Controlled Type 2 Diabetes. J. Clin. Endocrinol. Metab. 2018, 103, 388–396. [Google Scholar] [CrossRef] [PubMed]
- Fadini, G.P.; Bonora, B.M.; Zatti, G.; Vitturi, N.; Iori, E.; Marescotti, M.C.; Albiero, M.; Avogaro, A. Effects of the SGLT2 inhibitor dapagliflozin on HDL cholesterol, particle size, and cholesterol efflux capacity in patients with type 2 diabetes: A randomized placebo-controlled trial. Cardiovasc. Diabetol. 2017, 16, 42. [Google Scholar] [CrossRef] [PubMed]
- Sánchez-García, A.; Simental-Mendía, M.; Millán-Alanís, J.M.; Simental-Mendía, L.E. Effect of sodium-glucose co-transporter 2 inhibitors on lipid profile: A systematic review and meta-analysis of 48 randomized controlled trials. Pharmacol. Res. 2020, 160, 105068. [Google Scholar] [CrossRef] [PubMed]
- Filippas-Ntekouan, S.; Tsimihodimos, V.; Filippatos, T.; Dimitriou, T.; Elisaf, M. SGLT-2 inhibitors: Pharmacokinetics characteristics and effects on lipids. Expert. Opin. Drug Metab. Toxicol. 2018, 14, 1113–1121. [Google Scholar] [CrossRef] [PubMed]
- Robinson, J.G.; Nedergaard, B.S.; Rogers, W.J.; Fialkow, J.; Neutel, J.M.; Ramstad, D.; Somaratne, R.; Legg, J.C.; Nelson, P.; Scott, R.; et al. Effect of evolocumab or ezetimibe added to moderate- or high-intensity statin therapy on LDL-C lowering in patients with hypercholesterolemia: The LAPLACE-2 randomized clinical trial. JAMA 2014, 311, 1870–1882. [Google Scholar] [CrossRef] [PubMed]
- Raal, F.J.; A Stein, E.; Dufour, R.; Turner, T.; Civeira, F.; Burgess, L.; Langslet, G.; Scott, R.; Olsson, A.G.; Sullivan, D.; et al. PCSK9 inhibition with evolocumab (AMG 145) in heterozygous familial hypercholesterolaemia (RUTHERFORD-2): A randomised, double-blind, placebo-controlled trial. Lancet 2015, 385, 331–340. [Google Scholar] [CrossRef]
- Zhang, X.; Stiekema, L.C.A.; Stroes, E.S.G.; Groen, A.K. Metabolic effects of PCSK9 inhibition with Evolocumab in subjects with elevated Lp(a). Lipids Health Dis. 2020, 19, 91. [Google Scholar] [CrossRef]
- Guérin, M.; Dolphin, P.J.; Talussot, C.; Gardette, J.; Berthézène, F.; Chapman, M.J. Pravastatin modulates cholesteryl ester transfer from HDL to apoB-containing lipoproteins and lipoprotein subspecies profile in familial hypercholesterolemia. Arterioscler. Thromb. Vasc. Biol. 1995, 15, 1359–1368. [Google Scholar] [CrossRef] [PubMed]
- Sposito, A.C. HDL metrics, let’s call the number thing off? Atherosclerosis 2016, 251, 525–527. [Google Scholar] [CrossRef] [PubMed]
- Breder, I.; Breder, J.C.; Bonilha, I.; Munhoz, D.B.; Medorima, S.T.K.; Oliveira, D.C.; Carmo, H.R.D.; Moreira, C.; Kontush, A.; Zimetti, F.; et al. Rationale and design of the expanded combination of evolocumab plus empagliflozin in diabetes: EXCEED-BHS3 trial. Ther. Adv. Chronic Dis. 2020, 11, 2040622320959248. [Google Scholar] [CrossRef] [PubMed]
- Rosenson, R.S.; Brewer, H.B.; Chapman, M.J.; Fazio, S.; Hussain, M.M.; Kontush, A.; Krauss, R.M.; Otvos, J.D.; Remaley, A.T.; Schaefer, E.J. HDL measures, particle heterogeneity, proposed nomenclature, and relation to atherosclerotic cardiovascular events. Clin. Chem. 2011, 57, 392–410. [Google Scholar] [CrossRef]


| E | EE | |
|---|---|---|
| 55 Patients | 55 Patients | |
| Gender male, % | 69 | 73 |
| Age, years | 58 ± 8 | 58 ± 6 |
| Body Mass Index, kg/m2 | 31 ± 4.2 | 31 ± 5.1 |
| Waist circumference, cm | 106 ± 15 | 105 ± 14 |
| Hypertension, % | 67 | 76 |
| T2D duration, years | 8 (5–15) | 10 (6–15) |
| HbA1c, % | 8.0 (7.5–8.3) | 7.7(7.2–8.4) |
| HDL-C, mg/dL | 36 (32–43) | 41 (35–47) * |
| LDL-C, mg/dL | 83 ± 13 | 84 ± 13 |
| VLDL-C, mg/dL | 32 (25–44) | 33 (22–43) |
| Triglycerides, mg/dL | 166 (110) | 163 (108) |
| Thiazides diuretics, % | 33 | 38 |
| Oral hypoglycemic, % | 44 | 38 |
| Sulfonylureas, % | 44 | 45 |
| Metformin, % | 100 | 100 |
| Statin use, % | 100 | 100 |
| Variable | E | EE | p |
|---|---|---|---|
| Office SBP, mmHg | −10 (18) | −4 (20) | 0.284 |
| Office DBP, mmHg | 4 (11) | −2 (13) | 0.197 |
| Fasting Blood Glucose, mg/dL | −38 (48) | −41 (44.5) | 0.089 |
| HbA1c, % | −0.7 (1.0) | −0.9 (0.9) | 0.824 |
| E | EE | ||||||||
|---|---|---|---|---|---|---|---|---|---|
| Baseline | 16 Weeks | p † | Percentage Changes | Baseline | 16 Weeks | p † | Percentage Changes | p # | |
| HDL-C | 36 ± 9 | 39 ± 10 | 0.004 * | 8.3% | 40 ± 11 | 42 ± 11 | <0.001 * | 5.0% | 0.430 |
| LDL-C | 71 ± 18 | 70 ± 13 | 0.063 | 0 | 71 ± 18 | 28 ± 16 | <0.001 * | −60.5% | <0.001 * |
| VLDL-C | 36 ± 15 | 31 ± 15 | 0.008 * | −13.8% | 34 ± 15 | 26 ± 12 | <0.001 * | −23.5% | 0.042 * |
| TG | 179 ± 77 | 154 ± 74 | 0.008 * | −13.9% | 170 ± 75 | 129 ± 62 | <0.001 * | −24.1% | 0.042 * |
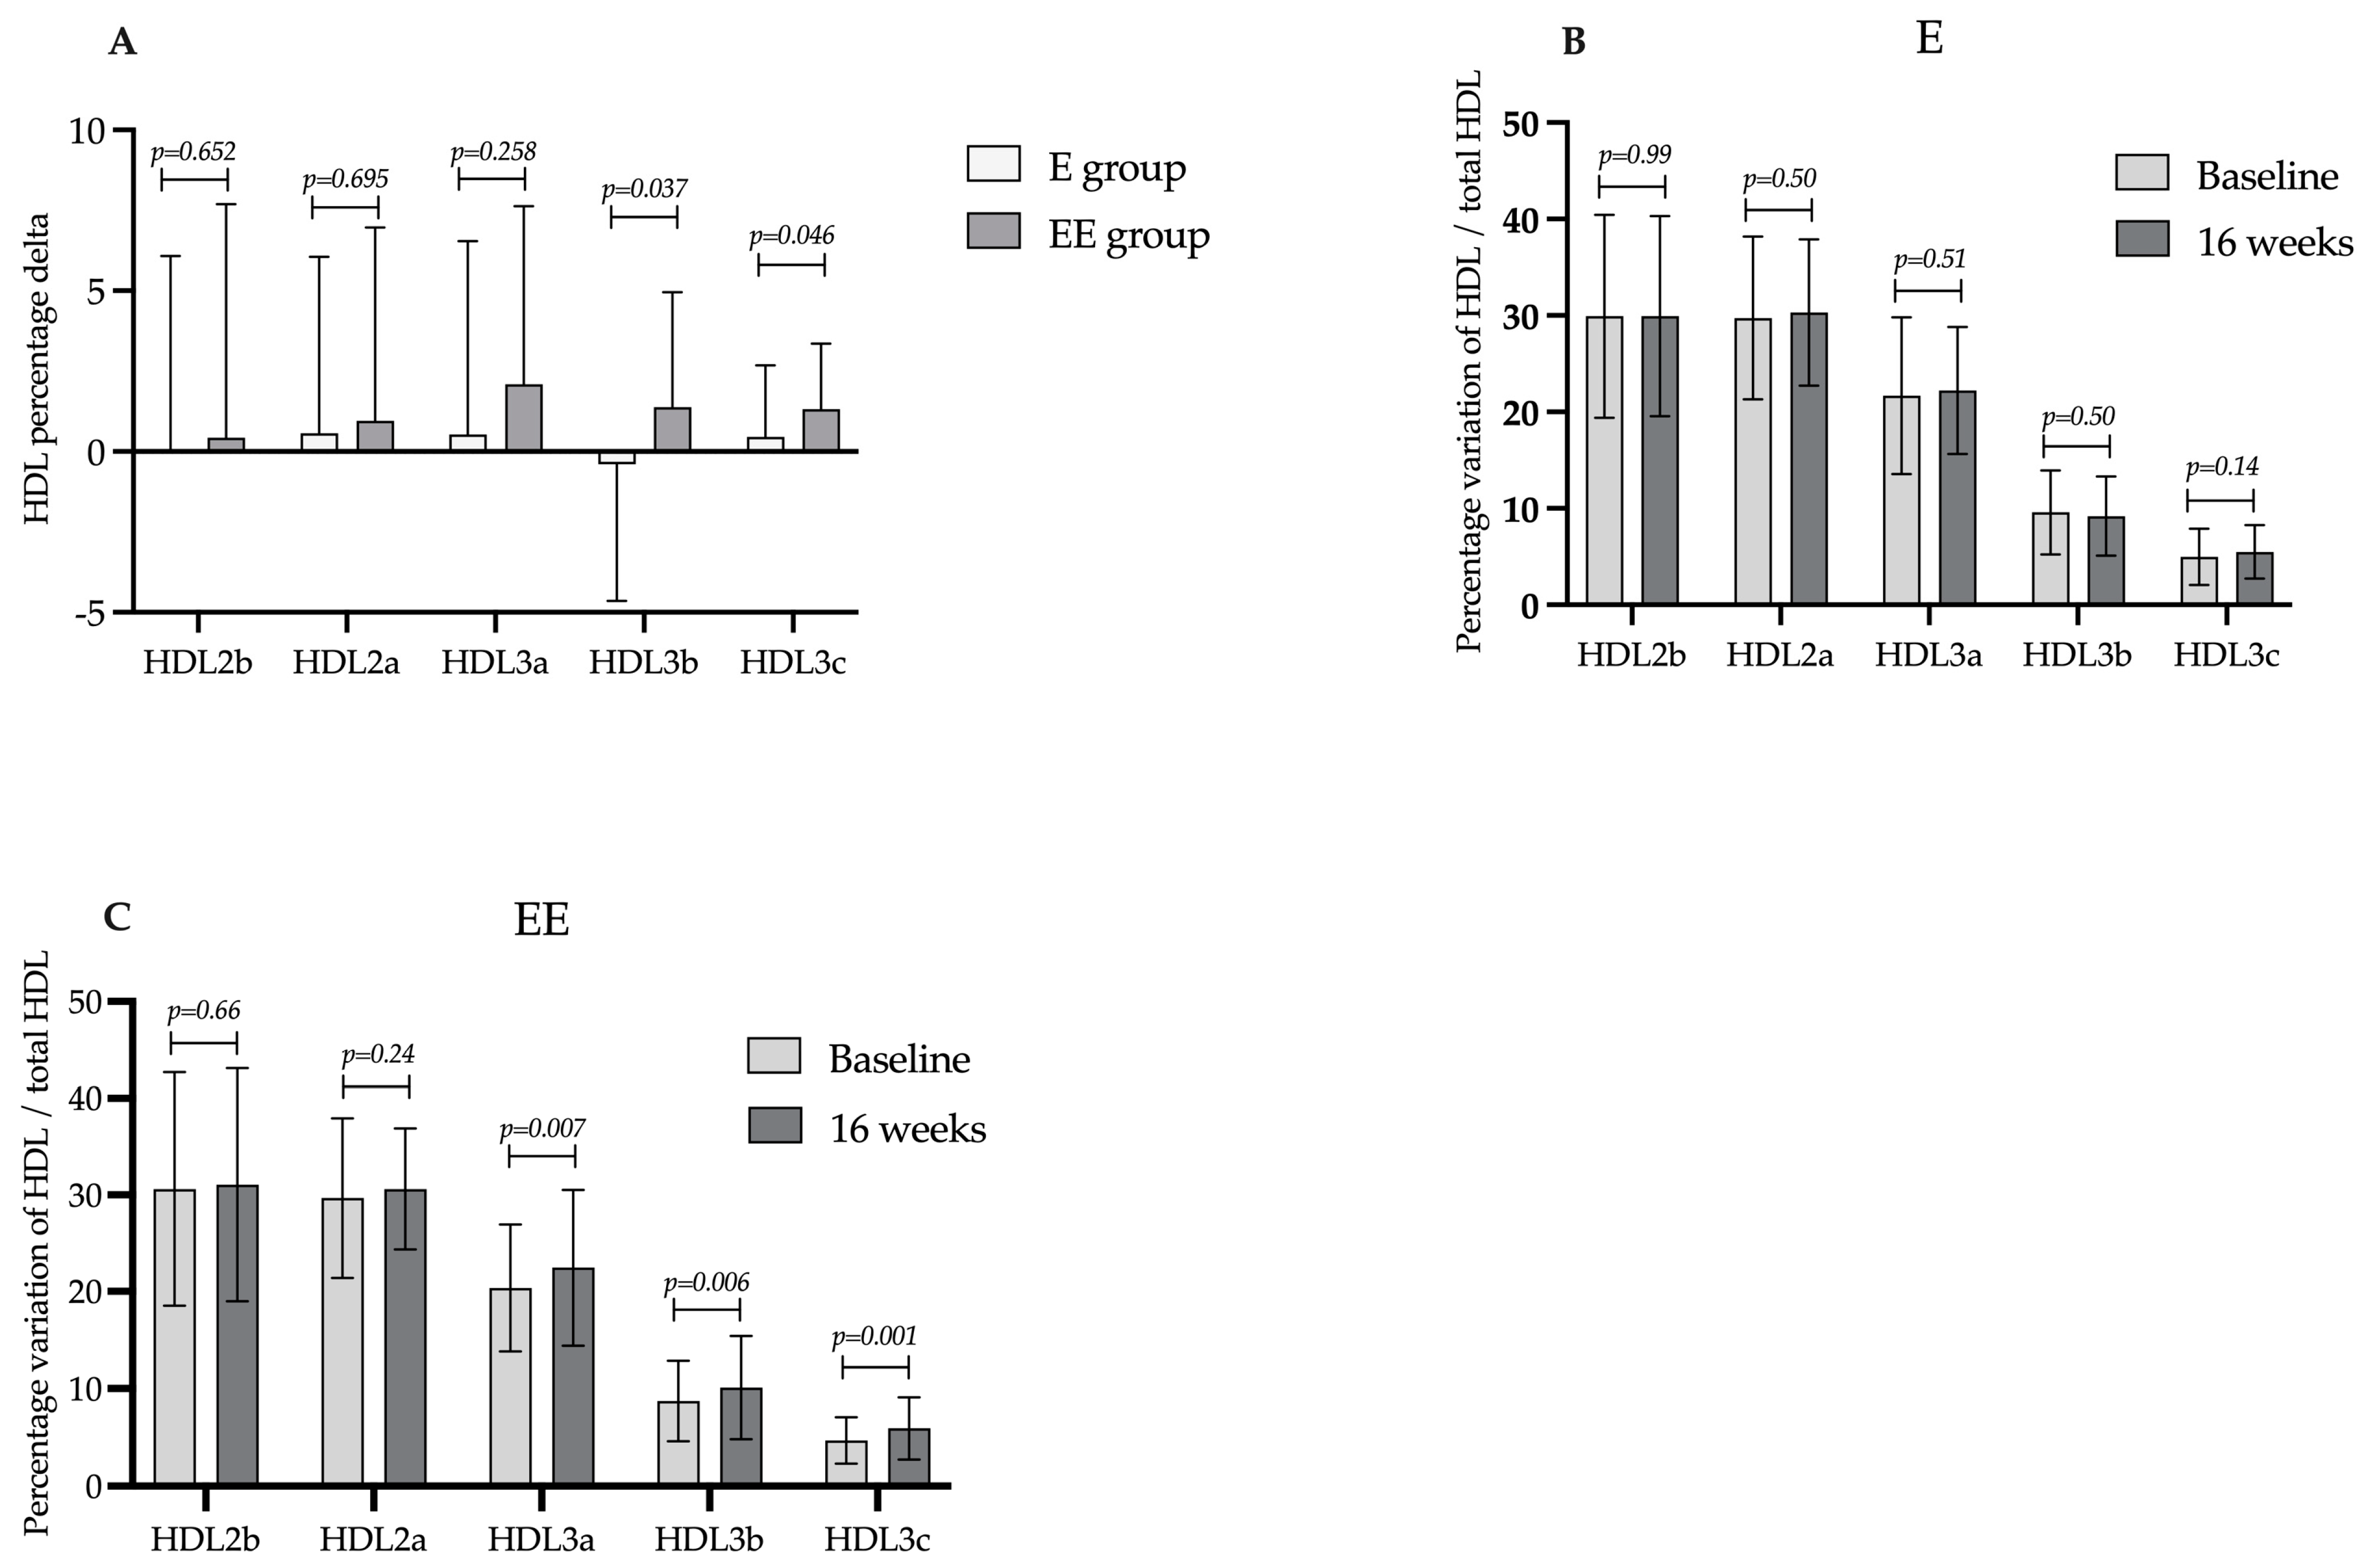
| HDL2b-C | 11.4 ± 5.1 | 12.1 ± 5.4 | 0.068 | 6.1% | 13.1 ± 6.9 | 13.4 ± 7.2 | 0.528 | 2.3% | 0.247 |
| HDL2a-C | 10.9 ± 3.3 | 11.7 ± 3.1 | 0.020 * | 7.3% | 12.5 ± 3.9 | 13.0 ± 3.6 | 0.155 | 4.0% | <0.001 * |
| HDL3a-C | 8.3 ± 3.6 | 8.9 ± 3.3 | 0.040 * | 7.2% | 8.6 ± 3.1 | 9.4 ± 3.4 | 0.009 * | 9.3% | <0.001 * |
| HDL3b-C | 3.8 ± 2.2 | 3.8 ± 2.0 | 0.951 | 0 | 3.6 ± 1.8 | 4.2 ± 2.4 | 0.011 * | 16.6% | <0.001 * |
| HDL3c-C | 2.0 ± 1.4 | 2.3 ± 1.3 | 0.043 * | 15.0% | 2.0 ± 1.1 | 2.5 ± 1.3 | <0.001 * | 25.0% | 0.002 * |
Disclaimer/Publisher’s Note: The statements, opinions and data contained in all publications are solely those of the individual author(s) and contributor(s) and not of MDPI and/or the editor(s). MDPI and/or the editor(s) disclaim responsibility for any injury to people or property resulting from any ideas, methods, instructions or products referred to in the content. |
© 2024 by the authors. Licensee MDPI, Basel, Switzerland. This article is an open access article distributed under the terms and conditions of the Creative Commons Attribution (CC BY) license (https://creativecommons.org/licenses/by/4.0/).
Share and Cite
Bonilha, I.; Gomes, É.I.L.; Carmo, H.R.P.; Breder, I.; Barreto, J.; Breder, J.; Munhoz, D.B.; Carvalho, L.S.F.; Quinaglia, T.; Kimura-Medorima, S.T.; et al. Effect of Empagliflozin with or without the Addition of Evolocumab on HDL Subspecies in Individuals with Type 2 Diabetes Mellitus: A Post Hoc Analysis of the EXCEED-BHS3 Trial. Int. J. Mol. Sci. 2024, 25, 4108. https://doi.org/10.3390/ijms25074108
Bonilha I, Gomes ÉIL, Carmo HRP, Breder I, Barreto J, Breder J, Munhoz DB, Carvalho LSF, Quinaglia T, Kimura-Medorima ST, et al. Effect of Empagliflozin with or without the Addition of Evolocumab on HDL Subspecies in Individuals with Type 2 Diabetes Mellitus: A Post Hoc Analysis of the EXCEED-BHS3 Trial. International Journal of Molecular Sciences. 2024; 25(7):4108. https://doi.org/10.3390/ijms25074108
Chicago/Turabian StyleBonilha, Isabella, Érica Ivana Lázaro Gomes, Helison R. P. Carmo, Ikaro Breder, Joaquim Barreto, Jessica Breder, Daniel B. Munhoz, Luiz Sergio F. Carvalho, Thiago Quinaglia, Sheila T. Kimura-Medorima, and et al. 2024. "Effect of Empagliflozin with or without the Addition of Evolocumab on HDL Subspecies in Individuals with Type 2 Diabetes Mellitus: A Post Hoc Analysis of the EXCEED-BHS3 Trial" International Journal of Molecular Sciences 25, no. 7: 4108. https://doi.org/10.3390/ijms25074108