


Effect of Addition of Tannin Extract from Underutilized Resources on Allergenic Proteins, Color and Textural Properties of Egg White Gels

 ,
,
Abstract
1. Introduction
2. Results and Discussion
2.1. Characteristics of EWS and Tannin Materials Solution
2.2. Evaluation of EW Allergen
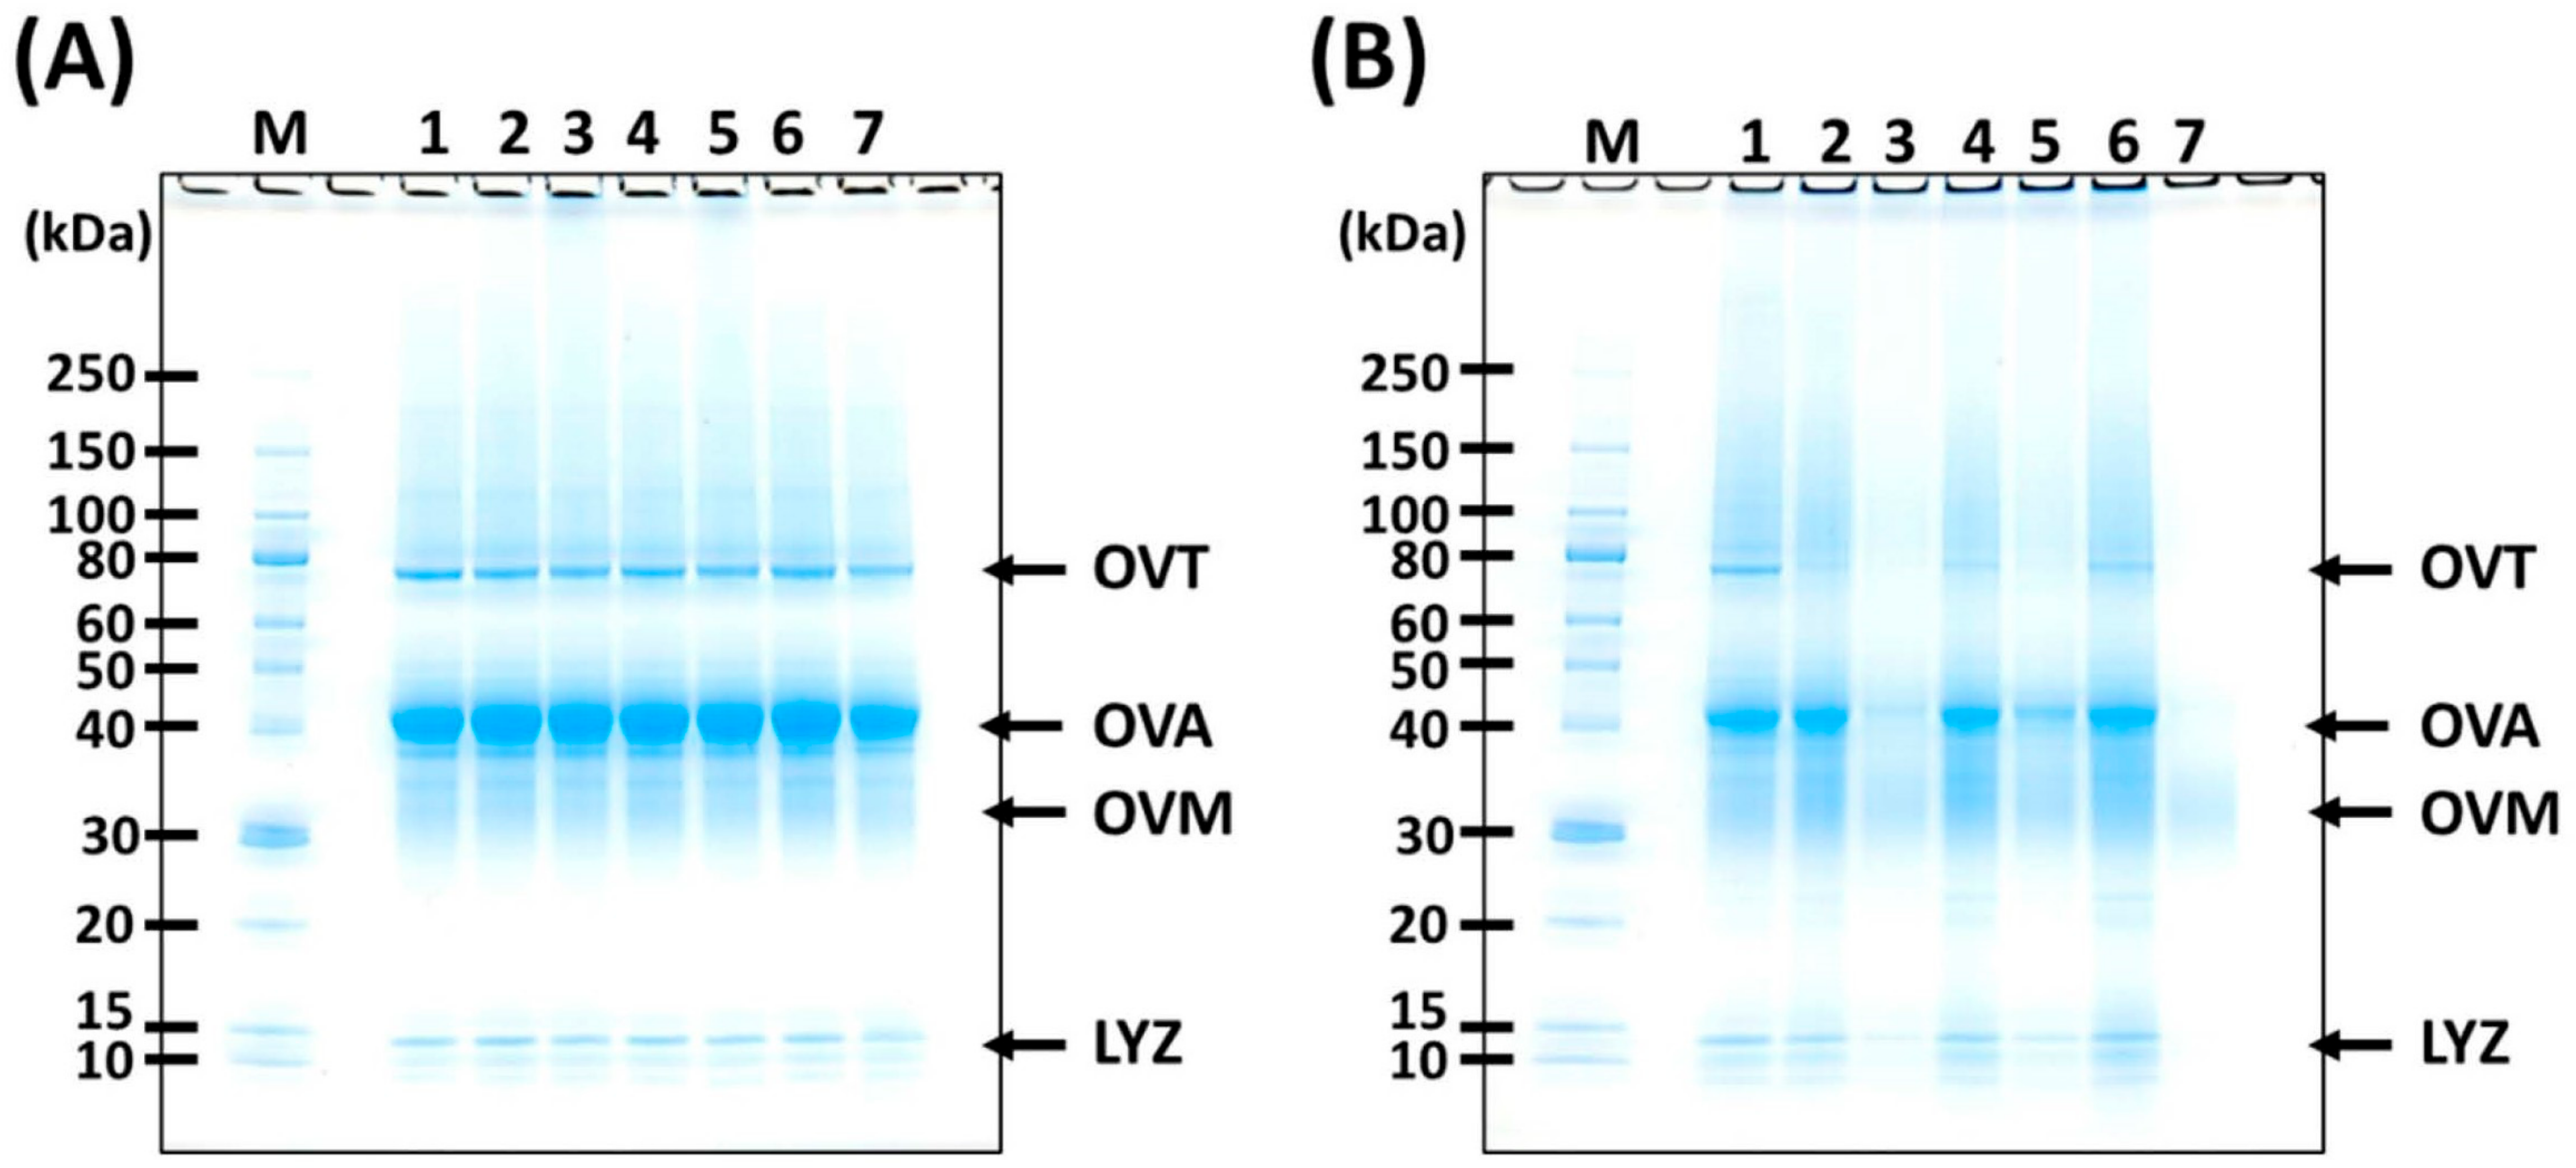
2.2.1. Sodium Dodecyl Sulfate-Polyacrylamide Gel Electrophoresis (SDS-PAGE) Analysis
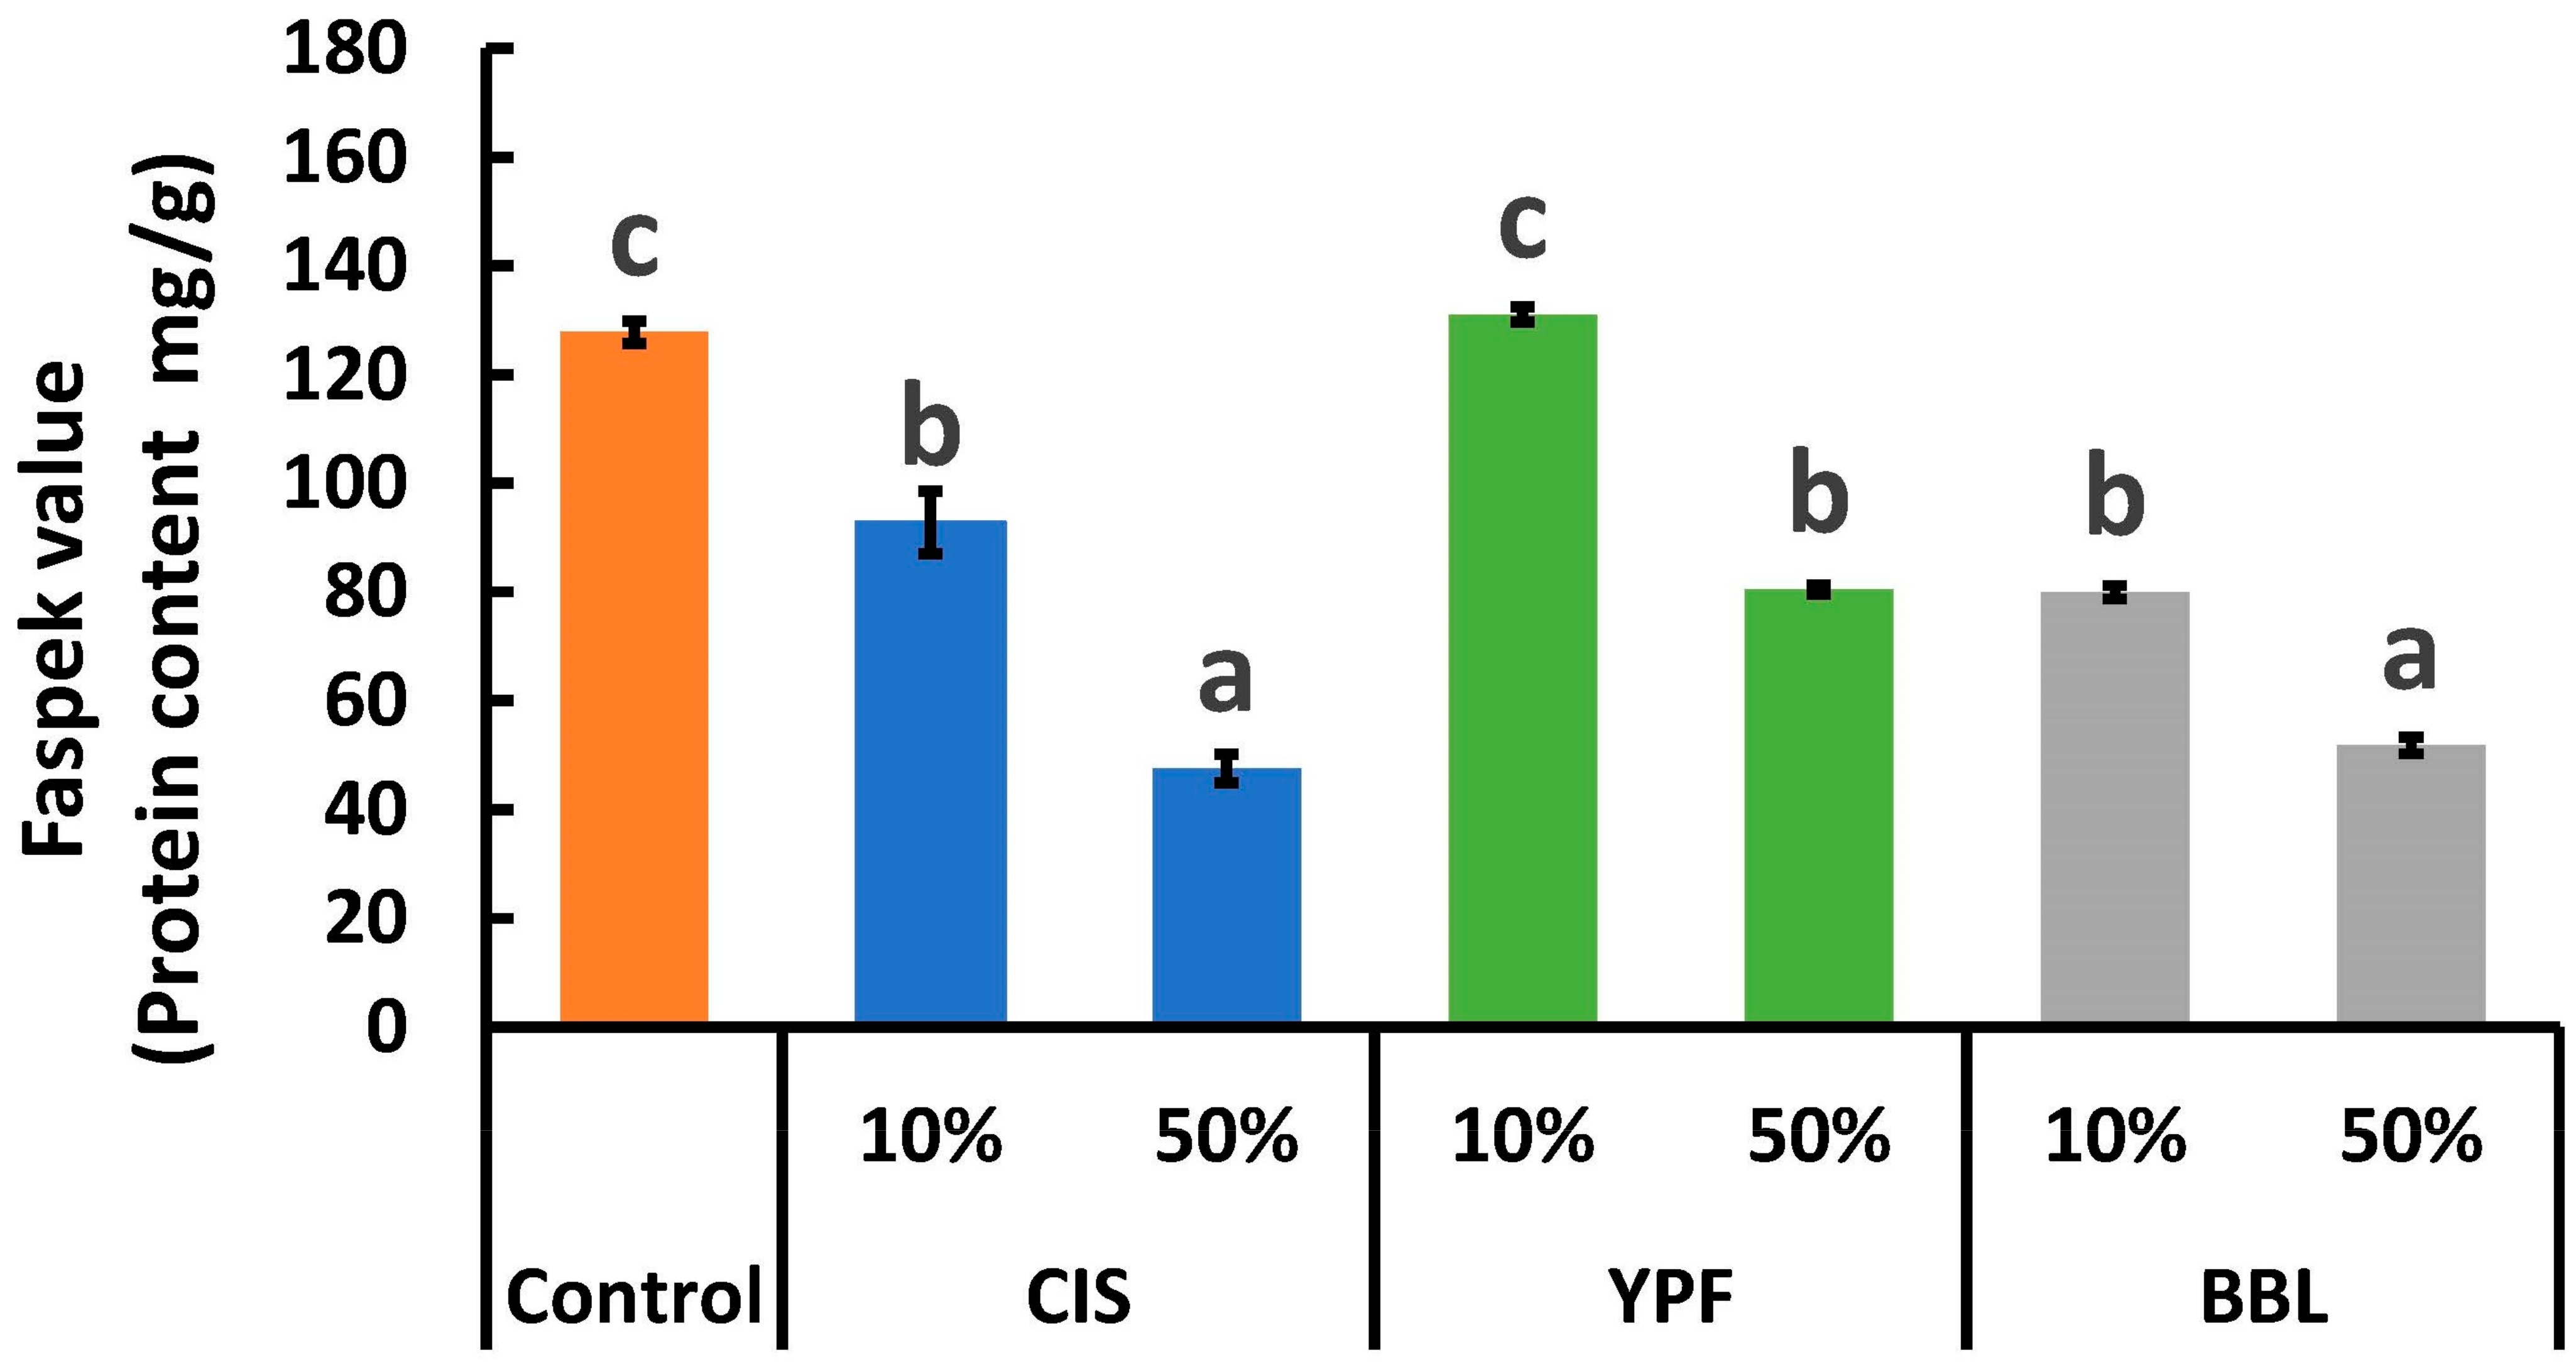
2.2.2. Enzyme-Linked Immunosorbent Assay (ELISA)
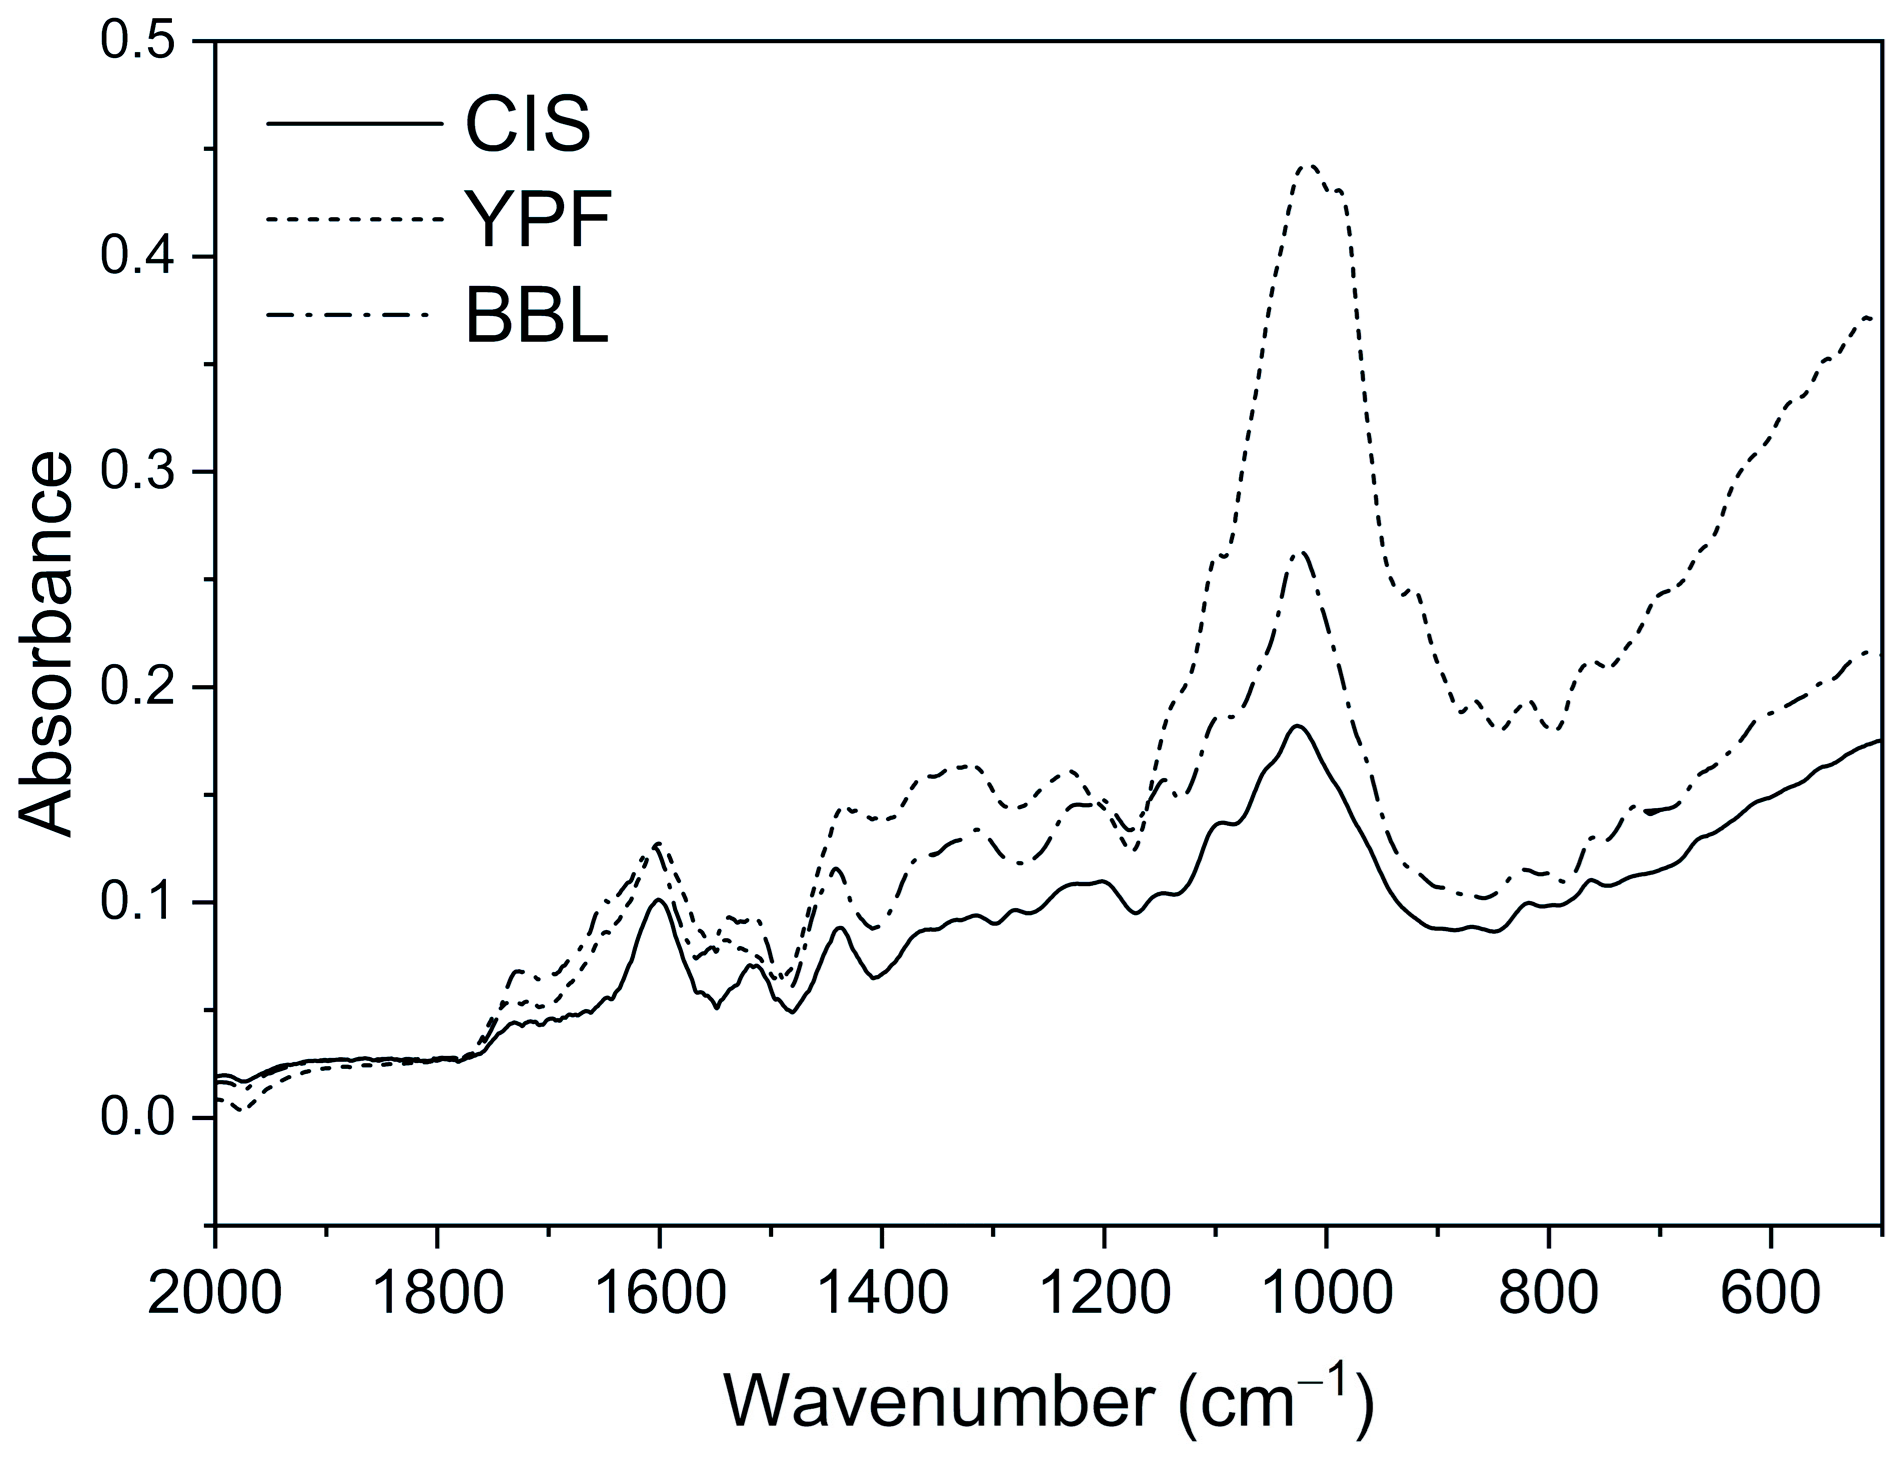
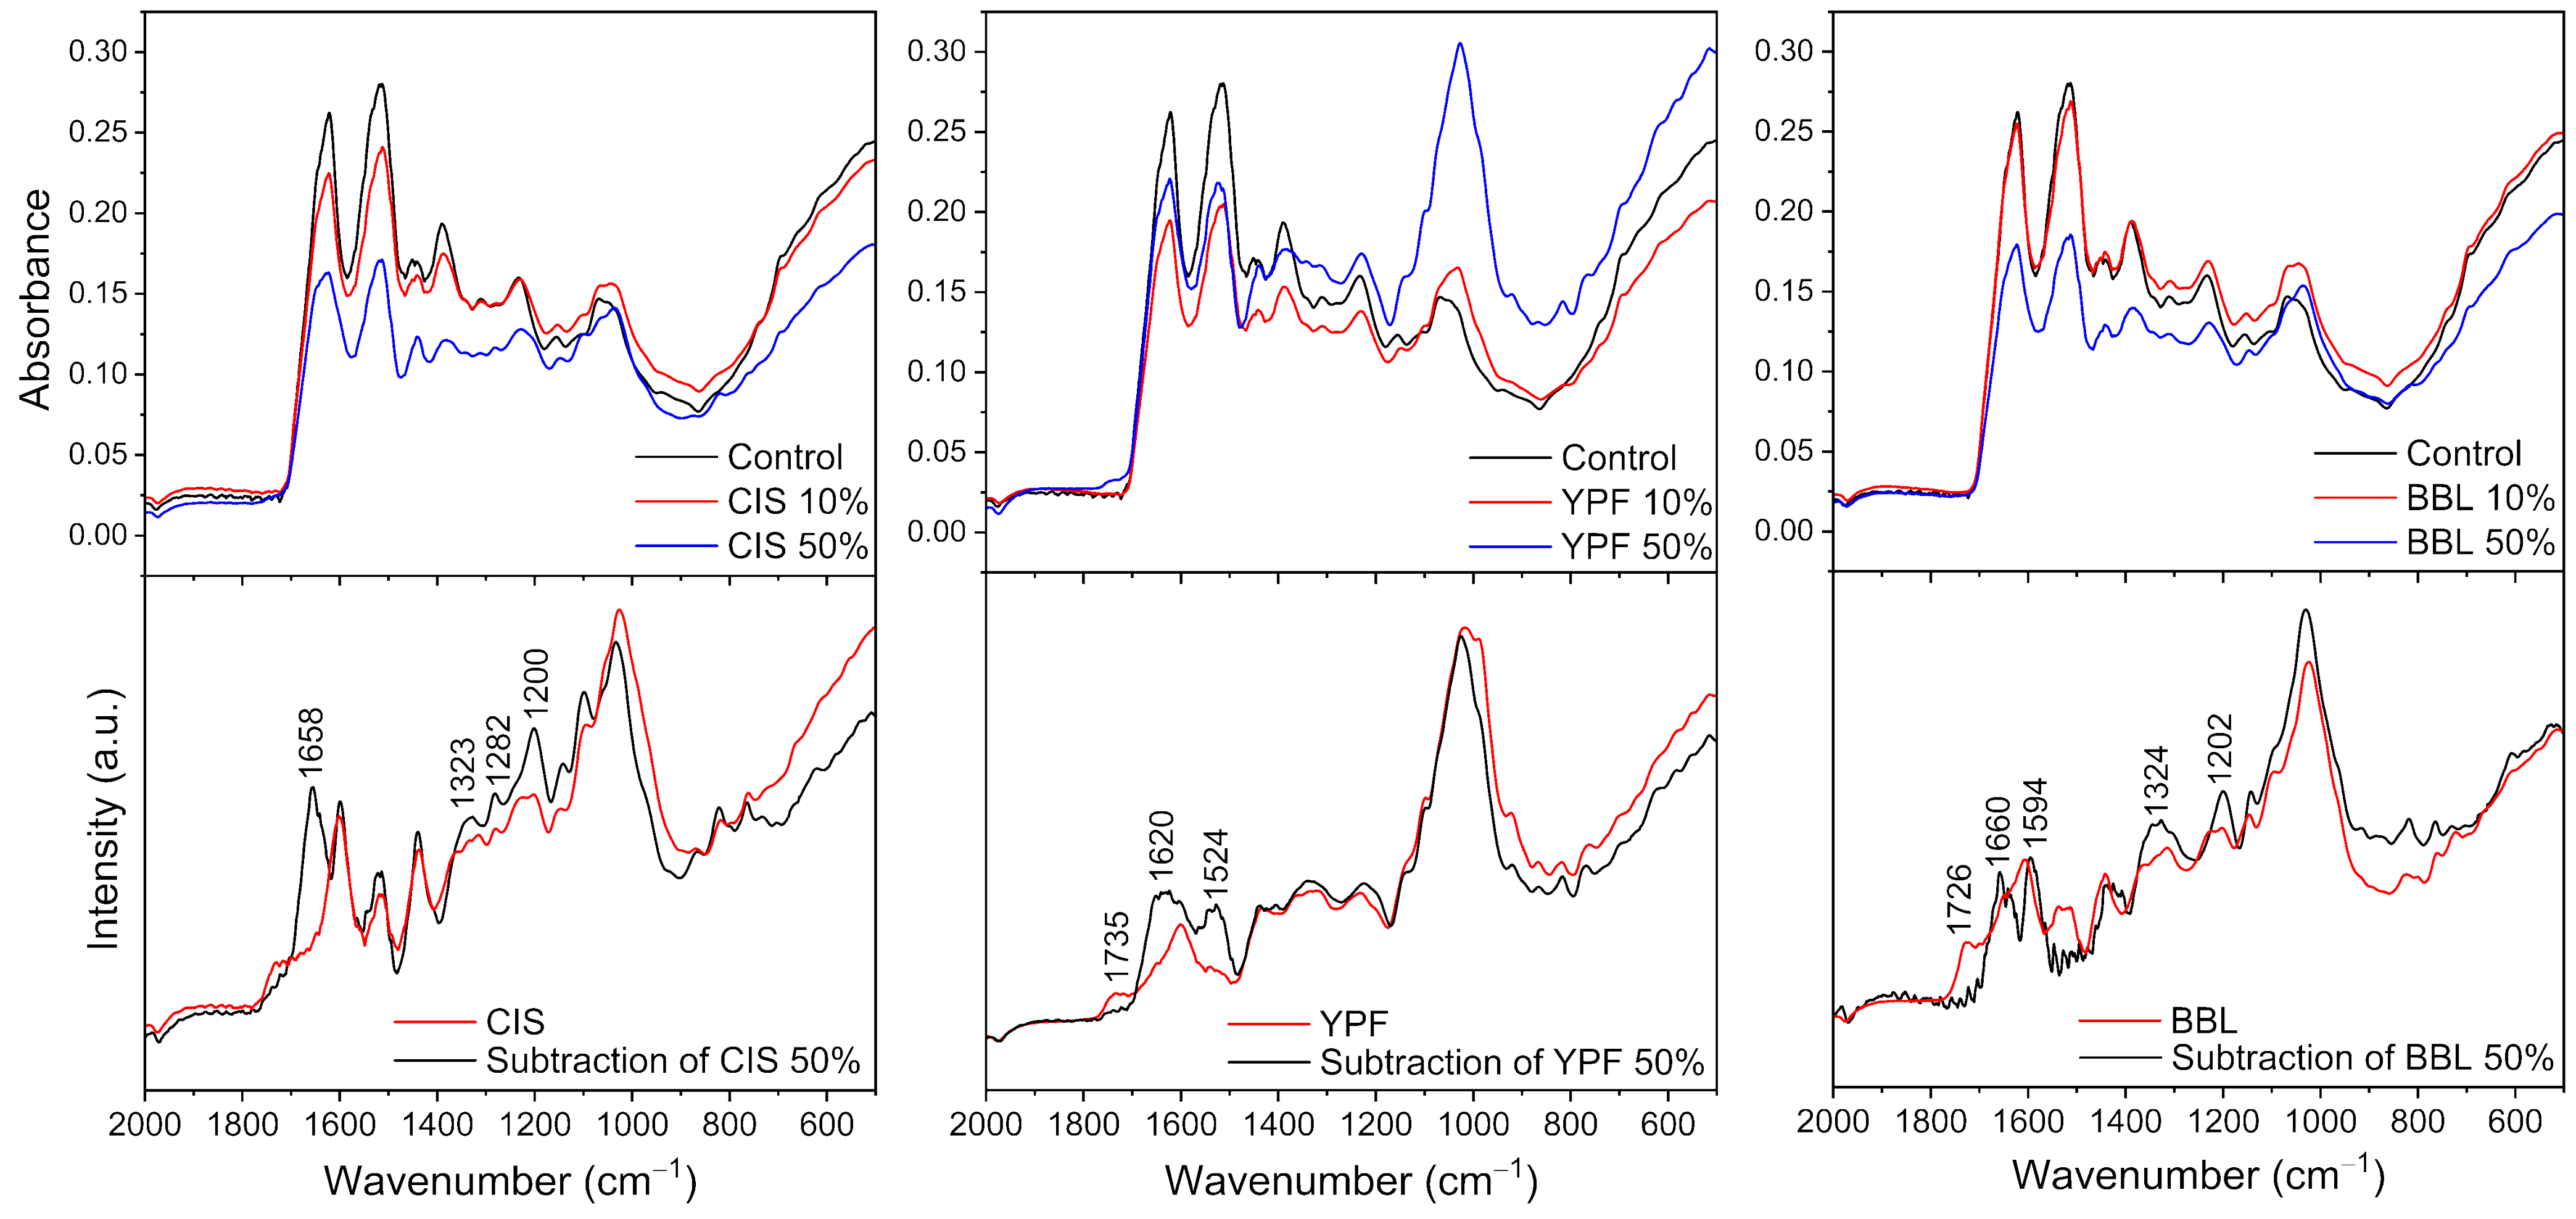
2.3. Fourier Transform Infrared Spectroscopy (FT-IR)
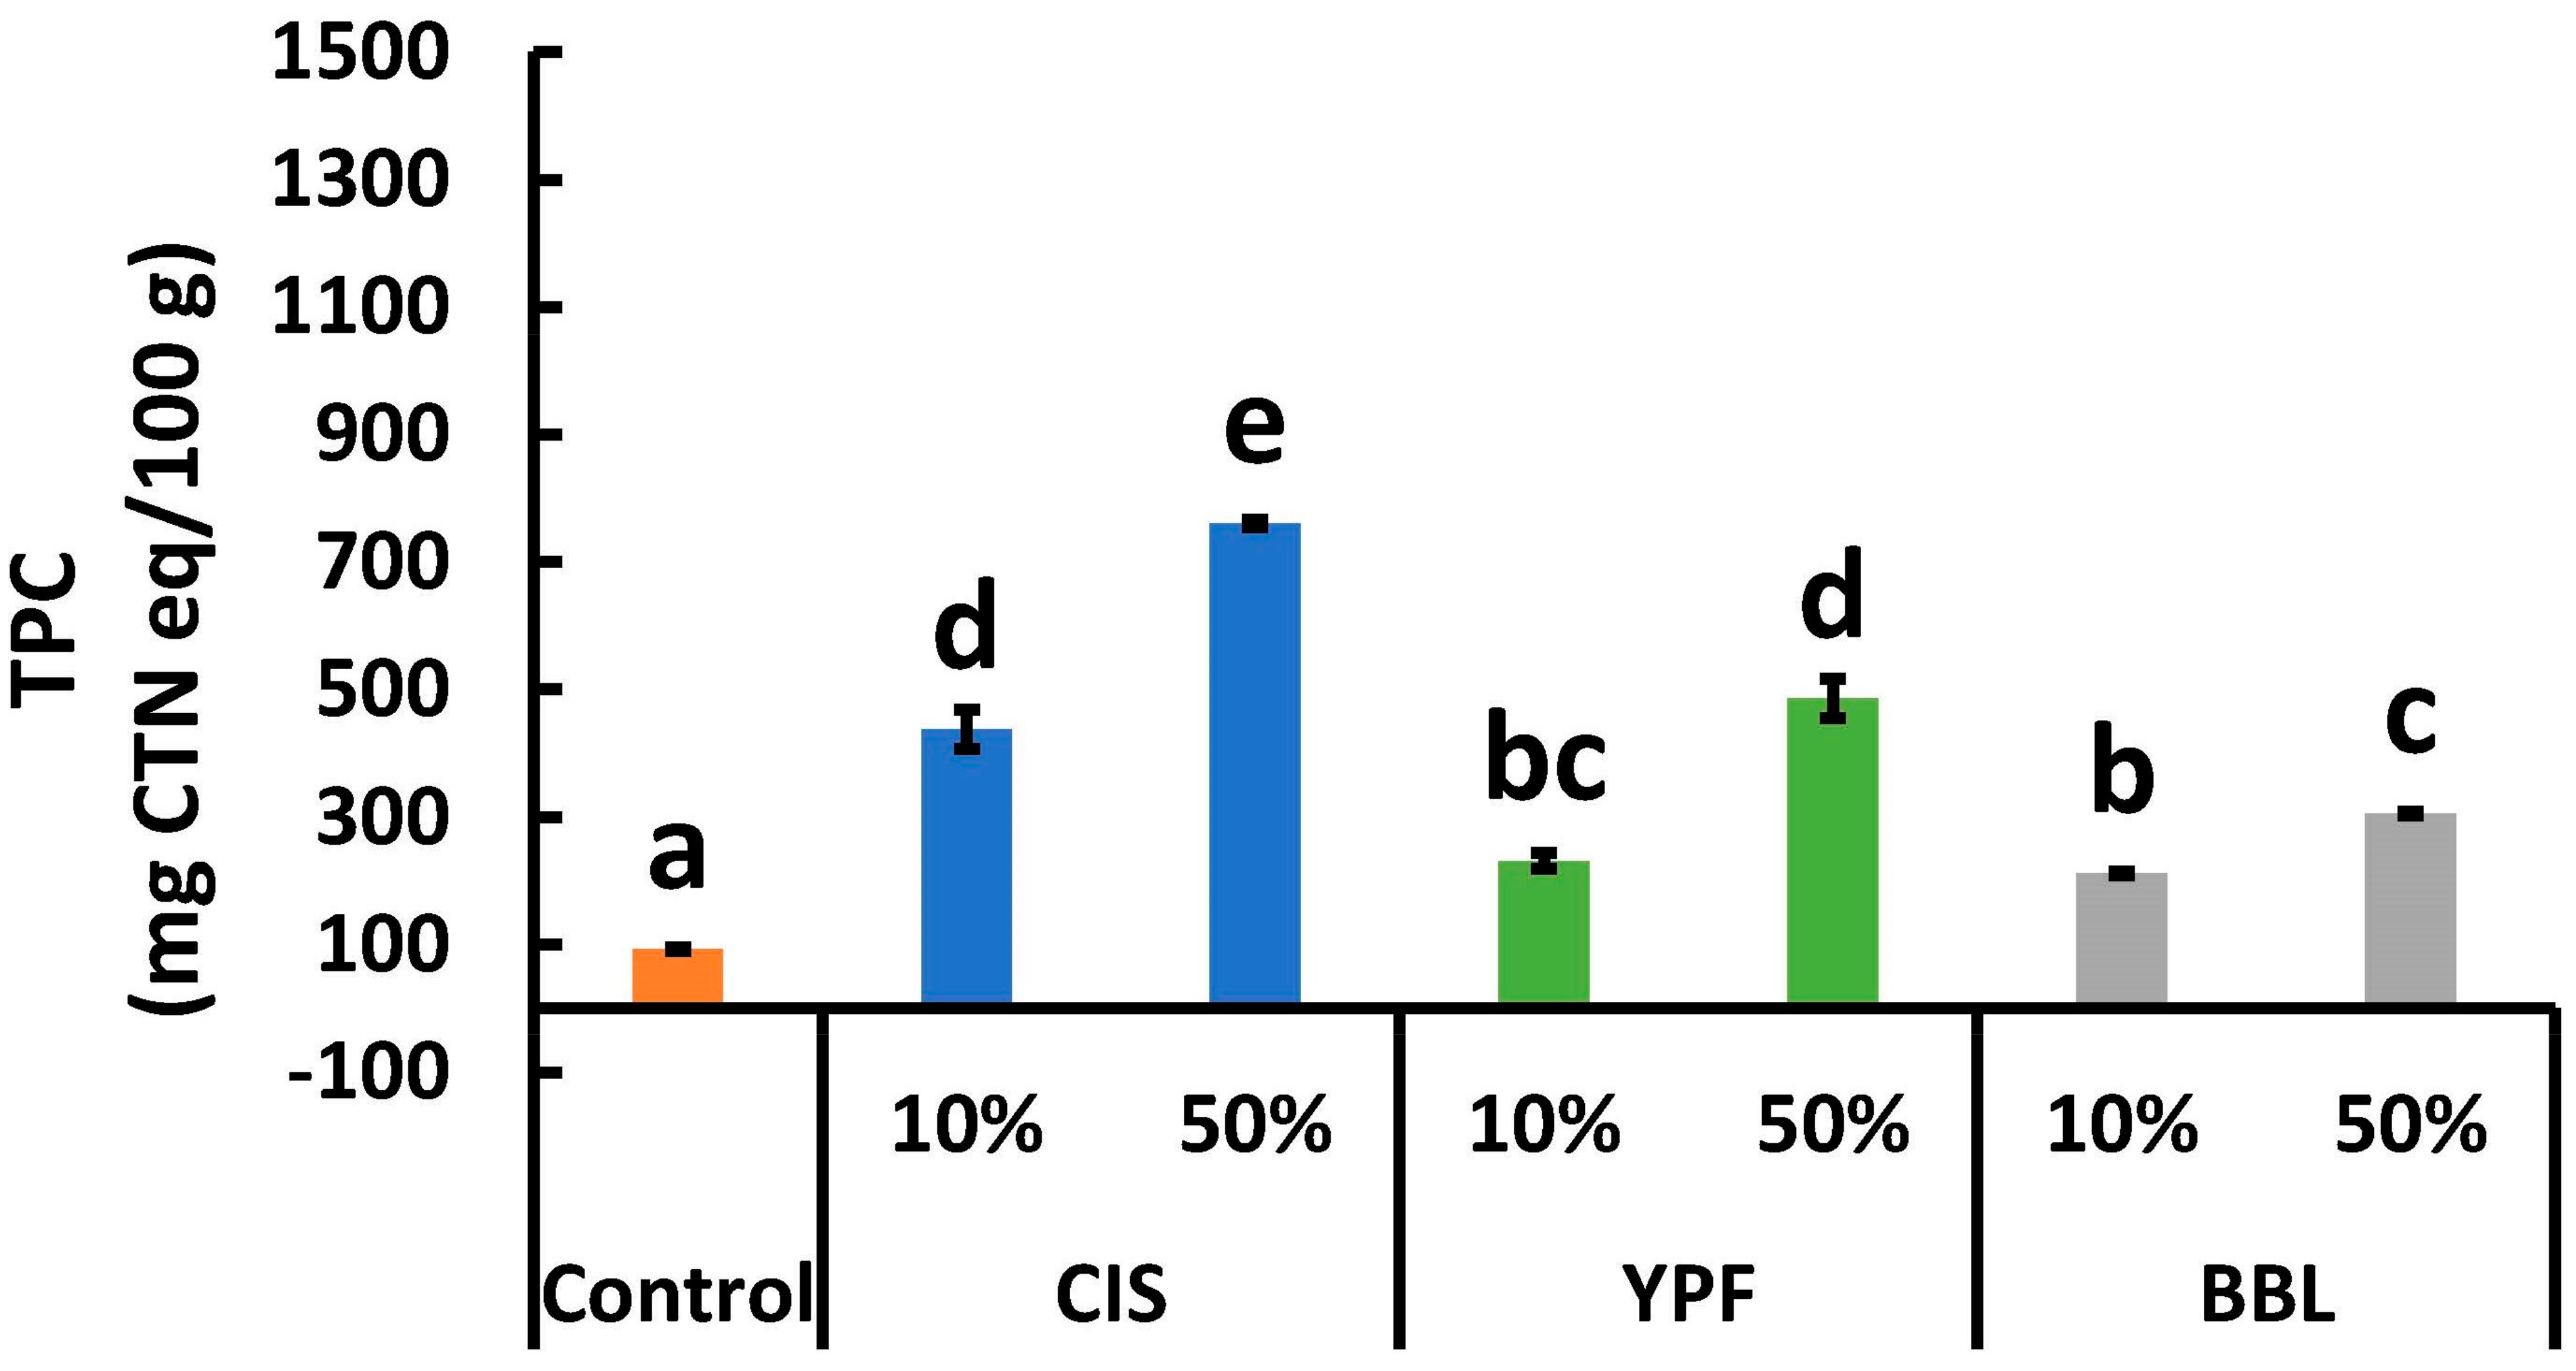
2.4. Total Polyphenol Content
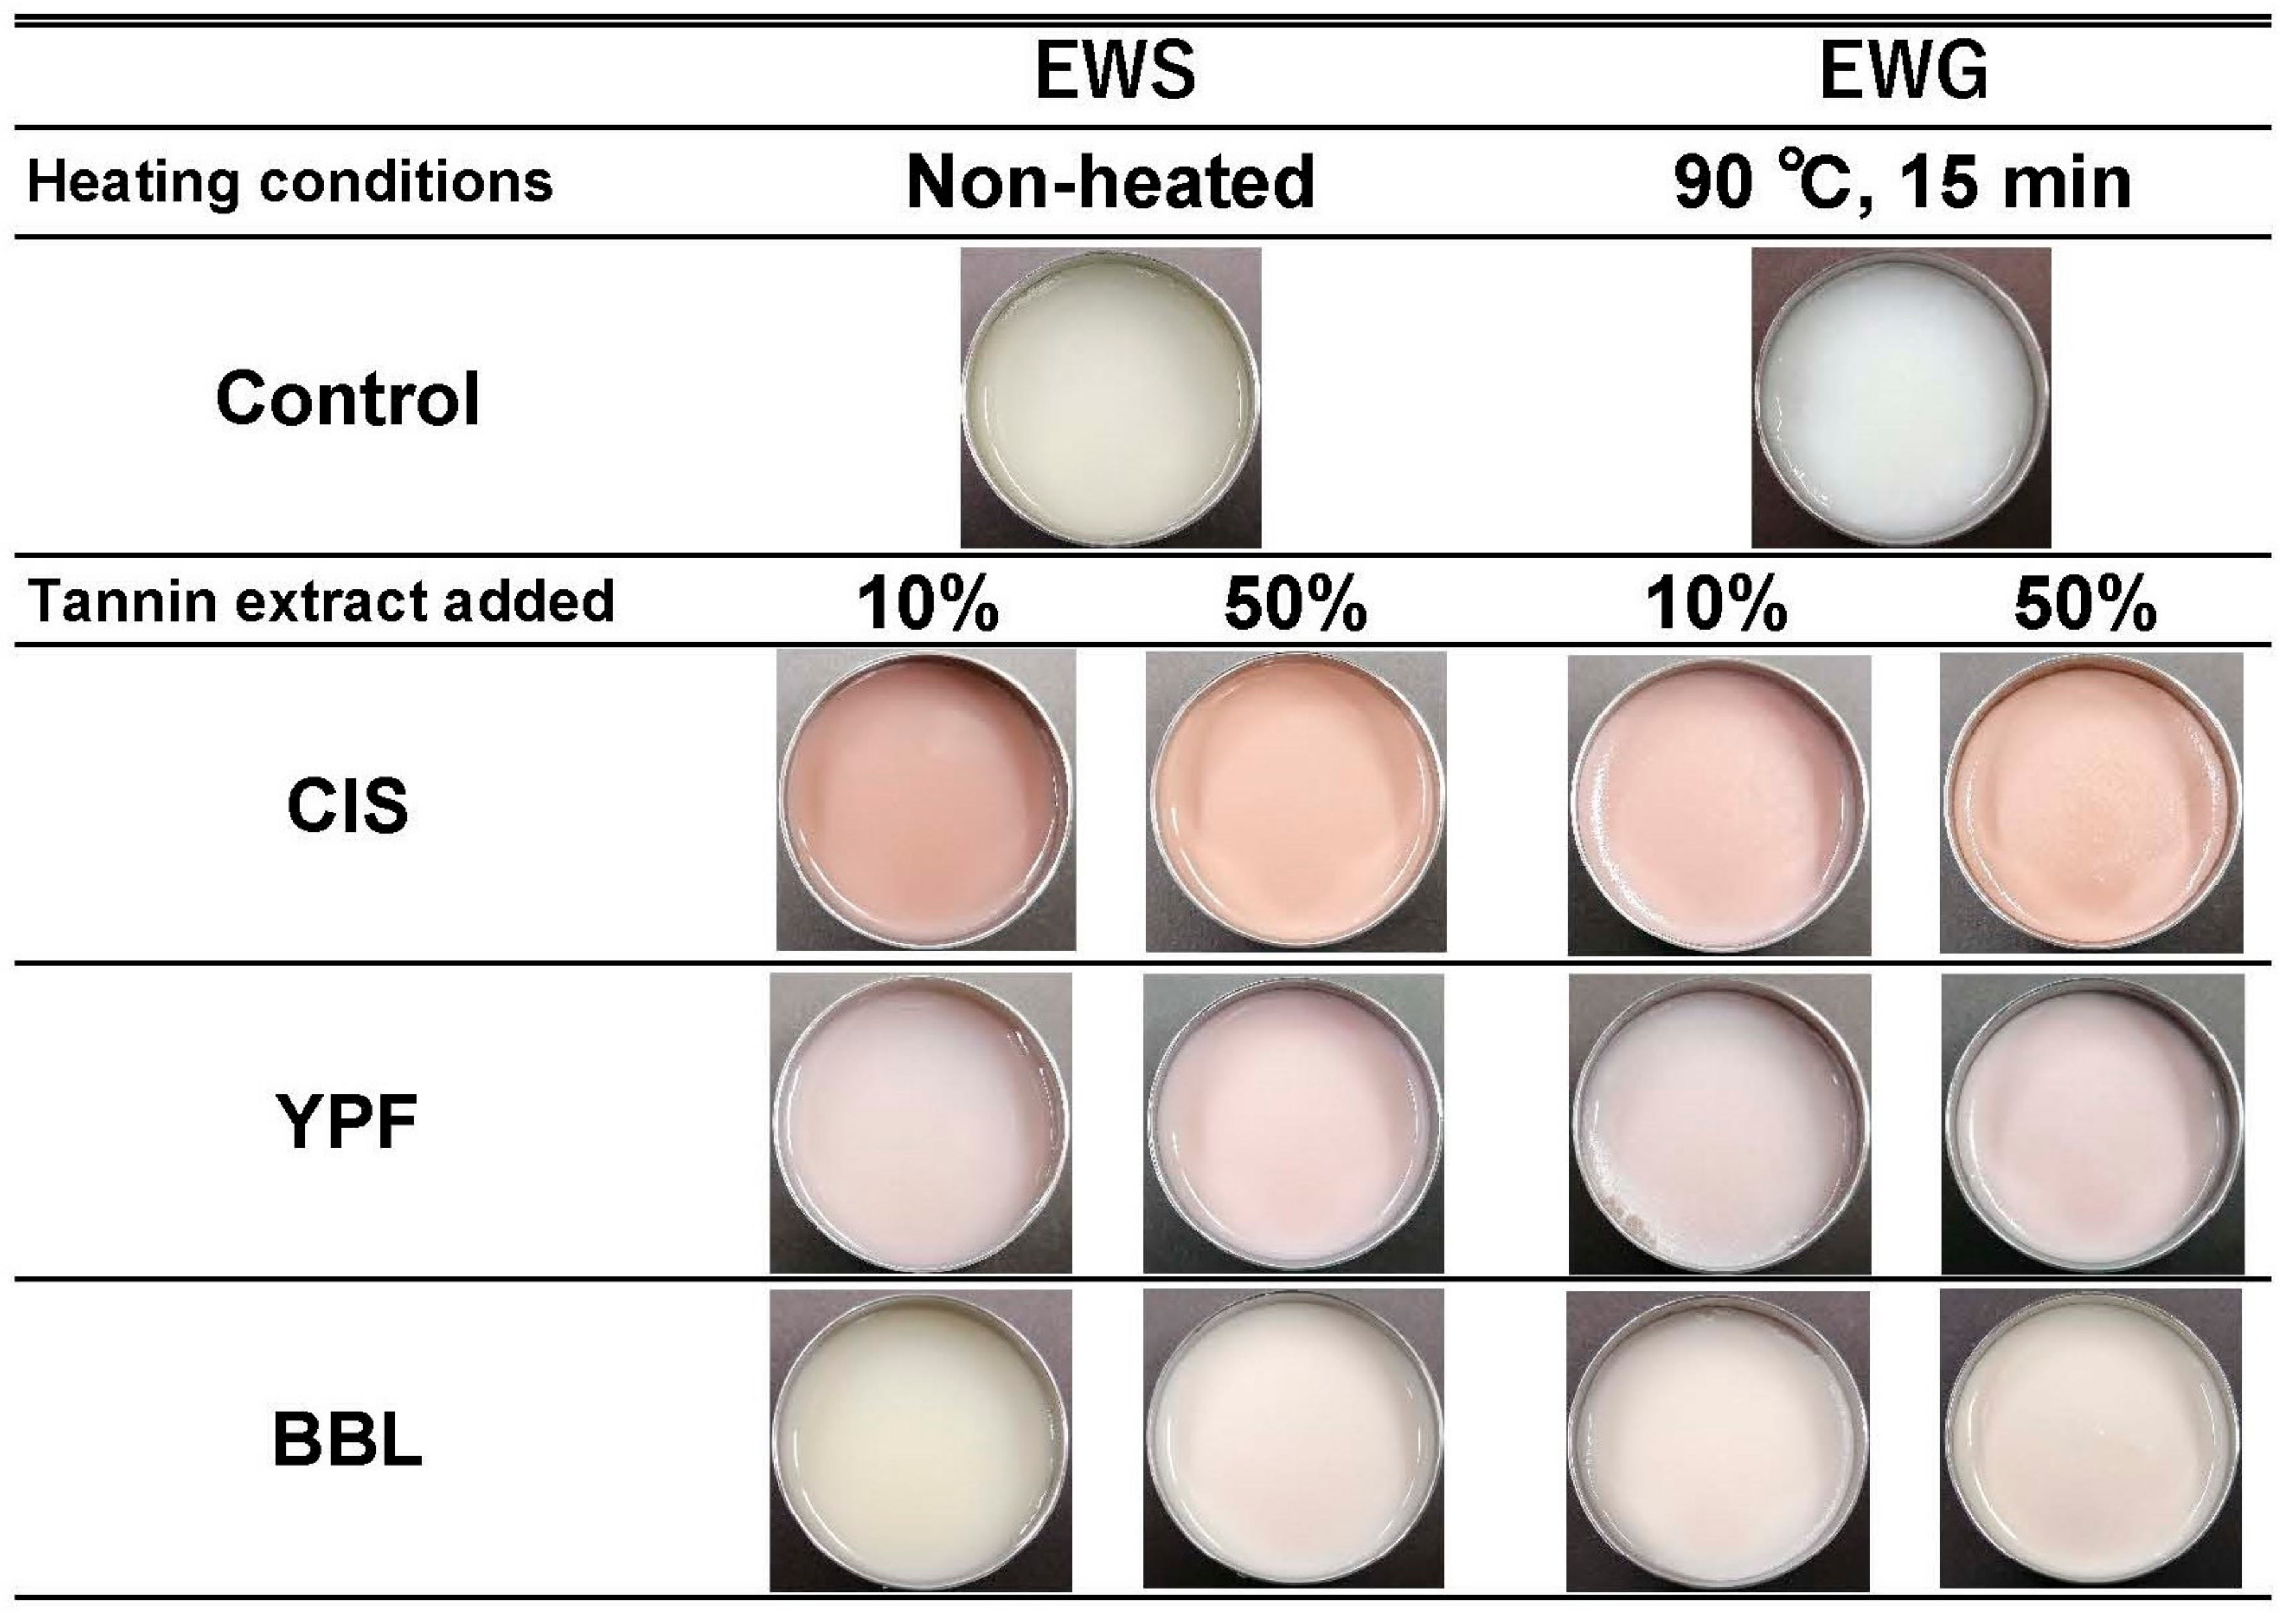
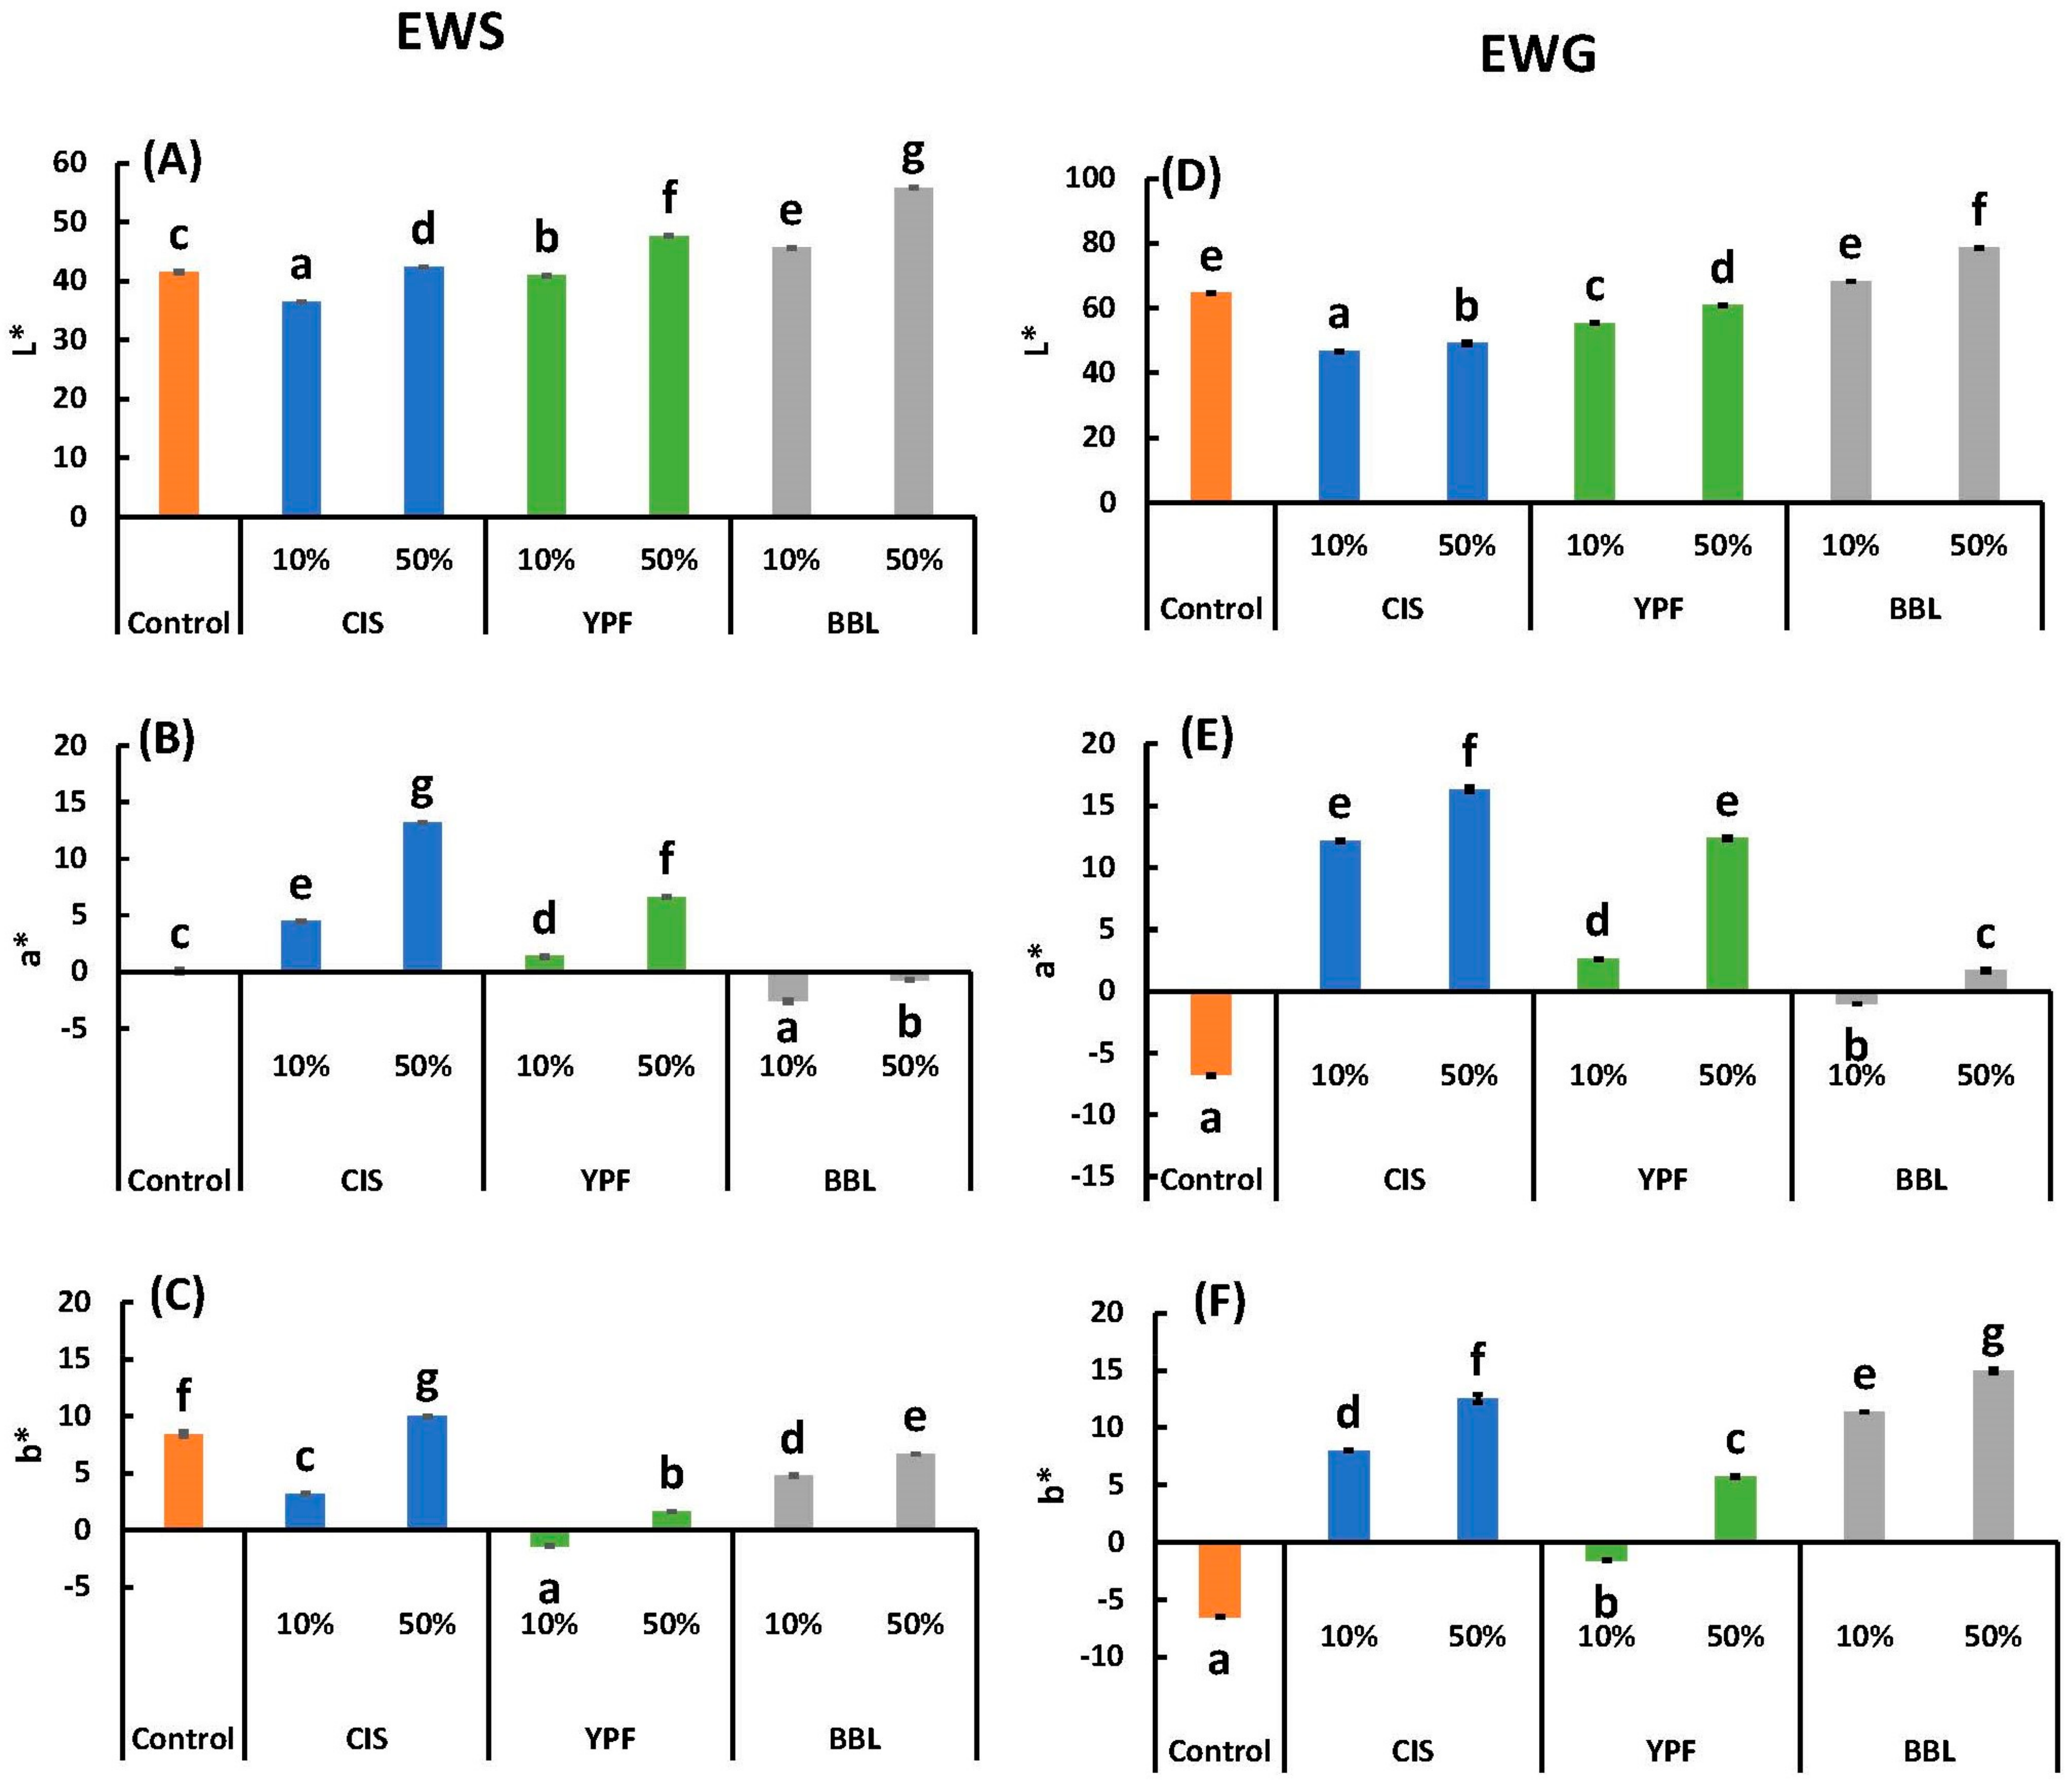
2.5. Appearance and Color
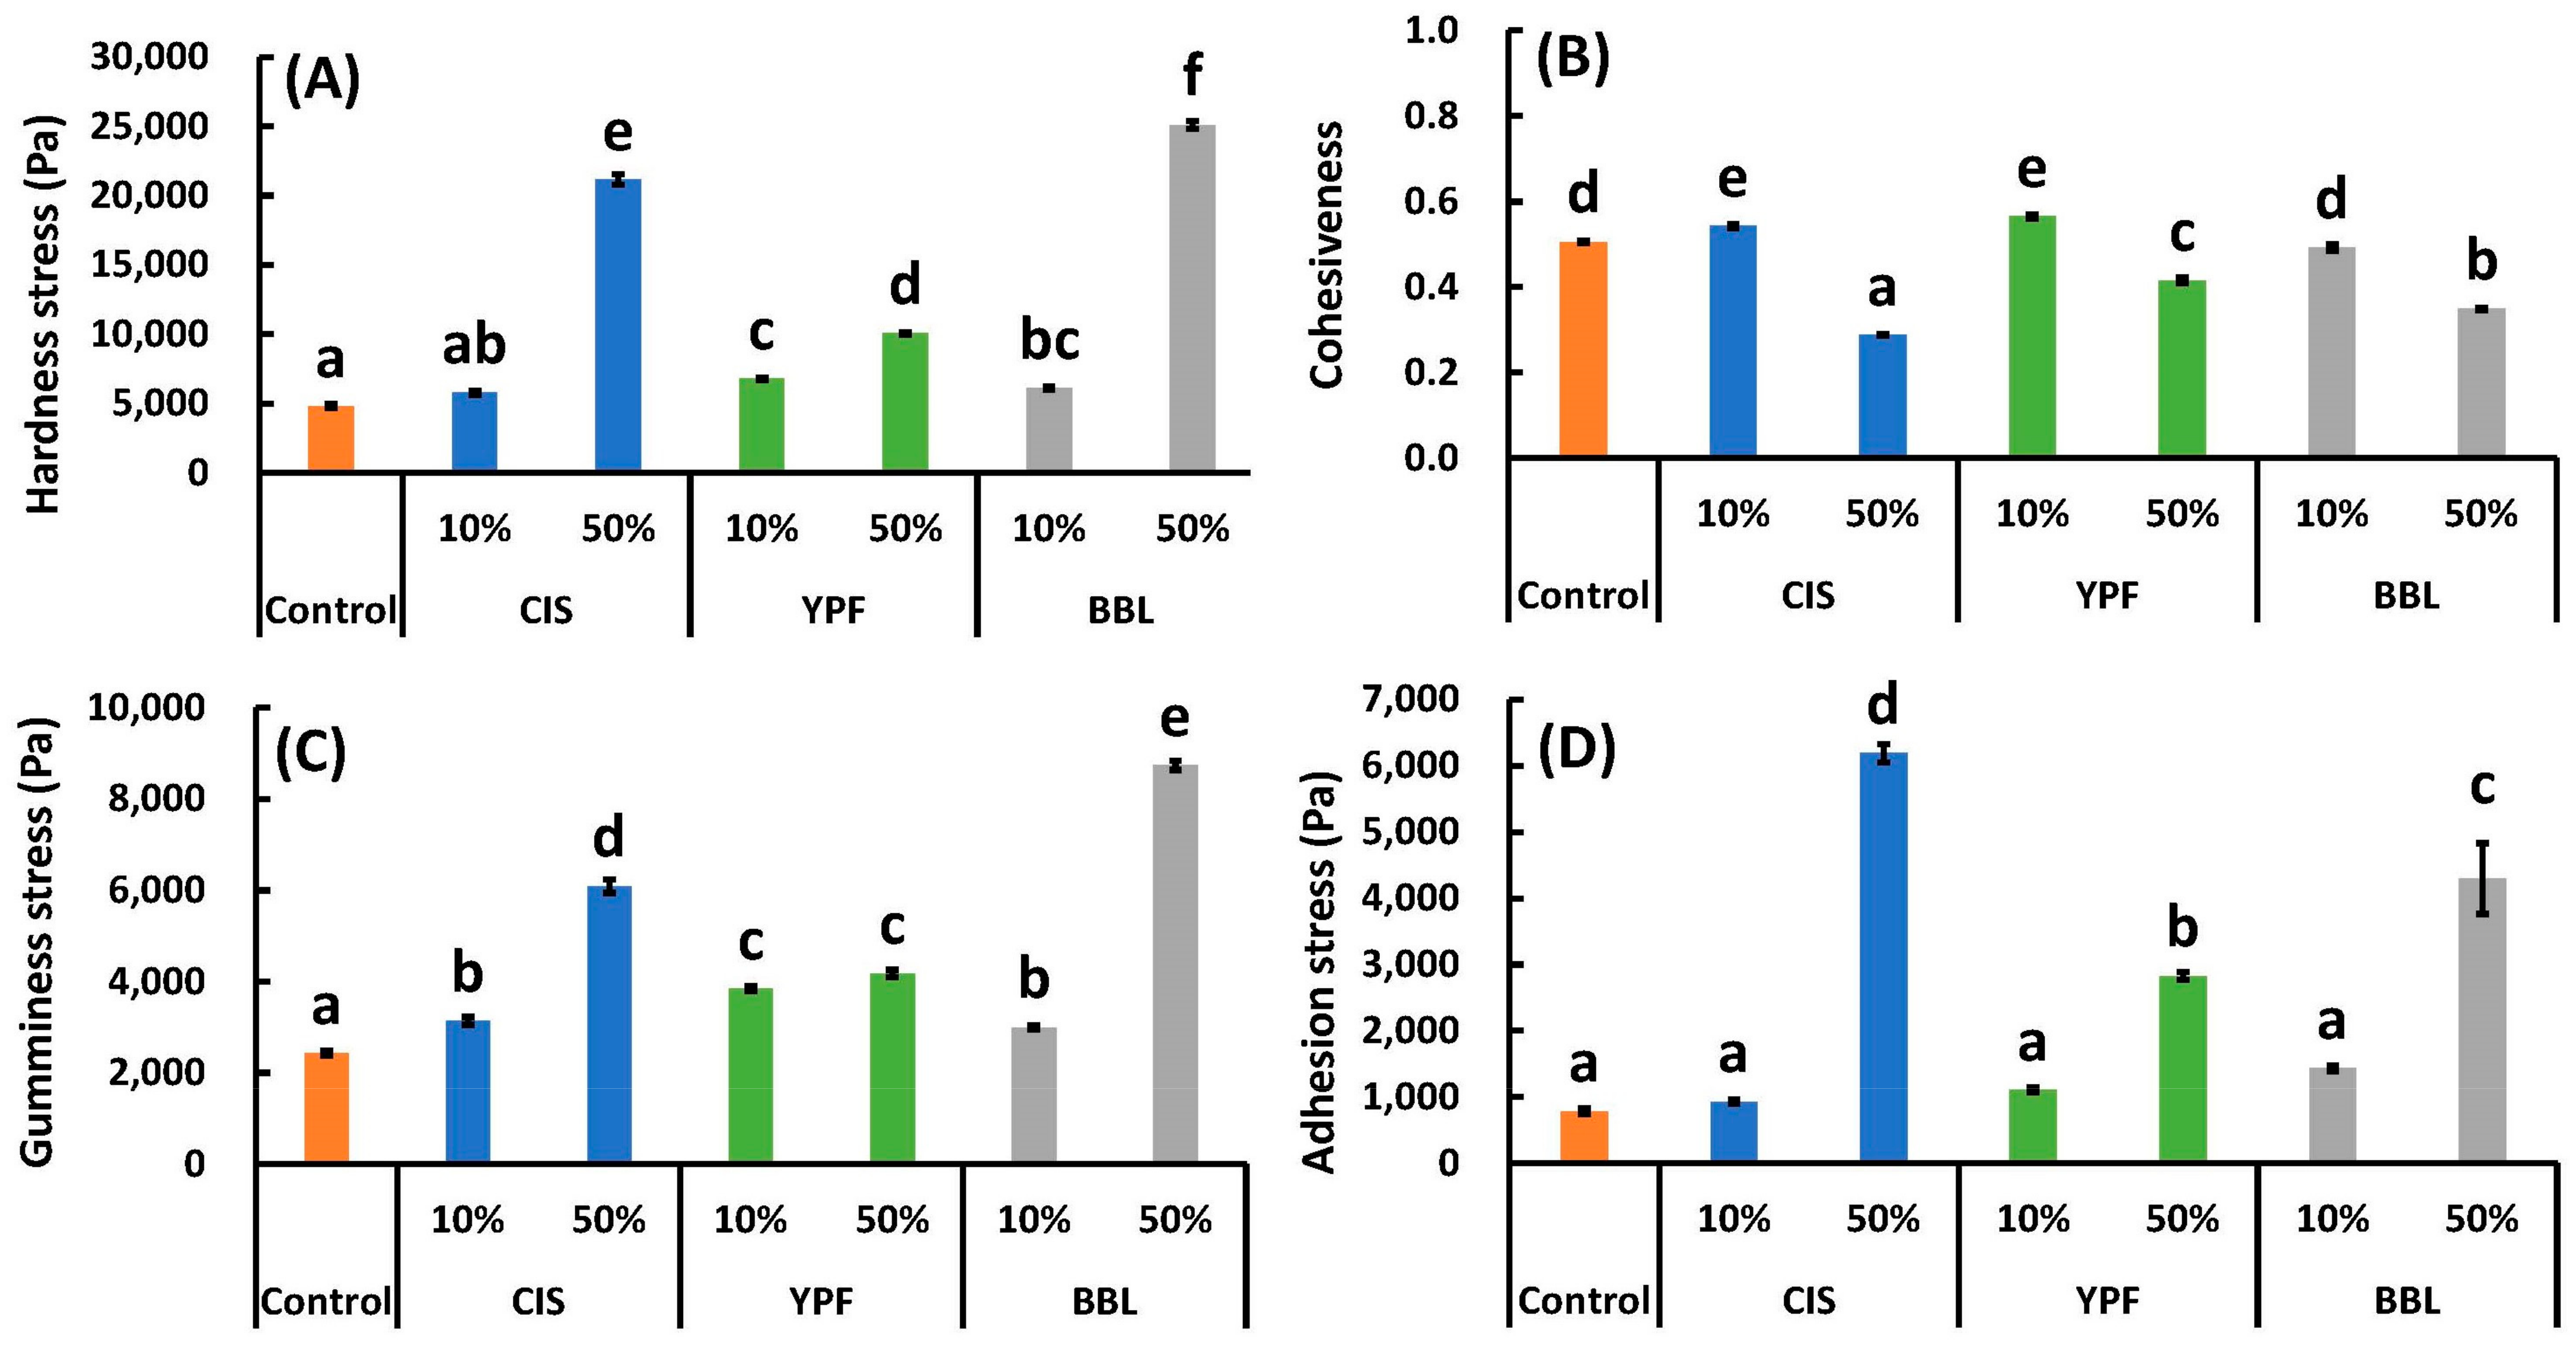
2.6. Textural Properties and Scanning Electron Microscopy (SEM)
3. Materials and Methods
3.1. Ingredients of EW and Tannin Extract, and Preparation
3.2. Preparation of Tannin Extract
3.3. EWG Production Method
3.4. Evaluation of Immunoreactivity of EW Proteins
3.4.1. SDS-PAGE Analysis
3.4.2. ELISA
3.5. TPC and STC
3.6. External Appearance and Color
3.7. SEM
3.8. pH
3.9. Textural Properties
3.10. FT-IR
3.11. Statistical Analysis
Author Contributions
Funding
Institutional Review Board Statement
Informed Consent Statement
Data Availability Statement
Acknowledgments
Conflicts of Interest
Abbreviations
| OVM | Ovomucoid |
| OVA | Ovalbumin |
| OVT | Ovotransferrin |
| LYZ | Lysozyme |
| EW | Egg white |
| BBL | Bayberry leaf |
| EWG | EW gel |
| EWS | EW solution |
| CIS | Chestnut inner skin |
| YPF | Young persimmon fruit |
| CTN | Catechin |
| SE | Standard error |
| ANOVA | One-way analysis of variance |
| ATR | Attenuated total reflectance device |
| SEM | Scanning electron microscopy |
| FT-IR | Fourier transform infrared spectroscopy |
| TPC | Total polyphenol content |
| STC | Soluble tannin measurement |
| IR | Infrared spectroscopy |
| ELISA | Enzyme-Linked Immunosorbent Assay |
| PVPP | Polyvinyl polypyrrolidone |
References
- Ebisawa, M.; Ito, K.; Fujisawa, T.; The Japanese Society of Pediatric Allergy and Clinical Immunology; The Japanese Society of Allergology. Japanese guidelines for food allergy 2017. Allergol. Int. 2017, 66, 248–264. [Google Scholar] [CrossRef] [PubMed]
- Mine, Y.; Yang, M. Recent advances in the understanding of egg allergens: Basic, industrial, and clinical perspectives. J. Agric. Food Chem. 2008, 56, 4874–4900. [Google Scholar] [CrossRef]
- Golias, J.; Schwarzer, M.; Wallner, M.; Kverka, M.; Kozakova, H.; Srutkova, D.; Klimesova, K.; Sotkovsky, P.; Palova-Jelinkova, L.; Ferreira, F. Heat-induced structural changes affect OVA-antigen processing and reduce allergic response in mouse model of food allergy. PLoS ONE 2012, 7, e37156. [Google Scholar] [CrossRef]
- Gu, J.; Matsuda, T.; Nakamura, R. Antigenicity of ovomucoid remaining in boiled shell eggs. J. Food Sci. 1986, 51, 1448–1450. [Google Scholar] [CrossRef]
- Urisu, A.; Ando, H.; Morita, Y.; Wada, E.; Yasaki, T.; Yamada, K.; Komadac, K.; Torii, S.; Gotoe, M.; Wakamatsu, T. Allergenic activity of heated and ovomucoid-depleted egg white. J. Allergy Clin. Immunol. 1997, 100, 171–176. [Google Scholar] [CrossRef] [PubMed]
- Yang, W.; Tu, Z.; Wang, H.; Zhang, L.; Gao, Y.; Li, X.; Tian, M. Immunogenic and structural properties of ovalbumin treated by pulsed electric fields. Int. J. Food Prop. 2017, 20, S3164–S3176. [Google Scholar] [CrossRef]
- Kido, J.; Matsumoto, T. Attenuated allergenic activity of ovomucoid after electrolysis. Allergy Asthma Immunol. Res. 2015, 7, 599–604. [Google Scholar] [CrossRef] [PubMed]
- Burks, A.W.; Tang, M.; Sicherer, S.; Muraro, A.; Eigenmann, P.A.; Ebisawa, M.; Fiocchi, A.; Chiang, W.; Beyer, K.; Wood, R. ICON: Food allergy. J. Allergy Clin. Immunol. 2012, 129, 906–920. [Google Scholar] [CrossRef]
- Tsurunaga, Y.; Takahashi, T. Evaluation of the antioxidant activity, deodorizing effect, and antibacterial activity of ‘Porotan’ chestnut by-products and establishment of a compound paper. Foods 2021, 10, 1141. [Google Scholar] [CrossRef]
- Tsurunaga, Y.; Takahashi, T.; Kanou, M.; Onda, M.; Ishigaki, M. Removal of astringency from persimmon paste via polysaccharide treatment. Heliyon 2022, 8, e10716. [Google Scholar] [CrossRef]
- Shimosaki, S.; Tsurunaga, Y.; Itamura, H.; Nakamura, M. Anti-allergic effect of the flavonoid myricitrin from Myrica rubra leaf extracts in vitro and in vivo. Nat. Prod. Res. 2011, 25, 374–380. [Google Scholar] [CrossRef] [PubMed]
- Obreque-Slier, E.; López-Solís, R.; Peña-Neira, Á.; Zamora-Marín, F. Tannin–protein interaction is more closely associated with astringency than tannin–protein precipitation: Experience with two oenological tannins and a gelatin. Int. J. Food Sci. Technol. 2010, 45, 2629–2636. [Google Scholar] [CrossRef]
- Gu, H.-F.; Li, C.-M.; Xu, Y.-J.; Hu, W.-F.; Chen, M.-H.; Wan, Q.-H. Structural features and antioxidant activity of tannin from persimmon pulp. Food Res. Int. 2008, 41, 208–217. [Google Scholar] [CrossRef]
- Yamauchi, K.; Soyano, M.; Kobayashi, M.; Kamatari, Y.O.; Mitsunaga, T. Protein aggregation model to explain the bioactivity of condensed tannins. Food Chem. 2023, 416, 135870. [Google Scholar] [CrossRef] [PubMed]
- Hu, M.; Yang, X.; Chang, X. Bioactive phenolic components and potential health effects of chestnut shell: A review. J. Food Biochem. 2021, 45, e13696. [Google Scholar] [CrossRef] [PubMed]
- Murali, P.; Shams, R.; Dar, A.H. Insights on nutritional profile, nutraceutical components, pharmacological potential, and trending utilization of persimmon cultivars: A review. Food Chem. Adv. 2023, 3, 100431. [Google Scholar] [CrossRef]
- Yang, H.; Ye, X.; Liu, D.; Chen, J.; Zhang, J.; Shen, Y.; Yu, D. Characterization of unusual proanthocyanidins in leaves of bayberry (Myrica rubra Sieb. et Zucc.). J. Agric. Food Chem. 2011, 59, 1622–1629. [Google Scholar] [CrossRef] [PubMed]
- Tsurunaga, Y.; Arima, S.; Kumagai, S.; Morita, E. Low Allergenicity in Processed Wheat Flour Products Using Tannins from Agri-Food Wastes. Foods 2023, 12, 2722. [Google Scholar] [CrossRef] [PubMed]
- Senter, S.; Chapman, G.; Forbus, W., Jr.; Payne, J. Sugar and nonvolatile acid composition of persimmons during maturation. J. Food Sci. 1991, 56, 989–991. [Google Scholar] [CrossRef]
- Koyama, S.; Kodama, D.; Tsujii, Y.; Handa, A. Soluble-protein-aggregate-assisted improvements in heat-induced gel properties: Effect of genipin-mediated crosslinks on egg white protein. LWT 2023, 184, 115079. [Google Scholar] [CrossRef]
- Koyama, S.; Oka, D.; Tsujii, Y.; Takano, K.; Handa, A. Effects of lanthionine and lysinoalanine on heat-induced gelation of egg white. Food Sci. Technol. Res. 2020, 26, 789–795. [Google Scholar] [CrossRef]
- Le Bourvellec, C.; Renard, C.M. Interactions between polyphenols and macromolecules: Quantification methods and mechanisms. Crit. Rev. Food Sci. Nutr. 2012, 52, 213–248. [Google Scholar] [CrossRef] [PubMed]
- Pizzi, A. Covalent and Ionic Bonding between Tannin and Collagen in Leather making and shrinking: A MALDI-ToF study. J. Renew. Mater. 2021, 9, 1345–1364. [Google Scholar] [CrossRef]
- Ma, X.; Liang, R.; Xing, Q.; Lozano-Ojalvo, D. Can food processing produce hypoallergenic egg? J. Food Sci. 2020, 85, 2635–2644. [Google Scholar] [CrossRef] [PubMed]
- Anyushin, A.V.; Sap, A.; Quanten, T.; Proost, P.; Parac-Vogt, T.N. Selective hydrolysis of ovalbumin promoted by Hf (IV)-substituted Wells-Dawson-type polyoxometalate. Front. Chem. 2018, 6, 614. [Google Scholar] [CrossRef]
- Davis, P.; Williams, S. Protein modification by thermal processing. Allergy 1998, 53, 102–105. [Google Scholar] [CrossRef] [PubMed]
- Nicolai, T.; Durand, D. Controlled food protein aggregation for new functionality. Curr. Opin. Colloid Interface Sci. 2013, 18, 249–256. [Google Scholar] [CrossRef]
- Berin, M.C.; Sampson, H.A. Food allergy: An enigmatic epidemic. Trends Immunol. 2013, 34, 390–397. [Google Scholar] [CrossRef] [PubMed]
- Kosti, R.; Triga, M.; Tsabouri, S.; Priftis, K. Food allergen selective thermal processing regimens may change oral tolerance in infancy. Allergol. Immunopathol. 2013, 41, 407–417. [Google Scholar] [CrossRef]
- Jiménez-Saiz, R.; Belloque, J.; Molina, E.; López-Fandino, R. Human immunoglobulin E (IgE) binding to heated and glycated ovalbumin and ovomucoid before and after in vitro digestion. J. Agric. Food Chem. 2011, 59, 10044–10051. [Google Scholar] [CrossRef]
- Claude, M.; Lupi, R.; Bouchaud, G.; Bodinier, M.; Brossard, C.; Denery-Papini, S. The thermal aggregation of ovalbumin as large particles decreases its allergenicity for egg allergic patients and in a murine model. Food Chem. 2016, 203, 136–144. [Google Scholar] [CrossRef] [PubMed]
- Okon, K.; Yoshida, T.; Hattori, M.; Matsuda, H.; Osada, M. Preparation of hypoallergenic ovalbumin by high-temperature water treatment. Biosci. Biotechnol. Biochem. 2021, 85, 2442–2449. [Google Scholar] [CrossRef] [PubMed]
- Seo, J.-H.; Lee, J.-W.; Lee, Y.-S.; Lee, S.-Y.; Kim, M.-R.; Yook, H.-S.; Byun, M.-W. Change of an egg allergen in a white layer cake containing gamma-irradiated egg white. J. Food Prot. 2004, 67, 1725–1730. [Google Scholar] [CrossRef] [PubMed]
- Edelmann, A.; Lendl, B. Toward the optical tongue: Flow-through sensing of tannin– protein interactions based on FTIR spectroscopy. J. Am. Chem. Soc. 2002, 124, 14741–14747. [Google Scholar] [CrossRef] [PubMed]
- Jensen, J.S.; Egebo, M.; Meyer, A.S. Identification of spectral regions for the quantification of red wine tannins with Fourier transform mid-infrared spectroscopy. J. Agric. Food Chem. 2008, 56, 3493–3499. [Google Scholar] [CrossRef] [PubMed]
- Kuzniarz, A. Infrared spectrum analysis of some flavonoids. Acta Pol. Pharm. Drug Res. 2014, 58, 415–420. [Google Scholar]
- Machida, K.; Lee, H.; Uno, T. Resonance Raman spectra of sulfophthalein dyes in aqueous solutions. J. Raman Spectrosc. 1979, 8, 172–176. [Google Scholar] [CrossRef]
- Matsumoto, K.; Kadowaki, A.; Ozaki, N.; Takenaka, M.; Ono, H.; Yokoyama, S.I.; Gato, N. Bile acid-binding ability of kaki-tannin from young fruits of persimmon (Diospyros kaki) in vitro and in vivo. Phytother. Res. 2011, 25, 624–628. [Google Scholar] [CrossRef]
- Zhou, X.; Chen, S.; Ye, X. The anti-obesity properties of the proanthocyanidin extract from the leaves of Chinese bayberry (Myrica rubra Sieb. et Zucc.). Food Funct. 2017, 8, 3259–3270. [Google Scholar] [CrossRef]
- Tsurunaga, Y. Formation of a protein-tannin complex to remove astringency during processing of Western-style persimmon jelly. In Proceedings of the VI International Symposium on Persimmon 1195, Valencia, Spain, 16 October 2016; pp. 177–182. [Google Scholar]
- Chen, Y.; Hu, J.; Yi, X.; Ding, B.; Sun, W.; Yan, F.; Wei, S.; Li, Z. Interactions and emulsifying properties of ovalbumin with tannic acid. LWT 2018, 95, 282–288. [Google Scholar] [CrossRef]
- Shen, F.; Niu, F.; Li, J.; Su, Y.; Liu, Y.; Yang, Y. Interactions between tea polyphenol and two kinds of typical egg white proteins—Ovalbumin and lysozyme: Effect on the gastrointestinal digestion of both proteins in vitro. Food Res. Int. 2014, 59, 100–107. [Google Scholar] [CrossRef]
- Zhou, X.; Chen, T.; Lin, H.; Chen, H.; Liu, J.; Lyu, F.; Ding, Y. Physicochemical properties and microstructure of surimi treated with egg white modified by tea polyphenols. Food Hydrocoll. 2019, 90, 82–89. [Google Scholar] [CrossRef]
- Xue, H.; Zhang, G.; Han, T.; Li, R.; Liu, H.; Gao, B.; Tu, Y.; Zhao, Y. Improvement of gel properties and digestibility of the water-soluble polymer of tea polyphenol-egg white under thermal treatment. Food Chem. 2022, 372, 131319. [Google Scholar] [CrossRef] [PubMed]
- Laemmli, U.K. Cleavage of structural proteins during the assembly of the head of bacteriophage T4. Nature 1970, 227, 680–685. [Google Scholar] [CrossRef] [PubMed]
- Akiyama, H.; Adachi, R. Japanese food allergy-labeling system and comparison with the international experience; detection and thresholds. Food Saf. 2021, 9, 101–116. [Google Scholar] [CrossRef] [PubMed]
- Morinaga Institute of Biological Science, Inc. FASPEK (Ovalbumin) ELISA Kit II. 2017. Available online: https://www.miobs.com/product/tokutei/faspek2/dl/manual_tori04.pdf (accessed on 3 April 2024).
- Chung, H.S.; Kim, H.S.; Lee, Y.G.; Seong, J.H. Effect of deastringency treatment of intact persimmon fruits on the quality of fresh-cut persimmons. Food Chem. 2015, 166, 192–197. [Google Scholar] [CrossRef]
- Swain, T.; Hillis, W. The phenolic constituents of Prunus domestica. I.—The quantitative analysis of phenolic constituents. J. Sci. Food Agric. 1959, 10, 63–68. [Google Scholar] [CrossRef]
- Toth, G.B.; Pavia, H. Removal of dissolved brown algal phlorotannins using insoluble polyvinylpolypyrrolidone (PVPP). J. Chem. Ecol. 2001, 27, 1899–1910. [Google Scholar] [CrossRef]
- Besharati, M.; Taghizadeh, A. Effect of tannin-binding agents (polyethylene glycol and polyvinylpyrrolidone) supplementation on in vitro gas production kinetics of some grape yield byproducts. Int. Sch. Res. Not. 2011, 2011, 780540. [Google Scholar] [CrossRef]
- Deng, C.; Shao, Y.; Xu, M.; Yao, Y.; Wu, N.; Hu, H.; Zhao, Y.; Tu, Y. Effects of metal ions on the physico-chemical, microstructural and digestion characteristics of alkali-induced egg white gel. Food Hydrocoll. 2020, 107, 105956. [Google Scholar] [CrossRef]
- Wu, S.; Yang, R. Effect of high-pressure processing on polyphenol oxidase, melanosis and quality in ready-to-eat crabs during storage. LWT 2023, 178, 114607. [Google Scholar] [CrossRef]
- Higgins, F.; Rein, A. Quantitative Analysis of Copolymers Using the Cary 630 FTIR Spectrometer. Danbury Agil. Technol. 2011. Available online: https://gcms.labrulez.com/labrulez-bucket-strapi-h3hsga3/5990_8676_EN_App_Note_630_ATR_Copolymers_8af79525f5/5990-8676EN_AppNote_630_ATR_Copolymers.pdf (accessed on 3 April 2024).


| TPC | STC | Image | L* | a* | b* | pH | Brix | ||
|---|---|---|---|---|---|---|---|---|---|
| (mg CTN eq/100 mL) | |||||||||
| CIS solution | 1290.8 ± 19.2 c | 391.3 ± 13.3 b | 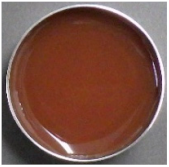 | 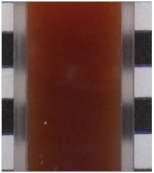 | 39.3 ± 0.0 b | 14.7 ± 0.0 d | 11.6 ± 0.1 c | 4.1 ± 0.0 a | 8.6 ± 0.0 c |
| YPF solution | 1868.5 ± 40.2 d | 331.5 ± 15.5 b |  |  | 49.5 ± 0.1 d | 12.2 ± 0.1 b | 8.9 ± 0.1 b | 4.8 ± 0.0 b | 10.1 ± 0.0 d |
| BBL solution | 964.8 ± 20.7 b | 322.5 ± 27.9 b | 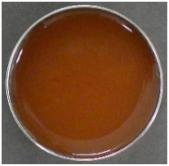 | 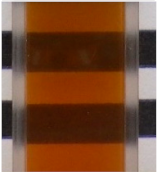 | 36.6 ± 0.1 a | 12.9 ± 0.2 c | 14.5 ± 0.2 d | 4.0 ± 0.0 a | 4.7 ± 0.0 a |
| EW solution | 411.5 ± 20.0 a | 0 a |  |  | 41.6 ± 0.1 c | 0.1 ± 0.1 a | 8.4 ± 0.1 a | 7.2 ± 0.0 c | 7.1 ± 0.0 b |
| Wavenumber (cm−1) | Functional Group |
|---|---|
| 1750–1700 | C=O str. |
| 1650–1480 | C=C str. of aromatic rings |
| 1400–1300 | C-OH def. |
| 1300–1160 | C-OH str. |
| 1285 | C-O str. of pyran ring |
| 1200–950 | C-H def. |
Disclaimer/Publisher’s Note: The statements, opinions and data contained in all publications are solely those of the individual author(s) and contributor(s) and not of MDPI and/or the editor(s). MDPI and/or the editor(s) disclaim responsibility for any injury to people or property resulting from any ideas, methods, instructions or products referred to in the content. |
© 2024 by the authors. Licensee MDPI, Basel, Switzerland. This article is an open access article distributed under the terms and conditions of the Creative Commons Attribution (CC BY) license (https://creativecommons.org/licenses/by/4.0/).
Share and Cite
Tsurunaga, Y.; Ishigaki, M.; Takahashi, T.; Arima, S.; Kumagai, S.; Tsujii, Y.; Koyama, S. Effect of Addition of Tannin Extract from Underutilized Resources on Allergenic Proteins, Color and Textural Properties of Egg White Gels. Int. J. Mol. Sci. 2024, 25, 4124. https://doi.org/10.3390/ijms25074124
Tsurunaga Y, Ishigaki M, Takahashi T, Arima S, Kumagai S, Tsujii Y, Koyama S. Effect of Addition of Tannin Extract from Underutilized Resources on Allergenic Proteins, Color and Textural Properties of Egg White Gels. International Journal of Molecular Sciences. 2024; 25(7):4124. https://doi.org/10.3390/ijms25074124
Chicago/Turabian StyleTsurunaga, Yoko, Mika Ishigaki, Tetsuya Takahashi, Shiori Arima, Sae Kumagai, Yoshimasa Tsujii, and Shota Koyama. 2024. "Effect of Addition of Tannin Extract from Underutilized Resources on Allergenic Proteins, Color and Textural Properties of Egg White Gels" International Journal of Molecular Sciences 25, no. 7: 4124. https://doi.org/10.3390/ijms25074124
APA StyleTsurunaga, Y., Ishigaki, M., Takahashi, T., Arima, S., Kumagai, S., Tsujii, Y., & Koyama, S. (2024). Effect of Addition of Tannin Extract from Underutilized Resources on Allergenic Proteins, Color and Textural Properties of Egg White Gels. International Journal of Molecular Sciences, 25(7), 4124. https://doi.org/10.3390/ijms25074124