
Urinary Biomarkers for Cell Cycle Arrest TIMP-2 and IGFBP7 for Prediction of Graft Function Recovery after Kidney Transplantation
 , , ,
, , , 
Abstract
1. Introduction
2. Results
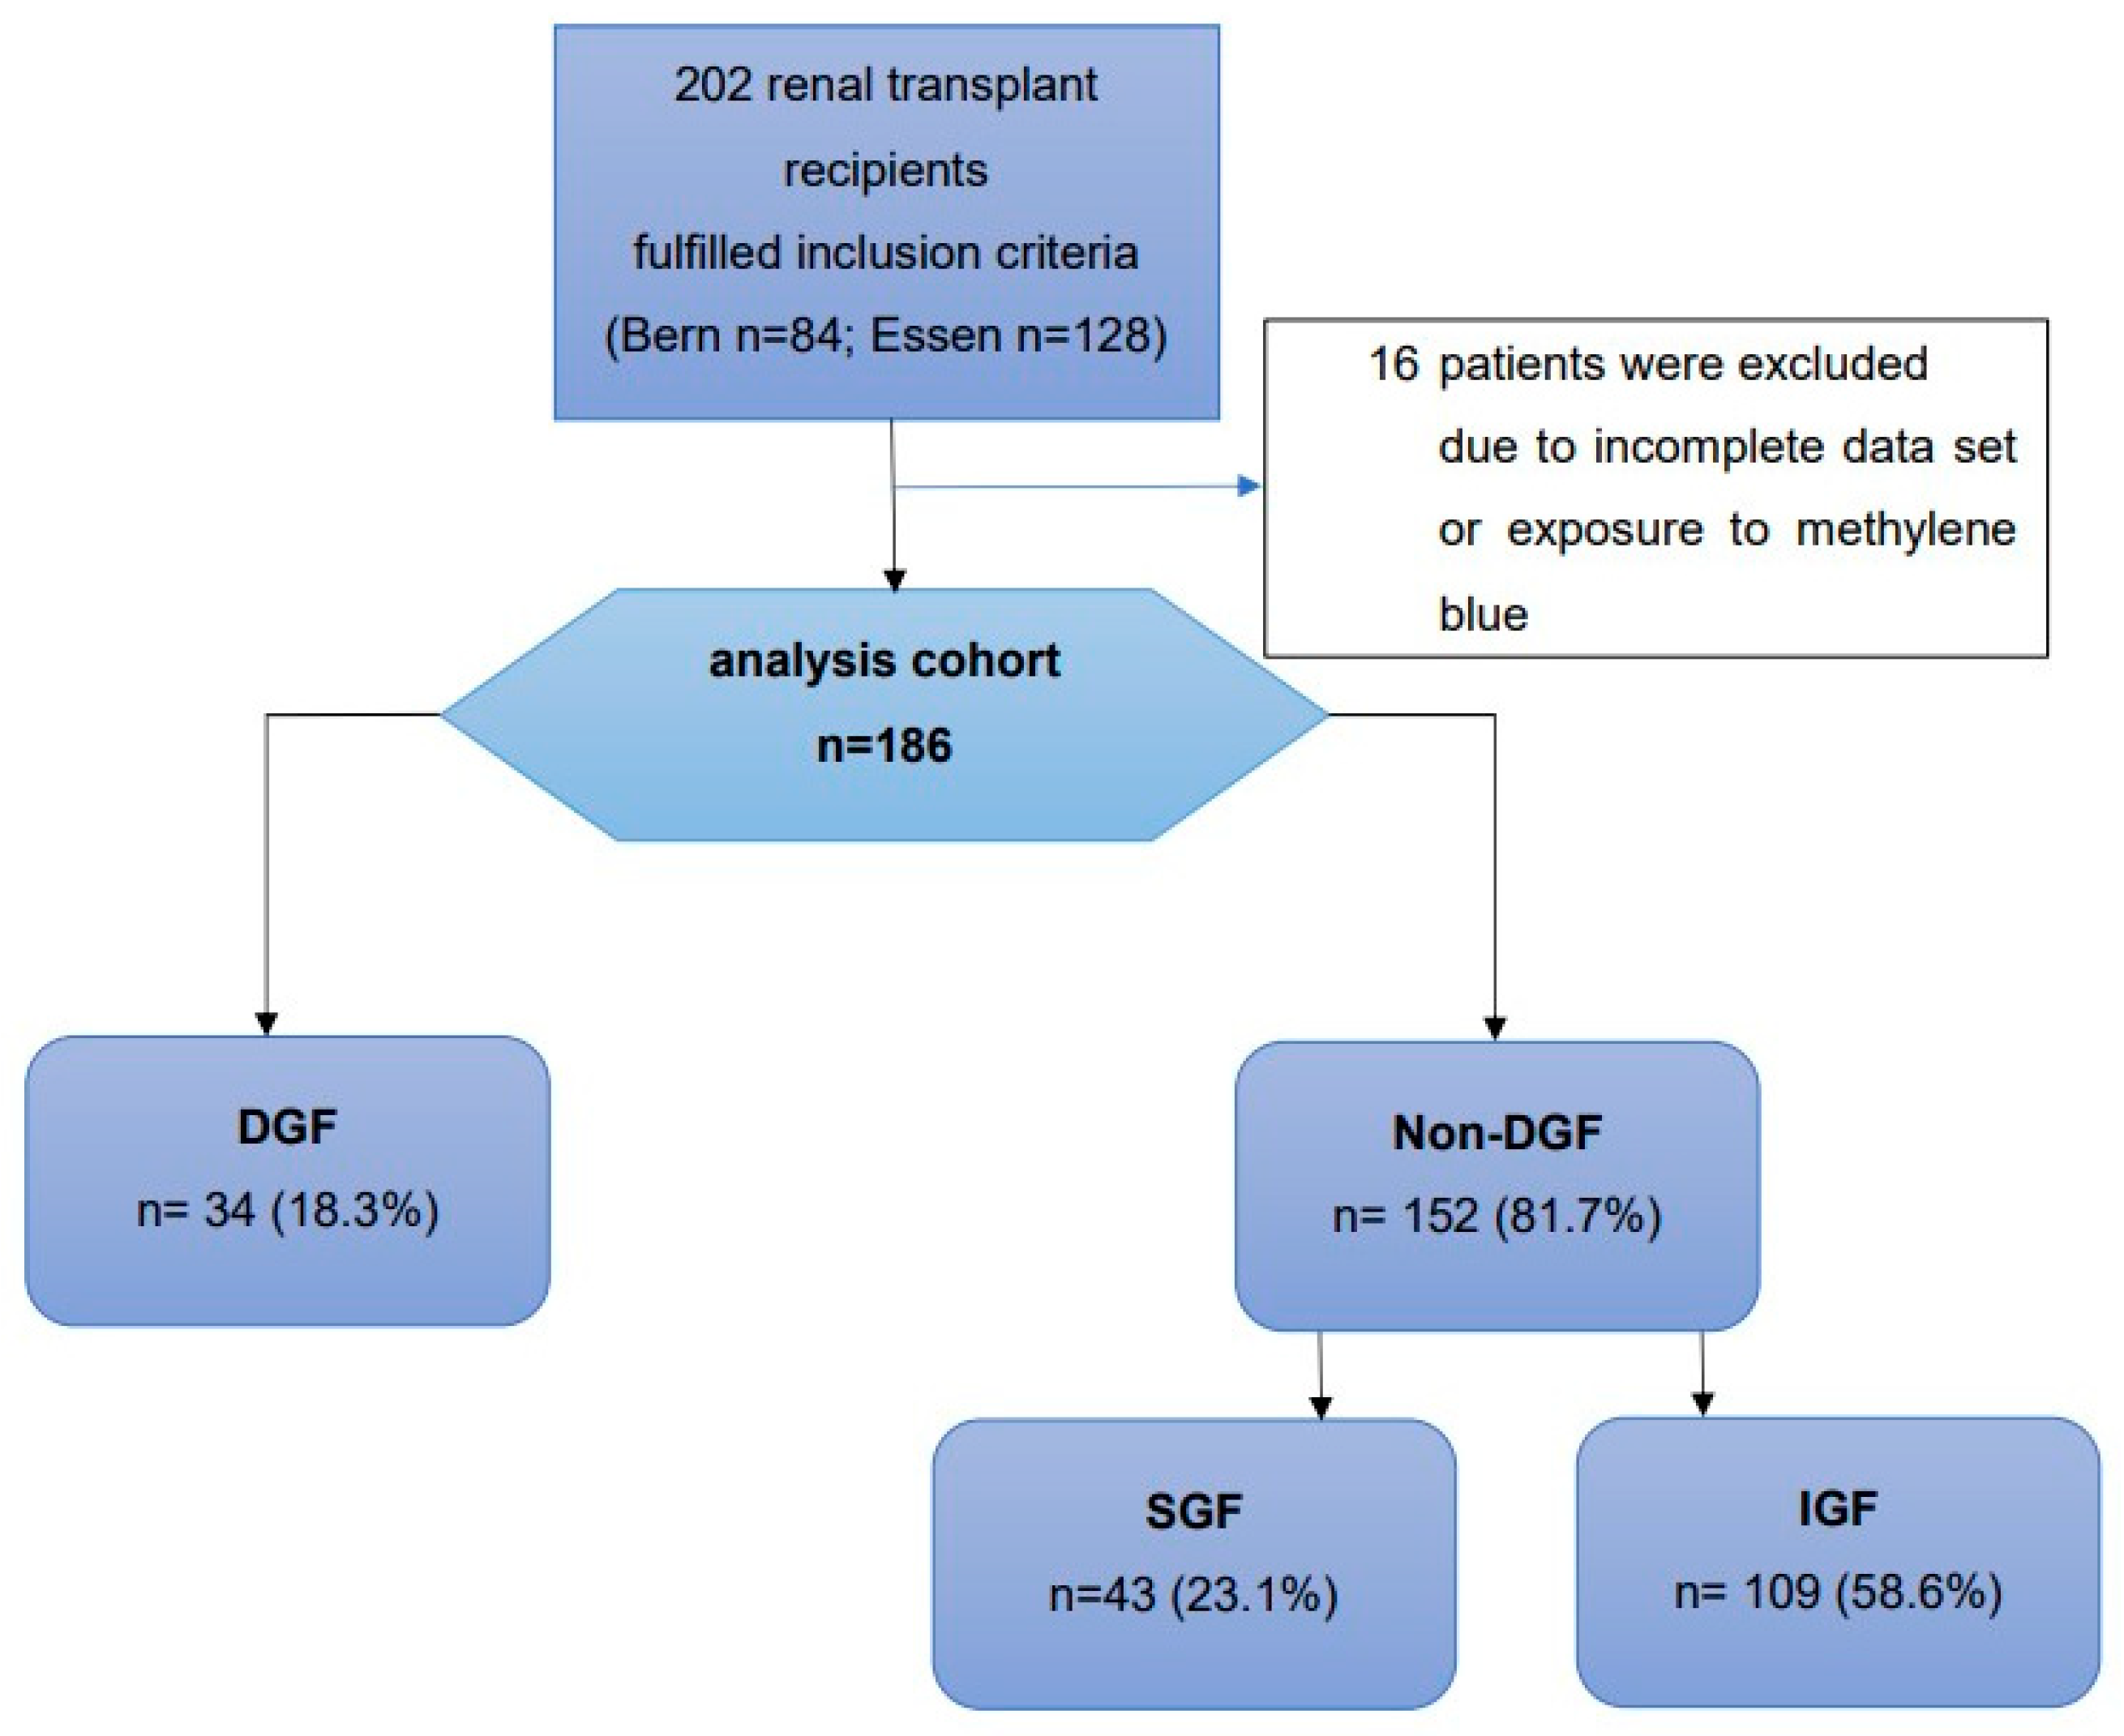
2.1. Study Cohort
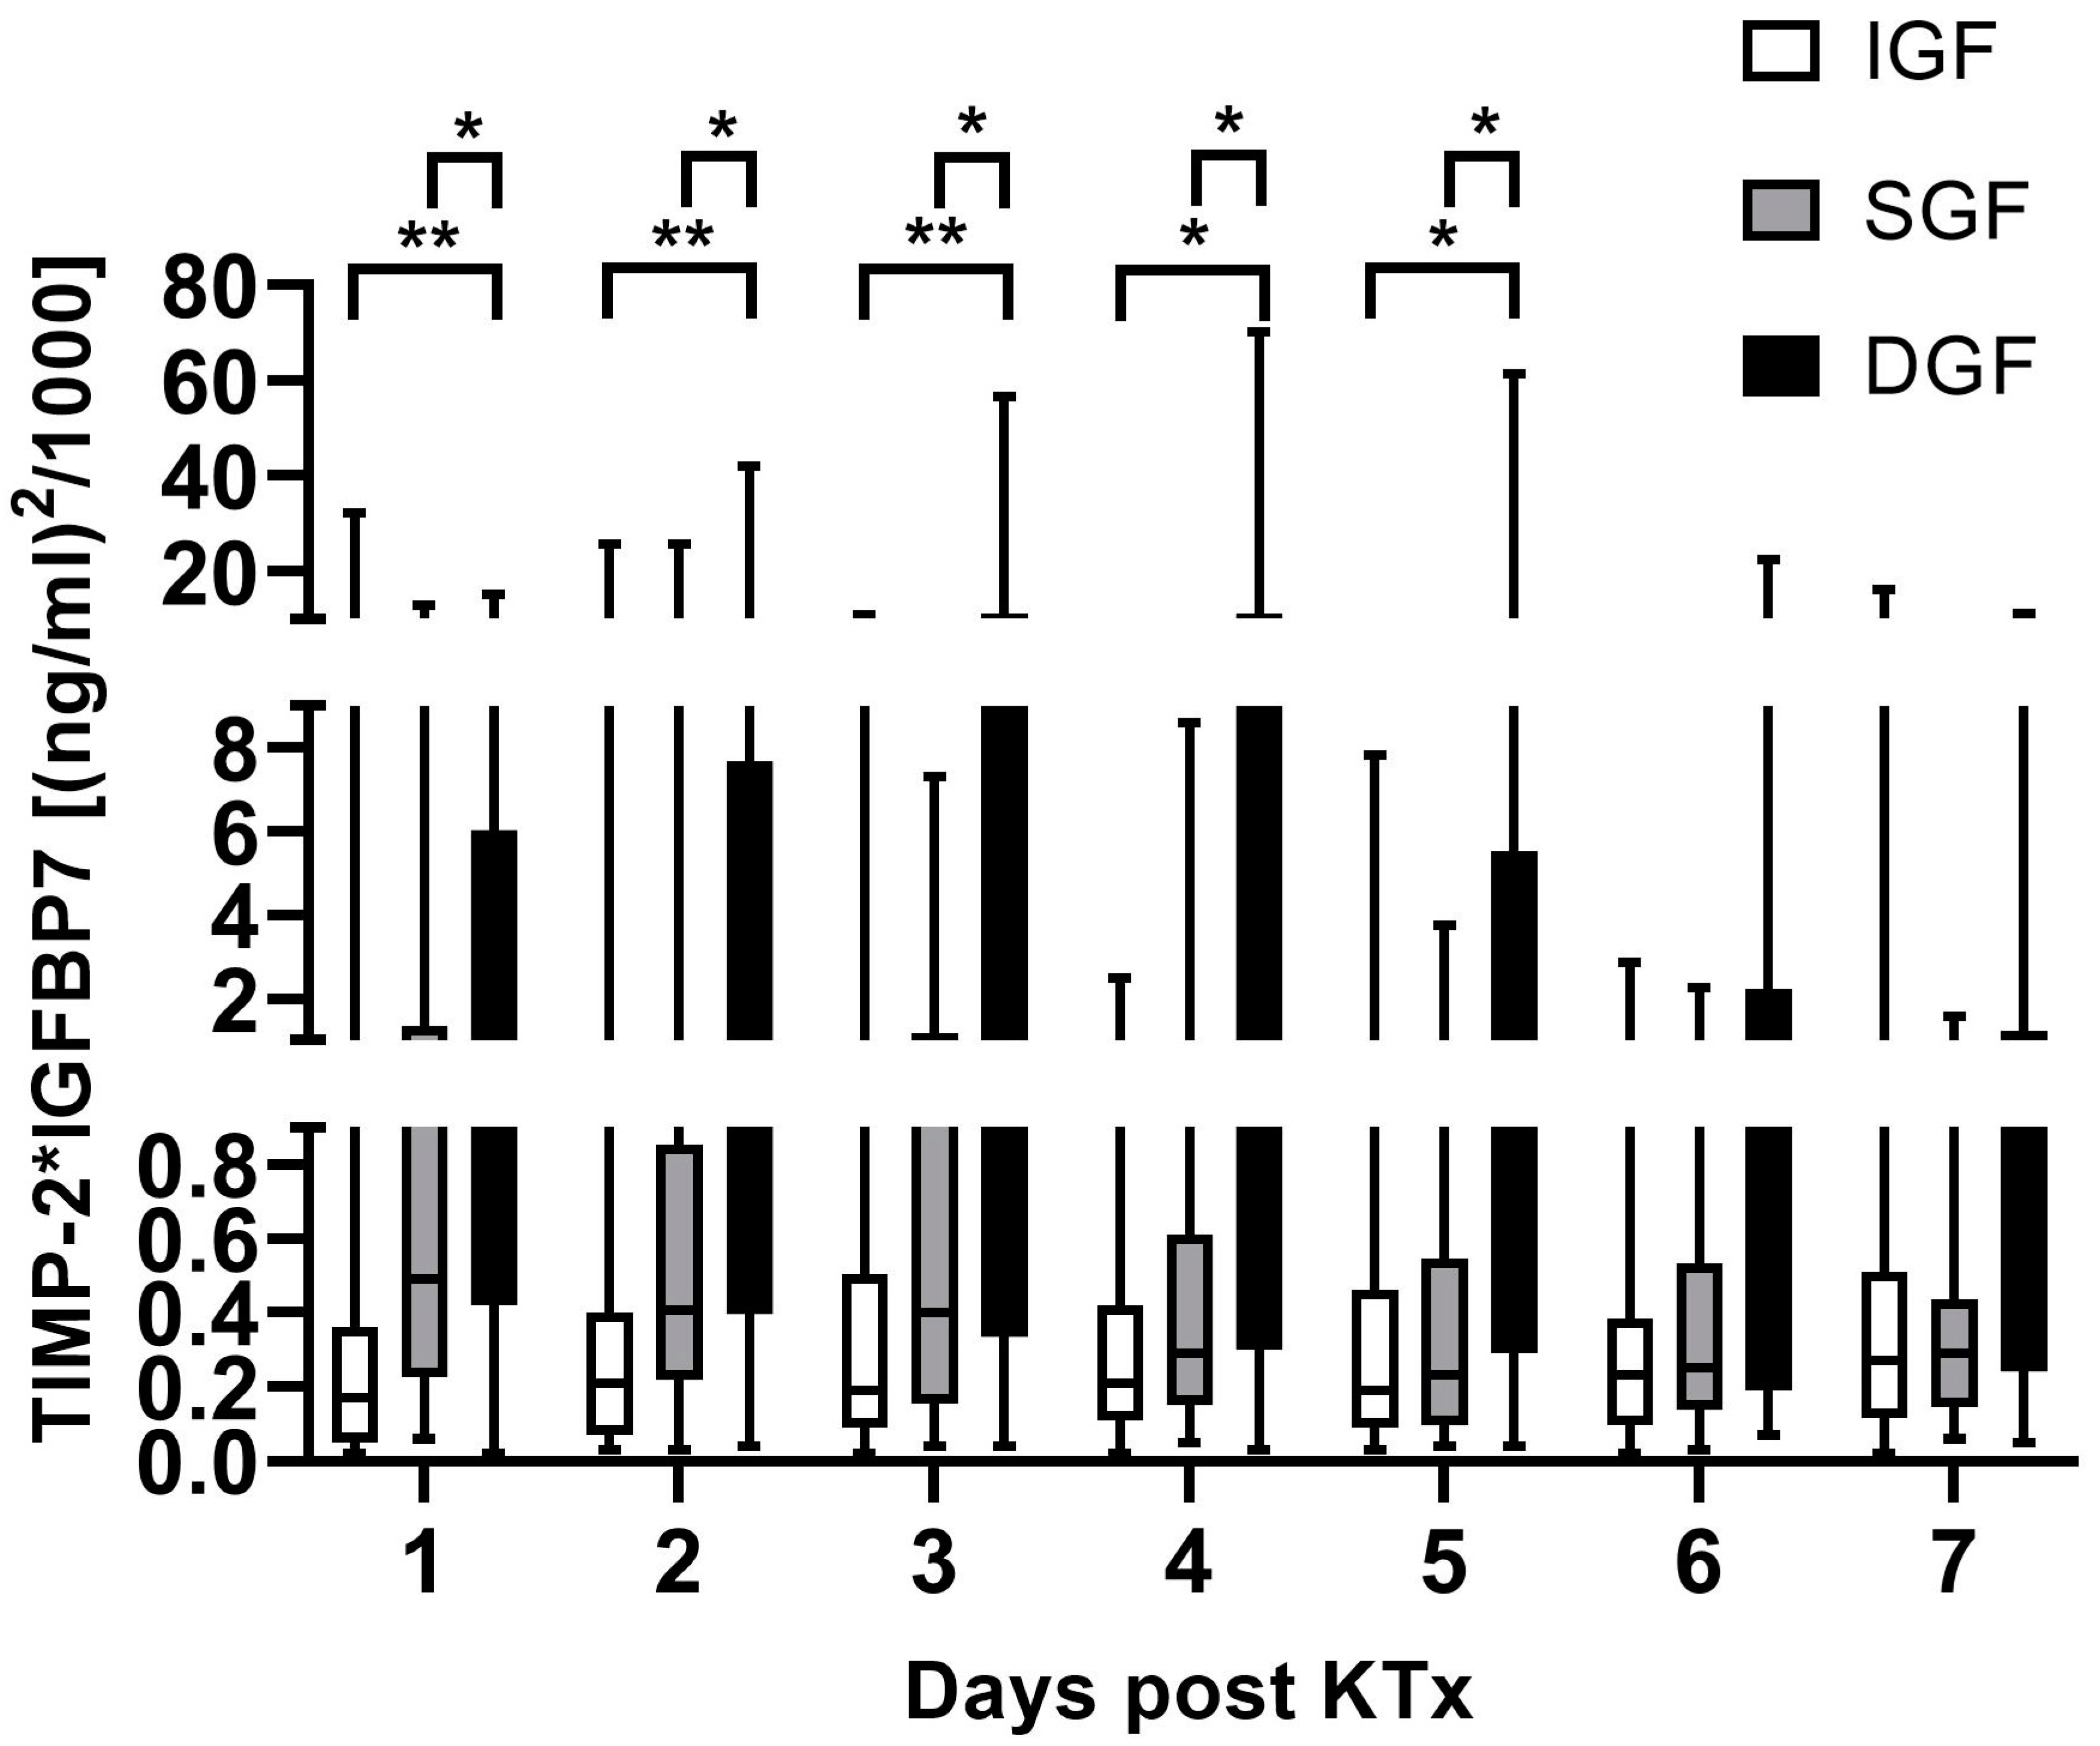
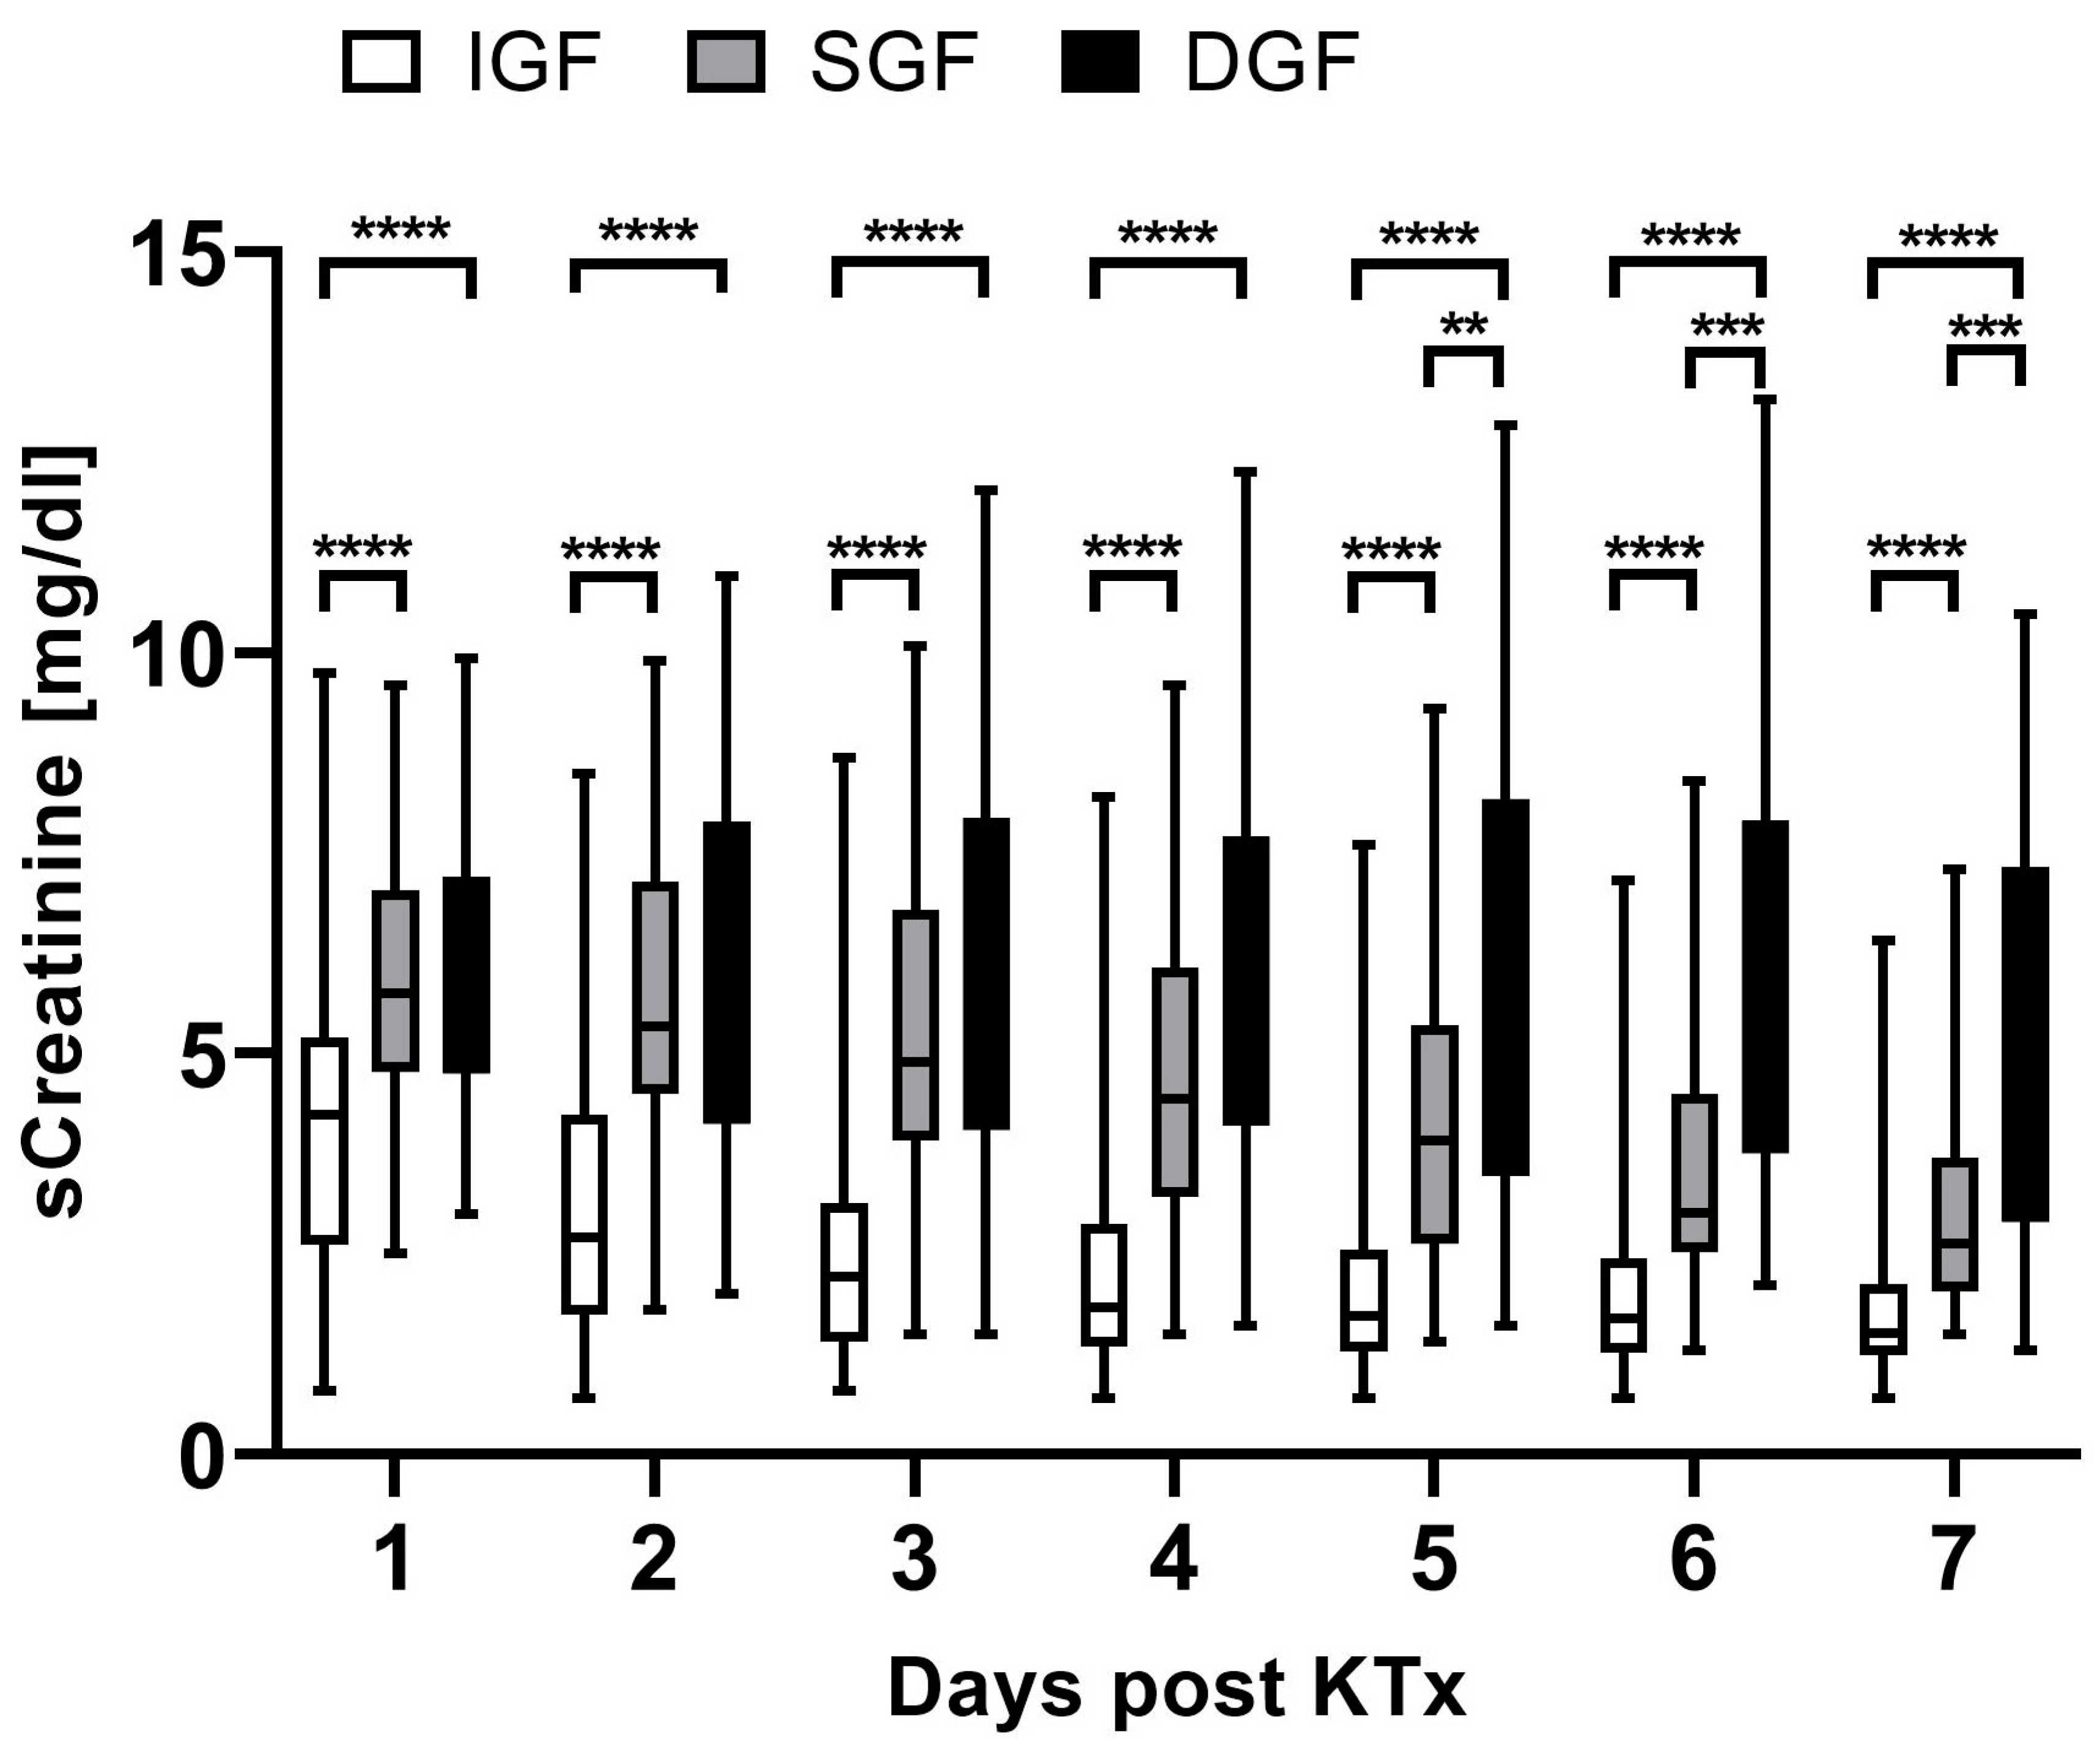
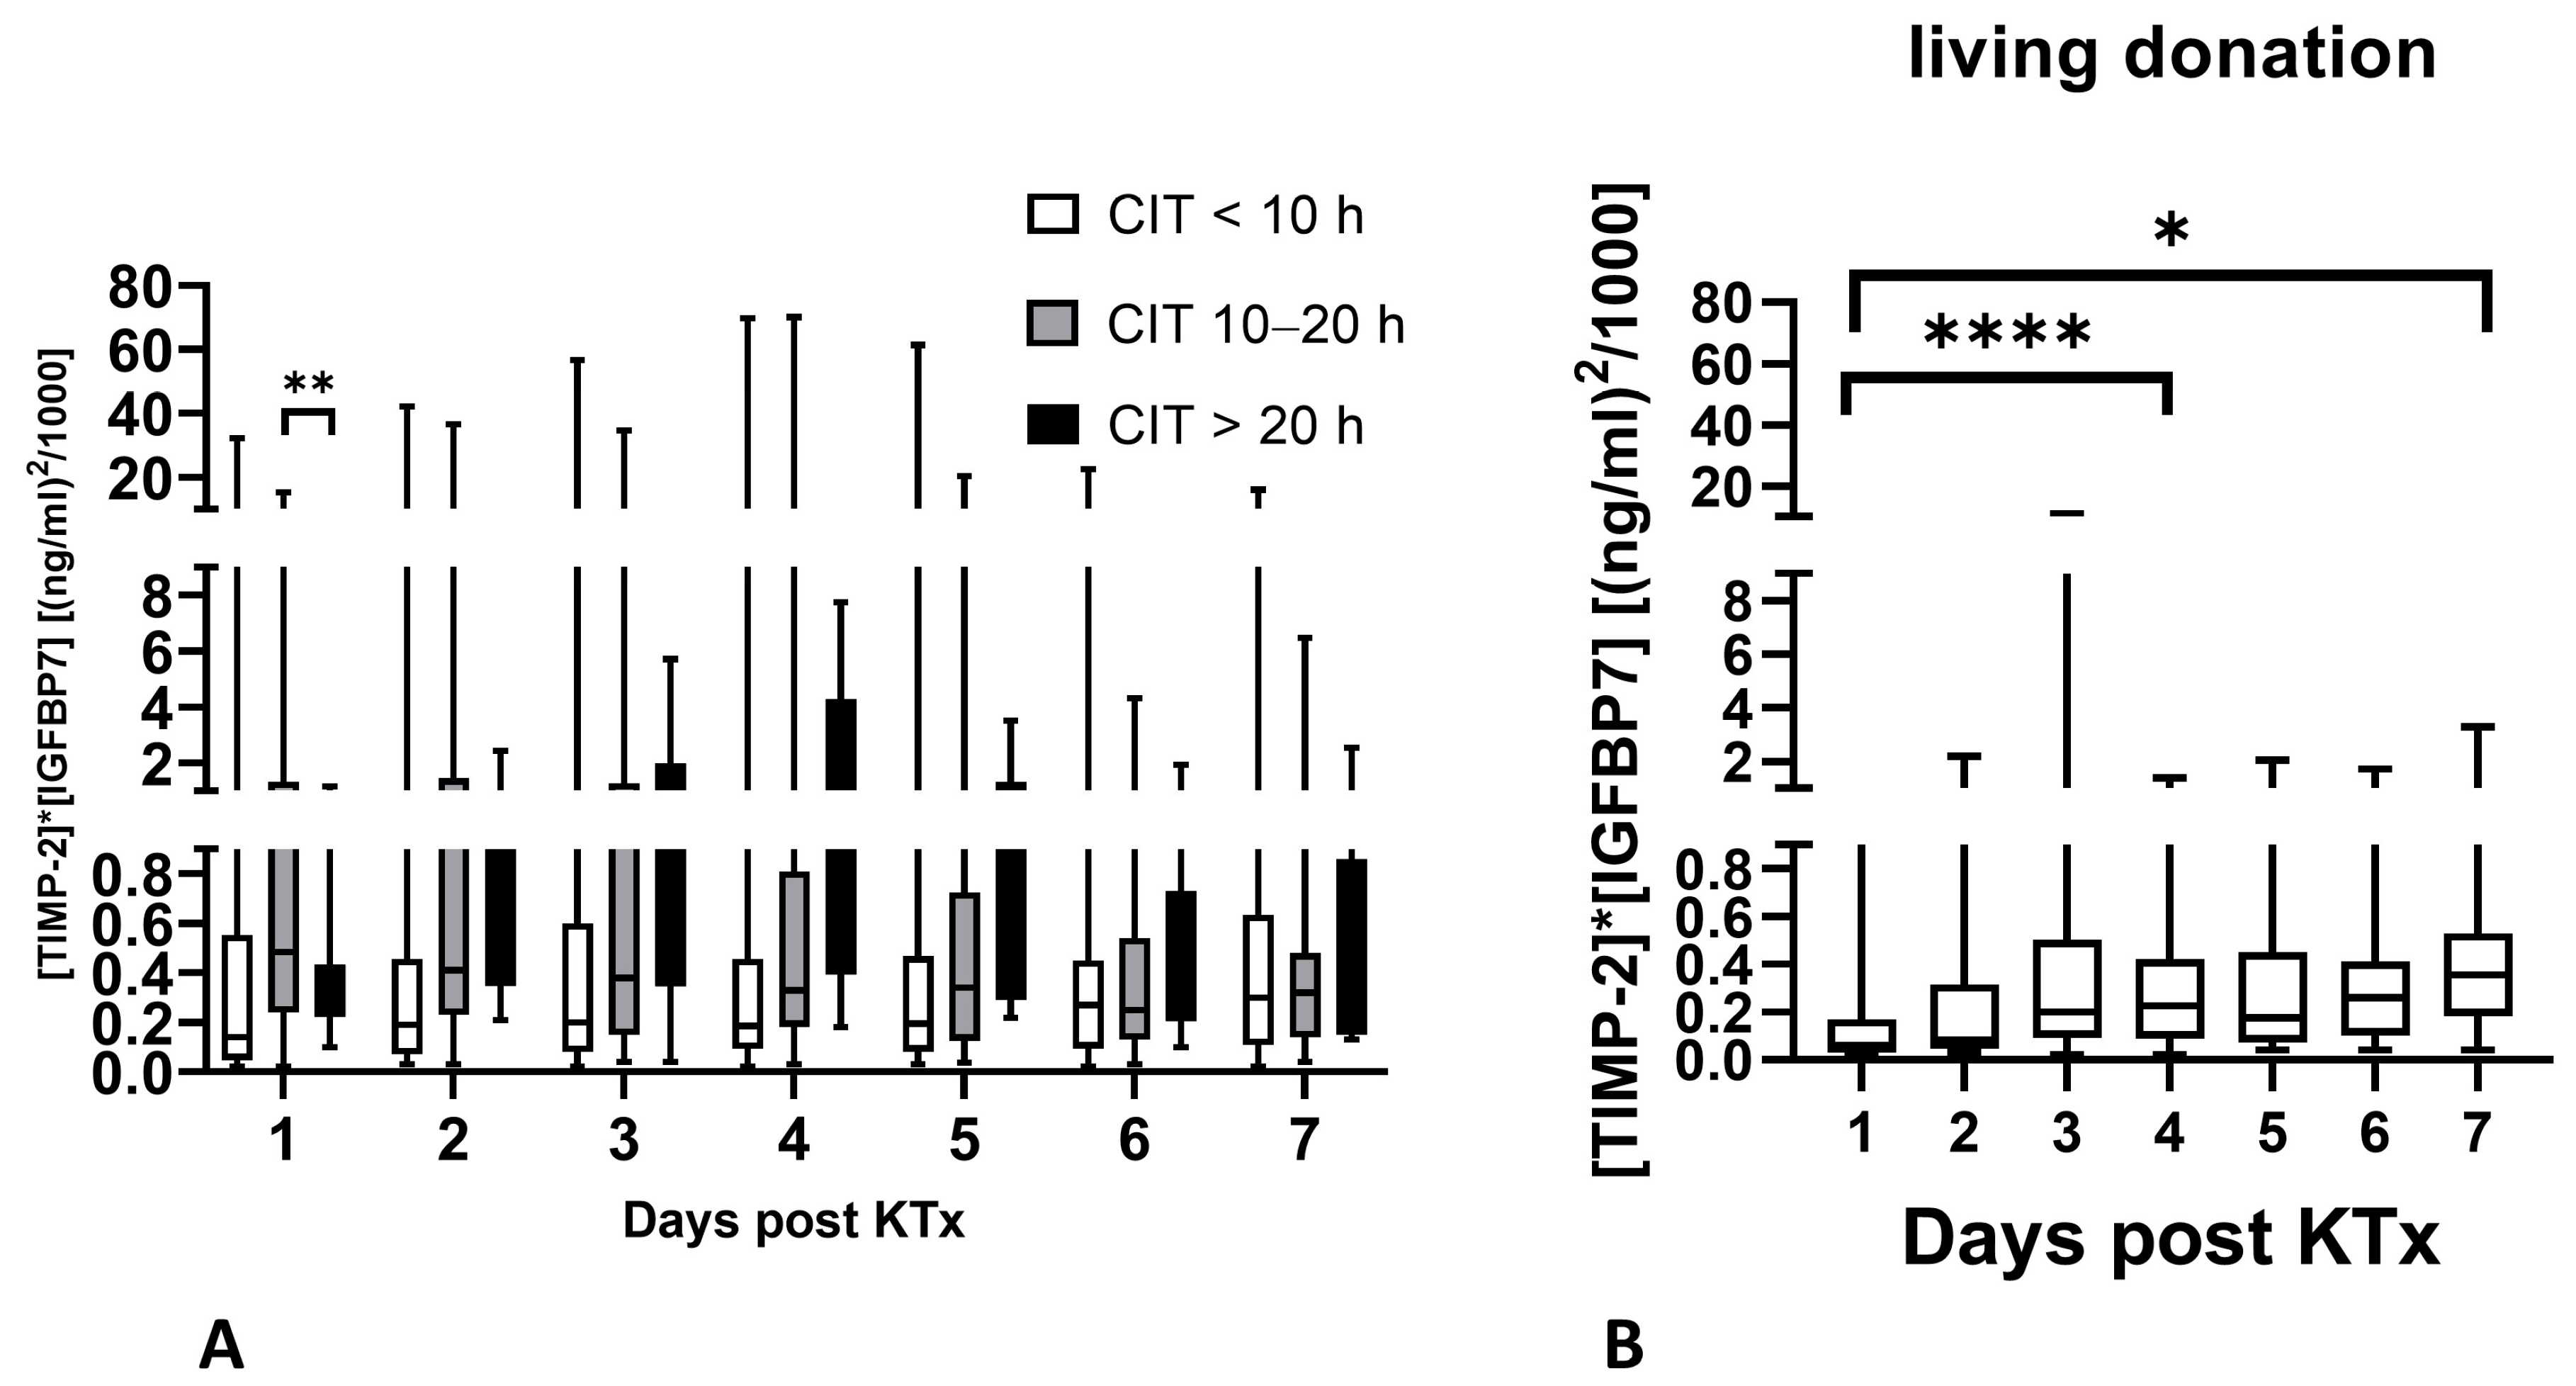
2.2. Biomarker Kinetics during the First Week after Renal Transplantation
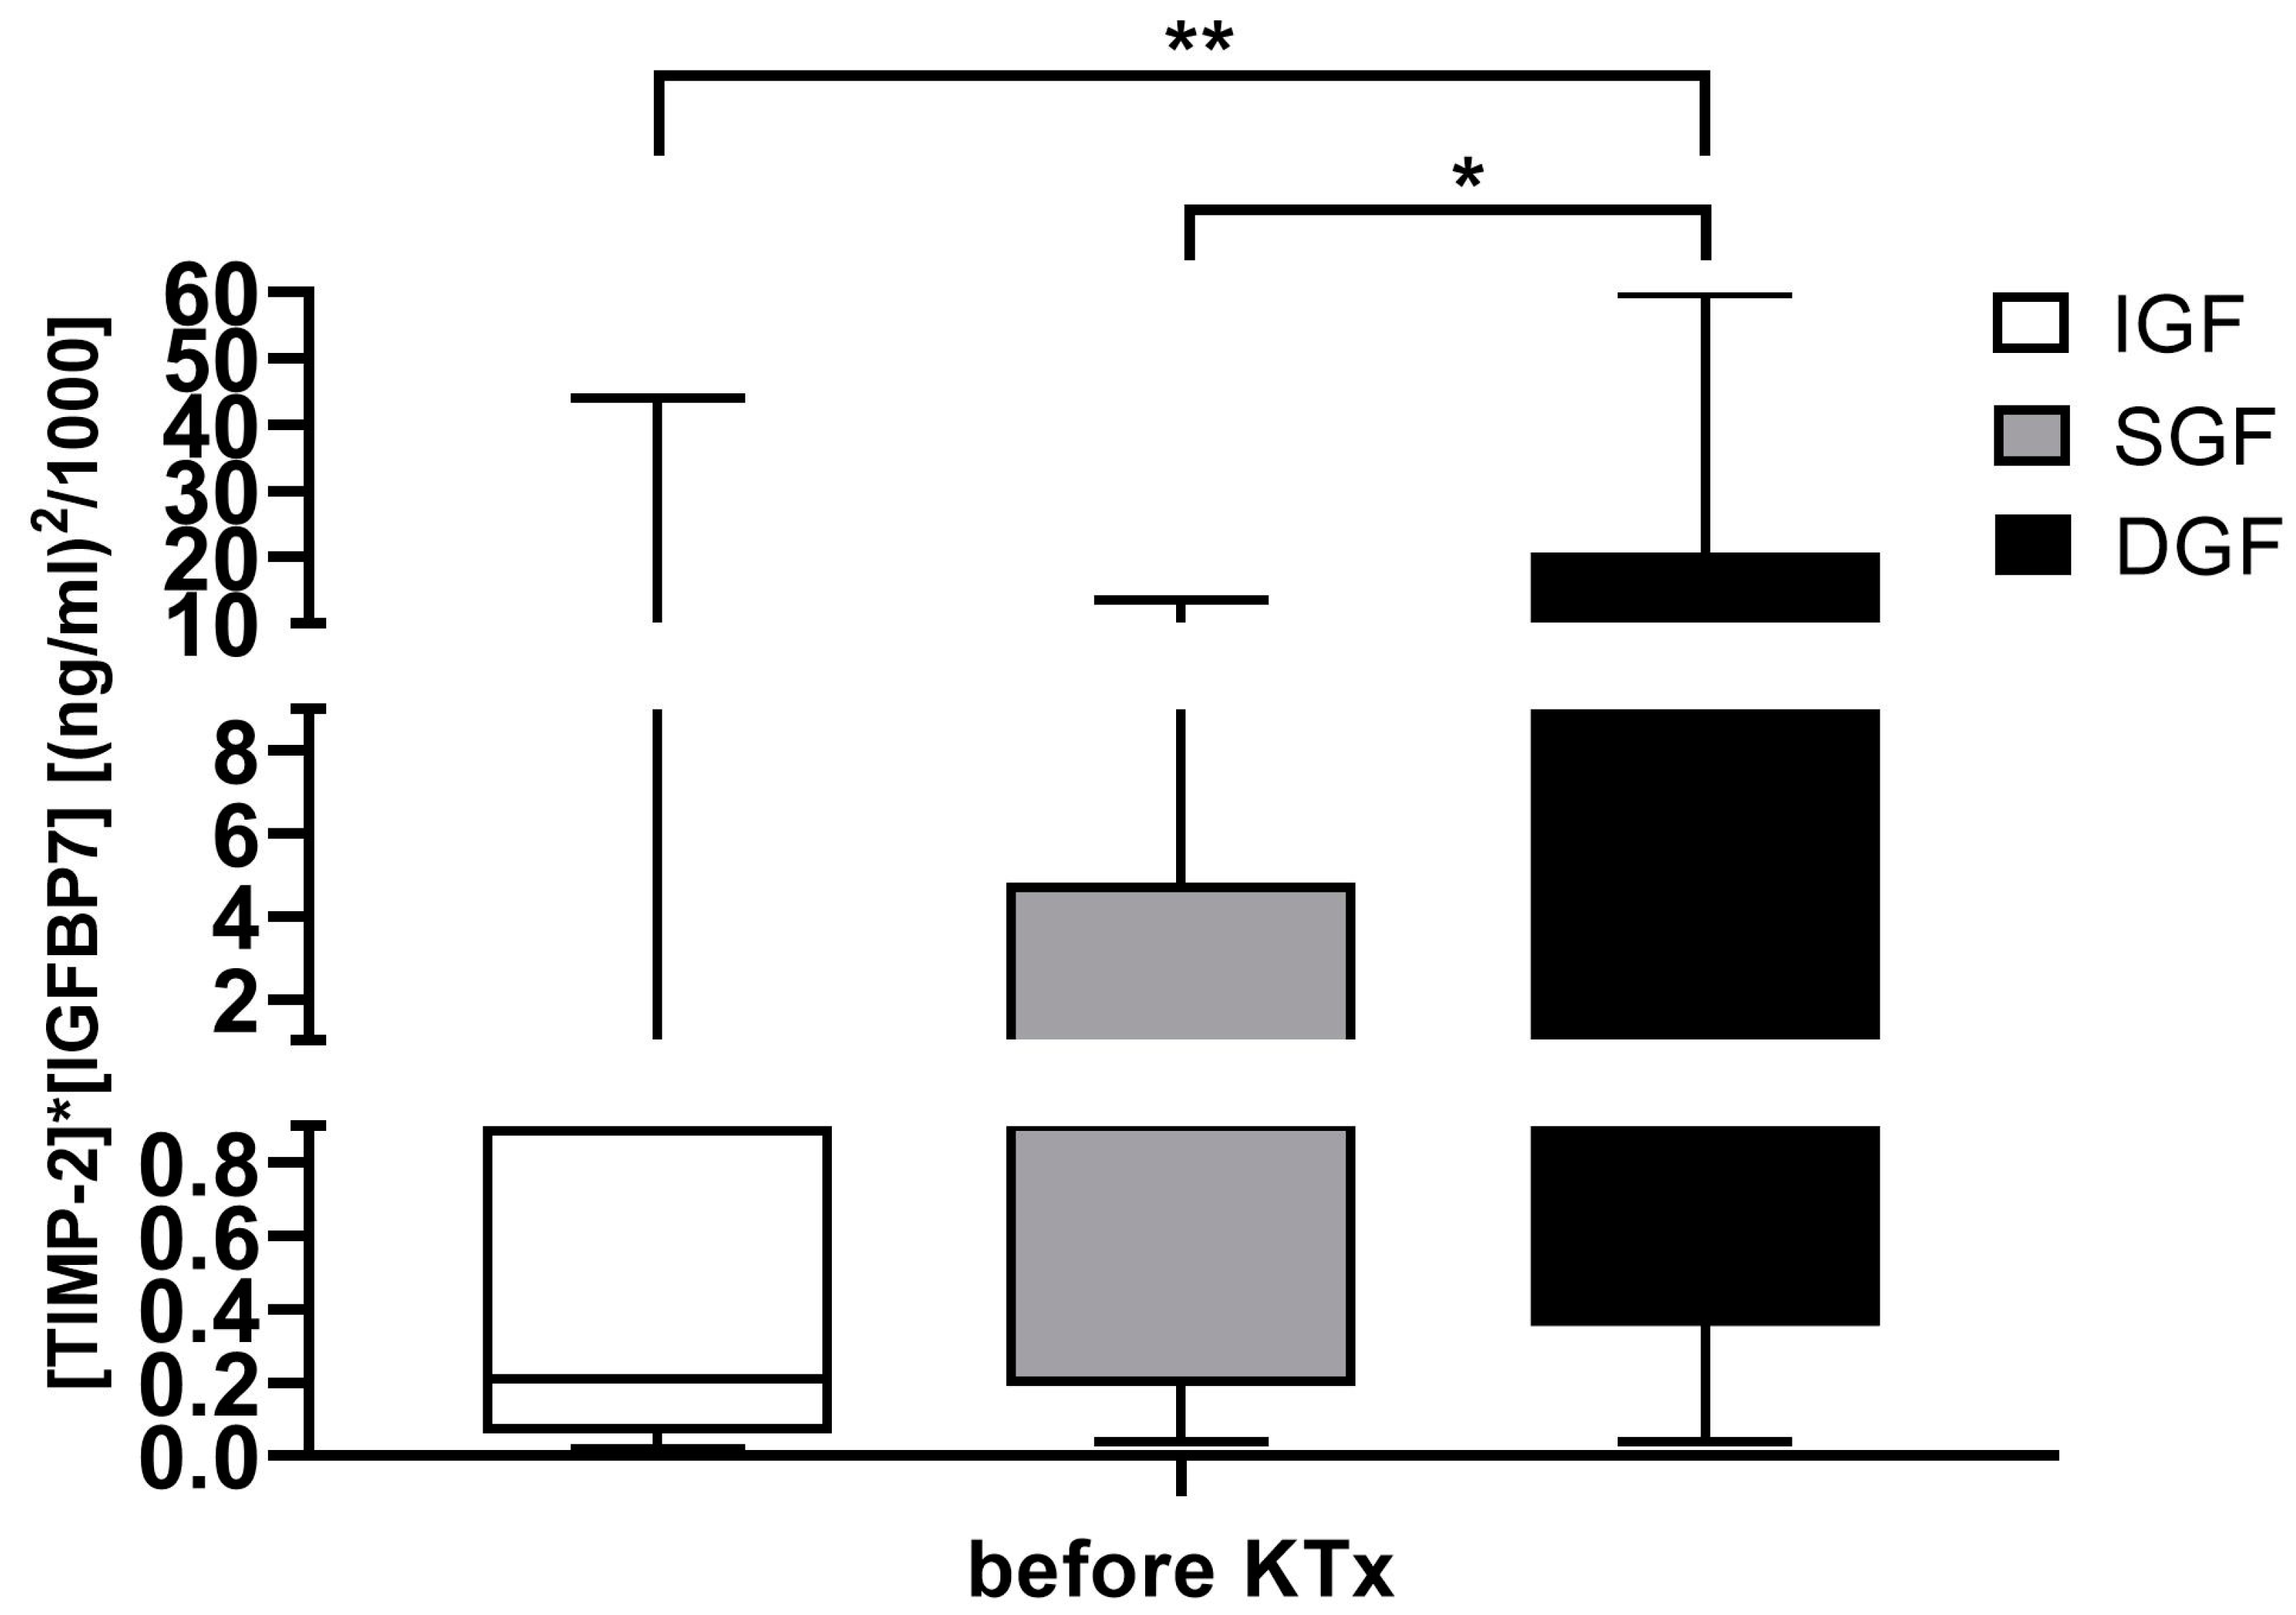
2.3. [TIMP-2] × [IGFBP7] before Renal Transplantation
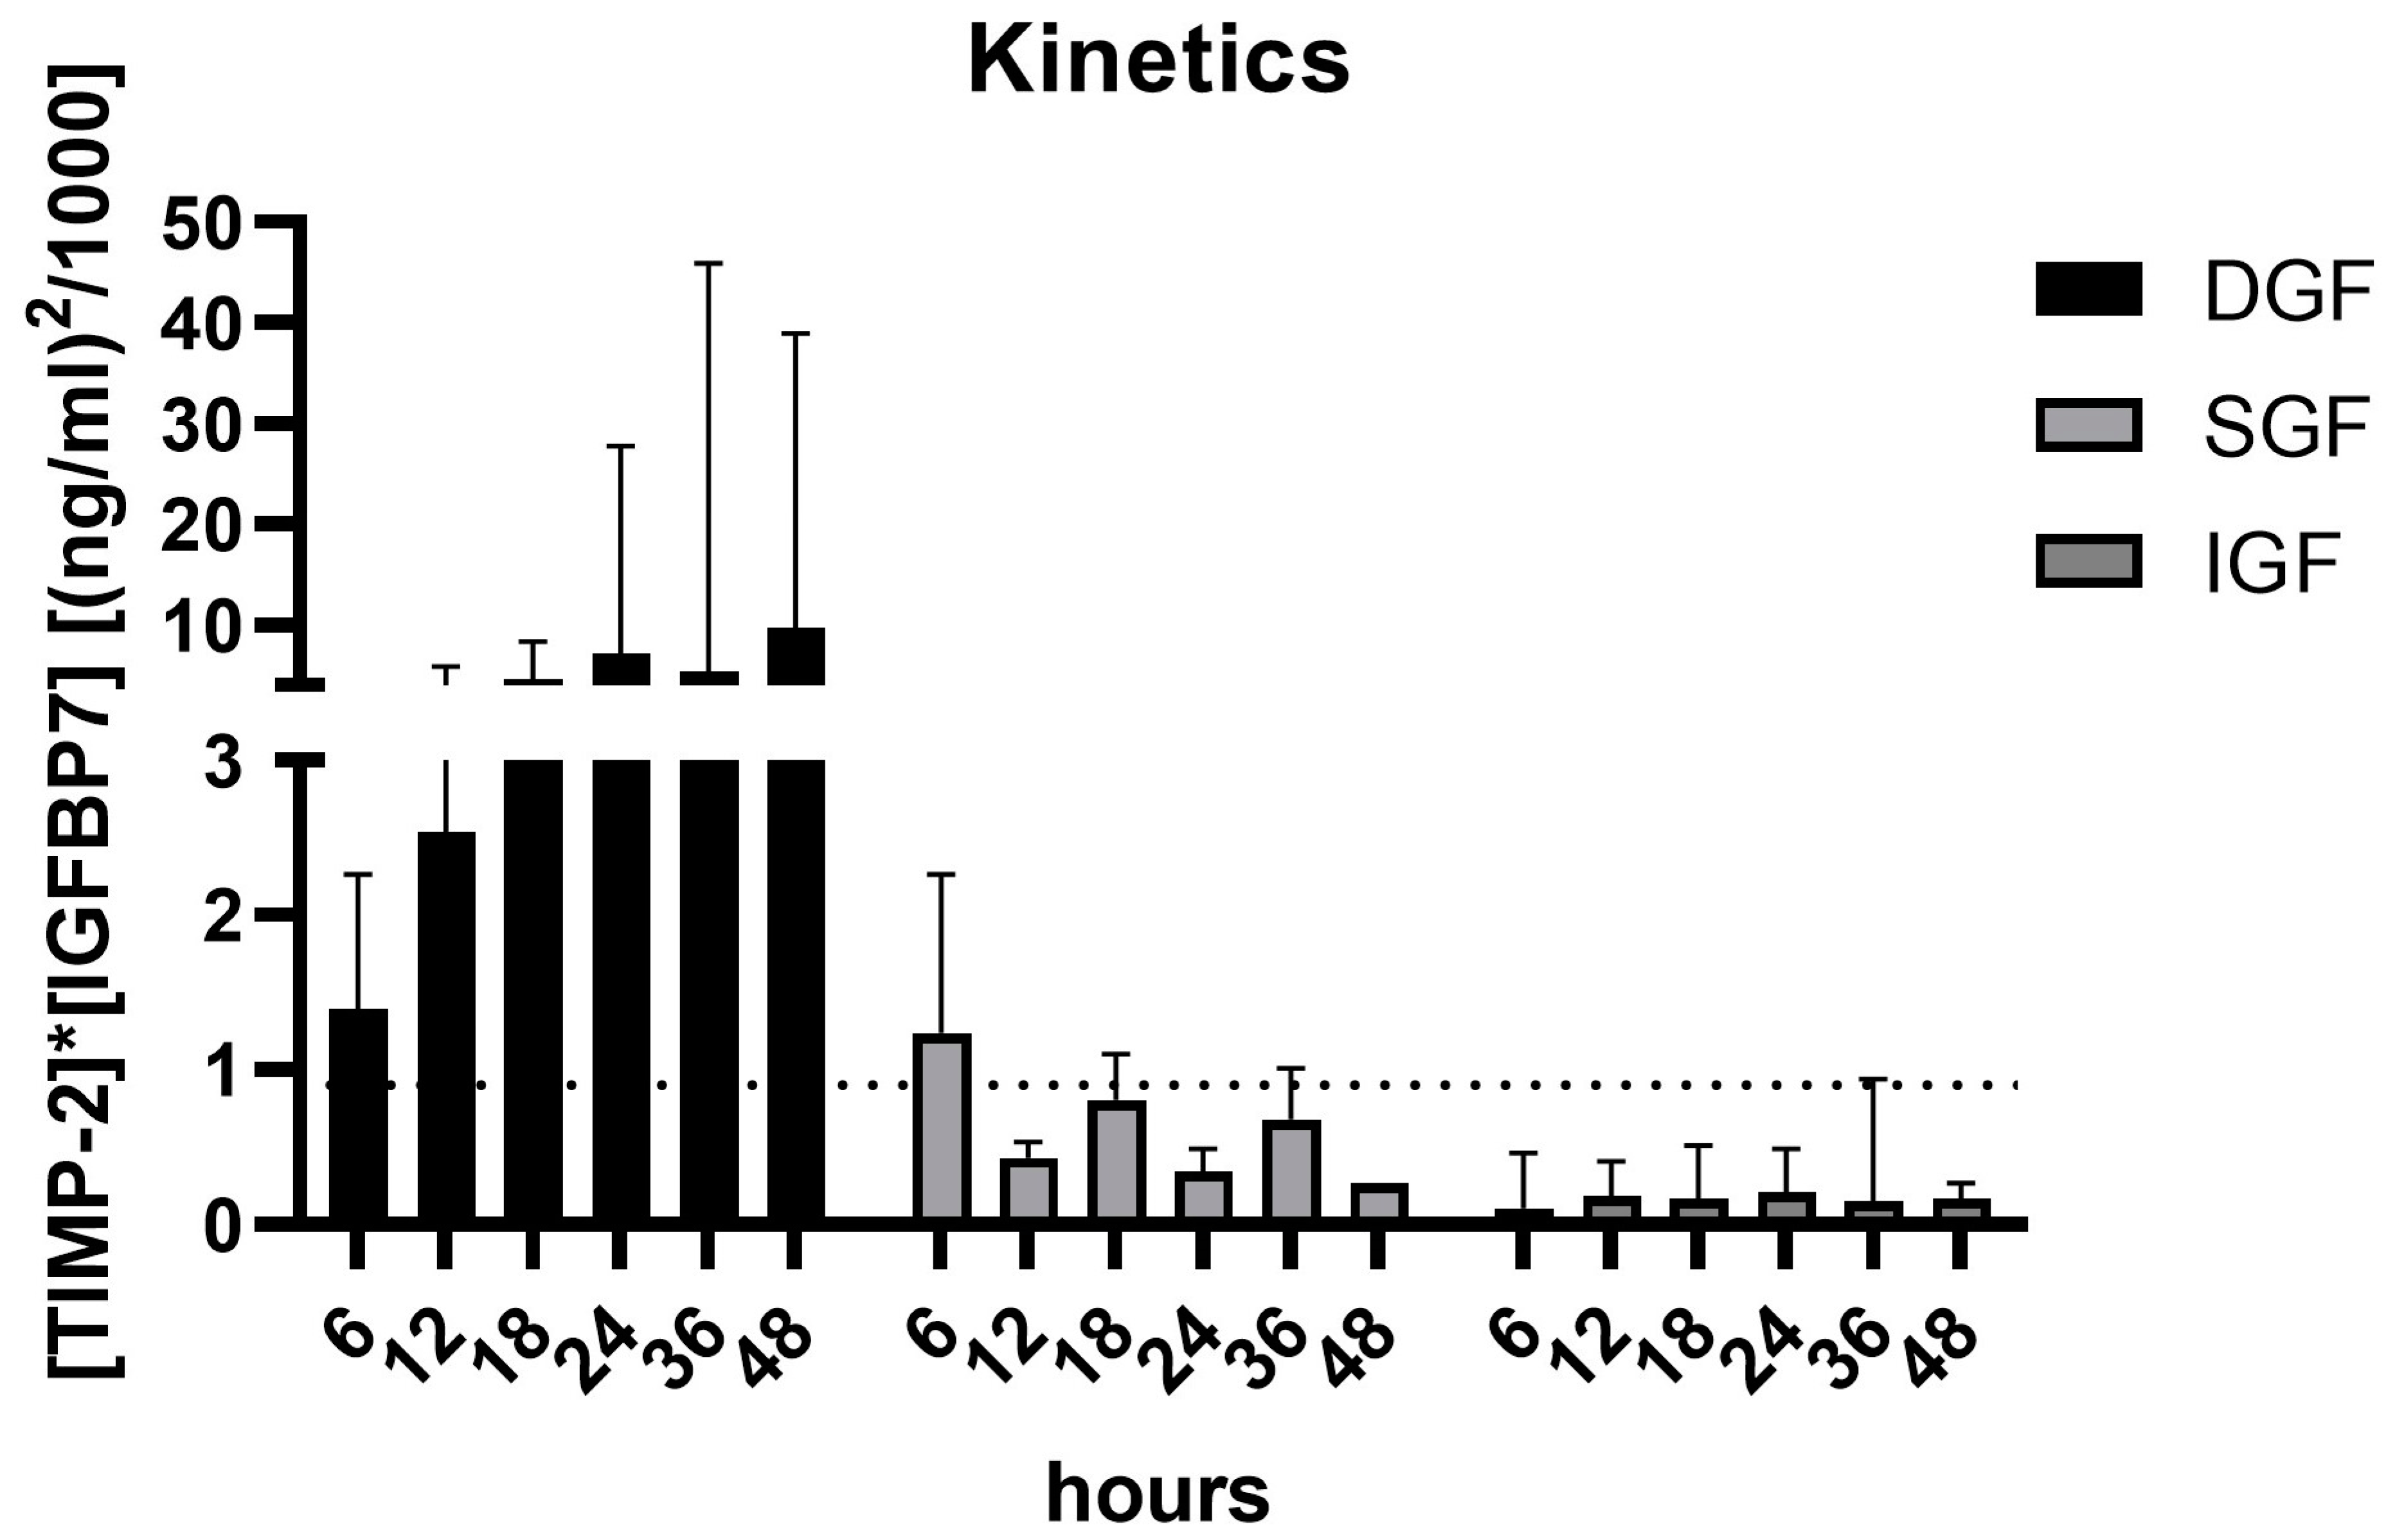
2.4. [TIMP-2] × [IGFBP7] Kinetics during the First 48 h after Renal Transplantation
2.5. [TIMP-2] × [IGFBP7] Levels in Relation to CIT at Time of Renal Transplantation
2.6. [TIMP-2] × [IGFBP7] Levels in Patients with Rejection
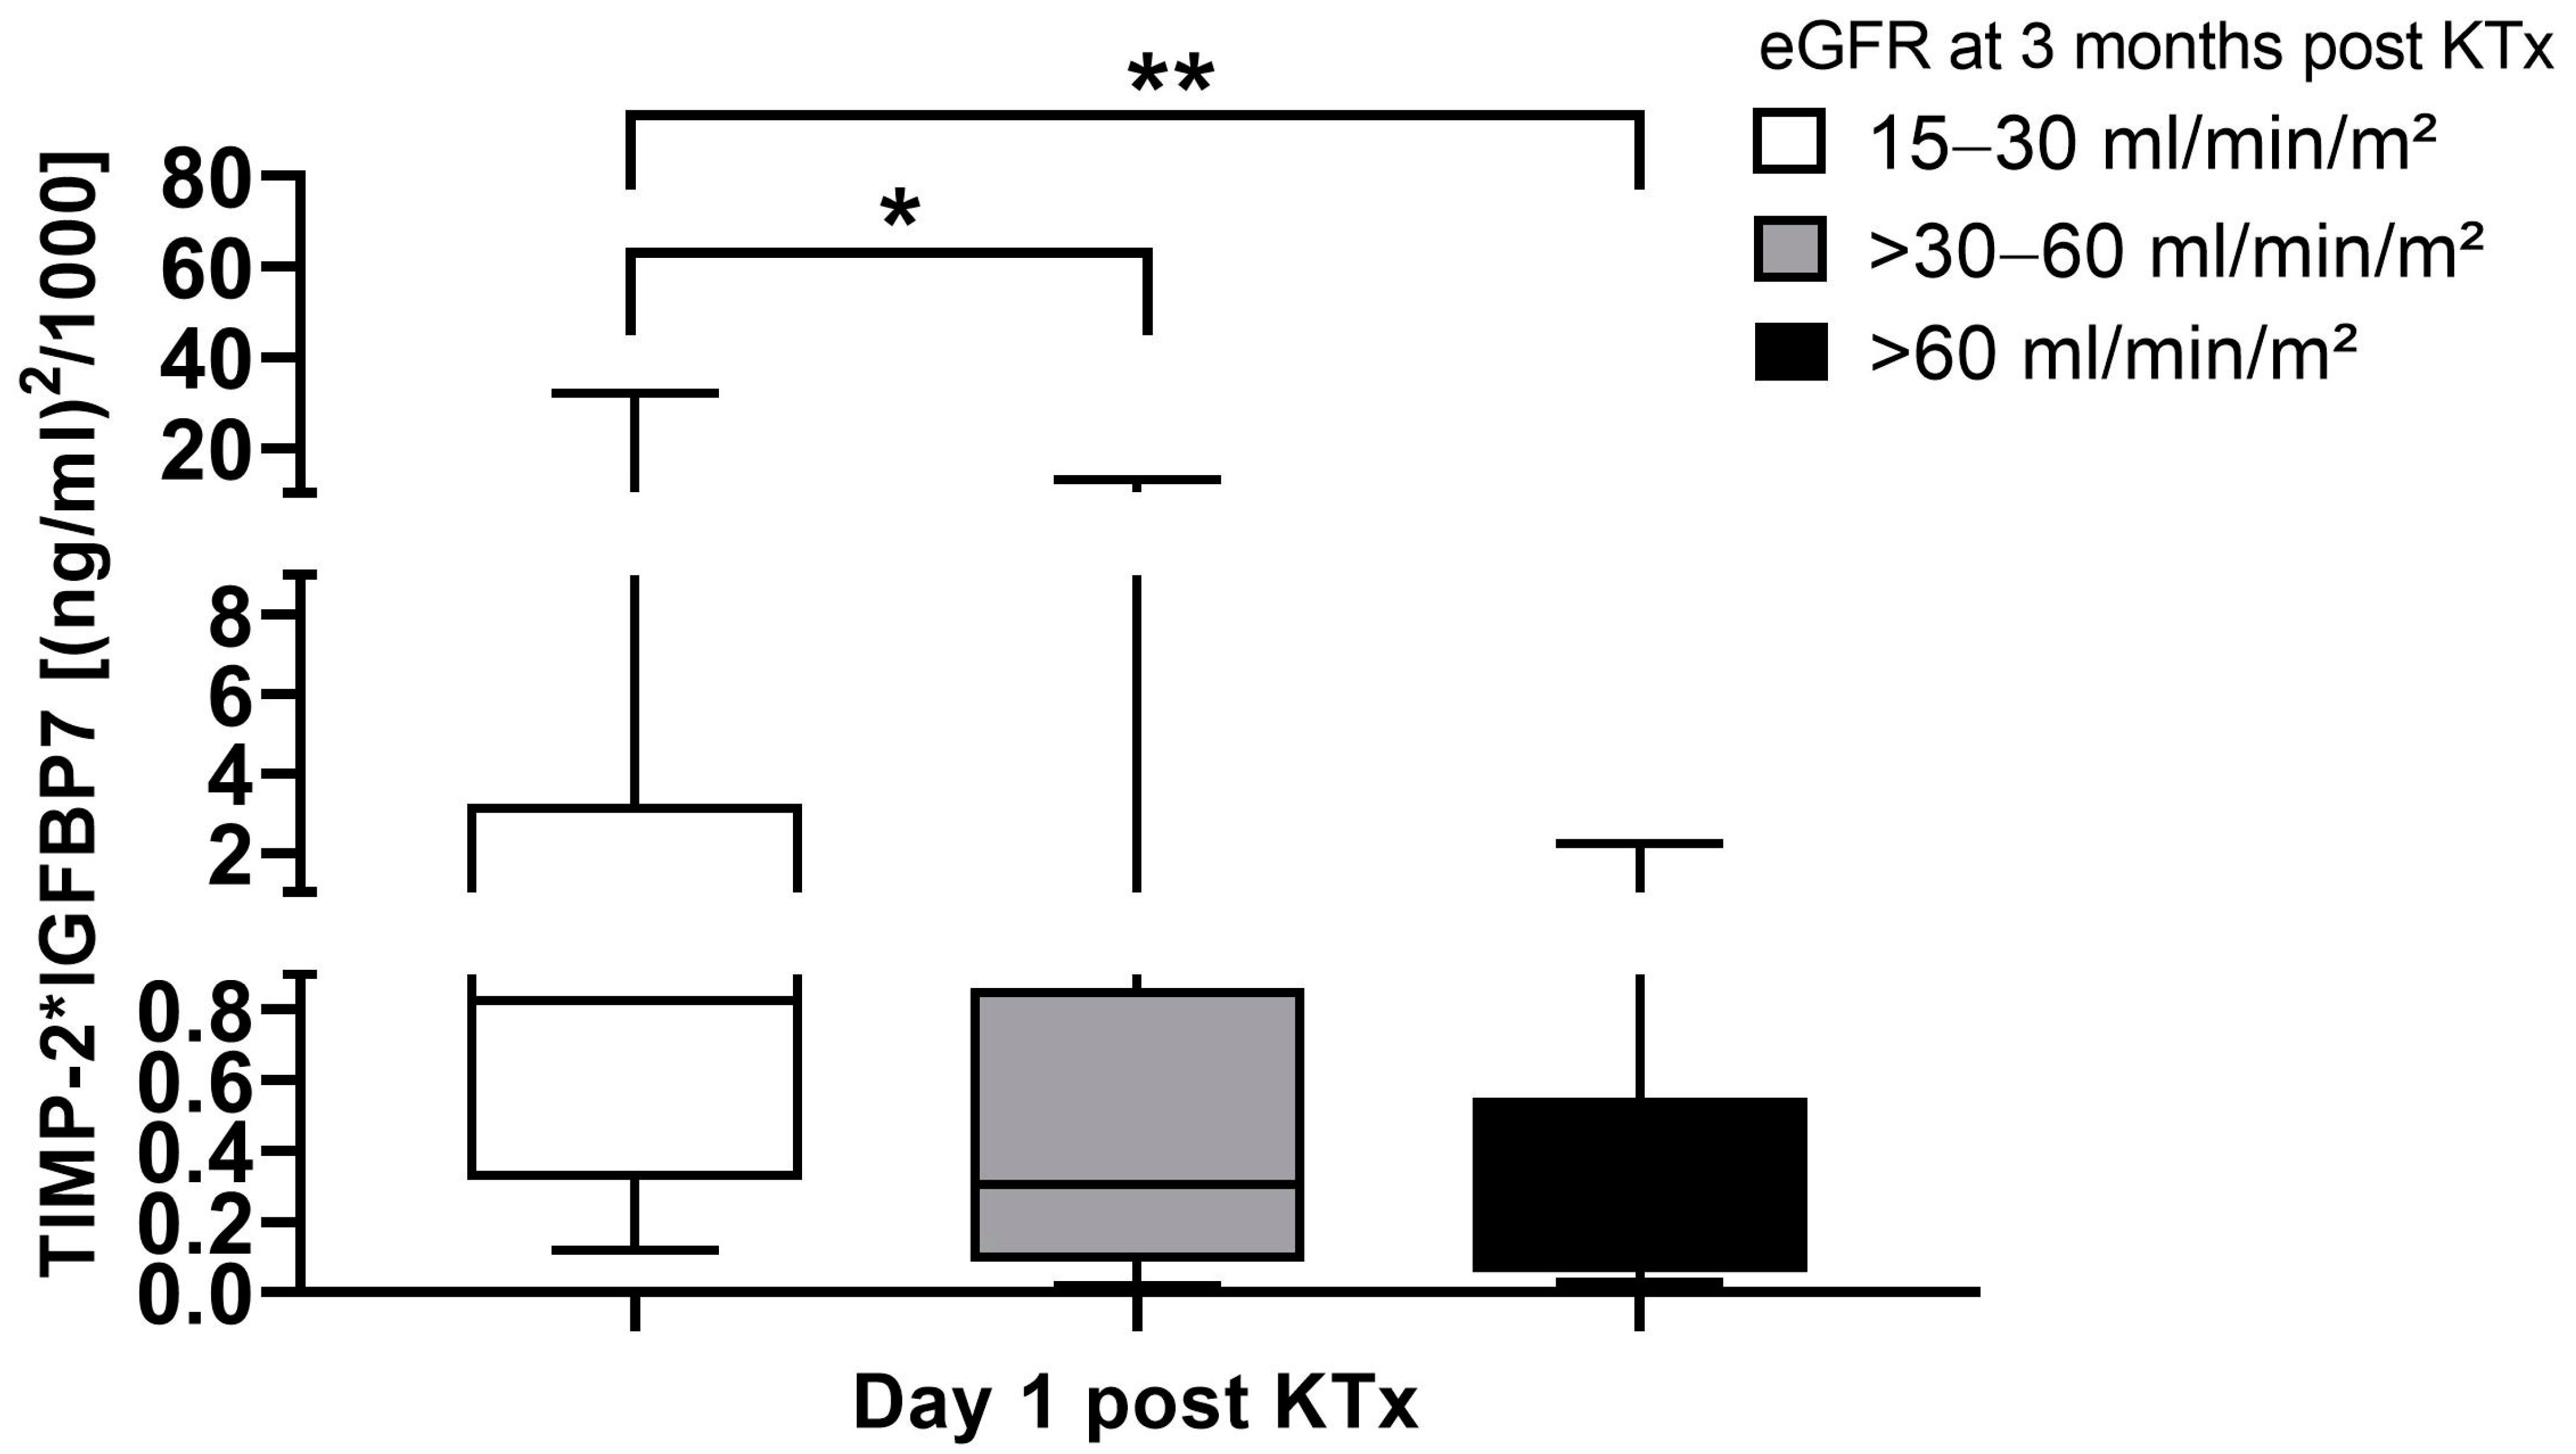
2.7. [TIMP-2] × [IGFBP7] Levels in Relation to eGFR 3 Months after Transplantation
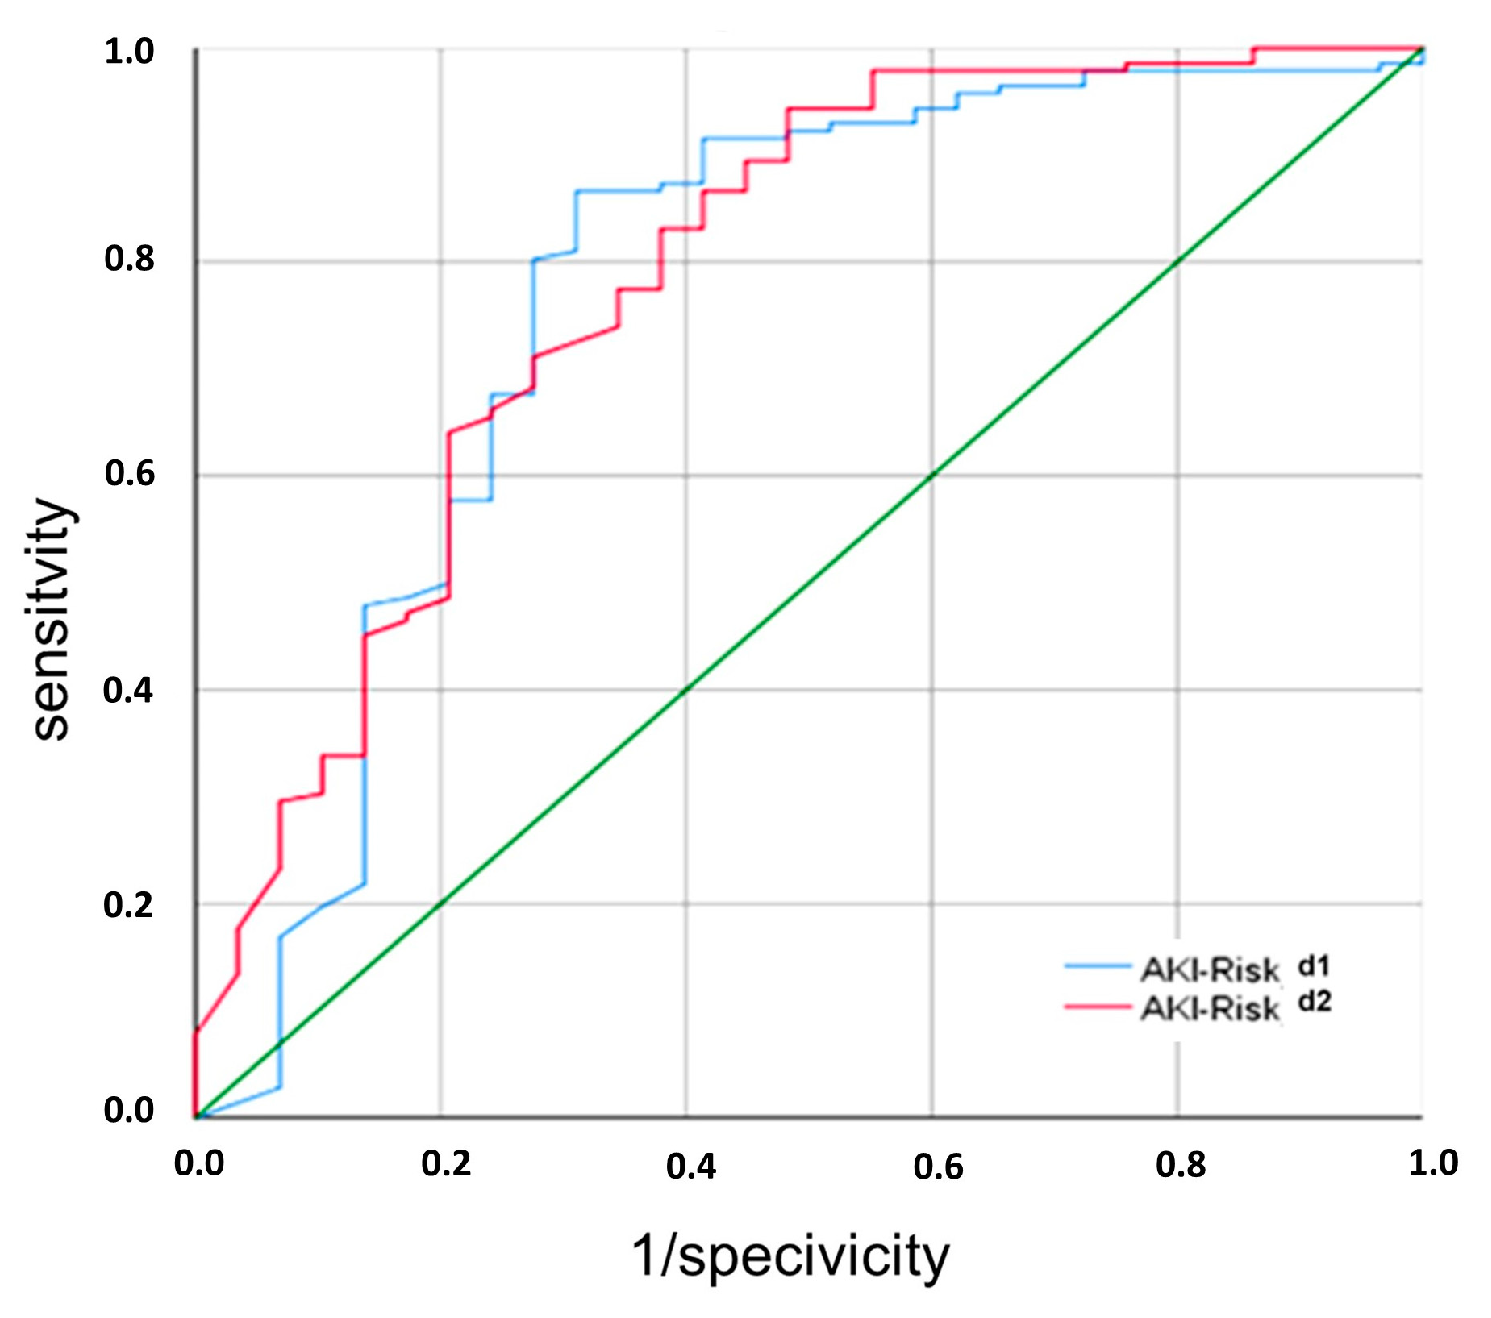
2.8. Performance of [TIMP-2] × [IGFBP7] for Identification of Non-DGF
3. Discussion
4. Materials and Methods
4.1. Patient Population
4.2. Definition of Graft Function during the First Week after Renal Transplantation
4.3. Urine Sample and Data Collection
4.4. Measurement of TIMP-2 and IGFBP7
4.5. Statistical Analysis
Author Contributions
Funding
Institutional Review Board Statement
Informed Consent Statement
Data Availability Statement
Acknowledgments
Conflicts of Interest
References
- Quiroga, I.; McShane, P.; Koo, D.; Gray, D.; Friend, P.; Fuggle, S.; Darby, C. Major effects of delayed graft function and cold ischaemia time on renal allograft survival. Nephrol. Dial. Transplant. 2006, 21, 1689–1696. [Google Scholar] [CrossRef]
- Kyllönen, L.; Salmela, K.; Eklund, B.; Halme, L.; Höckerstedt, K.; Isoniemi, H.; Mäkisalo, H.; Ahonen, J. Long-term results of 1047 cadaveric kidney transplantations with special emphasis on initial graft function and rejection. Transpl. Int. 2000, 13, 122–128. [Google Scholar] [CrossRef]
- Heuer, M.; Zeiger, A.; Kaiser, G.; Mathe, Z.; Goldenberg, A.; Sauerland, S.; Paul, A.; Treckmann, J. Use of marginal organs in kidney transplantion for marginal recipients: Too close to the margins of safety? Eur. J. Med. Res. 2010, 15, 31–34. [Google Scholar] [CrossRef][Green Version]
- Arnau, A.; Rodrigo, E.; Minambres, E.; Ruiz, J.; Ballesteros, M.; Pinera, C.; Fernandez-Fresnedo, G.; Palomar, R.; Arias, M. Prediction of kidney transplant outcome by donor quality scoring systems: Expanded criteria donor and deceased donor score. Transplant. Proc. 2012, 44, 2555–2557. [Google Scholar] [CrossRef]
- Nashan, B.; Abbud-Filho, M.; Citterio, F. Prediction, prevention, and management of delayed graft function: Where are we now? Clin. Transplant. 2016, 30, 1198–1208. [Google Scholar] [CrossRef]
- Mallon, D.; Summers, D.; Bradley, J.; Pettigrew, G. Defining delayed graft function after renal transplantation: Simplest is best. Transplantation 2013, 96, 885–889. [Google Scholar] [CrossRef]
- Yarlagadda, S.; Coca, S.; Garg, A.; Doshi, M.; Poggio, E.; Marcus, R.; Parikh, C. Marked variation in the definition and diagnosis of delayed graft function: A systemic review. Nephrol. Dial. Transplant. 2008, 23, 2995–3003. [Google Scholar] [CrossRef]
- Shin, J.; Koo, E.; Ha, S.; Park, J.; Jang, H.; Lee, J.; Park, J.; Kim, S.; Jung, S.; Kim, Y.; et al. The impact of slow graft function on graft outcome is comparable to delayed graft function in deceased donor kidney transplantation. Int. Urol. Nephrol. 2016, 48, 431–439. [Google Scholar] [CrossRef]
- Wang, C.; Tuffaha, A.; Phadnis, M.; Mahnken, J.; Wetmore, J. Association of slow graft function with long-term outcomes in kideny transplant recipients. Ann. Transplant. 2018, 23, 224–231. [Google Scholar] [CrossRef]
- Kashani, K.; Al-Khafaji, A.; Ardiles, T.; Artigas, A.; Bagshaw, S.; Bell, M.; Bihorac, A.; Birkhahn, R.; Cely, C.; Chawla, L.; et al. Discovery and validation of cell cycle arrest biomarkers in human acute kidney injury. Crit. Care 2013, 17, R25. [Google Scholar] [CrossRef]
- Bahl, D.; Haddad, Z.; Datoo, A.; Qazi, Y. Delayed graft function in kidney transplantation. Curr. Opin. Organ Transplant. 2019, 24, 82–86. [Google Scholar] [CrossRef]
- Melih, K.; Boynuegri, B.; Mustafa, C.; Nilgun, A. Incidence, risk factors, and outcomes of delayed graft function in deceased donor kidney transplantation. Transplant. Proc. 2019, 51, 1096–1100. [Google Scholar] [CrossRef]
- Weber, S.; Dienemann, T.; Jacobi, J.; Eckardt, K.; Weidemann, A. Delayed graft function is associated with an increased rate of renal allograft rejection: A retrospective single center analysis. PLoS ONE 2018, 13, e0199445. [Google Scholar] [CrossRef]
- Kim, G.; Park, T.; Choi, J.; Lim, J.; Jung, H.; Choi, J.; Park, S.; Kim, C.; Kim, Y.; Kim, H.; et al. Analysis of clinical outcomes according to the definition of slow graft function in deceased donor kidney transplantation. Transplant. Proc. 2019, 51, 2587–2592. [Google Scholar] [CrossRef]
- Novacescu, D.; Lactu, S.; Bardan, R.; Daminescu, L.; Cumpanas, A. Contemporary biomarkers for renal transplantation: A narrative overview. J. Pers. Med. 2023, 13, 1216. [Google Scholar] [CrossRef]
- Bienholz, A.; Walter, B.; Pless-Petig, G.; Guberina, H.; Kribben, A.; Witzke, O.; Rauen, U. Characterization of injury in isolated rat proximal tubules during cold incubation and rewarming. PLoS ONE 2017, 12, e0180553. [Google Scholar] [CrossRef]
- Schanz, M.; Shi, J.; Wasser, C.; Alscher, M.; Kimmel, M. Urinary [TIMP-2] × [IGFBP7] for risk prediction of acute kidney injury in decompensated heart failure. Clin. Cardiol. 2017, 40, 485–491. [Google Scholar] [CrossRef]
- Koyner, J.; Shaw, A.; Chawla, L.; Hoste, E.; Bihorac, A.; Kashani, K.; Haase, M.; Shi, J.; Kellum, J.; Investigators, S. Tissue inhibitor metalloproteinase-2 (TIMP-2)—IGF-Binding Protein-7 (IGFBP7) levels are associated with adverse long-term outcomes in patients with AKI. J. Am. Soc. Nephrol. 2015, 26, 1747–1754. [Google Scholar] [CrossRef]
- Meersch, M.; Schmidt, C.; Van Aken, H.; Rossaint, J.; Görlich, D.; Stege, D.; Malec, E.; Januszweska, K.; Zarbock, A. Validation of cell-cycle arrest biomarkers for acute kidney injury after pediatric cardiac surgery. PLoS ONE 2014, 9, e110865. [Google Scholar] [CrossRef]
- Fiorentino, M.; Xu, Z.; Smith, A.; Singbartl, K.; Palevsky, P.; Chawla, L.; Huang, D.; Yealy, D.; Angus, D.; Kellum, J. Serial measurememt of cell-cycle arrest biomarkers [TIMP-2]·[IGFBP7] and risk for progression to death, dialysis or severe acute kidney injury in patients with septic shock. Am. J. Respir. Crit. Care Med. 2020, 202, 1262–1270. [Google Scholar] [CrossRef]
- Pajenda, S.; Ilhan-Mutlu, A.; Preusser, M.; Roka, S.; Druml, W.; Wagner, L. NephroCheck data compared to serum creatinine in various clinical settings. BMC Nephrol. 2015, 16, 206. [Google Scholar] [CrossRef]
- Pianta, T.; Peake, P.; Pickering, J.; Kelleher, M.; Buckley, N.; Endre, Z. Evaluation of biomarkers of cell cycle arrest and inflammation in prediction of dialysis or recovery after kidney transplantation. Transpl. Int. 2015, 28, 1392–1404. [Google Scholar] [CrossRef]
- Bank, J.; Ruhaak, R.; Soonawala, D.; Mayboroda, O.; Romijn, F.; van Kooten, C.; Cobbaert, C.; de Fijter, J. Urinary TIMP-2 predicts the presence and duration of delayed graft function in donation after circulatory death kidney transplant recipients. Transplantation 2019, 103, 1014–1023. [Google Scholar] [CrossRef]
- Hahn, R.; Zdolsek, J. Nephrocheck® results should be corrected for dilution. Acta Anaesthesiol. Scand. 2017, 61, 261–262. [Google Scholar] [CrossRef]
- Noto, A.; Cortegiani, A.; David, A. NephroCheck: Should we consider urine osmolality? Crit. Care 2019, 23, 48. [Google Scholar] [CrossRef]
- Johnson, E.; Munoz, C.; Le Bellego, L.; Klein, A.; Casa, D.; Maresh, C.; Armstrong, L. Markers of hydration process during fluid volume modification in women with habitual high or low daily fluid intakes. Eur. J. Appl. Physiol. 2015, 115, 1067–1074. [Google Scholar] [CrossRef]
- Chowdhury, A.; Brinson, R.; Wei, B.; Stetler-Stevenson, W. Tissue inhibitor of metalloprotease-2 (TIMP-2): Bioprocess development, physicochemical, biochemical, and biological characterization of highly expressed recombinant protein. Biochemistry 2017, 56, 6423–6433. [Google Scholar] [CrossRef]
- Sharker, M.; Hossen, S.; Nou, I.; Kho, K. Characterization of insulin-like growth factor binding protein 7 (Igfbp7) and its potential involvement in shell formation and metamorphosis of pacific abalone, Haliotis discus hannai. Int. J. Mol. Sci. 2020, 21, 6529. [Google Scholar] [CrossRef]
- Oshvandi, K.; Kavyannejad, R.; Borzuo, S.; Gholyaf, M. High-flux and low-flux membranes: Efficacy in hemodialysis. Nurs. Midwifery Stud. 2014, 3, e21764. [Google Scholar] [CrossRef]
- Hoste, E.; McCullough, P.; Kashani, K.; Chawla, L.; Joannidis, M.; Shaw, A.; Feldkamp, T.; Uettwiller-Geiger, D.; McCarthy, P.; Shi, J.; et al. Derivation and validation of cutoffs for clinical use of cell cycle arrest biomarkers. Nephrol. Dial. Transplant. 2014, 29, 2054–2061. [Google Scholar] [CrossRef]
- Schmitt, F.; Salgado, E.; Friebe, J.; Schmoch, T.; Uhle, F.; Fleming, T.; Zemva, J.; Kihm, L.; Nusshag, C.; Morath, C.; et al. Cell cycle arrest and cell death correlate with the extent of ischaemia and reperfusion injury in patients following kidney transplantation—Results of an observational pilot study. Transpl. Int. 2018, 31, 751–760. [Google Scholar] [CrossRef]
- Yang, J.; Lim, S.; Kim, M.; Jung, C.; Cho, W.; Jo, S. Urinary tissue inhibitor of metalloproteinase and insulin-like growth factor-7 as early biomarkers of delayed graft function after kidney transplantation. Transplant. Proc. 2017, 49, 2050–2054. [Google Scholar] [CrossRef]
- Tillou, X.; Lee-Bion, A.; de Ligny, B.; Orczyk, C.; Le Gal, S.; Desmonts, A.; Bensadoun, H.; Doerfler, A. Does daily urine output really matter in renal transplantation? Ann. Transpl. 2013, 18, 716–720. [Google Scholar]
- Elnokeety, M.; Hussein, W.; Abdelrazek, S.; Momtaz, M. Cell cycle arrest biomarkers for the early detection of acute allograft dysfunction and acute rejection in living donor kidney transplantation: A cross-sectional study from Egypt. Korean J. Transplant. 2023, 37, 250–259. [Google Scholar] [CrossRef]
- Gallinat, A.; Amrillaeva, V.; Hoyer, D.; Kocabayoglu, P.; Benko, T.; Treckmann, J.; van Meel, M.; Samuel, U.; Minor, T.; Paul, A. Reconditioning by end-ischemic hypothermic in-house machine perfusion: A promising strategy to improve outcome in expanded criteria donors kidney transplantation. Clin. Transpl. 2017, 31, e12904. [Google Scholar] [CrossRef]
- Mao, Y.; Xu, D.; Liu, S.; Yan, J.; Liu, X.; Zhang, X.; Pan, W.; Tian, C. An analysis of the relationship between donor and recipient biomarkers and kidney graft function, dysfunction, and rejection. Transpl. Immunol. 2023, 81, 101934. [Google Scholar] [CrossRef]
- Arias-Cabrales, C. Impact of delayed graft function without dialysis needed (Poster 002). In Proceedings of the Meeting of The Transplant Society 2018, Madrid, Spain, 30 June–5 July 2018. [Google Scholar]


| Patient Population | DGF | SGF | IGF | ||
|---|---|---|---|---|---|
| (n = 186) | (n = 34) | (n = 43) | (n = 109) | p-Value | |
| recipient characteristics | |||||
| female, n (%) | 73 (39) | 14 (41) | 14 (33) | 45 (41) | ns |
| renal re-transplants, n (%) | 32 (17) | 6 (18) | 5 (12) | 21 (19) | ns |
| Age [years], median (range) | 55 (18–78) | 56 (25–70) | 58 (30–74) | 51 (18–78) | 0.011 |
| BMI [kg/m2], median (range) | 25 (17–43) | 28 (19–38) | 26 (21–43) | 24 (17–41) | <0.001 |
| Dialysis vintage [in months], median (range) | 32 (0–184) | 45 (2–139) | 38 (0–125) | 20 (0–184) | <0.001 |
| PRA [%], median (range) | 8 (0–100) | 13 (0–100) | 11 (0–100) | 6 (0–100) | ns |
| PRA 0–5%, n (%) | 156 (84) | 27 (79) | 34 (79) | 95 (87) | ns |
| PRA 5–20%, n (%) | 9 (5) | 0 | 4 (9) | 5 (5) | ns |
| PRA > 20%, n (%) | 21 (11) | 7 (21) | 5 (12) | 9 (8) | ns |
| cause for CKD | |||||
| diabetic nephropathy, n (%) | 16 (9) | 5 (15) | 5 (12) | 6 (6) | ns |
| vascular nephropathy, n (%) | 12 (6) | 1 (4) | 3 (7) | 8 (7) | ns |
| ADPKD, n (%) | 39 (21) | 9 (26) | 8 (19) | 22 (20) | ns |
| glomerulonephritis, n (%) | 68 (36) | 10 (29) | 18 (42) | 40 (37) | ns |
| aHUS, n (%) | 5 (3) | 0 | 2 (4) | 3 (3) | ns |
| others, n (%) | 46 (25) | 9 (26) | 7 (16) | 30 (28) | ns |
| Initial immunosuppressive therapy | |||||
| IL-2 Receptor antagonist, n (%) | 181 (97) | 34 (100) | 41 (95) | 106 (97) | ns |
| ATG, n (%) | 5 (3) | 0 | 2 (5) | 3 (3) | ns |
| Cyclosporin A, n (%) | 64 (34) | 13 (38) | 6 (14) | 45 (41) | 0.005 |
| Tacrolimus, n (%) | 122 (66) | 21 (62) | 37 (86) | 64 (59) | 0.005 |
| Azathioprin, n (%) | 3 (2) | 0 | 1 (2) | 2 (2) | ns |
| Mycophenol mofetil/-acid, n (%) | 175 (94) | 33 (97) | 41 (95) | 101 (93) | ns |
| Everolimus, n (%) | 8 (4) | 1 (3) | 1 (2) | 6 (6) | ns |
| Steroids, n (%) | 186 (100) | ns | |||
| donor characteristics | |||||
| living donation, n (%) | 48 (26) | 3 (9) | 2 (5) | 43 (39) | <0.001 |
| female, n (%) | 102 (55) | 19 (56) | 20 (47) | 63 (58) | ns |
| Age [years], median (range) | 54 (0–86) | 54 (22–78) | 61 (8–86) | 53 (0–85) | 0.018 |
| CIT [hours], median (range) | 8.9 (0.8–29.2) | 12.3 (2.6–29.2) | 13.9 (2.7–21.8) | 6.3 (0.8–24.3) | <0.001 |
| CIT < 10 h, n (%) | 99 (53) | 12 (35) | 13 (30) | 74 (68) | <0.001 |
| CIT >10 h, n (%) | 87 (47) | 22(65) | 30 (70) | 35 (32) | <0.001 |
| [TIMP-2] × [IGFBP7] Cut-Off [(ng/mL)2/1000] | Sensitivity | Specificity | Positive Predictive Value | Negative Predictive Value |
|---|---|---|---|---|
| Post-transplant Day 1 | ||||
| 0.3 | 58% | 81% | 93% | 29% |
| 0.9 | 87% | 71% | 93% | 54% |
| 2.0 | 93% | 45% | 89% | 58% |
| Post-transplant Day 2 | ||||
| 0.3 | 58% | 81% | 93% | 29% |
| 0.9 | 85% | 63% | 91% | 47% |
| 1.9 | 94% | 53% | 90% | 65% |
| 2.0 | 94% | 50% | 90% | 64% |
Disclaimer/Publisher’s Note: The statements, opinions and data contained in all publications are solely those of the individual author(s) and contributor(s) and not of MDPI and/or the editor(s). MDPI and/or the editor(s) disclaim responsibility for any injury to people or property resulting from any ideas, methods, instructions or products referred to in the content. |
© 2024 by the authors. Licensee MDPI, Basel, Switzerland. This article is an open access article distributed under the terms and conditions of the Creative Commons Attribution (CC BY) license (https://creativecommons.org/licenses/by/4.0/).
Share and Cite
Gäckler, A.; Ertasoglu, O.; Rohn, H.; Friebus-Kardash, J.; Ickerott, P.-C.; Witzke, O.; Kribben, A.; Vogt, B.; Dahdal, S.; Arampatzis, S.; et al. Urinary Biomarkers for Cell Cycle Arrest TIMP-2 and IGFBP7 for Prediction of Graft Function Recovery after Kidney Transplantation. Int. J. Mol. Sci. 2024, 25, 4169. https://doi.org/10.3390/ijms25084169
Gäckler A, Ertasoglu O, Rohn H, Friebus-Kardash J, Ickerott P-C, Witzke O, Kribben A, Vogt B, Dahdal S, Arampatzis S, et al. Urinary Biomarkers for Cell Cycle Arrest TIMP-2 and IGFBP7 for Prediction of Graft Function Recovery after Kidney Transplantation. International Journal of Molecular Sciences. 2024; 25(8):4169. https://doi.org/10.3390/ijms25084169
Chicago/Turabian StyleGäckler, Anja, Onurcan Ertasoglu, Hana Rohn, Justa Friebus-Kardash, Philipp-Christopher Ickerott, Oliver Witzke, Andreas Kribben, Bruno Vogt, Suzan Dahdal, Spyridon Arampatzis, and et al. 2024. "Urinary Biomarkers for Cell Cycle Arrest TIMP-2 and IGFBP7 for Prediction of Graft Function Recovery after Kidney Transplantation" International Journal of Molecular Sciences 25, no. 8: 4169. https://doi.org/10.3390/ijms25084169
APA StyleGäckler, A., Ertasoglu, O., Rohn, H., Friebus-Kardash, J., Ickerott, P.-C., Witzke, O., Kribben, A., Vogt, B., Dahdal, S., Arampatzis, S., & Eisenberger, U. (2024). Urinary Biomarkers for Cell Cycle Arrest TIMP-2 and IGFBP7 for Prediction of Graft Function Recovery after Kidney Transplantation. International Journal of Molecular Sciences, 25(8), 4169. https://doi.org/10.3390/ijms25084169