

Machine Learning Gene Signature to Metastatic ccRCC Based on ceRNA Network


Abstract
1. Introduction
2. Results
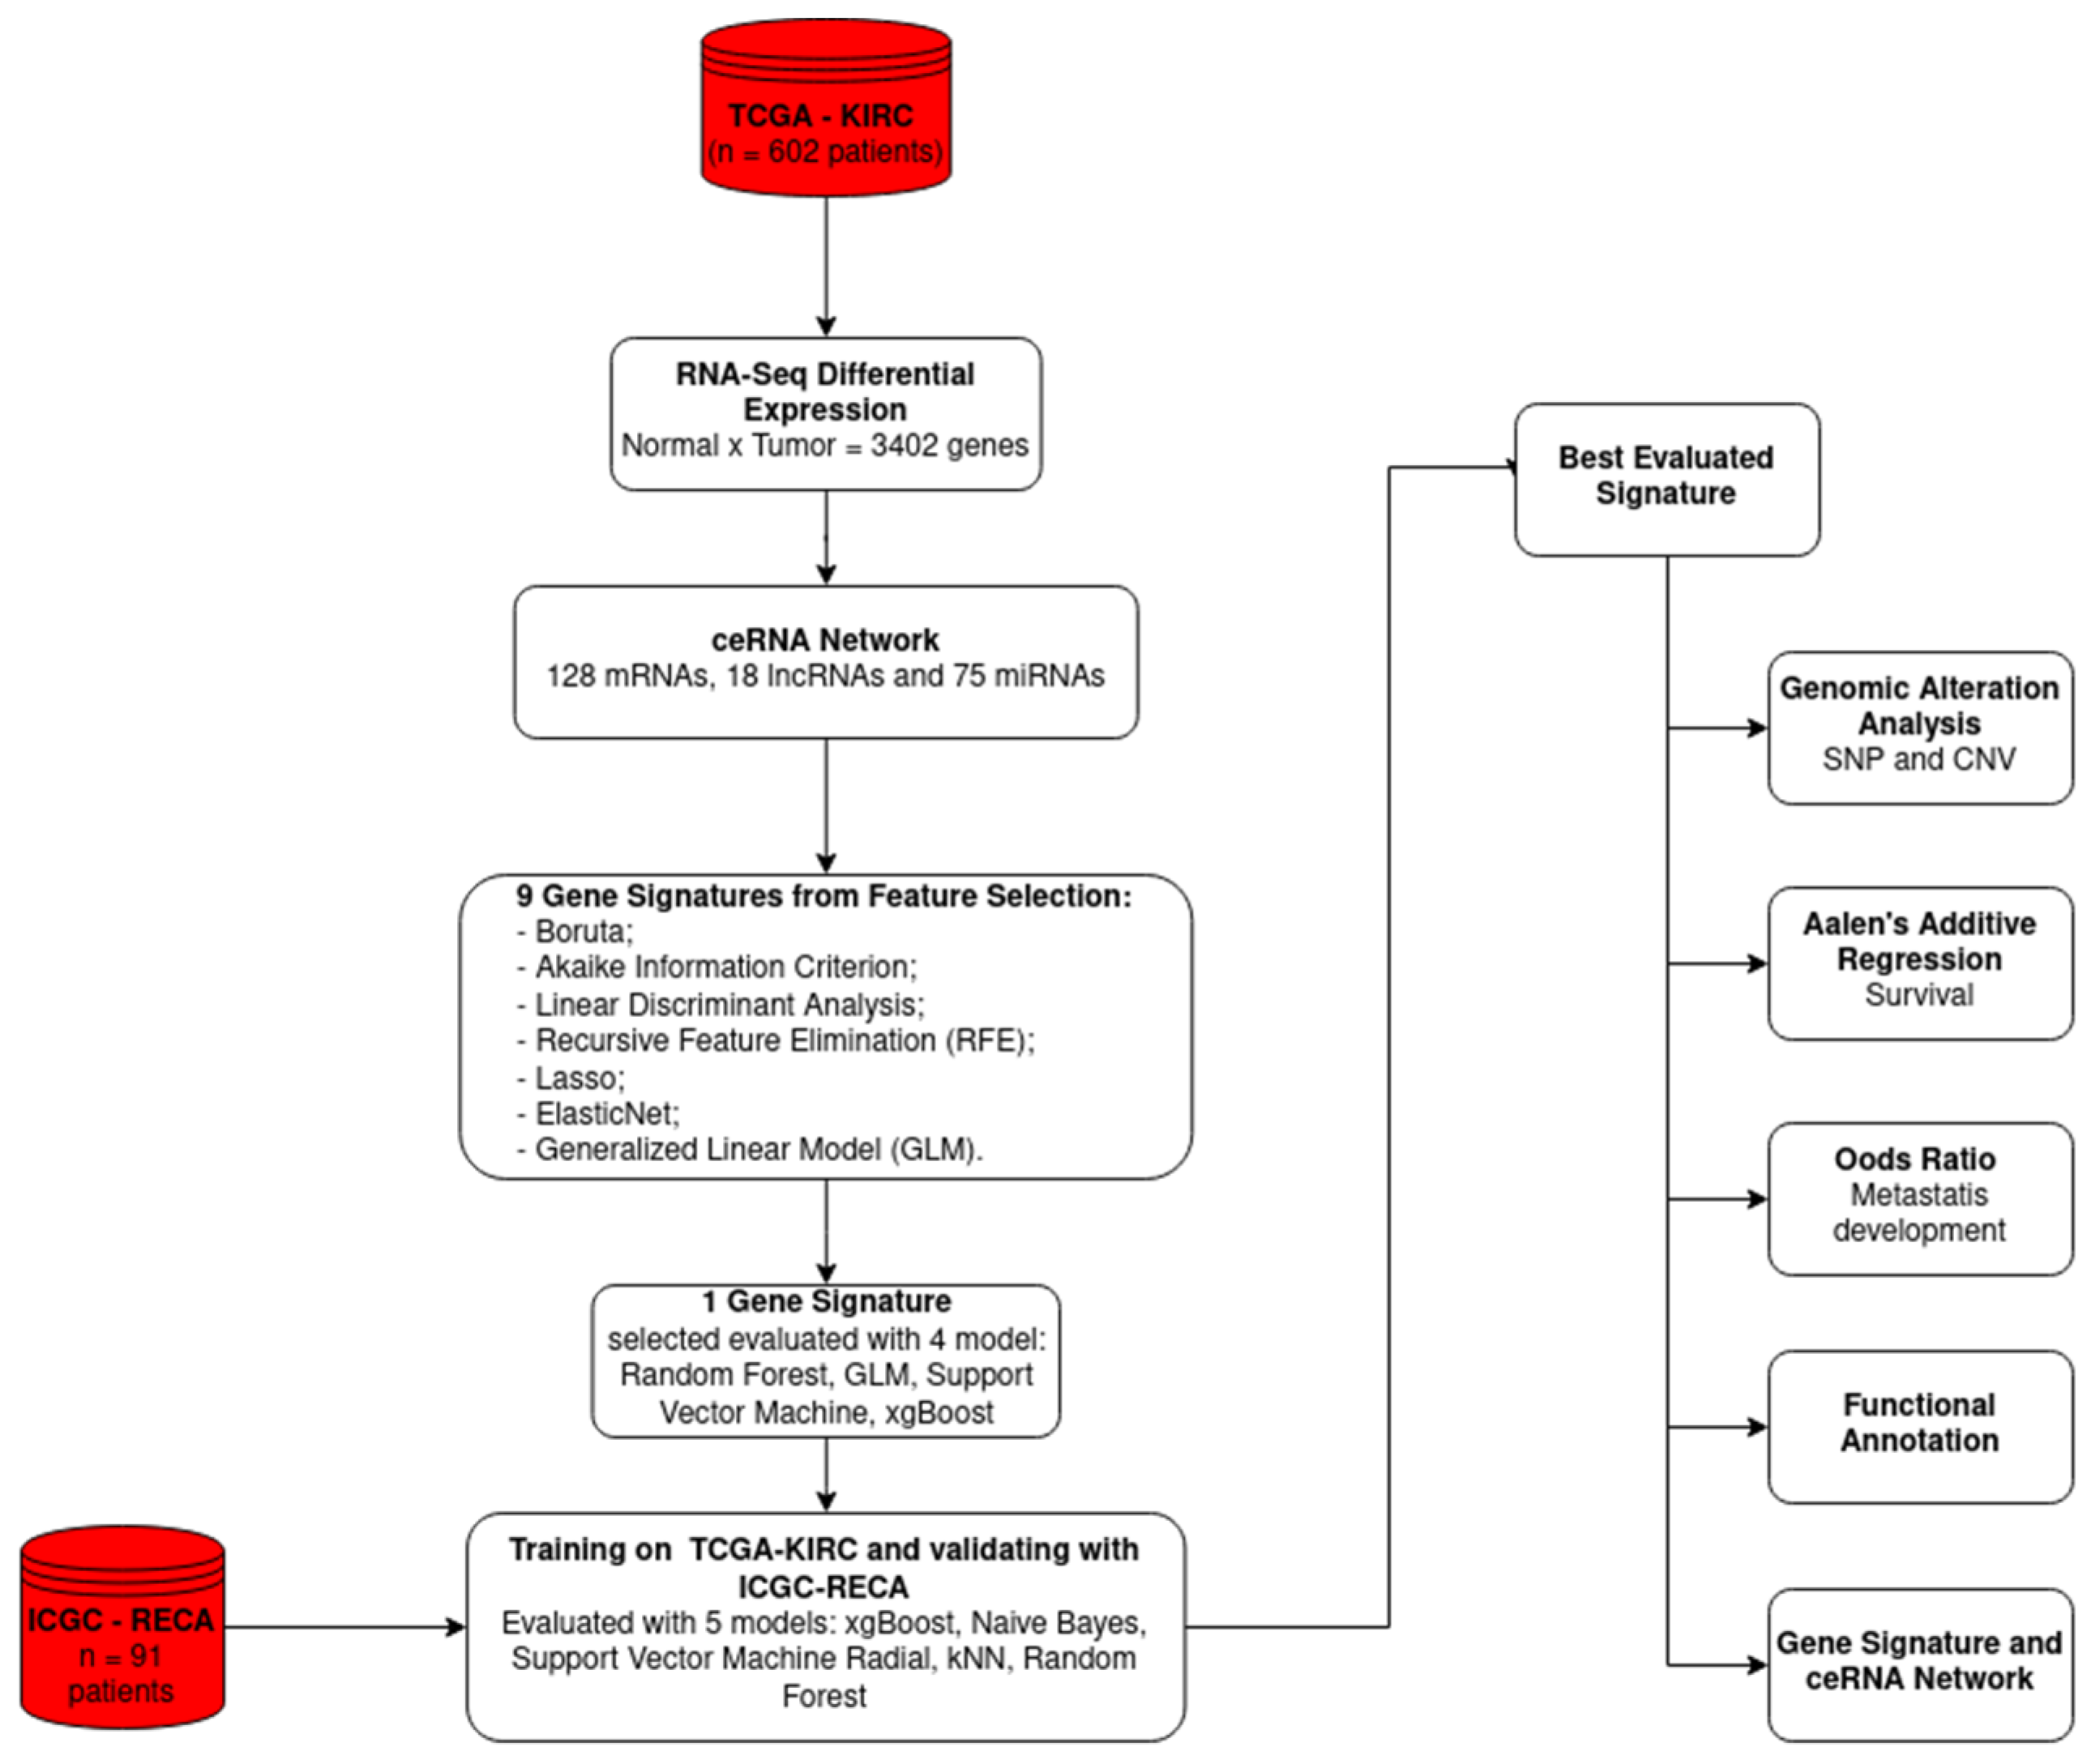
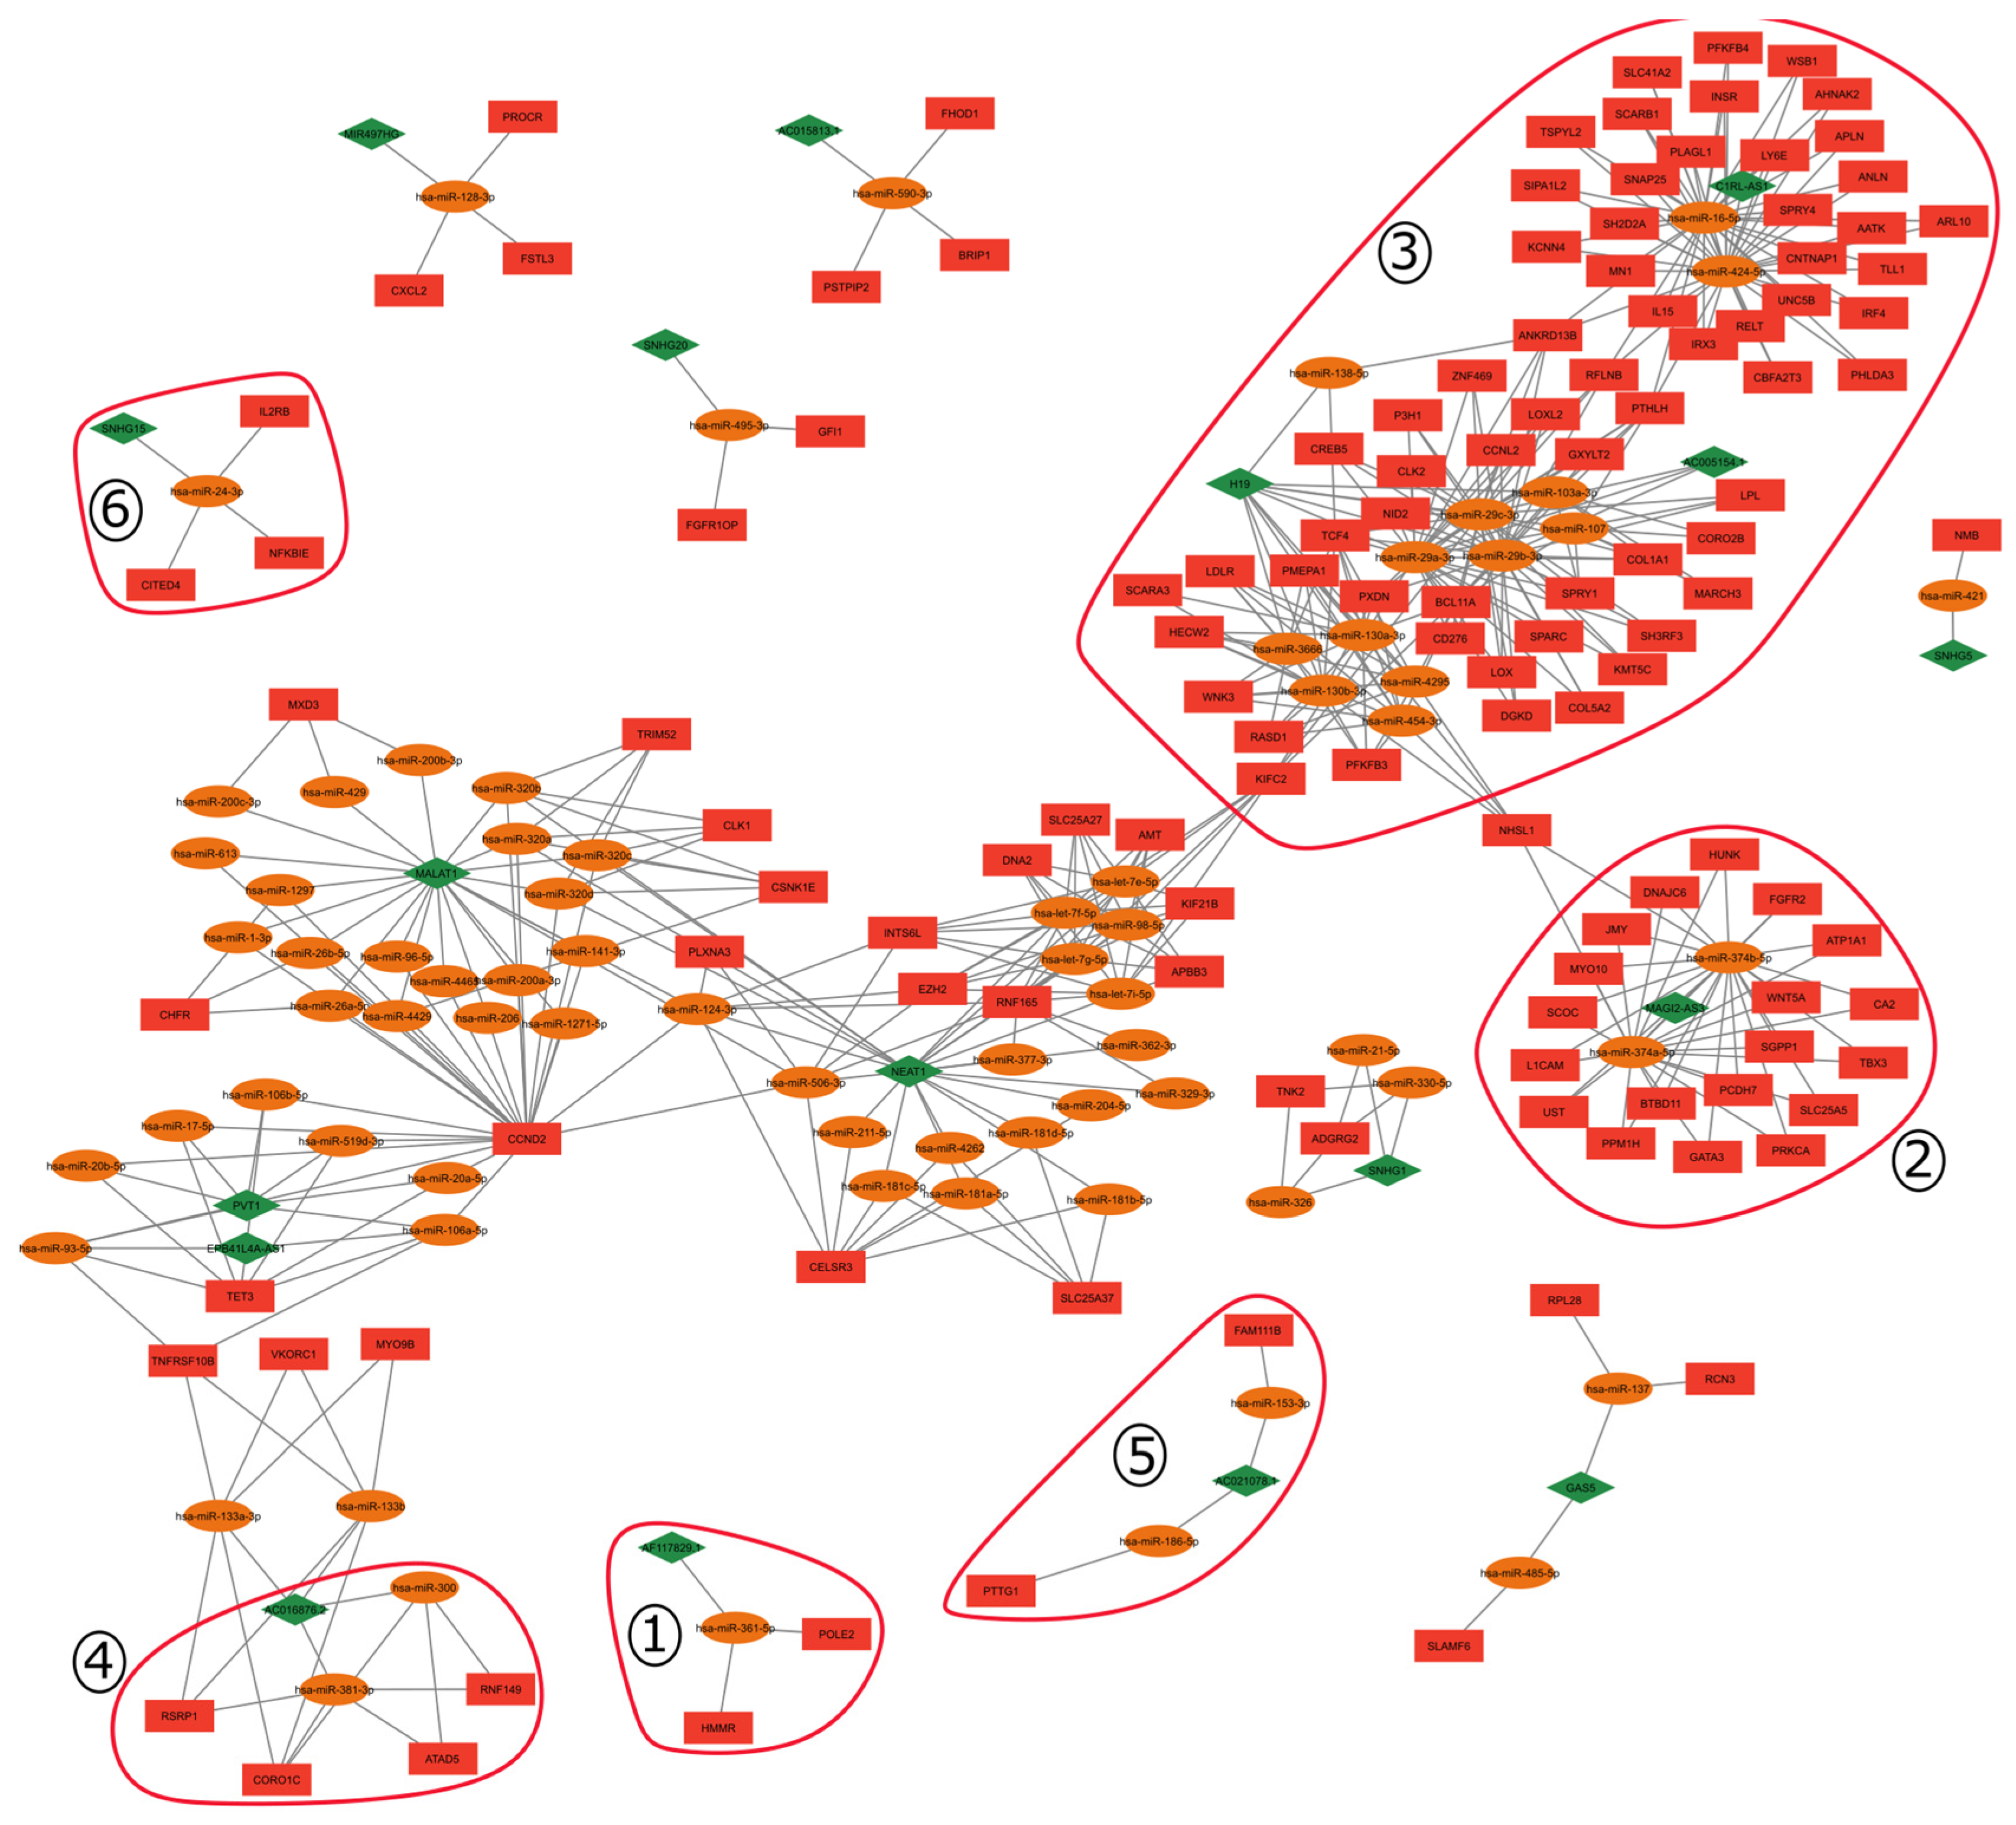
2.1. ceRNA Network
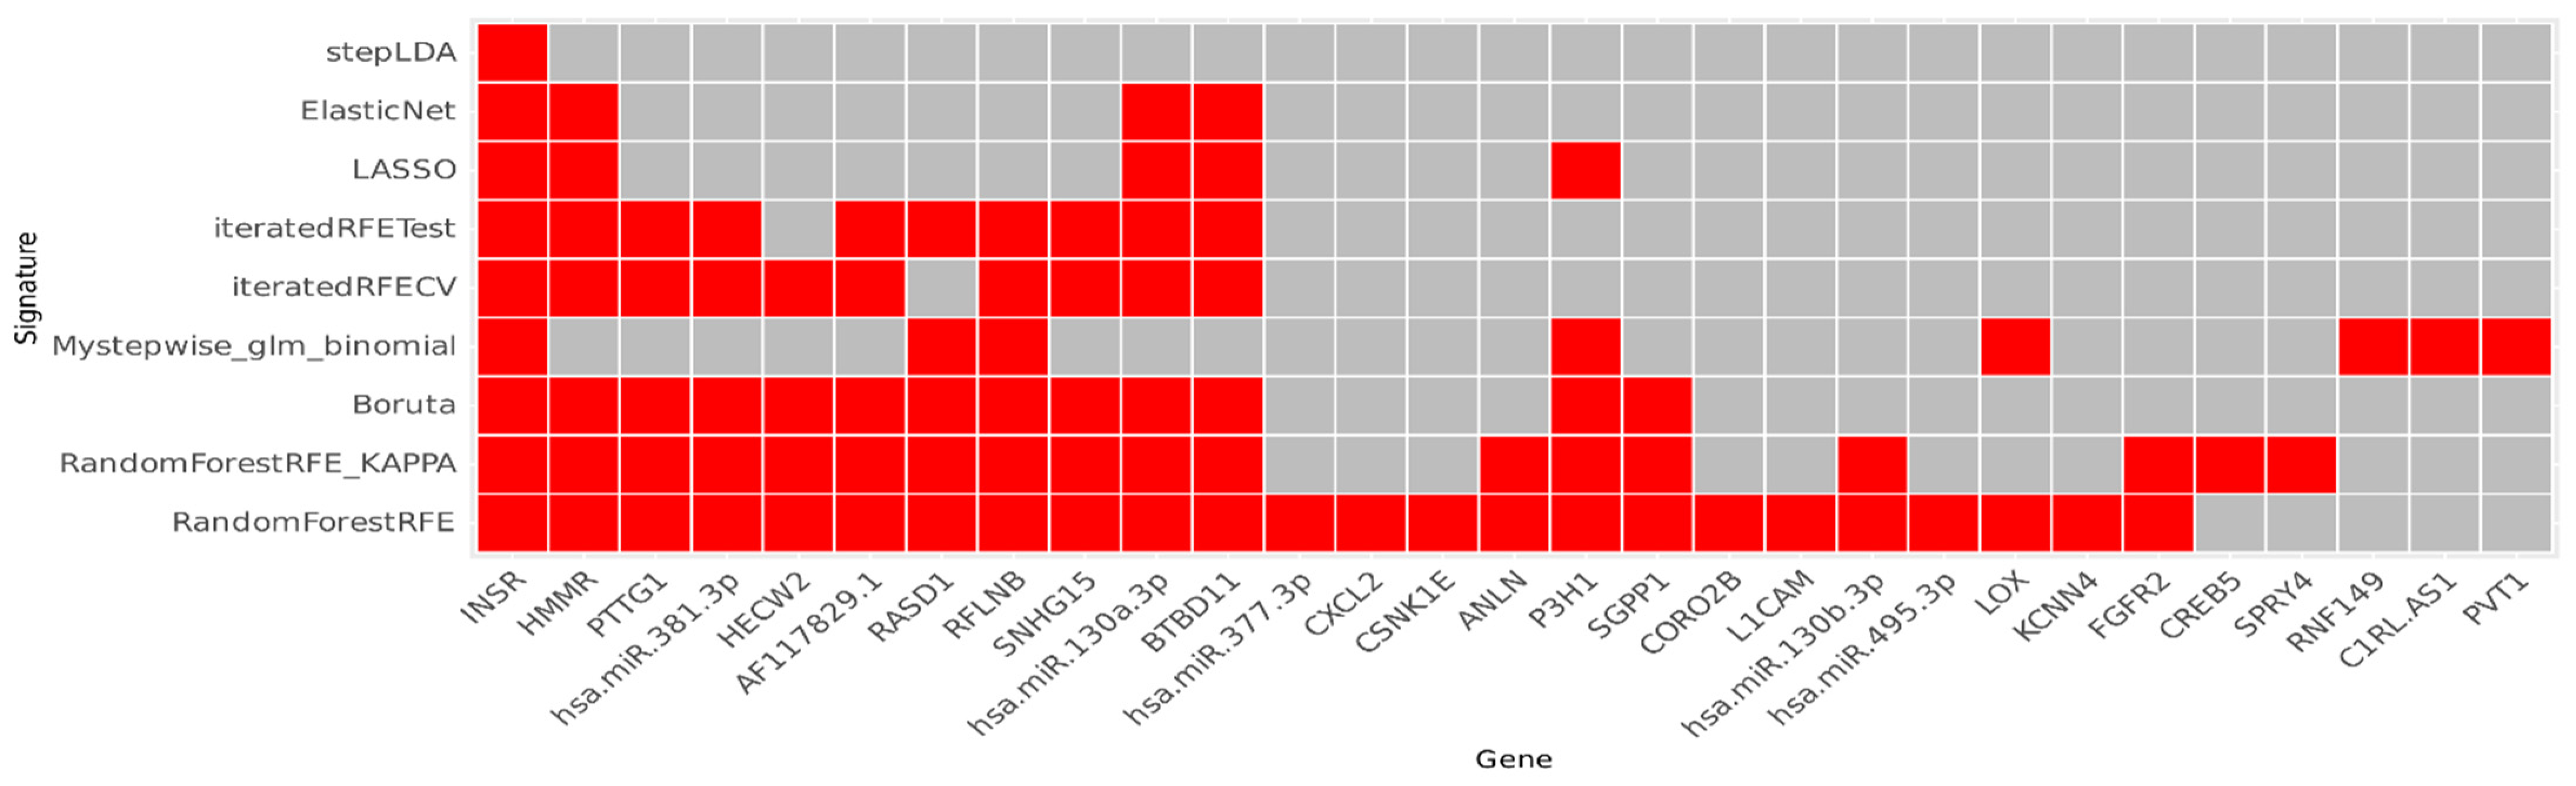
2.2. Feature Selection
2.3. Integrative Analysis of the Transcriptional Signature Components
2.3.1. Genomic Alteration Analysis
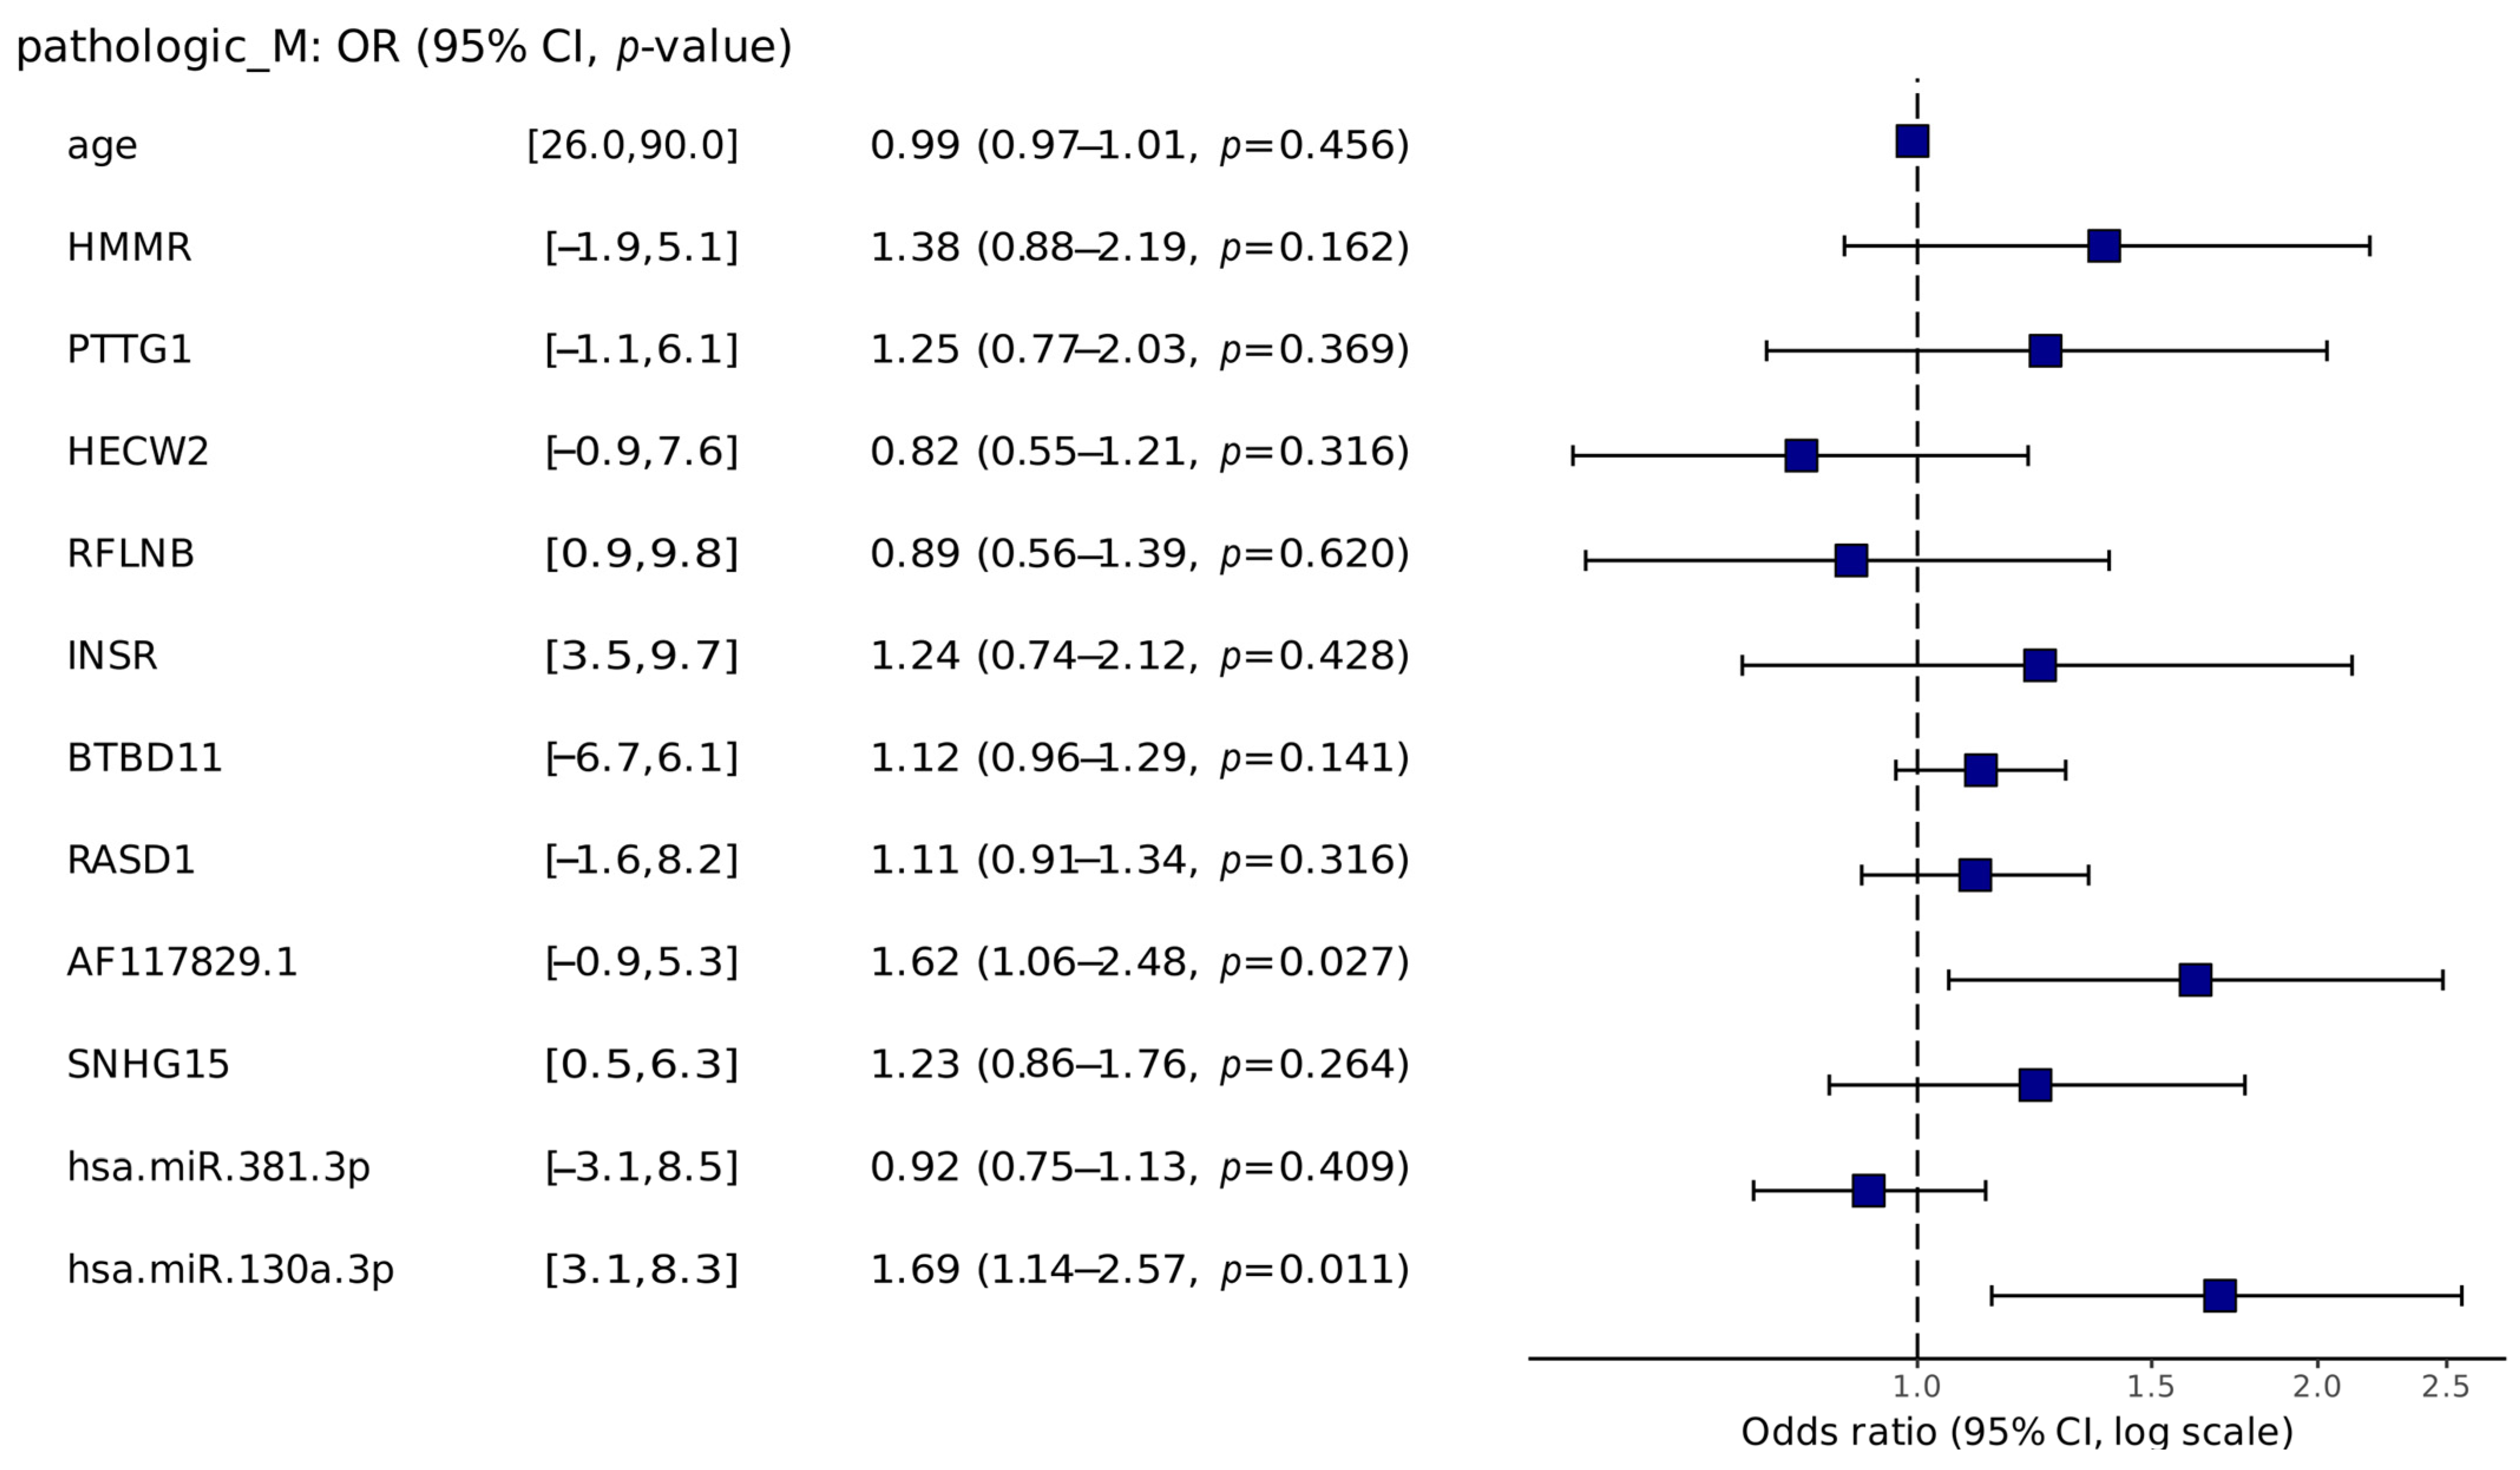
2.3.2. Risk Analysis
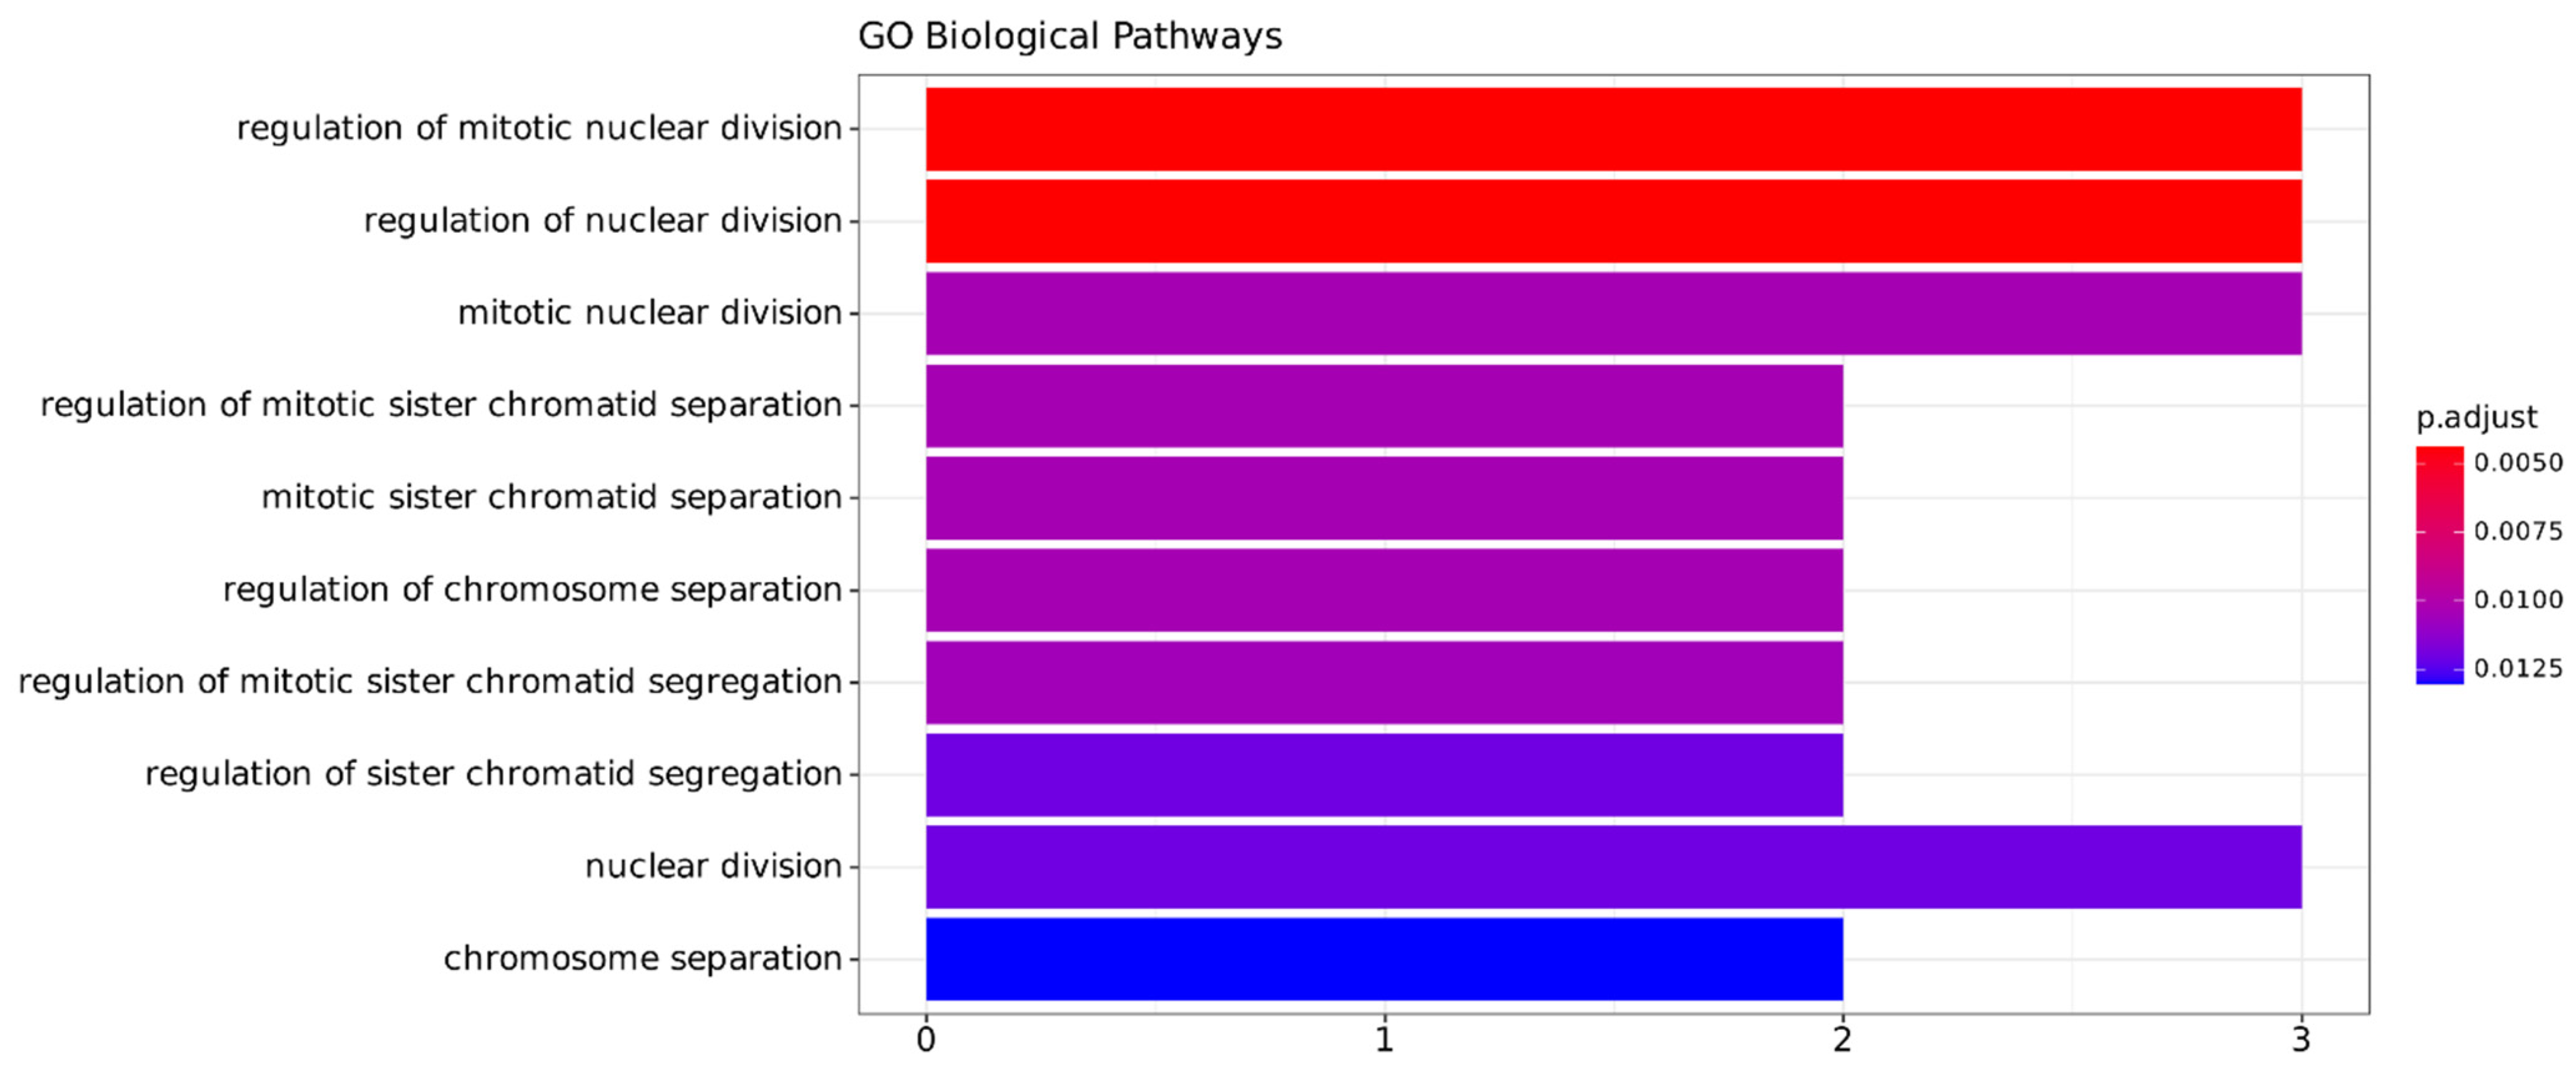
2.3.3. Functional Annotation Analysis
2.4. Gene Signature and ceRNA Network
3. Discussion
3.1. Gene Signature
3.2. Validation and Biological Interpretation
3.2.1. Genomic and Functional Alterations
3.2.2. Gene Cluster Analysis
4. Materials and Methods
4.1. Data
4.2. ceRNA Network Construction
4.3. Dataset Construction, Feature Selection, and Gene Signature Construction
4.4. Somatic and Copy Number Alteration Analysis
4.5. Risk Analysis
4.6. Functional Annotation Analysis
4.7. Development
5. Conclusions
Supplementary Materials
Author Contributions
Funding
Institutional Review Board Statement
Informed Consent Statement
Data Availability Statement
Acknowledgments
Conflicts of Interest
References
- Dall’Oglio, M.; Srougi, M.; Nesrallah, L. Câncer de Rim. In Tratado de Clínica Médica, 2nd ed.; Roca: Rio de Janeiro, Brazil, 2006; pp. 3264–3273. [Google Scholar]
- Vinay, K.; Aster, J.C.; Abbas, A.K. Robbins & Cotran: Patologia: Bases Patológicas das Doenças; Elsevier: Amsterdam, The Netherlands, 2011. [Google Scholar]
- Muglia, V.F.; Prando, A. Renal cell carcinoma: Histological classification and correlation with imaging findings. Radiol. Bras. 2015, 48, 166–174. [Google Scholar] [CrossRef] [PubMed]
- NFK. Renal Carcinoma Guidelines; NFK—National Kidney Fundation: New York, NY, USA, 2017. [Google Scholar]
- Wang, Y.; Li, Z.; Li, W.; Zhou, L.; Jiang, Y. Prognostic significance of long non-coding RNAs in clear cell renal cell carcinoma: A meta-analysis. Medicine 2019, 98, e17276. [Google Scholar] [CrossRef] [PubMed]
- Cui, H.; Shan, H.; Miao, M.Z.; Jiang, Z.; Meng, Y.; Chen, R.; Zhang, L.; Liu, Y. Identification of the key genes and pathways involved in the tumorigenesis and prognosis of kidney renal clear cell carcinoma. Sci. Rep. 2020, 10, 4271. [Google Scholar] [CrossRef] [PubMed]
- The Cancer Genome Atlas Research Network. Comprehensive molecular characterization of clear cell renal cell carcinoma. Nature 2013, 499, 43–49. [Google Scholar] [CrossRef] [PubMed]
- Klinge, C.M. Non-coding RNAs: Long non-coding RNAs and microRNAs in endocrine-related cancers. Endocr. Relat. Cancer 2018, 25, R259–R282. [Google Scholar] [CrossRef] [PubMed]
- Kazimierczyk, M.; Kasprowicz, M.K.; Kasprzyk, M.E.; Wrzesinski, J. Human Long Noncoding RNA Interactome: Detection, Characterization and Function. Int. J. Mol. Sci. 2020, 21, 1027. [Google Scholar] [CrossRef] [PubMed]
- Statello, L.; Guo, C.-J.; Chen, L.-L.; Huarte, M. Gene regulation by long non-coding RNAs and its biological functions. Nat. Rev. Mol. Cell Biol. 2021, 22, 96–118. [Google Scholar] [CrossRef]
- Morris, K.V.; Mattick, J.S. The rise of regulatory RNA. Nat. Rev. Genet. 2014, 15, 423–437. [Google Scholar] [CrossRef]
- Yao, R.-W.; Wang, Y.; Chen, L.-L. Cellular functions of long noncoding RNAs. Nat. Cell Biol. 2019, 21, 542–551. [Google Scholar] [CrossRef]
- Schmitz, S.U.; Grote, P.; Herrmann, B.G. Mechanisms of long noncoding RNA function in development and disease. Cell. Mol. Life Sci. 2016, 73, 2491–2509. [Google Scholar] [CrossRef]
- Wang, P.-S.; Wang, Z.; Yang, C. Dysregulations of long non-coding RNAs—The emerging “lnc” in environmental carcinogenesis. Semin. Cancer Biol. 2021, 76, 163–172. [Google Scholar] [CrossRef] [PubMed]
- Chiu, H.-S.; Somvanshi, S.; Patel, E.; Chen, T.-W.; Singh, V.P.; Zorman, B.; Patil, S.L.; Pan, Y.; Chatterjee, S.S.; Sood, A.K.; et al. Pan-Cancer Analysis of lncRNA Regulation Supports Their Targeting of Cancer Genes in Each Tumor Context. Cell Rep. 2018, 23, 297–312.e12. [Google Scholar] [CrossRef] [PubMed]
- Salmena, L.; Poliseno, L.; Tay, Y.; Kats, L.; Pandolfi, P.P. A ceRNA Hypothesis: The Rosetta Stone of a Hidden RNA Language? Cell 2011, 146, 353–358. [Google Scholar] [CrossRef] [PubMed]
- Qi, X.; Lin, Y.; Chen, J.; Shen, B. Decoding competing endogenous RNA networks for cancer biomarker discovery. Brief. Bioinform. 2020, 21, 441–457. [Google Scholar] [CrossRef] [PubMed]
- Chan, J.; Tay, Y. Noncoding RNA: RNA Regulatory Networks in Cancer. Int. J. Mol. Sci. 2018, 19, 1310. [Google Scholar] [CrossRef] [PubMed]
- Bhan, A.; Soleimani, M.; Mandal, S.S. Long Noncoding RNA and Cancer: A New Paradigm. Cancer Res. 2017, 77, 3965–3981. [Google Scholar] [CrossRef] [PubMed]
- Liu, S.J.; Dang, H.X.; Lim, D.A.; Feng, F.Y.; Maher, C.A. Long noncoding RNAs in cancer metastasis. Nat. Rev. Cancer 2021, 21, 446–460. [Google Scholar] [CrossRef] [PubMed]
- Subramanian, I.; Verma, S.; Kumar, S.; Jere, A.; Anamika, K. Multi-omics Data Integration, Interpretation, and Its Application. Bioinform. Biol. Insights 2020, 14, 117793221989905. [Google Scholar] [CrossRef]
- Reel, P.S.; Reel, S.; Pearson, E.; Trucco, E.; Jefferson, E. Using machine learning approaches for multi-omics data analysis: A review. Biotechnol. Adv. 2021, 49, 107739. [Google Scholar] [CrossRef]
- Black, J.E.; Kueper, J.K.; Williamson, T.S. An introduction to machine learning for classification and prediction. Fam. Pract. 2023, 40, 200–204. [Google Scholar] [CrossRef]
- Andrade, D.S.; Terrematte, P.; Rennó-Costa, C.; Zilberberg, A.; Efroni, S. GENTLE: A novel bioinformatics tool for generating features and building classifiers from T cell repertoire cancer data. BMC Bioinform. 2023, 24, 32. [Google Scholar] [CrossRef] [PubMed]
- Kann, B.H.; Hosny, A.; Aerts, H.J.W.L. Artificial intelligence for clinical oncology. Cancer Cell. 2021, 39, 916–927. [Google Scholar] [CrossRef] [PubMed]
- Liu, H.; Motoda, H. (Eds.) Computational Methods of Feature Selection; Chapman & Hall/CRC: Boca Raton, FL, USA, 2008. [Google Scholar]
- Zhou, L.; Ye, J.; Wen, F.; Yu, H. Identification of Novel Prognostic Signatures for Clear Cell Renal Cell Carcinoma Based on ceRNA Network Construction and Immune Infiltration Analysis. Dis. Markers 2022, 2022, 4033583. [Google Scholar] [CrossRef] [PubMed]
- Zhang, Y.; Dai, J.; Huang, W.; Chen, Q.; Chen, W.; He, Q.; Chen, F.; Zhang, P. Identification of a competing endogenous RNA network related to immune signature in clear cell renal cell carcinoma. Aging 2021, 13, 25980–26002. [Google Scholar] [CrossRef] [PubMed]
- Yu, J.; Mao, W.; Sun, S.; Hu, Q.; Wang, C.; Xu, Z.; Liu, R.; Chen, S.; Xu, B.; Chen, M. Identification of an m6A-Related lncRNA Signature for Predicting the Prognosis in Patients with Kidney Renal Clear Cell Carcinoma. Front. Oncol. 2021, 11, 663263. [Google Scholar] [CrossRef] [PubMed]
- Yin, H.; Wang, X.; Zhang, X.; Wang, Y.; Zeng, Y.; Xiong, Y.; Li, T.; Lin, R.; Zhou, Q.; Ling, H.; et al. Integrated analysis of long noncoding RNA associated-competing endogenous RNA as prognostic biomarkers in clear cell renal carcinoma. Cancer Sci. 2018, 109, 3336–3349. [Google Scholar] [CrossRef] [PubMed]
- Wang, Y.; Sun, Z.; Lu, S.; Zhang, X.; Xiao, C.; Li, T.; Wu, J. Identification of PLAUR-related ceRNA and immune prognostic signature for kidney renal clear cell carcinoma. Front. Oncol. 2022, 12, 834524. [Google Scholar] [CrossRef]
- Sun, P.; Xu, H.; Zhu, K.; Li, M.; Han, R.; Shen, J.; Xia, X.; Chen, X.; Fei, G.; Zhou, S.; et al. The cuproptosis related genes signature predicts the prognosis and correlates with the immune status of clear cell renal cell carcinoma. Front. Genet. 2022, 13, 1061382. [Google Scholar] [CrossRef]
- Song, J.; Peng, J.; Zhu, C.; Bai, G.; Liu, Y.; Zhu, J.; Liu, J. Identification and Validation of Two Novel Prognostic lncRNAs in Kidney Renal Clear Cell Carcinoma. Cell Physiol. Biochem. 2018, 48, 2549–2562. [Google Scholar] [CrossRef]
- Quan, J.; Huang, B. Identification and validation of the molecular subtype and prognostic signature for clear cell renal cell carcinoma based on neutrophil extracellular traps. Front. Cell Dev. Biol. 2022, 10, 1021690. [Google Scholar] [CrossRef]
- Peng, Y.; Wu, S.; Xu, Z.; Hou, D.; Li, N.; Zhang, Z.; Wang, L.; Wang, H. A prognostic nomogram based on competing endogenous RNA network for clear-cell renal cell carcinoma. Cancer Med. 2021, 10, 5499–5512. [Google Scholar] [CrossRef]
- Lin, G.; Wang, H.; Wu, Y.; Wang, K.; Li, G. Hub Long Noncoding RNAs with m6A Modification for Signatures and Prognostic Values in Kidney Renal Clear Cell Carcinoma. Front. Mol. Biosci. 2021, 8, 682471. [Google Scholar] [CrossRef] [PubMed]
- Broido, A.D.; Clauset, A. Scale-free networks are rare. Nat. Commun. 2019, 10, 1017. [Google Scholar] [CrossRef] [PubMed]
- Clauset, A.; Shalizi, C.R.; Newman, M.E.J. Power-law distributions in empirical data. arXiv 2007, arXiv:0706.1062. [Google Scholar] [CrossRef]
- Landis, J.R.; Koch, G.G. The measurement of observer agreement for categorical data. Biometrics 1977, 33, 159–174. [Google Scholar] [CrossRef] [PubMed]
- Bendavid, A. Comparison of classification accuracy using Cohen’s Weighted Kappa. Expert Syst. Appl. 2008, 34, 825–832. [Google Scholar] [CrossRef]
- Youden, W.J. Index for rating diagnostic tests. Cancer 1950, 3, 32–35. [Google Scholar] [CrossRef] [PubMed]
- Ho, S.Y.; Phua, K.; Wong, L.; Bin Goh, W.W. Extensions of the External Validation for Checking Learned Model Interpretability and Generalizability. Patterns 2020, 1, 100129. [Google Scholar] [CrossRef]
- Hicks, S.A.; Strümke, I.; Thambawita, V.; Hammou, M.; Riegler, M.A.; Halvorsen, P.; Parasa, S. On evaluation metrics for medical applications of artificial intelligence. Sci. Rep. 2022, 12, 5979. [Google Scholar] [CrossRef]
- Zhu, J.; Luo, Y.; Zhao, Y.; Kong, Y.; Zheng, H.; Li, Y.; Gao, B.; Ai, L.; Huang, H.; Huang, J.; et al. circEHBP1 promotes lymphangiogenesis and lymphatic metastasis of bladder cancer via miR-130a-3p/TGFβR1/VEGF-D signaling. Mol. Ther. 2021, 29, 1838–1852. [Google Scholar] [CrossRef]
- Chen, J.; Yan, D.; Wu, W.; Zhu, J.; Ye, W.; Shu, Q. MicroRNA-130a promotes the metastasis and epithelial-mesenchymal transition of osteosarcoma by targeting PTEN. Oncol. Rep. 2016, 35, 3285–3292. [Google Scholar] [CrossRef] [PubMed]
- Li, B.; Huang, P.; Qiu, J.; Liao, Y.; Hong, J.; Yuan, Y. MicroRNA-130a is down-regulated in hepatocellular carcinoma and associates with poor prognosis. Med. Oncol. 2014, 31, 230. [Google Scholar] [CrossRef] [PubMed]
- Stückrath, I.; Rack, B.; Janni, W.; Jäger, B.; Pantel, K.; Schwarzenbach, H. Aberrant plasma levels of circulating miR-16, miR-107, miR-130a and miR-146a are associated with lymph node metastasis and receptor status of breast cancer patients. Oncotarget 2015, 6, 13387–13401. [Google Scholar] [CrossRef] [PubMed]
- Ma, F.; Xie, Y.; Lei, Y.; Kuang, Z.; Liu, X. The microRNA-130a-5p/RUNX2/STK32A network modulates tumor invasive and metastatic potential in non-small cell lung cancer. BMC Cancer 2020, 20, 580. [Google Scholar] [CrossRef] [PubMed]
- Xu, C.-H.; Xiao, L.-M.; Liu, Y.; Chen, L.-K.; Zheng, S.-Y.; Zeng, E.-M.; Li, D.-. H. The lncRNA HOXA11-AS promotes glioma cell growth and metastasis by targeting miR-130a-5p/HMGB2. Eur. Rev. Med. Pharmacol. Sci. 2019, 23, 241–252. [Google Scholar] [PubMed]
- Schier, A.C.; Taatjes, D.J. Structure and mechanism of the RNA polymerase II transcription machinery. Genes Dev. 2020, 34, 465–488. [Google Scholar] [CrossRef] [PubMed]
- Hardwick, C.; Hoare, K.; Owens, R.; Hohn, H.; Hook, M.; Moore, D.; Cripps, V.; Austen, L.; Nance, D.; Turley, E. Molecular cloning of a novel hyaluronan receptor that mediates tumor cell motility. J. Cell Biol. 1992, 117, 1343–1350. [Google Scholar] [CrossRef]
- Yang, M.; Chen, B.; Kong, L.; Chen, X.; Ouyang, Y.; Bai, J.; Yu, D.; Zhang, H.; Li, X.; Zhang, D. HMMR promotes peritoneal implantation of gastric cancer by increasing cell-cell interactions. Discov. Oncol. 2022, 13, 81. [Google Scholar] [CrossRef]
- Li, Y.; Deng, L.; Pan, X.; Liu, C.; Fu, R. The Role of lncRNA AF117829.1 in the Immunological Pathogenesis of Severe Aplastic Anaemia. Oxidative Med. Cell. Longev. 2021, 2021, 5587921. [Google Scholar] [CrossRef]
- Xia, F.; Yan, Y.; Shen, C. A Prognostic Pyroptosis-Related lncRNAs Risk Model Correlates With the Immune Microenvironment in Colon Adenocarcinoma. Front. Cell Dev. Biol. 2021, 9, 811734. [Google Scholar] [CrossRef]
- Filho, G.S.; Caballé-Serrano, J.; Sawada, K.; Bosshardt, D.D.; Bianchini, M.A.; Buser, D.; Gruber, R. Conditioned Medium of Demineralized Freeze-Dried Bone Activates Gene Expression in Periodontal Fibroblasts In Vitro. J. Periodontol. 2015, 86, 827–834. [Google Scholar] [CrossRef]
- Du, S.; Hu, W.; Zhao, Y.; Zhou, H.; Wen, W.; Xu, M.; Zhao, P.; Liu, K. Long non-coding RNA MAGI2-AS3 inhibits breast cancer cell migration and invasion via sponging microRNA-374a. Cancer Biomark. 2019, 24, 269–277. [Google Scholar] [CrossRef] [PubMed]
- Yin, Z.; Ma, T.; Yan, J.; Shi, N.; Zhang, C.; Lu, X.; Hou, B.; Jian, Z. LncRNA MAGI2-AS3 inhibits hepatocellular carcinoma cell proliferation and migration by targeting the miR-374b-5p/SMG1 signaling pathway. J. Cell. Physiol. 2019, 234, 18825–18836. [Google Scholar] [CrossRef] [PubMed]
- Takahashi, M.; Inoue, T.; Huang, M.; Numakura, K.; Tsuruta, H.; Saito, M.; Maeno, A.; Nakamura, E.; Narita, S.; Tsuchiya, N.; et al. Inverse relationship between insulin receptor expression and progression in renal cell carcinoma. Oncol. Rep. 2017, 37, 2929–2941. [Google Scholar] [CrossRef] [PubMed]
- Pothapragada, S.P.; Gupta, P.; Mukherjee, S.; Das, T. Matrix mechanics regulates epithelial defence against cancer by tuning dynamic localization of filamin. Nat. Commun. 2022, 13, 218. [Google Scholar] [CrossRef] [PubMed]
- Jamal, S.; Cheriyan, V.T.; Muthu, M.; Munie, S.; Levi, E.; Ashour, A.E.; Pass, H.I.; Wali, A.; Singh, M.; Rishi, A.K. CARP-1 Functional Mimetics Are a Novel Class of Small Molecule Inhibitors of Malignant Pleural Mesothelioma Cells. PLoS ONE 2014, 9, e89146. [Google Scholar] [CrossRef] [PubMed]
- Muthu, M.; Cheriyan, V.T.; Munie, S.; Levi, E.; Frank, J.; Ashour, A.E.; Singh, M.; Rishi, A.K. Mechanisms of Neuroblastoma Cell Growth Inhibition by CARP-1 Functional Mimetics. PLoS ONE 2014, 9, e102567. [Google Scholar] [CrossRef] [PubMed]
- Wang, Y.; Argiles-Castillo, D.; Kane, E.I.; Zhou, A.; Spratt, D.E. HECT E3 ubiquitin ligases—Emerging insights into their biological roles and disease relevance. J. Cell Sci. 2020, 133, jcs228072. [Google Scholar] [CrossRef] [PubMed]
- Xie, S.; Xia, L.; Song, Y.; Liu, H.; Wang, Z.; Zhu, X. Insights into the Biological Role of NEDD4L E3 Ubiquitin Ligase in Human Cancers. Front. Oncol. 2021, 11, 774648. [Google Scholar] [CrossRef]
- Vaidyanathan, G.; Cismowski, M.J.; Wang, G.; Vincent, T.S.; Brown, K.D.; Lanier, S.M. The Ras-related protein AGS1/RASD1 suppresses cell growth. Oncogene 2004, 23, 5858–5863. [Google Scholar] [CrossRef]
- Stelzer, G.; Rosen, N.; Plaschkes, I.; Zimmerman, S.; Twik, M.; Fishilevich, S.; Stein, T.I.; Nudel, R.; Lieder, I.; Mazor, Y.; et al. The GeneCards Suite: From Gene Data Mining to Disease Genome Sequence Analyses. Curr. Protoc. Bioinform. 2016, 54, 1.30.1–1.30.33. [Google Scholar] [CrossRef] [PubMed]
- Wang, X.J.; Yan, Z.J.; Luo, G.C.; Chen, Y.Y.; Bai, P.M. miR-26 suppresses renal cell cancer via down-regulating coronin-3. Mol. Cell Biochem. 2020, 463, 137–146. [Google Scholar] [CrossRef] [PubMed]
- Liao, M.; Peng, L. MiR-206 may suppress non-small lung cancer metastasis by targeting CORO1C. Cell. Mol. Biol. Lett. 2020, 25, 22. [Google Scholar] [CrossRef] [PubMed]
- Bell, D.W.; Sikdar, N.; Lee, K.; Price, J.C.; Chatterjee, R.; Park, H.-D.; Fox, J.; Ishiai, M.; Rudd, M.L.; Pollock, L.M.; et al. Predisposition to Cancer Caused by Genetic and Functional Defects of Mammalian Atad5. PLoS Genet. 2011, 7, e1002245. [Google Scholar] [CrossRef] [PubMed]
- Yang, P.; Huang, X.; Lai, C.; Li, L.; Li, T.; Huang, P.; Ouyang, S.; Yan, J.; Cheng, S.; Lei, G.; et al. SET domain containing 1B gene is mutated in primary hepatic neuroendocrine tumors. Int. J. Cancer 2019, 145, 2986–2995. [Google Scholar] [CrossRef] [PubMed]
- Hong, C.-Q.; Zhang, F.; You, Y.-J.; Qiu, W.-L.; Giuliano, A.E.; Cui, X.-J.; Zhang, G.-J.; Cui, Y.-K. Elevated C1orf63 expression is correlated with CDK10 and predicts better outcome for advanced breast cancers: A retrospective study. BMC Cancer 2015, 15, 548. [Google Scholar] [CrossRef] [PubMed][Green Version]
- Hong, S.-W.; Jin, D.-H.; Shin, J.-S.; Moon, J.-H.; Na, Y.-S.; Jung, K.-A.; Kim, S.M.; Kim, J.C.; Kim, K.P.; Hong, Y.S.; et al. Ring Finger Protein 149 Is an E3 Ubiquitin Ligase Active on Wild-type v-Raf Murine Sarcoma Viral Oncogene Homolog B1 (BRAF). J. Biol. Chem. 2012, 287, 24017–24025. [Google Scholar] [CrossRef] [PubMed]
- Low, S.-K.; Kuchiba, A.; Zembutsu, H.; Saito, A.; Takahashi, A.; Kubo, M.; Daigo, Y.; Kamatani, N.; Chiku, S.; Totsuka, H.; et al. Genome-Wide Association Study of Pancreatic Cancer in Japanese Population. PLoS ONE 2010, 5, e11824. [Google Scholar] [CrossRef]
- Zhang, X.; Horwitz, G.A.; Prezant, T.R.; Valentini, A.; Nakashima, M.; Bronstein, M.D.; Melmed, S. Structure, Expression, and Function of Human Pituitary Tumor-Transforming Gene (PTTG). Mol. Endocrinol. 1999, 13, 156–166. [Google Scholar] [CrossRef]
- Mei, L. Multiple types of noncoding RNA are involved in potential modulation of PTTG1’s expression and function in breast cancer. Genomics 2022, 114, 110352. [Google Scholar] [CrossRef]
- Zi, Z. Molecular Engineering of the TGF-β Signaling Pathway. J. Mol. Biol. 2019, 431, 2644–2654. [Google Scholar] [CrossRef] [PubMed]
- Sun, Y.; Liu, W.-Z.; Liu, T.; Feng, X.; Yang, N.; Zhou, H.-F. Signaling pathway of MAPK/ERK in cell proliferation, differentiation, migration, senescence and apoptosis. J. Recept. Signal Transduct. 2015, 35, 600–604. [Google Scholar] [CrossRef]
- Xiong, L.; He, X.; Wang, L.; Dai, P.; Zhao, J.; Zhou, X.; Tang, H. Hypoxia-associated prognostic markers and competing endogenous RNA coexpression networks in lung adenocarcinoma. Sci. Rep. 2022, 12, 21340. [Google Scholar] [CrossRef] [PubMed]
- Du, Y.; Kong, C.; Zhu, Y.; Yu, M.; Li, Z.; Bi, J.; Li, Z.; Liu, X.; Zhang, Z.; Yu, X. Knockdown of SNHG15 suppresses renal cell carcinoma proliferation and EMT by regulating the NF-κB signaling pathway. Int. J. Oncol. 2018, 53, 384–394. [Google Scholar] [CrossRef] [PubMed]
- Jin, B.; Jin, H.; Wu, H.-B.; Xu, J.-J.; Li, B. Long non-coding RNA SNHG15 promotes CDK14 expression via miR-486 to accelerate non-small cell lung cancer cells progression and metastasis. J. Cell. Physiol. 2018, 233, 7164–7172. [Google Scholar] [CrossRef] [PubMed]
- Huang, L.; Lin, H.; Kang, L.; Huang, P.; Huang, J.; Cai, J.; Xian, Z.; Zhu, P.; Huang, M.; Wang, L.; et al. Aberrant expression of long noncoding RNA SNHG15 correlates with liver metastasis and poor survival in colorectal cancer. J. Cell. Physiol. 2019, 234, 7032–7039. [Google Scholar] [CrossRef] [PubMed]
- Mitchell, S.; Vargas, J.; Hoffmann, A. Signaling via the NFκB system. WIREs Mech. Dis. 2016, 8, 227–241. [Google Scholar] [CrossRef]
- Huttlin, E.L.; Bruckner, R.J.; Paulo, J.A.; Cannon, J.R.; Ting, L.; Baltier, K.; Colby, G.; Gebreab, F.; Gygi, M.P.; Parzen, H.; et al. Architecture of the human interactome defines protein communities and disease networks. Nature 2017, 545, 505–509. [Google Scholar] [CrossRef]
- Li, G.; Wang, Y.; Cheng, Y. IL2RB Is a Prognostic Biomarker Associated with Immune Infiltrates in Pan-Cancer. J. Oncol. 2022, 2022, 2043880. [Google Scholar] [CrossRef]
- Fox, S.B.; Bragança, J.; Turley, H.; Campo, L.; Han, C.; Gatter, K.C.; Bhattacharya, S.; Harris, A.L. CITED4 Inhibits Hypoxia-Activated Transcription in Cancer Cells, and Its Cytoplasmic Location in Breast Cancer Is Associated with Elevated Expression of Tumor Cell Hypoxia-Inducible Factor 1α. Cancer Res. 2004, 64, 6075–6081. [Google Scholar] [CrossRef]
- Grossman, R.L.; Heath, A.P.; Ferretti, V.; Varmus, H.E.; Lowy, D.R.; Kibbe, W.A.; Staudt, L.M. Toward a Shared Vision for Cancer Genomic Data. N. Engl. J. Med. 2016, 375, 1109–1112. [Google Scholar] [CrossRef] [PubMed]
- Goldman, M.J.; Craft, B.; Hastie, M.; Repečka, K.; McDade, F.; Kamath, A.; Banerjee, A.; Luo, Y.; Rogers, D.; Brooks, A.N.; et al. Visualizing and interpreting cancer genomics data via the Xena platform. Nat. Biotechnol. 2020, 38, 675–678. [Google Scholar] [CrossRef] [PubMed]
- Zhang, J.; Bajari, R.; Andric, D.; Gerthoffert, F.; Lepsa, A.; Nahal-Bose, H.; Stein, L.D.; Ferretti, V. The International Cancer Genome Consortium Data Portal. Nat. Biotechnol. 2019, 37, 367–369. [Google Scholar] [CrossRef] [PubMed]
- Love, M.I.; Huber, W.; Anders, S. Moderated estimation of fold change and dispersion for RNA-seq data with DESeq2. Genome Biol. 2014, 15, 550. [Google Scholar] [CrossRef] [PubMed]
- Li, R.; Qu, H.; Wang, S.; Wei, J.; Zhang, L.; Ma, R.; Lu, J.; Zhu, J.; Zhong, W.-D.; Jia, Z. GDCRNATools: An R/Bioconductor package for integrative analysis of lncRNA, miRNA and mRNA data in GDC. Bioinformatics 2018, 34, 2515–2517. [Google Scholar] [CrossRef]
- Li, J.-H.; Liu, S.; Zhou, H.; Qu, L.-H.; Yang, J.-H. starBase v2.0: Decoding miRNA-ceRNA, miRNA-ncRNA and protein–RNA interaction networks from large-scale CLIP-Seq data. Nucl. Acids Res. 2014, 42, D92–D97. [Google Scholar] [CrossRef] [PubMed]
- Shannon, P.; Markiel, A.; Ozier, O.; Baliga, N.S.; Wang, J.T.; Ramage, D.; Amin, N.; Schwikowski, B.; Ideker, T. Cytoscape: A Software Environment for Integrated Models of Biomolecular Interaction Networks. Genome Res. 2003, 13, 2498–2504. [Google Scholar] [CrossRef]
- Barabási, A.-L.; Oltvai, Z.N. Network biology: Understanding the cell’s functional organization. Nat. Rev. Genet. 2004, 5, 101–113. [Google Scholar] [CrossRef]
- Alstott, J.; Bullmore, E.; Plenz, D. powerlaw: A Python Package for Analysis of Heavy-Tailed Distributions. PLoS ONE 2014, 9, e85777. [Google Scholar] [CrossRef]
- Terrematte, P.; Andrade, D.; Justino, J.; Stransky, B.; De Araújo, D.; Dória Neto, A. A Novel Machine Learning 13-Gene Signature: Improving Risk Analysis and Survival Prediction for Clear Cell Renal Cell Carcinoma Patients. Cancers 2022, 14, 2111. [Google Scholar] [CrossRef]
- Stawiski, K.; Kaszkowiak, M.; Mikulski, D.; Hogendorf, P.; Durczyński, A.; Strzelczyk, J.; Chowdhury, D.; Fendler, W. OmicSelector: Automatic feature selection and deep learning modeling for omic experiments. preprint. Bioinformatics 2022. [Google Scholar] [CrossRef]
- Lang, M.; Schratz, P. mlr3verse: Easily Install and Load the “mlr3” Package Family. Available online: https://mlr3verse.mlr-org.com (accessed on 15 May 2023).
- Mayakonda, A.; Lin, D.-C.; Assenov, Y.; Plass, C.; Koeffler, H.P. Maftools: Efficient and comprehensive analysis of somatic variants in cancer. Genome Res. 2018, 28, 1747–1756. [Google Scholar] [CrossRef] [PubMed]
- Mermel, C.H.; Schumacher, S.E.; Hill, B.; Meyerson, M.L.; Beroukhim, R.; Getz, G. GISTIC2.0 facilitates sensitive and confident localization of the targets of focal somatic copy-number alteration in human cancers. Genome Biol. 2011, 12, R41. [Google Scholar] [CrossRef] [PubMed]
- Frankish, A.; Diekhans, M.; Jungreis, I.; Lagarde, J.; Loveland, J.E.; Mudge, J.M.; Sisu, C.; Wright, J.C.; Armstrong, J.; Barnes, I.; et al. GENCODE 2021. Nucleic Acids Res. 2021, 49, D916–D923. [Google Scholar] [CrossRef]
- Therneau, T.M.; Grambsch, P.M. Modeling Survival Data: Extending the Cox Model; Springer: New York, NY, USA, 2000. [Google Scholar]
- Harrison, E.; Drake, T.; Pius, R. finalfit: Quickly Create Elegant Regression Results Tables and Plots when Modelling. Available online: https://github.com/ewenharrison/finalfit (accessed on 15 June 2023).
- Aalen, O.O. A linear regression model for the analysis of life times. Stat. Med. 1989, 8, 907–925. [Google Scholar] [CrossRef] [PubMed]
- Morris, J.A.; Gardner, M.J. Statistics in Medicine: Calculating confidence intervals for relative risks (odds ratios) and standardised ratios and rates. BMJ 1988, 296, 1313–1316. [Google Scholar] [CrossRef] [PubMed]
- The Gene Ontology Consortium; Carbon, S.; Douglass, E.; Good, B.M.; Unni, D.R.; Harris, N.L.; Mungall, C.J.; Basu, S.; Chisholm, R.L.; Dodson, R.J.; et al. The Gene Ontology resource: Enriching a gold mine. Nucleic Acids Res. 2021, 49, D325–D334. [Google Scholar]
- Wu, T.; Hu, E.; Xu, S.; Chen, M.; Guo, P.; Dai, Z.; Feng, T.; Zhou, L.; Tang, W.; Zhan, L.; et al. clusterProfiler 4.0: A universal enrichment tool for interpreting omics data. Innovation 2021, 2, 100141. [Google Scholar] [CrossRef]
- Vlachos, I.S.; Zagganas, K.; Paraskevopoulou, M.D.; Georgakilas, G.; Karagkouni, D.; Vergoulis, T.; Dalamagas, T.; Hatzigeorgiou, A.G. DIANA-miRPath v3.0: Deciphering microRNA function with experimental support. Nucleic Acids Res. 2015, 43, W460–W466. [Google Scholar] [CrossRef]


| Method | Accuracy | AUC | Brier Score |
|---|---|---|---|
| Random forest 1 | 72.2% | 81.48% | 0.1955442 |
| SVM | 50% | 66.67% | 0.2500714 |
| xgBoost | 61.1% | 62.34% | 0.2343498 |
| kNN | 50% | 61.72% | 0.4817816 |
| Naïve Bayes | 50% | 54.32% | 0.5000000 |
| Cluster | Gene | First Ligands |
|---|---|---|
| 1 | AF117829.1 | hsa-miR-361-5p, POLE2, HMMR |
| 2 | BTBD11 | hsa-miR-374a-5p, hsa-miR-374b-5p, MAGI2-AS3 |
| 3 | HECW2 | hsa-miR-130a-3p, hsa-miR-130b-3p, hsa-miR-454-3p, hsa-miR-4295, hsa-miR-3666, H19 |
| 1 | HMMR | hsa-miR-361-5p, POLE2, AF117829.1 |
| 3 | hsa-miR-130a-3p | HECW2, WNK3, RASD1, PFKFB3, SCARA3, LDLR, PMEPA1, TCF4, PXDB, BCL11A, NHSL1, H19 |
| 4 | hsa-miR-381-3p | RSRP1, CORO1C, ATAD5, RNF149, AC016876.2 |
| 3 | INSR | hsa-miR-16-5p, hsa-miR-424-5p, C1RL-AS1. |
| 5 | PTTG1 | hsa-miR-186-5p, AC021078.1 |
| 3 | RFLNB | hsa-miR-29a-3p, hsa-miR-29b-3p, hsa-miR-29c-3p, hsa-miR-16-5p, hsa-miR-424-5p, H19, AC005154.1 |
| 3 | RASD1 | hsa-miR-130a-3p, hsa-miR-130b-3p, hsa-miR-3666, hsa-miR-4295, hsa-miR-454-3p |
| 6 | SNHG15 | hsa-miR-24-3p, IL2RB, NFKBIE, CITED4 |
Disclaimer/Publisher’s Note: The statements, opinions and data contained in all publications are solely those of the individual author(s) and contributor(s) and not of MDPI and/or the editor(s). MDPI and/or the editor(s) disclaim responsibility for any injury to people or property resulting from any ideas, methods, instructions or products referred to in the content. |
© 2024 by the authors. Licensee MDPI, Basel, Switzerland. This article is an open access article distributed under the terms and conditions of the Creative Commons Attribution (CC BY) license (https://creativecommons.org/licenses/by/4.0/).
Share and Cite
Farias, E.; Terrematte, P.; Stransky, B. Machine Learning Gene Signature to Metastatic ccRCC Based on ceRNA Network. Int. J. Mol. Sci. 2024, 25, 4214. https://doi.org/10.3390/ijms25084214
Farias E, Terrematte P, Stransky B. Machine Learning Gene Signature to Metastatic ccRCC Based on ceRNA Network. International Journal of Molecular Sciences. 2024; 25(8):4214. https://doi.org/10.3390/ijms25084214
Chicago/Turabian StyleFarias, Epitácio, Patrick Terrematte, and Beatriz Stransky. 2024. "Machine Learning Gene Signature to Metastatic ccRCC Based on ceRNA Network" International Journal of Molecular Sciences 25, no. 8: 4214. https://doi.org/10.3390/ijms25084214
APA StyleFarias, E., Terrematte, P., & Stransky, B. (2024). Machine Learning Gene Signature to Metastatic ccRCC Based on ceRNA Network. International Journal of Molecular Sciences, 25(8), 4214. https://doi.org/10.3390/ijms25084214