


Evaluation of Ouabain’s Tissue Distribution in C57/Black Mice Following Intraperitoneal Injection, Using Chromatography and Mass Spectrometry
 , , , ,
Abstract
:1. Introduction
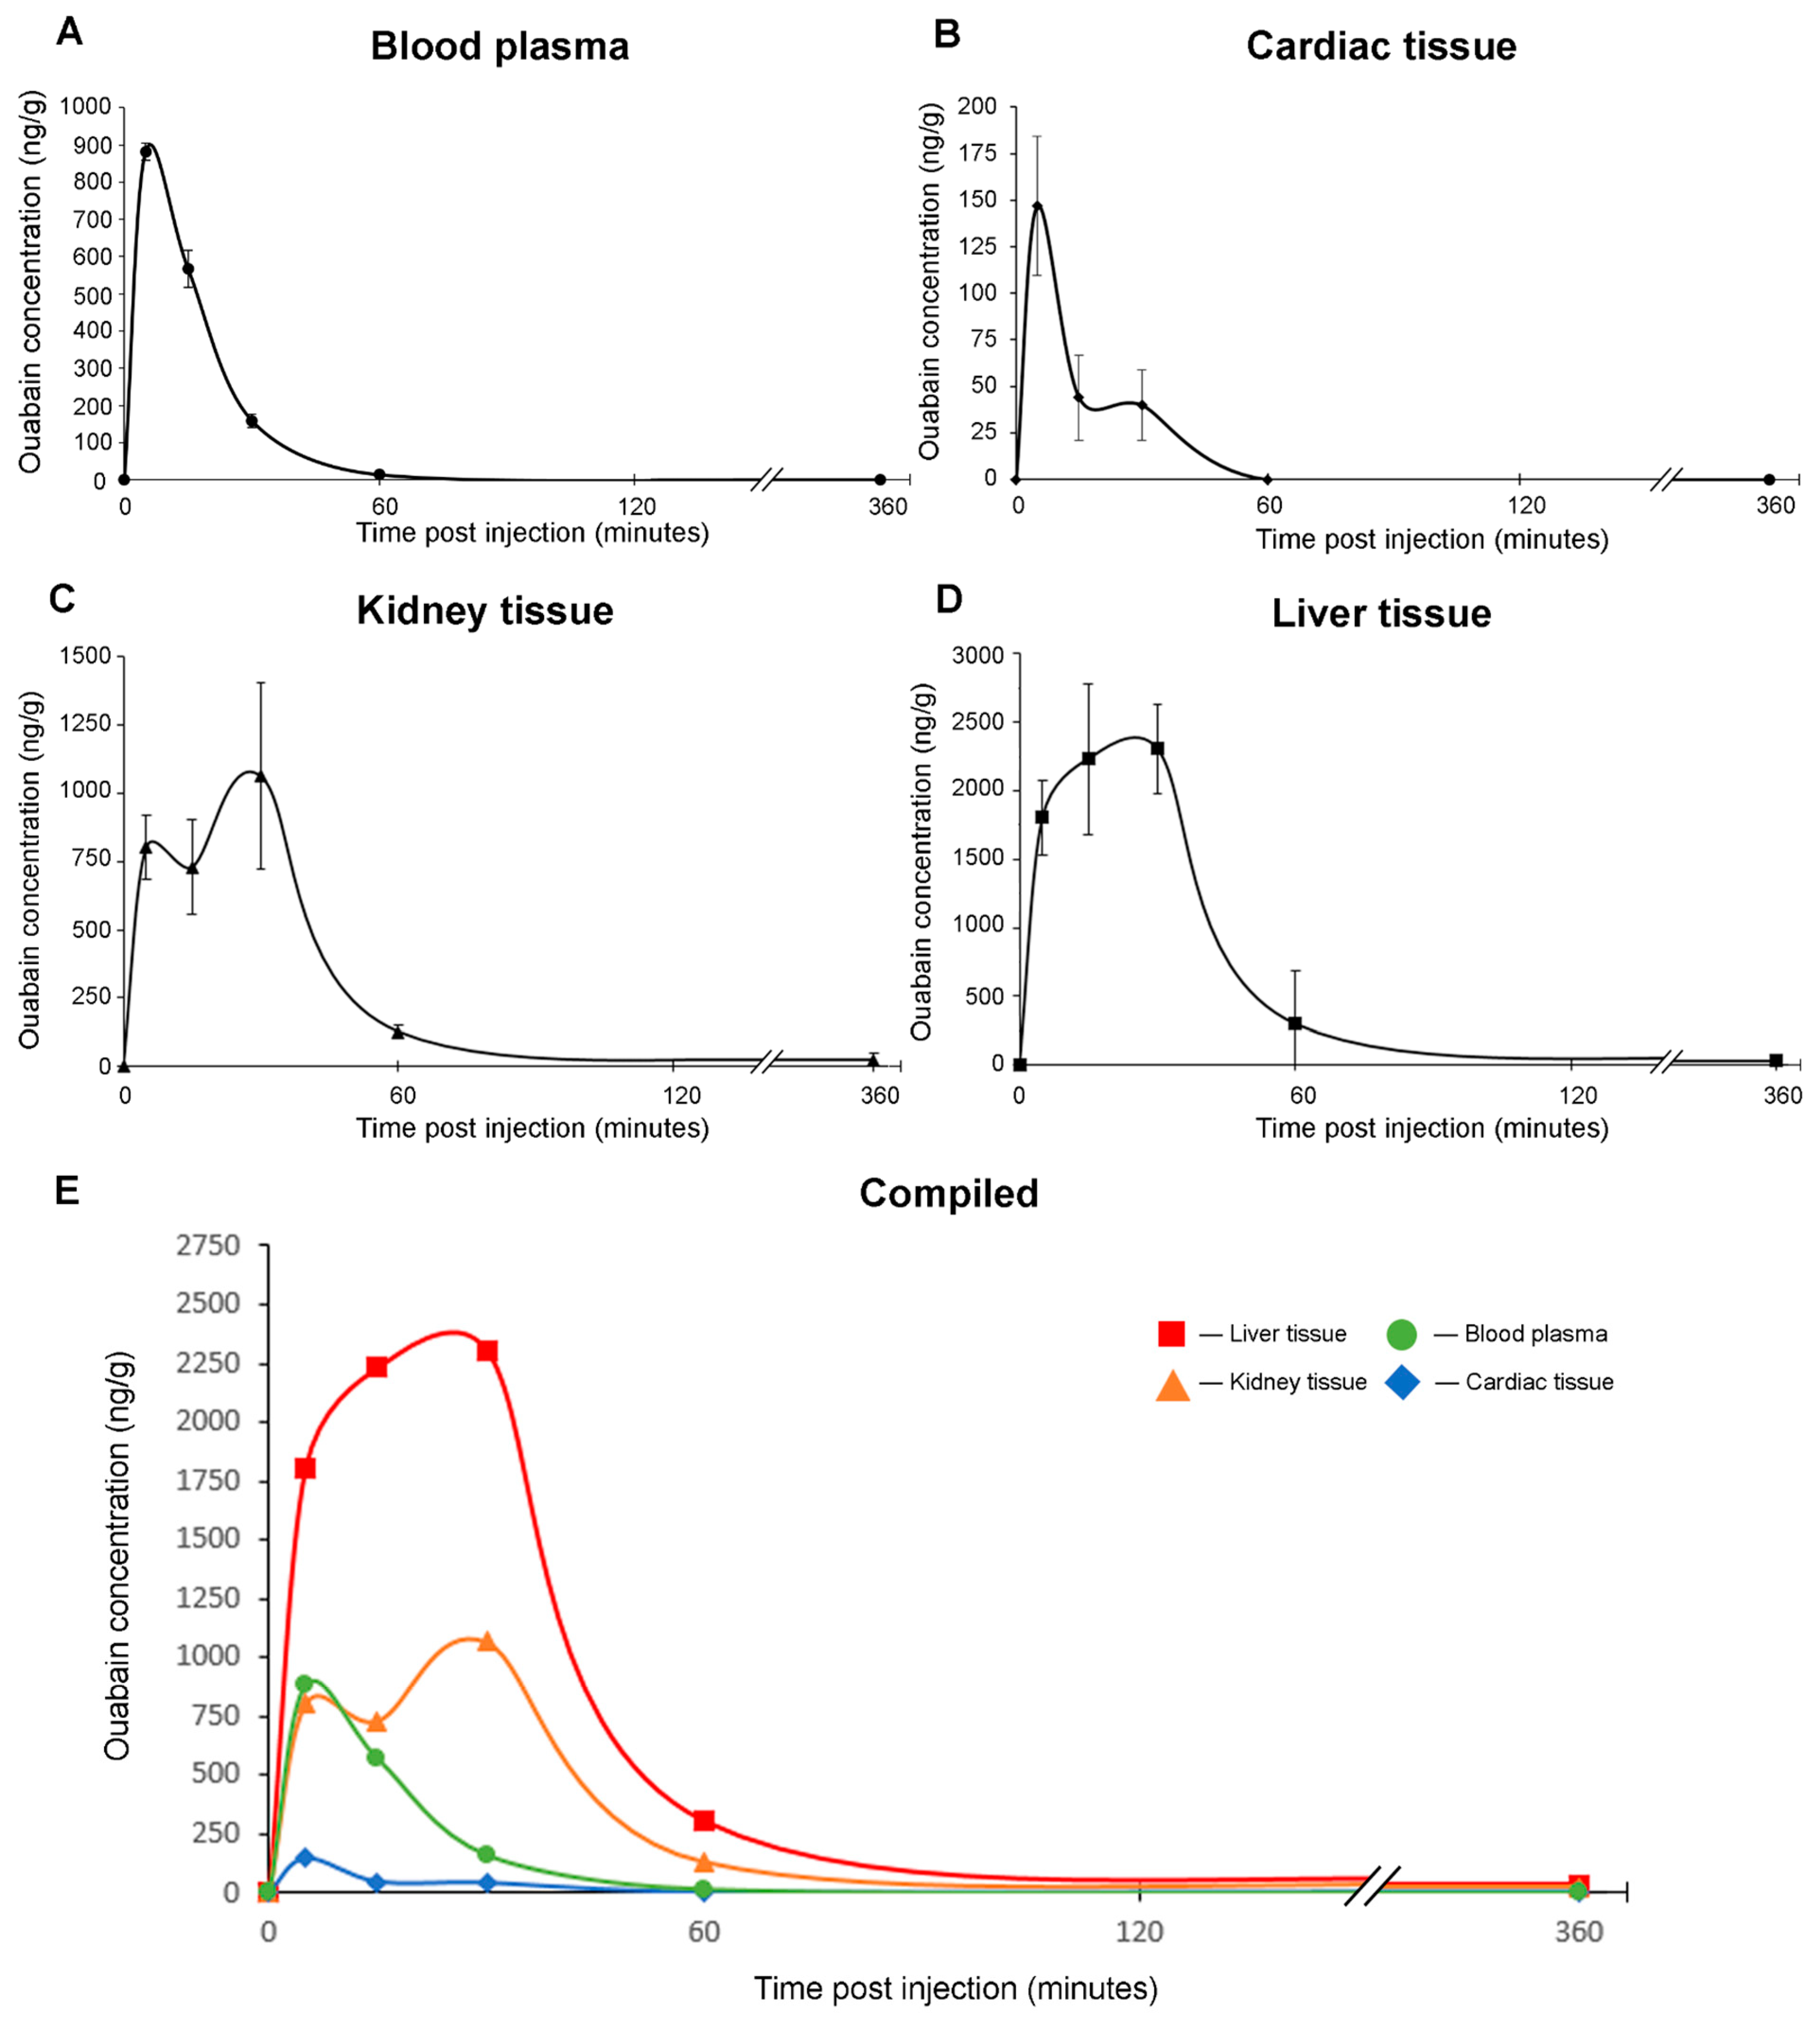
2. Results
3. Discussion
4. Materials and Methods
4.1. Animals
4.2. Sample Preparation
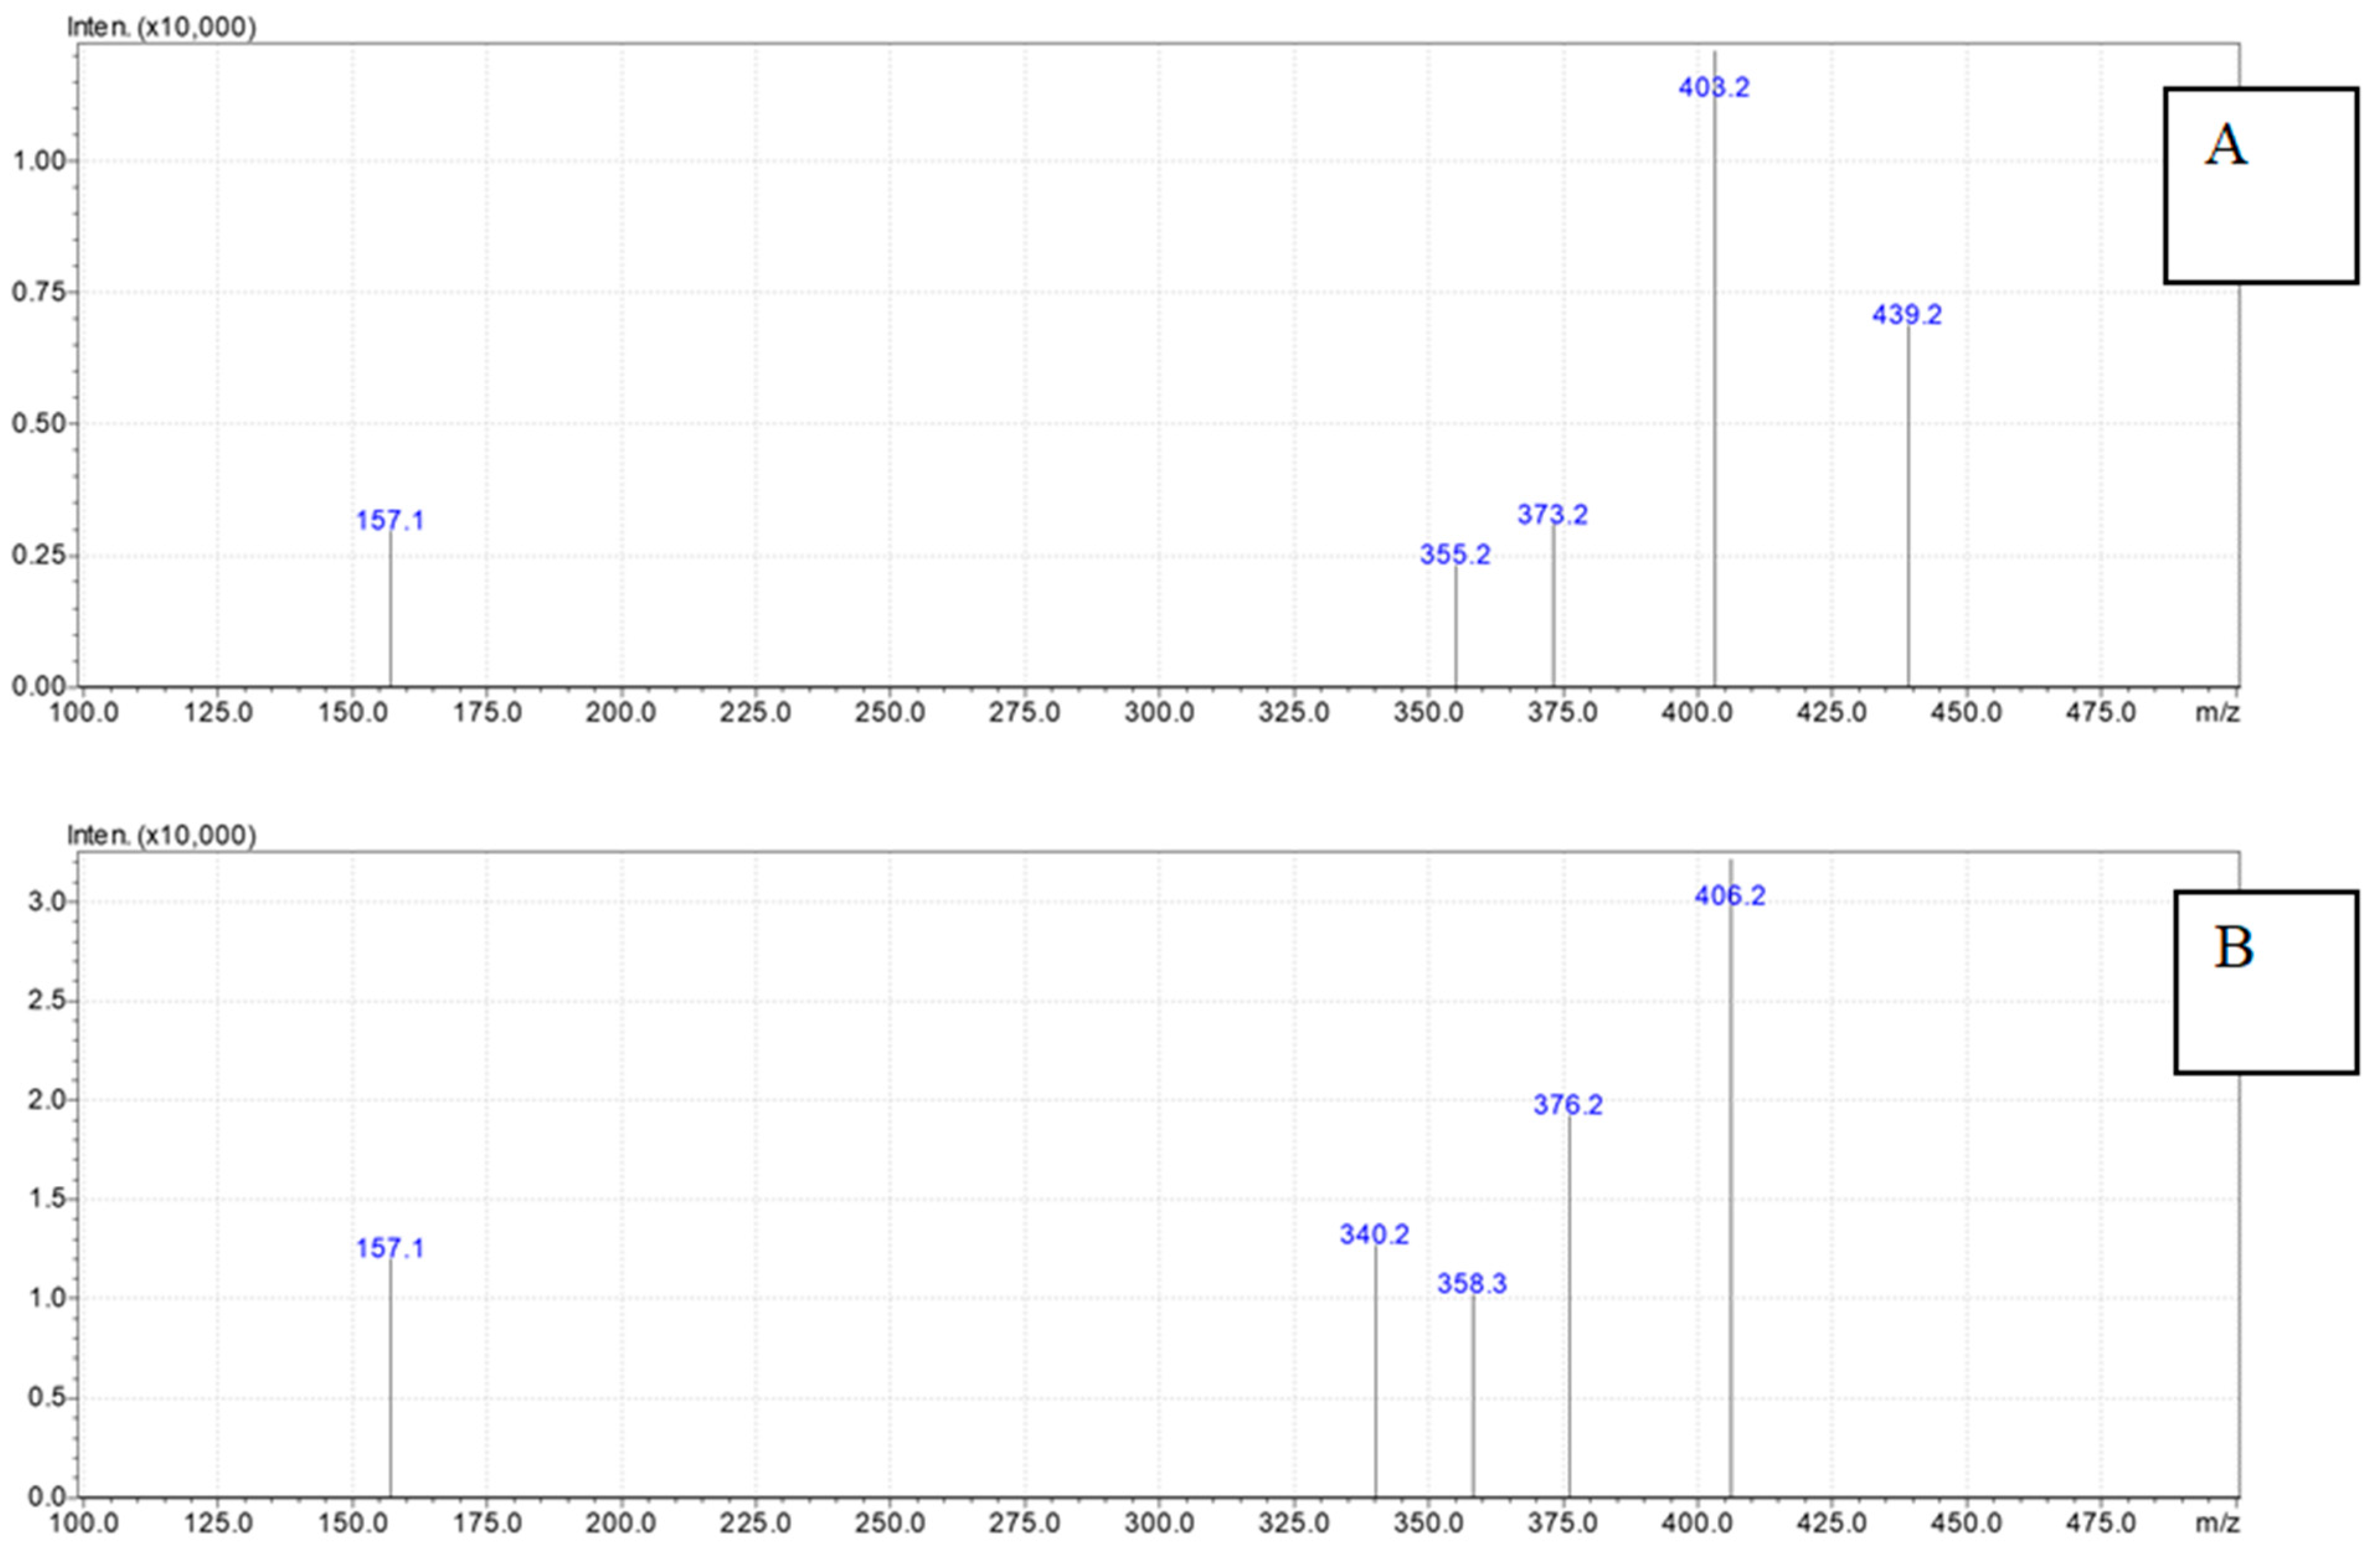
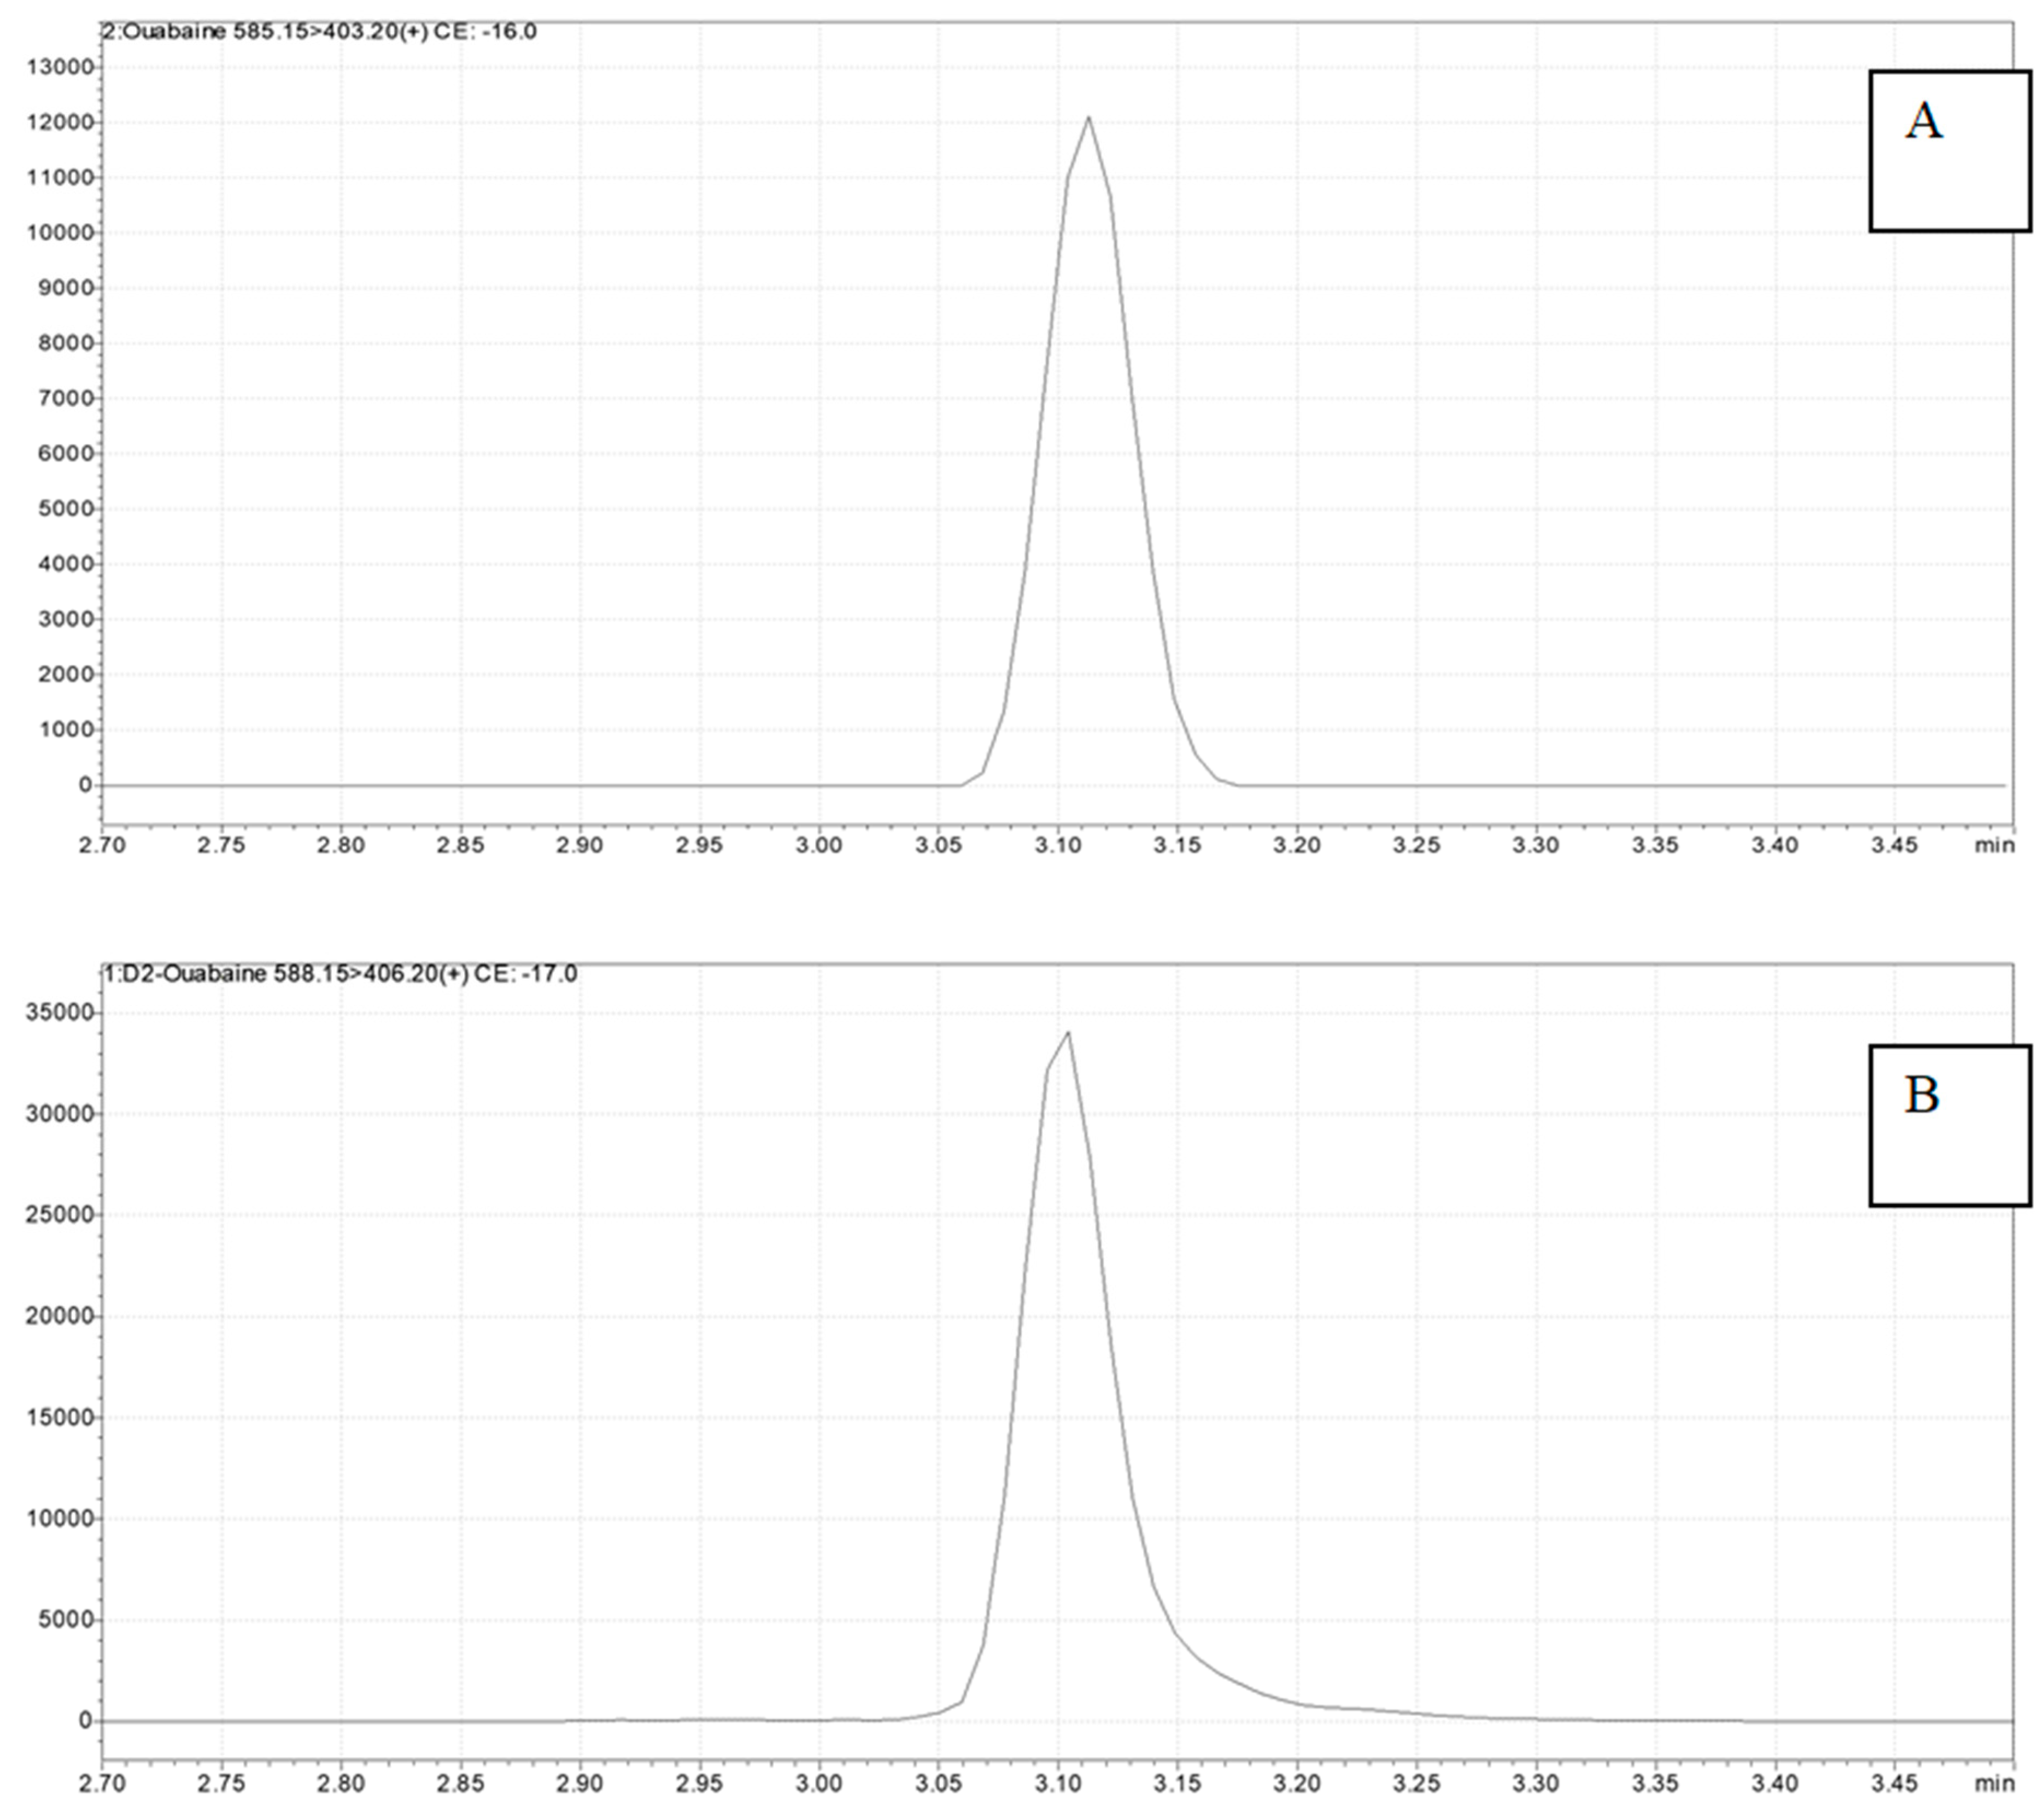
4.3. Ouabain Detection
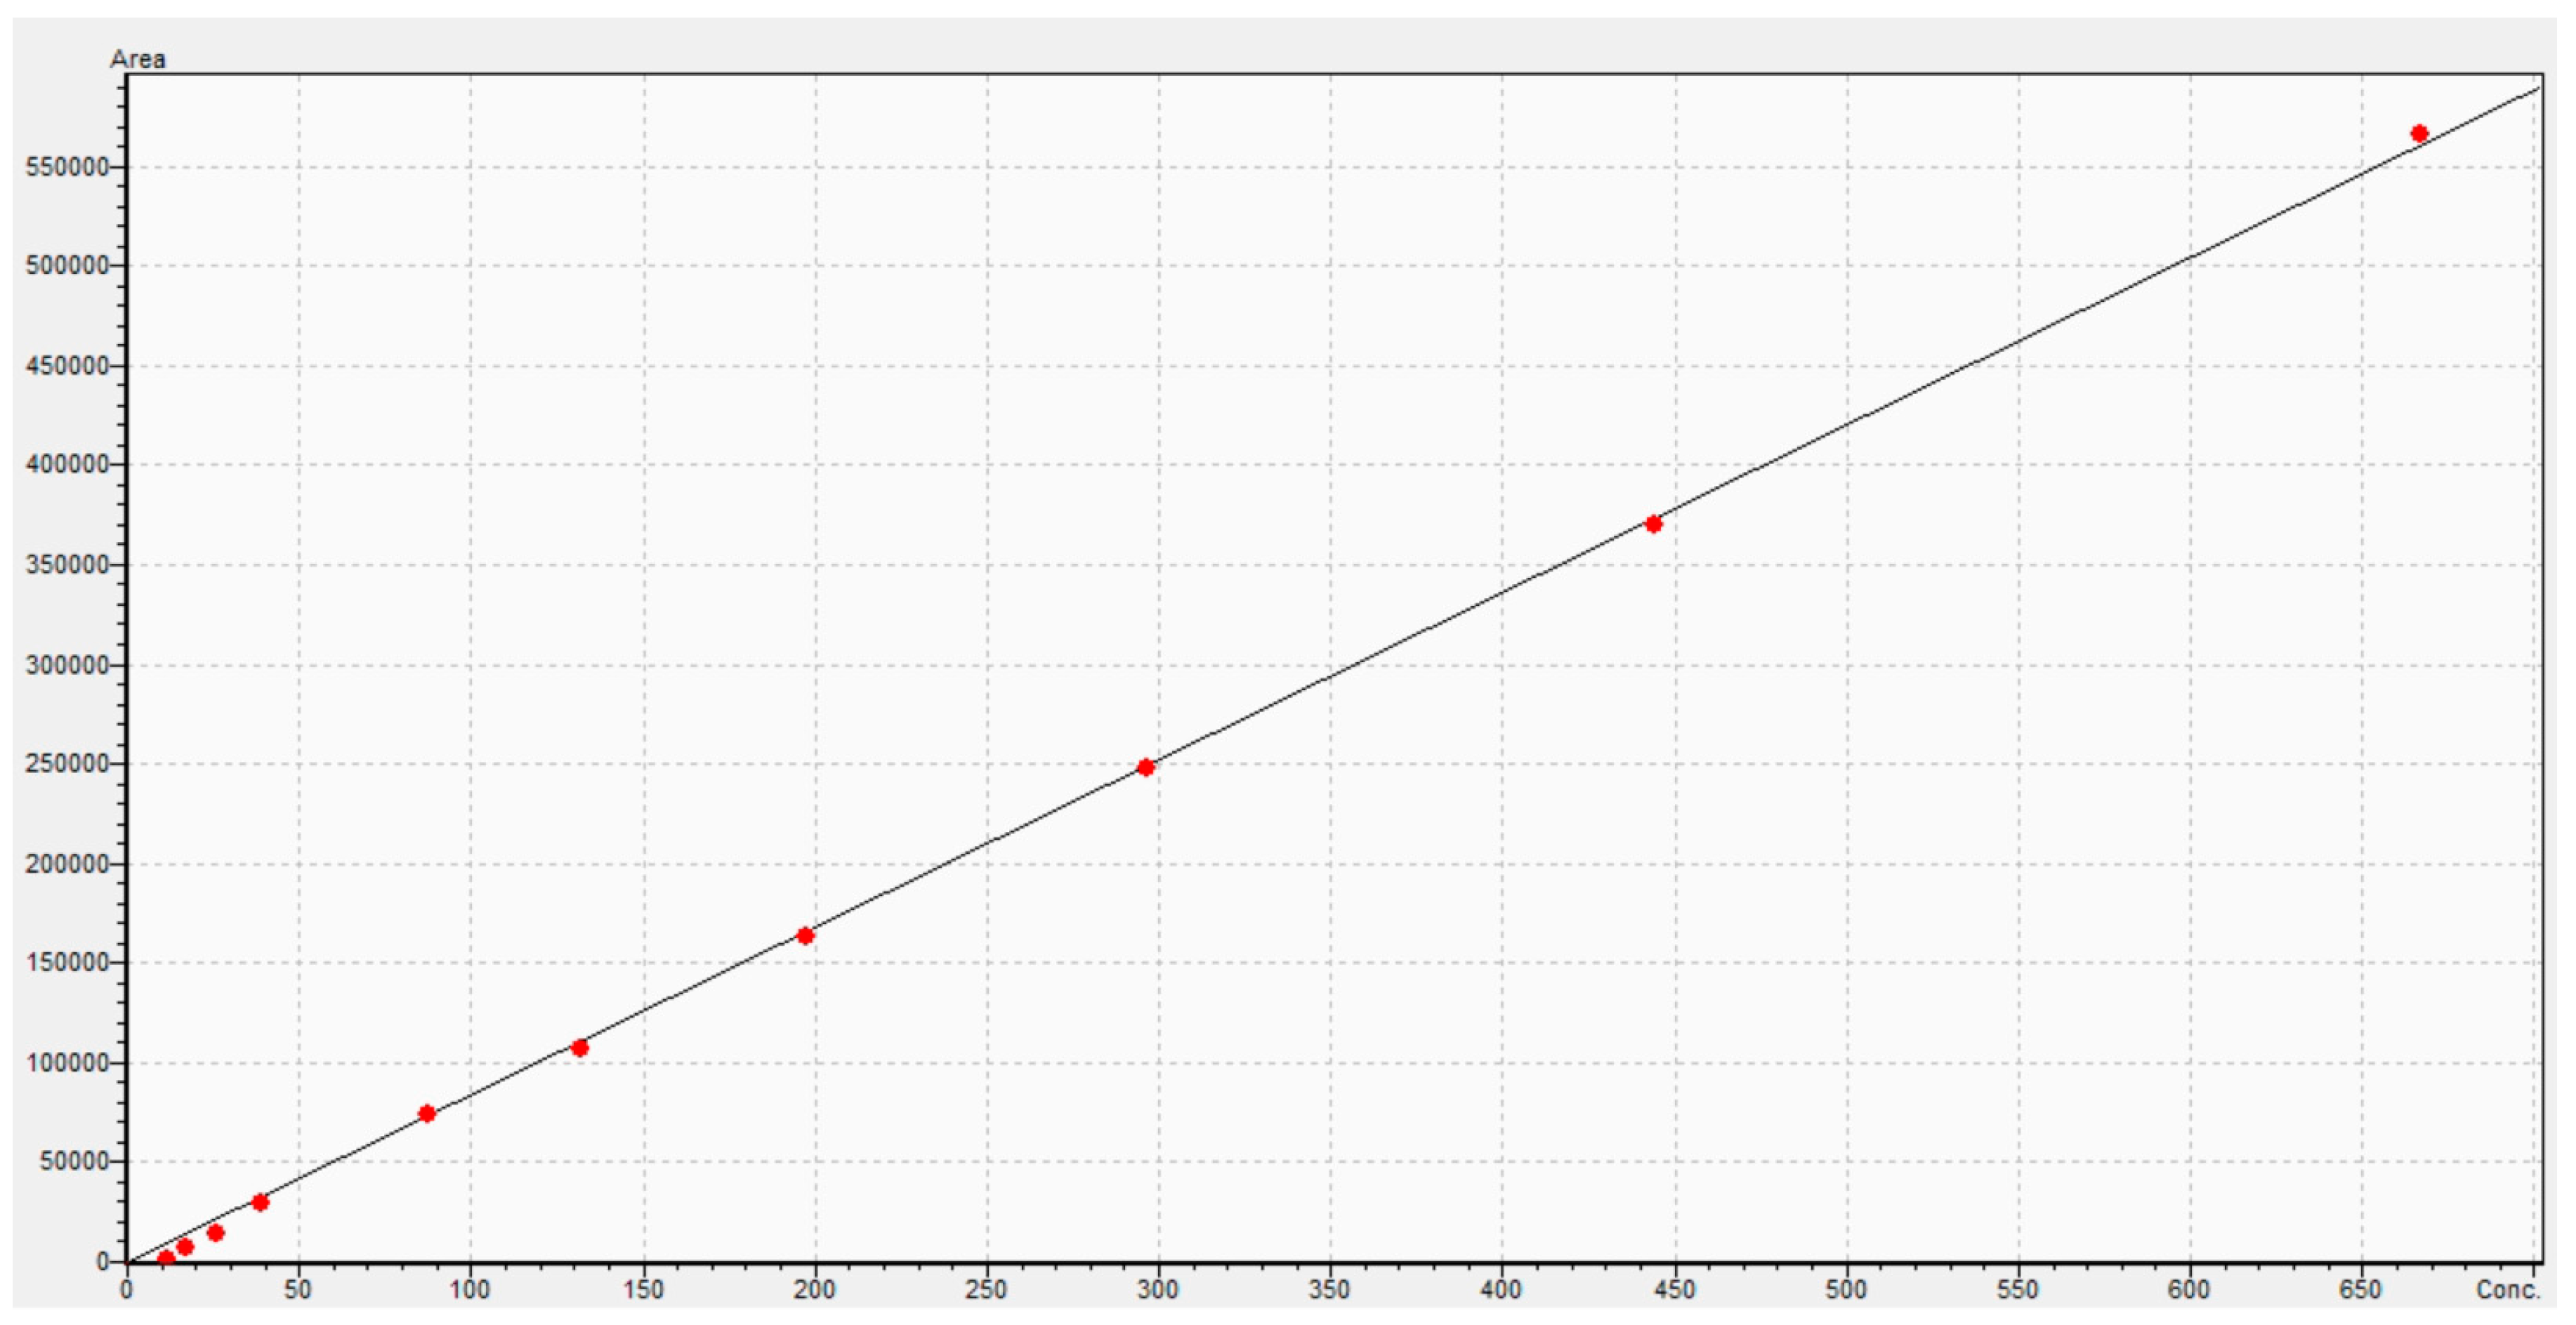
4.4. Pharmacokinetic Analysis and Statistical Approach
Author Contributions
Funding
Institutional Review Board Statement
Informed Consent Statement
Data Availability Statement
Acknowledgments
Conflicts of Interest
Appendix A


| λz, h−1 | T1/2, h | Tmax, h | ||||||||||
|---|---|---|---|---|---|---|---|---|---|---|---|---|
| Statistical Parameter | Cardiac | Liver | Plasma | Kidney | Cardiac | Liver | Plasma | Kidney | Cardiac | Liver | Plasma | Kidney |
| Mean | 3.42 | 0.70 | 4.85 | 0.68 | 0.23 | 1.24 | 0.15 | 1.32 | 0.08 | 0.35 | 0.08 | 0.35 |
| SD | 1.29 | 0.44 | 0.80 | 0.36 | 0.09 | 0.70 | 0.02 | 0.76 | 0.00 | 0.13 | 0.00 | 0.19 |
| SE | 0.24 | 0.08 | 0.15 | 0.07 | 0.02 | 0.13 | 0.00 | 0.14 | 0.00 | 0.02 | 0.00 | 0.04 |
| Minimum | 1.49 | 0.16 | 3.81 | 0.15 | 0.10 | 0.26 | 0.10 | 0.49 | 0.08 | 0.25 | 0.08 | 0.08 |
| Median | 3.16 | 0.62 | 4.71 | 0.52 | 0.22 | 1.11 | 0.15 | 1.34 | 0.08 | 0.25 | 0.08 | 0.50 |
| Maximum | 6.68 | 2.68 | 7.00 | 1.41 | 0.47 | 4.27 | 0.18 | 4.58 | 0.08 | 0.50 | 0.08 | 0.50 |
| Geometric Mean | 3.19 | 0.63 | 4.79 | 0.60 | 0.22 | 1.11 | 0.15 | 1.16 | 0.08 | 0.33 | 0.08 | 0.27 |
| 95% Confidence Interval’s Lower Limit | 2.94 | 0.53 | 4.55 | 0.55 | 0.20 | 0.97 | 0.14 | 1.03 | 0.08 | 0.30 | 0.08 | 0.28 |
| 95% Confidence Interval’s Upper Limit | 3.90 | 0.87 | 5.15 | 0.82 | 0.27 | 1.51 | 0.16 | 1.60 | 0.08 | 0.40 | 0.08 | 0.42 |
| Cmax, ng/g | AUCt, ng × h/g | AUCinf, ng × h/g | ||||||||||
|---|---|---|---|---|---|---|---|---|---|---|---|---|
| Statistical Parameter | Cardiac | Liver | Plasma | Kidney | Cardiac | Liver | Plasma | Kidney | Cardiac | Liver | Plasma | Kidney |
| Mean | 145.24 | 2558.00 | 882.88 | 1072.27 | 34.35 | 2084.61 | 290.75 | 871.99 | 47.59 | 2207.65 | 294.33 | 939.10 |
| SD | 44.03 | 382.35 | 21.82 | 260.86 | 8.71 | 389.50 | 14.94 | 132.59 | 12.90 | 338.85 | 14.62 | 145.42 |
| SE | 8.04 | 69.81 | 3.98 | 47.63 | 1.59 | 71.11 | 2.73 | 24.21 | 2.36 | 64.04 | 2.67 | 26.55 |
| Minimum | 81.76 | 1655.38 | 845.72 | 635.23 | 19.59 | 1103.55 | 259.01 | 613.64 | 29.86 | 1629.32 | 265.54 | 634.96 |
| Median | 133.38 | 2577.75 | 880.98 | 995.28 | 31.38 | 2085.49 | 292.00 | 890.33 | 45.32 | 2168.33 | 294.10 | 974.45 |
| Maximum | 264.93 | 3423.28 | 940.98 | 1714.65 | 59.89 | 2842.77 | 317.33 | 1082.66 | 82.46 | 2909.32 | 320.86 | 1207.27 |
| Geometric Mean | 139.37 | 2529.77 | 882.62 | 1043.49 | 33.37 | 2046.19 | 290.38 | 861.92 | 46.02 | 2182.10 | 293.98 | 927.52 |
| 95% Confidence Interval’s Lower Limit | 128.80 | 2415.23 | 874.73 | 974.86 | 31.10 | 1939.16 | 285.17 | 822.49 | 42.78 | 2076.25 | 288.87 | 884.80 |
| 95% Confidence Interval’s Upper Limit | 161.68 | 2700.77 | 891.02 | 1169.67 | 37.61 | 2230.05 | 296.33 | 921.50 | 52.41 | 2339.04 | 299.79 | 993.40 |
| Vz/F (Relative Units) | Cl/F, h−1 | MRT, h | ||||||||||
|---|---|---|---|---|---|---|---|---|---|---|---|---|
| Statistical Parameter | Cardiac | Liver | Plasma | Kidney | Cardiac | Liver | Plasma | Kidney | Cardiac | Liver | Plasma | Kidney |
| Mean | 9.46 | 1.04 | 0.90 | 2.58 | 29.14 | 0.58 | 4.26 | 1.40 | 0.38 | 0.98 | 0.26 | 1.41 |
| SD | 3.48 | 0.56 | 0.15 | 1.32 | 7.22 | 0.10 | 0.21 | 0.23 | 0.14 | 0.33 | 0.01 | 0.71 |
| SE | 0.64 | 0.11 | 0.03 | 0.24 | 1.32 | 0.02 | 0.04 | 0.04 | 0.03 | 0.06 | 0.00 | 0.13 |
| Minimum | 4.08 | 0.21 | 0.60 | 0.88 | 15.94 | 0.43 | 3.90 | 1.10 | 0.19 | 0.48 | 0.24 | 0.64 |
| Median | 9.16 | 0.95 | 0.88 | 2.47 | 28.83 | 0.58 | 4.25 | 1.33 | 0.35 | 0.90 | 0.26 | 1.32 |
| Maximum | 20.08 | 3.18 | 1.22 | 7.64 | 44.07 | 0.81 | 4.71 | 1.97 | 0.74 | 2.21 | 0.28 | 3.36 |
| Geometric Mean | 8.85 | 0.92 | 0.89 | 2.31 | 28.26 | 0.58 | 4.25 | 1.39 | 0.35 | 0.94 | 0.26 | 1.26 |
| 95% Confidence Interval’s Lower Limit | 8.16 | 0.82 | 0.84 | 2.09 | 26.45 | 0.55 | 4.18 | 1.32 | 0.32 | 0.85 | 0.26 | 1.15 |
| 95% Confidence Interval’s Upper Limit | 10.76 | 1.26 | 0.96 | 3.08 | 31.84 | 0.62 | 4.34 | 1.49 | 0.43 | 1.11 | 0.26 | 1.68 |
References
- Bagrov, A.Y.; Shapiro, J.I.; Fedorova, O.V. Endogenous cardiotonic steroids: Physiology, pharmacology, and novel therapeutic targets. Pharmacol. Rev. 2009, 61, 9–38. [Google Scholar] [CrossRef]
- Pavlovic, D. Endogenous cardiotonic steroids and cardiovascular disease, where to next? Cell Calcium 2020, 86, 102156. [Google Scholar] [CrossRef]
- Lopachev, A.V.; Lopacheva, O.M.; Osipova, E.A.; Vladychenskaya, E.A.; Smolyaninova, L.V.; Fedorova, T.N.; Koroleva, O.V.; Akkuratov, E.E. Ouabain-induced changes in MAP kinase phosphorylation in primary culture of rat cerebellar cells. Cell Biochem. Funct. 2016, 34, 367–377. [Google Scholar] [CrossRef]
- Neves, C.H.; Tibana, R.A.; Prestes, J.; Voltarelli, F.A.; Aguiar, A.F.; Mota, G.A.F.; de Sousa, S.L.B.; Leopoldo, A.S.; Leopoldo, A.P.L.; Mueller, A.; et al. Digoxin Induces Cardiac Hypertrophy without Negative Effects on Cardiac Function and Physical Performance in Trained Normotensive Rats. Int. J. Sports Med. 2017, 38, 263–269. [Google Scholar] [CrossRef] [PubMed]
- Marck, P.V.; Pessoa, M.T.; Xu, Y.; Kutz, L.C.; Collins, D.M.; Yan, Y.; King, C.; Wang, X.; Duan, Q.; Cai, L.; et al. Cardiac Oxidative Signaling and Physiological Hypertrophy in the Na/K-ATPase α1s/sα2s/s Mouse Model of High Affinity for Cardiotonic Steroids. Int. J. Mol. Sci. 2021, 22, 3462. [Google Scholar] [CrossRef]
- Kapelios, C.J.; Lund, L.H.; Benson, L.; Dahlström, U.; Rosano, G.M.C.; Hauptman, P.J.; Savarese, G. Digoxin use in contemporary heart failure with reduced ejection fraction: An analysis from the Swedish Heart Failure Registry. Eur. Heart J. Cardiovasc. Pharmacother. 2022, 8, 756–767. [Google Scholar] [CrossRef] [PubMed]
- El-Mallakh, R.S.; Hedges, S.; Casey, D. Digoxin encephalopathy presenting as mood disturbance. J. Clin. Psychopharmacol. 1995, 15, 82–83. [Google Scholar] [CrossRef] [PubMed]
- Shear, M.K.; Sacks, M. Digitalis delirium: Psychiatric considerations. Int. J. Psychiatry Med. 1977, 8, 371–381. [Google Scholar] [CrossRef]
- El-Mallakh, R.S.; Harrison, L.T.; Li, R.; Changaris, D.G.; Levy, R.S. An animal model for mania: Preliminary results. Prog. Neuropsychopharmacol. Biol. Psychiatry 1995, 19, 955–962. [Google Scholar] [CrossRef]
- Lopachev, A.; Volnova, A.; Evdokimenko, A.; Abaimov, D.; Timoshina, Y.; Kazanskaya, R.; Lopacheva, O.; Deal, A.; Budygin, E.; Fedorova, T.; et al. Intracerebroventricular injection of ouabain causes mania-like behavior in mice through D2 receptor activation. Sci. Rep. 2019, 9, 15627. [Google Scholar] [CrossRef]
- Marchetti, G.V.; Marzo, A.; De Ponti, C.; Scalvini, A.; Merlo, L.; Noseda, V. Blood levels and tissue distribution of 3 H-ouabain administered per os. An experimental and clinical study. Arzneimittelforschung 1971, 21, 1399–1403. Available online: https://www.ncbi.nlm.nih.gov/pubmed/5171797 (accessed on 1 February 2024). [PubMed]
- Greeff, K.; Köhler, E.; Strobach, H.; Verspohl, E. Zur Pharmakokinetik des g-Strophanthins. In Verhandlungen Der Deutschen Gesellschaft für Kreislaufforschung; Steinkopff: Heidelberg, Germany, 1974; pp. 301–305. [Google Scholar] [CrossRef]
- Selden, R.; Smith, T.W. Ouabain pharmacokinetics in dog and man. Determination by radioimmunoassay. Circulation 1972, 45, 1176–1182. [Google Scholar] [CrossRef] [PubMed]
- Kawahara, M.; Sakata, A.; Miyashita, T.; Tamai, I.; Tsuji, A. Physiologically based pharmacokinetics of digoxin in mdr1a knockout mice. J. Pharm. Sci. 1999, 88, 1281–1287. [Google Scholar] [CrossRef] [PubMed]
- Cooke, D.M. The use of central nervous system manifestations in the early detection of digitalis toxicity. Heart Lung. 1993, 22, 477–481. Available online: https://www.ncbi.nlm.nih.gov/pubmed/8288449 (accessed on 1 February 2024). [PubMed]
- Andersson, K.E.; Bertler, A.; Wettrell, G. Post-mortem distribution and tissue concentrations of digoxin in infants and adults. Acta Paediatr. Scand. 1975, 64, 497–504. [Google Scholar] [CrossRef] [PubMed]
- Keller, S.; Frishman, W.H. Neuropsychiatric effects of cardiovascular drug therapy. Cardiol. Rev. 2003, 11, 73–93. [Google Scholar] [CrossRef]
- Dutta, S.; Marks, B.H.; Schoener, E.P. Accumulation of radioactive cardiac glycosides by various brain regions in relation to the dysrhythmogenic effect. Br. J. Pharmacol. 1977, 59, 101–106. [Google Scholar] [CrossRef]
- Lingrel, J.B.; Croyle, M.L.; Woo, A.L.; Argüello, J.M. Ligand binding sites of Na,K-ATPase. Acta Physiol. Scand. Suppl. 1998, 643, 69–77. Available online: https://www.ncbi.nlm.nih.gov/pubmed/9789548 (accessed on 1 February 2024).
- Jahrmärker, H. Digitalistherapie: Beiträge zur Pharmakologie und Klinik; Springer: Berlin/Heidelberg, Germany, 2013; Available online: https://play.google.com/store/books/details?id=y0CpBgAAQBAJ (accessed on 1 February 2024).
- Russell, J.Q.; Klaassen, C.D. Species variation in the biliary excretion of ouabain. J. Pharmacol. Exp. Ther. 1972, 183, 513–519. Available online: https://www.ncbi.nlm.nih.gov/pubmed/4636390 (accessed on 1 February 2024).
- Cohn, K.E.; Kleiger, R.E.; Harrison, D.C. Influence of potassium depletion on myocardial concentration of tritiated digoxin. Circ Res. 1967, 20, 473–476. [Google Scholar] [CrossRef]
- Wu, J.; Li, D.; Du, L.; Baldawi, M.; Gable, M.E.; Askari, A.; Liu, L. Ouabain prevents pathological cardiac hypertrophy and heart failure through activation of phosphoinositide 3-kinase α in mouse. Cell Biosci. 2015, 5, 64. [Google Scholar] [CrossRef] [PubMed]
- Deisl, C.; Fine, M.; Moe, O.W.; Hilgemann, D.W. Hypertrophy of human embryonic stem cell-derived cardiomyocytes supported by positive feedback between Ca and diacylglycerol signals. Pflugers Arch. 2019, 471, 1143–1157. [Google Scholar] [CrossRef] [PubMed]
- Farah, A. Lethal dose and average rate of uptake of g-strophanthin in the heart-lung preparation of the dog under varying conditions. J. Pharmacol. Exp. Ther. 1946, 87, 364–374. Available online: https://www.ncbi.nlm.nih.gov/pubmed/20279256 (accessed on 1 February 2024).
- Kupferberg, H.J.; Schankl, L.S. Biliary secretion of ouabain-3H and its uptake by liver slices in the rat. Am. J. Physiol. 1968, 214, 1048–1053. [Google Scholar] [CrossRef] [PubMed]
- Osol, A. Remington’s Pharmaceutical Sciences, 16th ed.; Mack Publishing Company: London, UK, 1980. [Google Scholar]
- Zhang, D.; Wei, C.; Hop, C.E.C.A.; Wright, M.R.; Hu, M.; Lai, Y.; Khojasteh, S.C.; Humphreys, W.G. Intestinal Excretion, Intestinal Recirculation, and Renal Tubule Reabsorption Are Underappreciated Mechanisms That Drive the Distribution and Pharmacokinetic Behavior of Small Molecule Drugs. J. Med. Chem. 2021, 64, 7045–7059. [Google Scholar] [CrossRef]
- Steiness, E. Renal tubular secretion of digoxin. Circulation 1974, 50, 103–107. [Google Scholar] [CrossRef] [PubMed]
- Roman, R.J.; Kauker, M.L. Renal tubular transport of 3H-digoxin in saline diuresis in rats. Circ. Res. 1976, 38, 185–191. [Google Scholar] [CrossRef] [PubMed]
- Li, C.; Liang, D.; Liu, Y.; Shen, C.; Wang, X.; Yang, B.; Li, X.; Wang, W.; Xu, M.; Pu, Z.; et al. Evaluation of the Influence of Zhenwu Tang on the Pharmacokinetics of Digoxin in Rats Using HPLC-MS/MS. Evid. Based Complement. Altern. Med. 2021, 2021, 2673183. [Google Scholar] [CrossRef]
- Forrest, A.B.; Hawley, J.C.; Malone, M.H. Testing for circadian differences in lethality for intravenous ouabain in male mice. J. Ethnopharmacol. 1993, 39, 161–166. [Google Scholar] [CrossRef]
- Erdle, H.P.; Schultz, K.D.; Wetzel, E.; Gross, F. Resorption und Ausscheidung von g-Strophanthin nach intravenöser und perlingualer Gabe [Absorption and excretion of g-strophanthin after intravenous or sublingual administration (author’s transl)]. Dtsch. Med. Wochenschr. 1979, 104, 976–979, In German. [Google Scholar] [CrossRef]
- Manfred, D. May Strophanthin Be a Valuable Cardiac drug? Am. J. Med. Clin. Res. Rev. 2023, 2, 1–6. [Google Scholar] [CrossRef]
- Shevchenko, V.P.; Nagaev, I.Y.; Lopachev, A.V.; Myasoedov, N.F. Synthesis of Deuterium-Labeled Ouabain–an Internal Standard in Toxicological and Pharmacological Studies. Pharm. Chem. J. 2023, 56, 1491–1495. [Google Scholar] [CrossRef]
- Miroshnichenko, I.; Simonov, A.N.; Kuzmin, I.I.; Platova, A.I. Analysis of sparse data in pharmacokinetic studies. Pharmacokinet. Pharmacodyn. 2020, 2, 28–33. [Google Scholar] [CrossRef]

| Tissue | Cmax, ng/g | Tmax, h | AUCt, ng × h/g | AUCinf, ngh/g | MRT, h | T1/2, h | Vz/F, g/kg | Cl/F, g/kg/h | λz, h−1 | Ft/p |
|---|---|---|---|---|---|---|---|---|---|---|
| Brain | – | – | – | – | – | – | – | – | – | – |
| Blood Plasma | 882.9 ± 21.8 | 0.08 ± 0.01 | 290.8 ± 14.9 | 294.3 ± 14.6 | 0.26 ± 0.01 | 0.15 ± 0.02 | 900 ± 153 | 4259 ± 214 | 4.85 ± 0.8 | 1.00 |
| Cardiac | 145.2 ± 44.0 | 0.08 ± 0.02 | 34.4 ± 8.7 | 47.6 ± 12.9 | 0.38 ± 0.14 | 0.23 ± 0.09 | 9463 ± 3481 | 29144 ± 7223 | 3.42 ± 1.29 | 0.12 |
| Kidney | 1072.3 ± 260.8 | 0.35 ± 0.19 | 872.0 ± 132.6 | 939.1 ± 145.4 | 1.41 ± 0.71 | 1.32 ± 0.76 | 2583 ± 1321 | 1402 ± 229 | 0.68 ± 0.36 | 3.00 |
| Liver | 2558.0 ± 382.4 | 0.35 ± 0.13 | 2084.6 ± 389.5 | 2207.6 ± 338.8 | 0.98 ± 0.33 | 1.24 ± 0.7 | 1043 ± 564 | 584 ± 97 | 0.7 ± 0.44 | 7.17 |
| Parameter | Value | Unit |
|---|---|---|
| Nebulizer Gas Flow Rate | 1.5 | L/min |
| DL Temperature | 250 | C |
| Heat Block Temperature | 400 | C |
| Drying-Gas Flow Rate | 15 | L/min |
| CID Gas | 230 | kPa |
Disclaimer/Publisher’s Note: The statements, opinions and data contained in all publications are solely those of the individual author(s) and contributor(s) and not of MDPI and/or the editor(s). MDPI and/or the editor(s) disclaim responsibility for any injury to people or property resulting from any ideas, methods, instructions or products referred to in the content. |
© 2024 by the authors. Licensee MDPI, Basel, Switzerland. This article is an open access article distributed under the terms and conditions of the Creative Commons Attribution (CC BY) license (https://creativecommons.org/licenses/by/4.0/).
Share and Cite
Abaimov, D.A.; Kazanskaya, R.B.; Ageldinov, R.A.; Nesterov, M.S.; Timoshina, Y.A.; Platova, A.I.; Aristova, I.J.; Vinogradskaia, I.S.; Fedorova, T.N.; Volnova, A.B.; et al. Evaluation of Ouabain’s Tissue Distribution in C57/Black Mice Following Intraperitoneal Injection, Using Chromatography and Mass Spectrometry. Int. J. Mol. Sci. 2024, 25, 4318. https://doi.org/10.3390/ijms25084318
Abaimov DA, Kazanskaya RB, Ageldinov RA, Nesterov MS, Timoshina YA, Platova AI, Aristova IJ, Vinogradskaia IS, Fedorova TN, Volnova AB, et al. Evaluation of Ouabain’s Tissue Distribution in C57/Black Mice Following Intraperitoneal Injection, Using Chromatography and Mass Spectrometry. International Journal of Molecular Sciences. 2024; 25(8):4318. https://doi.org/10.3390/ijms25084318
Chicago/Turabian StyleAbaimov, Denis A., Rogneda B. Kazanskaya, Ruslan A. Ageldinov, Maxim S. Nesterov, Yulia A. Timoshina, Angelina I. Platova, Irina J. Aristova, Irina S. Vinogradskaia, Tatiana N. Fedorova, Anna B. Volnova, and et al. 2024. "Evaluation of Ouabain’s Tissue Distribution in C57/Black Mice Following Intraperitoneal Injection, Using Chromatography and Mass Spectrometry" International Journal of Molecular Sciences 25, no. 8: 4318. https://doi.org/10.3390/ijms25084318
APA StyleAbaimov, D. A., Kazanskaya, R. B., Ageldinov, R. A., Nesterov, M. S., Timoshina, Y. A., Platova, A. I., Aristova, I. J., Vinogradskaia, I. S., Fedorova, T. N., Volnova, A. B., Gainetdinov, R. R., & Lopachev, A. V. (2024). Evaluation of Ouabain’s Tissue Distribution in C57/Black Mice Following Intraperitoneal Injection, Using Chromatography and Mass Spectrometry. International Journal of Molecular Sciences, 25(8), 4318. https://doi.org/10.3390/ijms25084318