
Low-Protein Diets Differentially Regulate Energy Balance during Thermoneutral and Heat Stress in Cobb Broiler Chicken (Gallus domesticus)


 , , and
Abstract
1. Introduction
2. Results
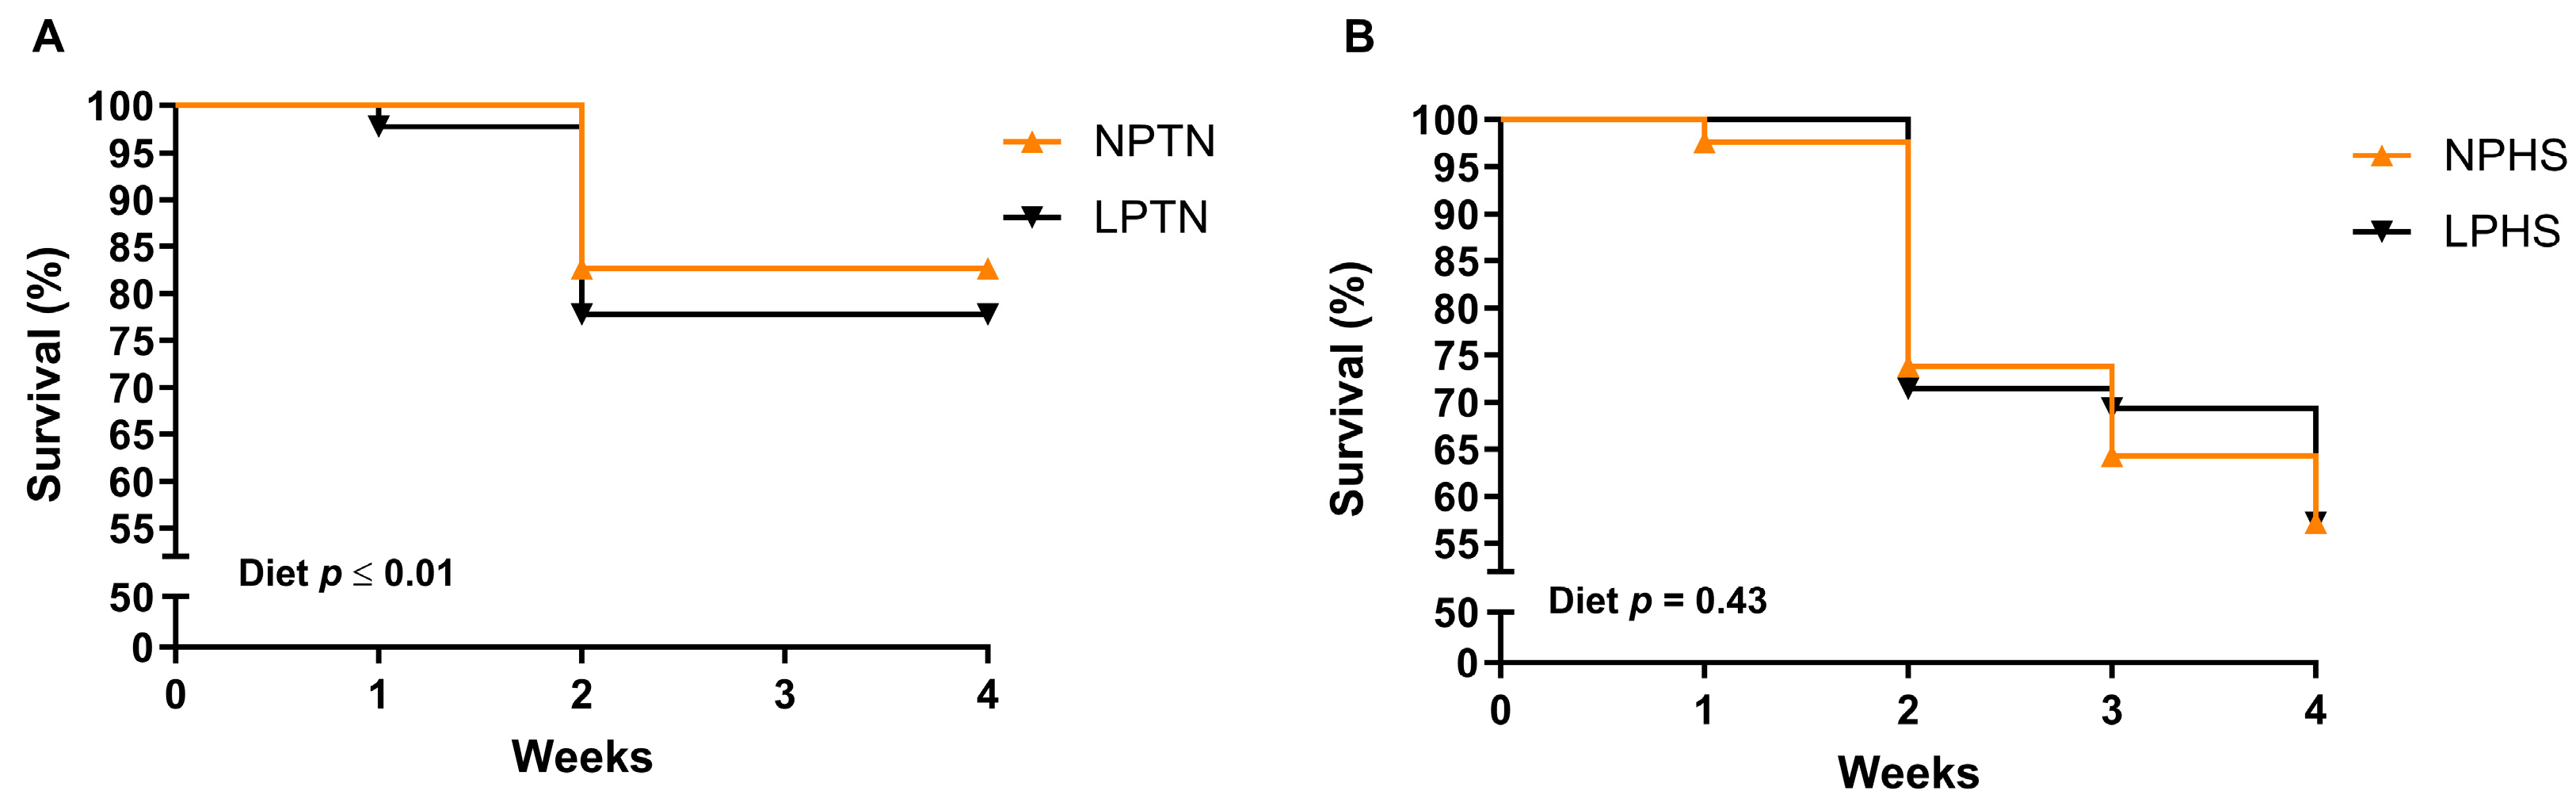
2.1. Survival
2.2. Behavioral Adaptations
2.3. Growth Measurements
2.4. Body Composition Analysis
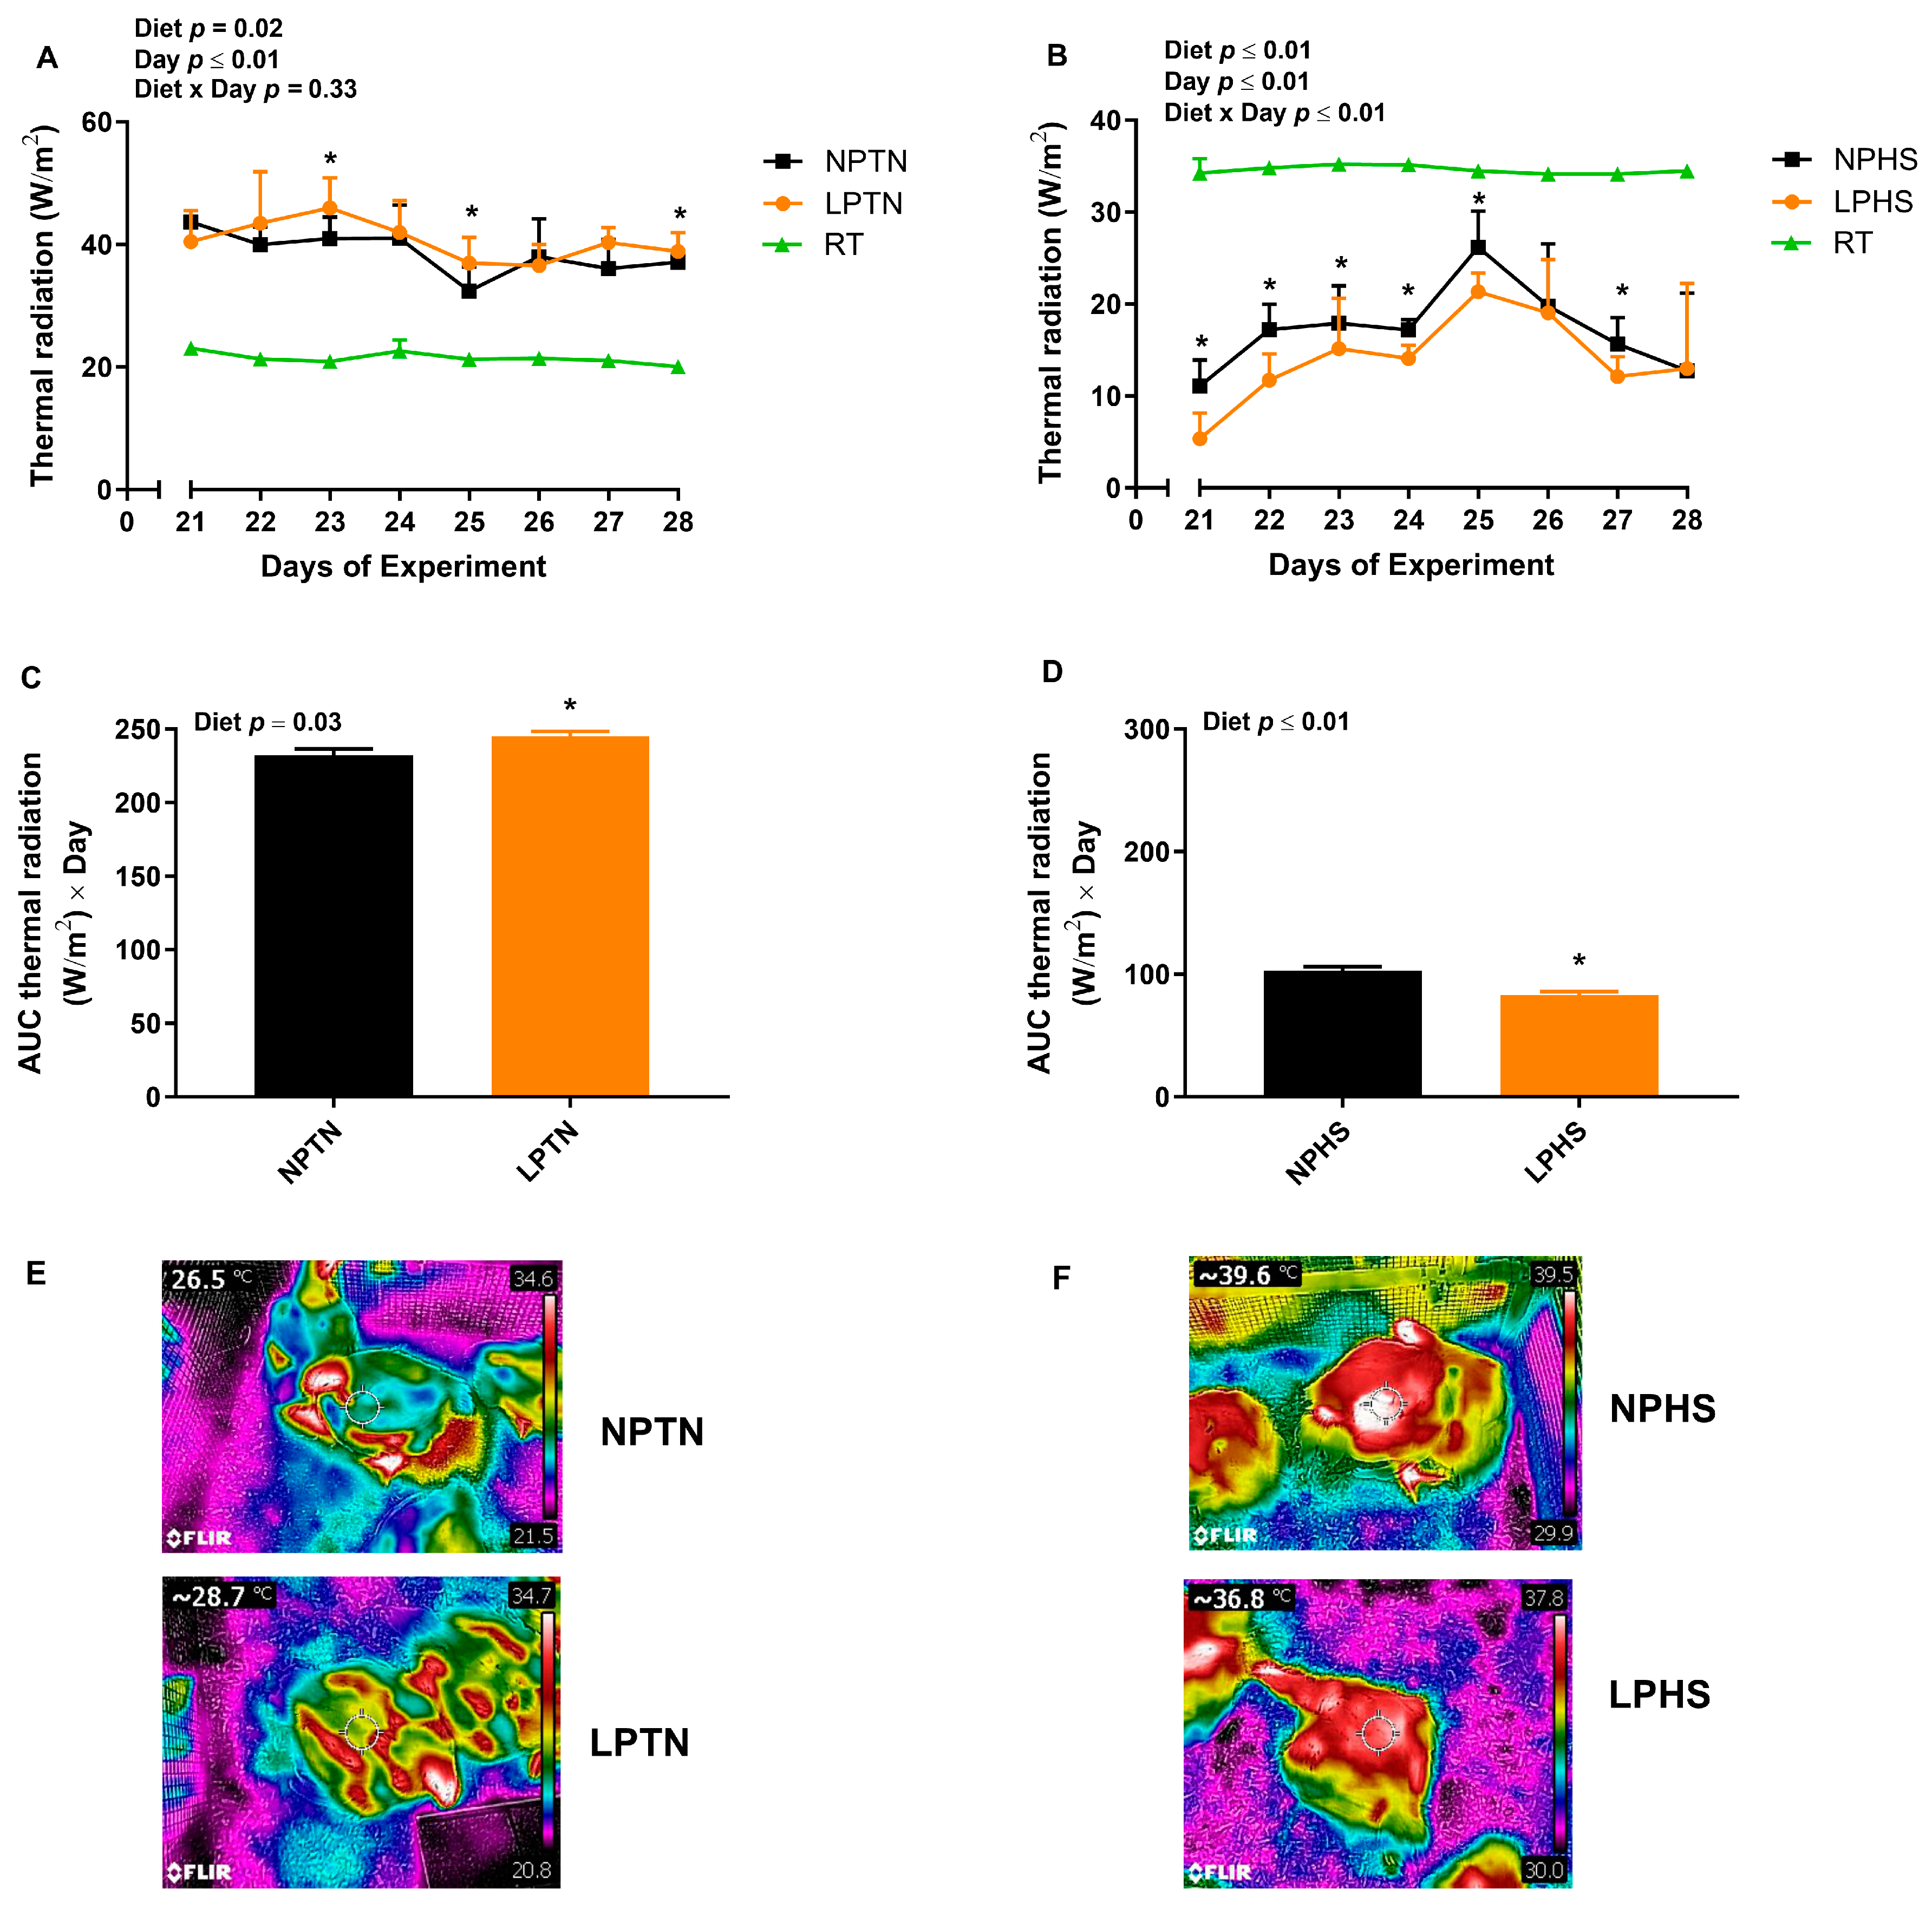
2.5. Radiative Heat Transfer
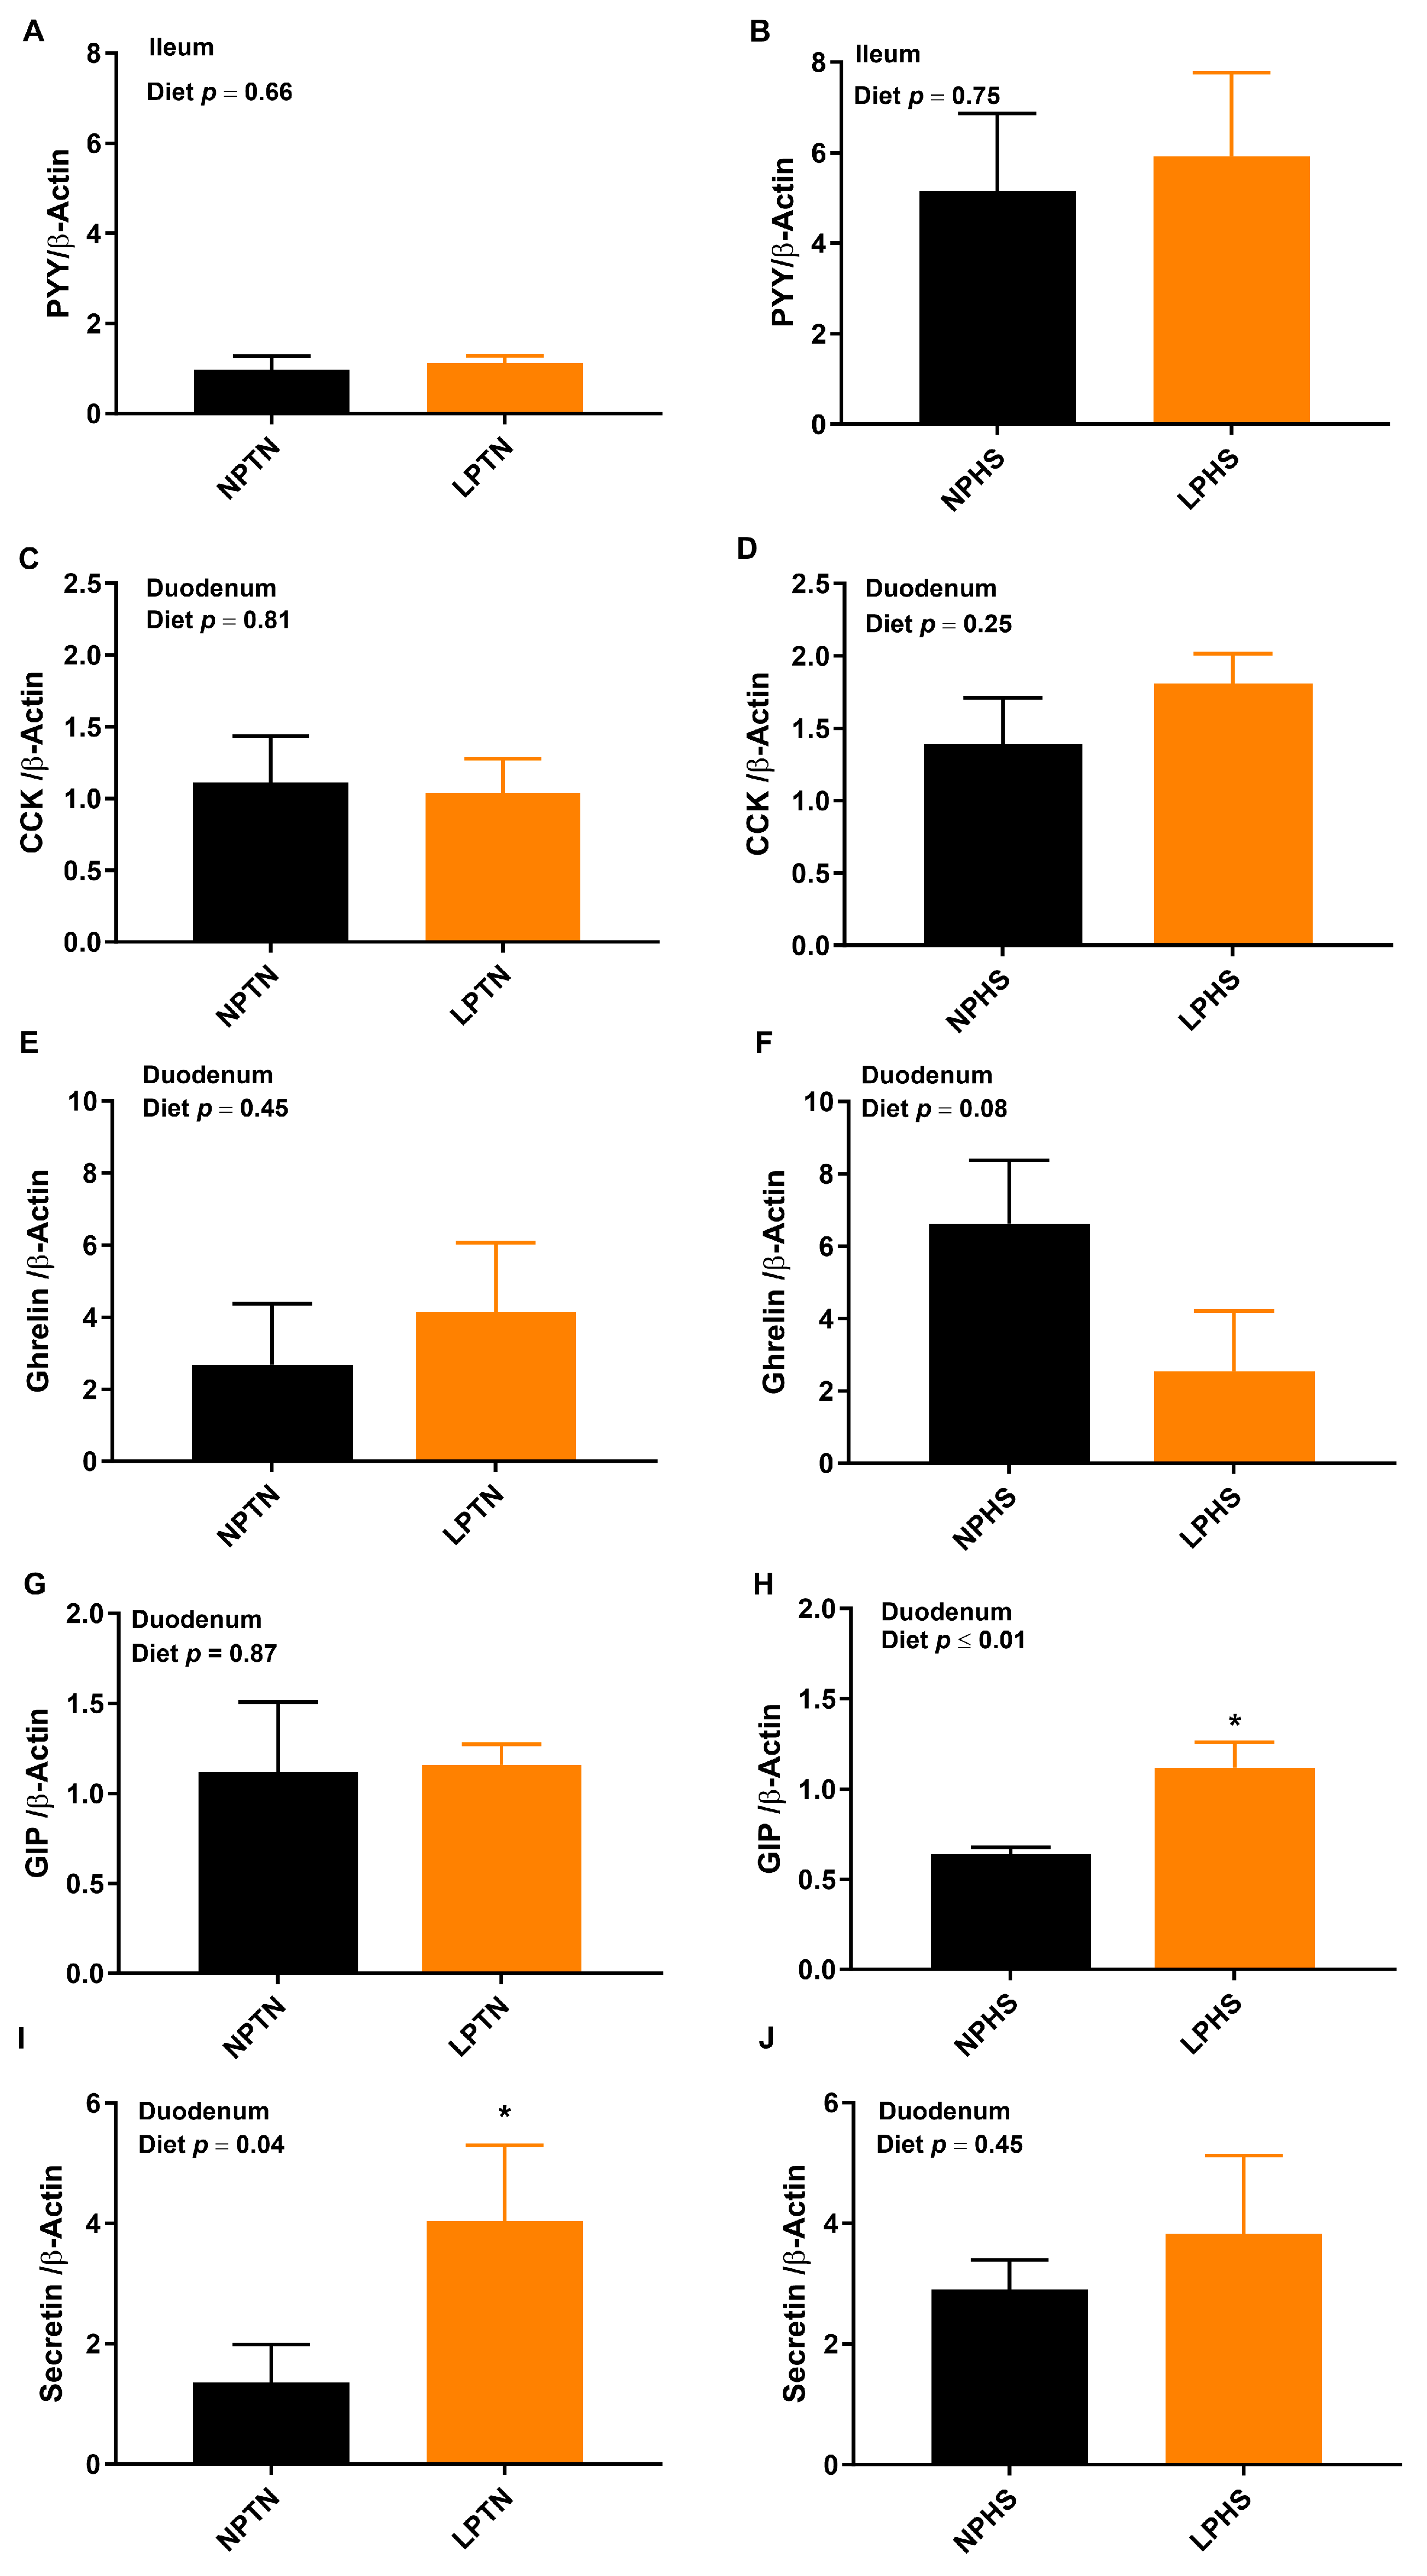
2.6. Reverse Transcription Polymerase Chain Reaction (RT-qPCR)
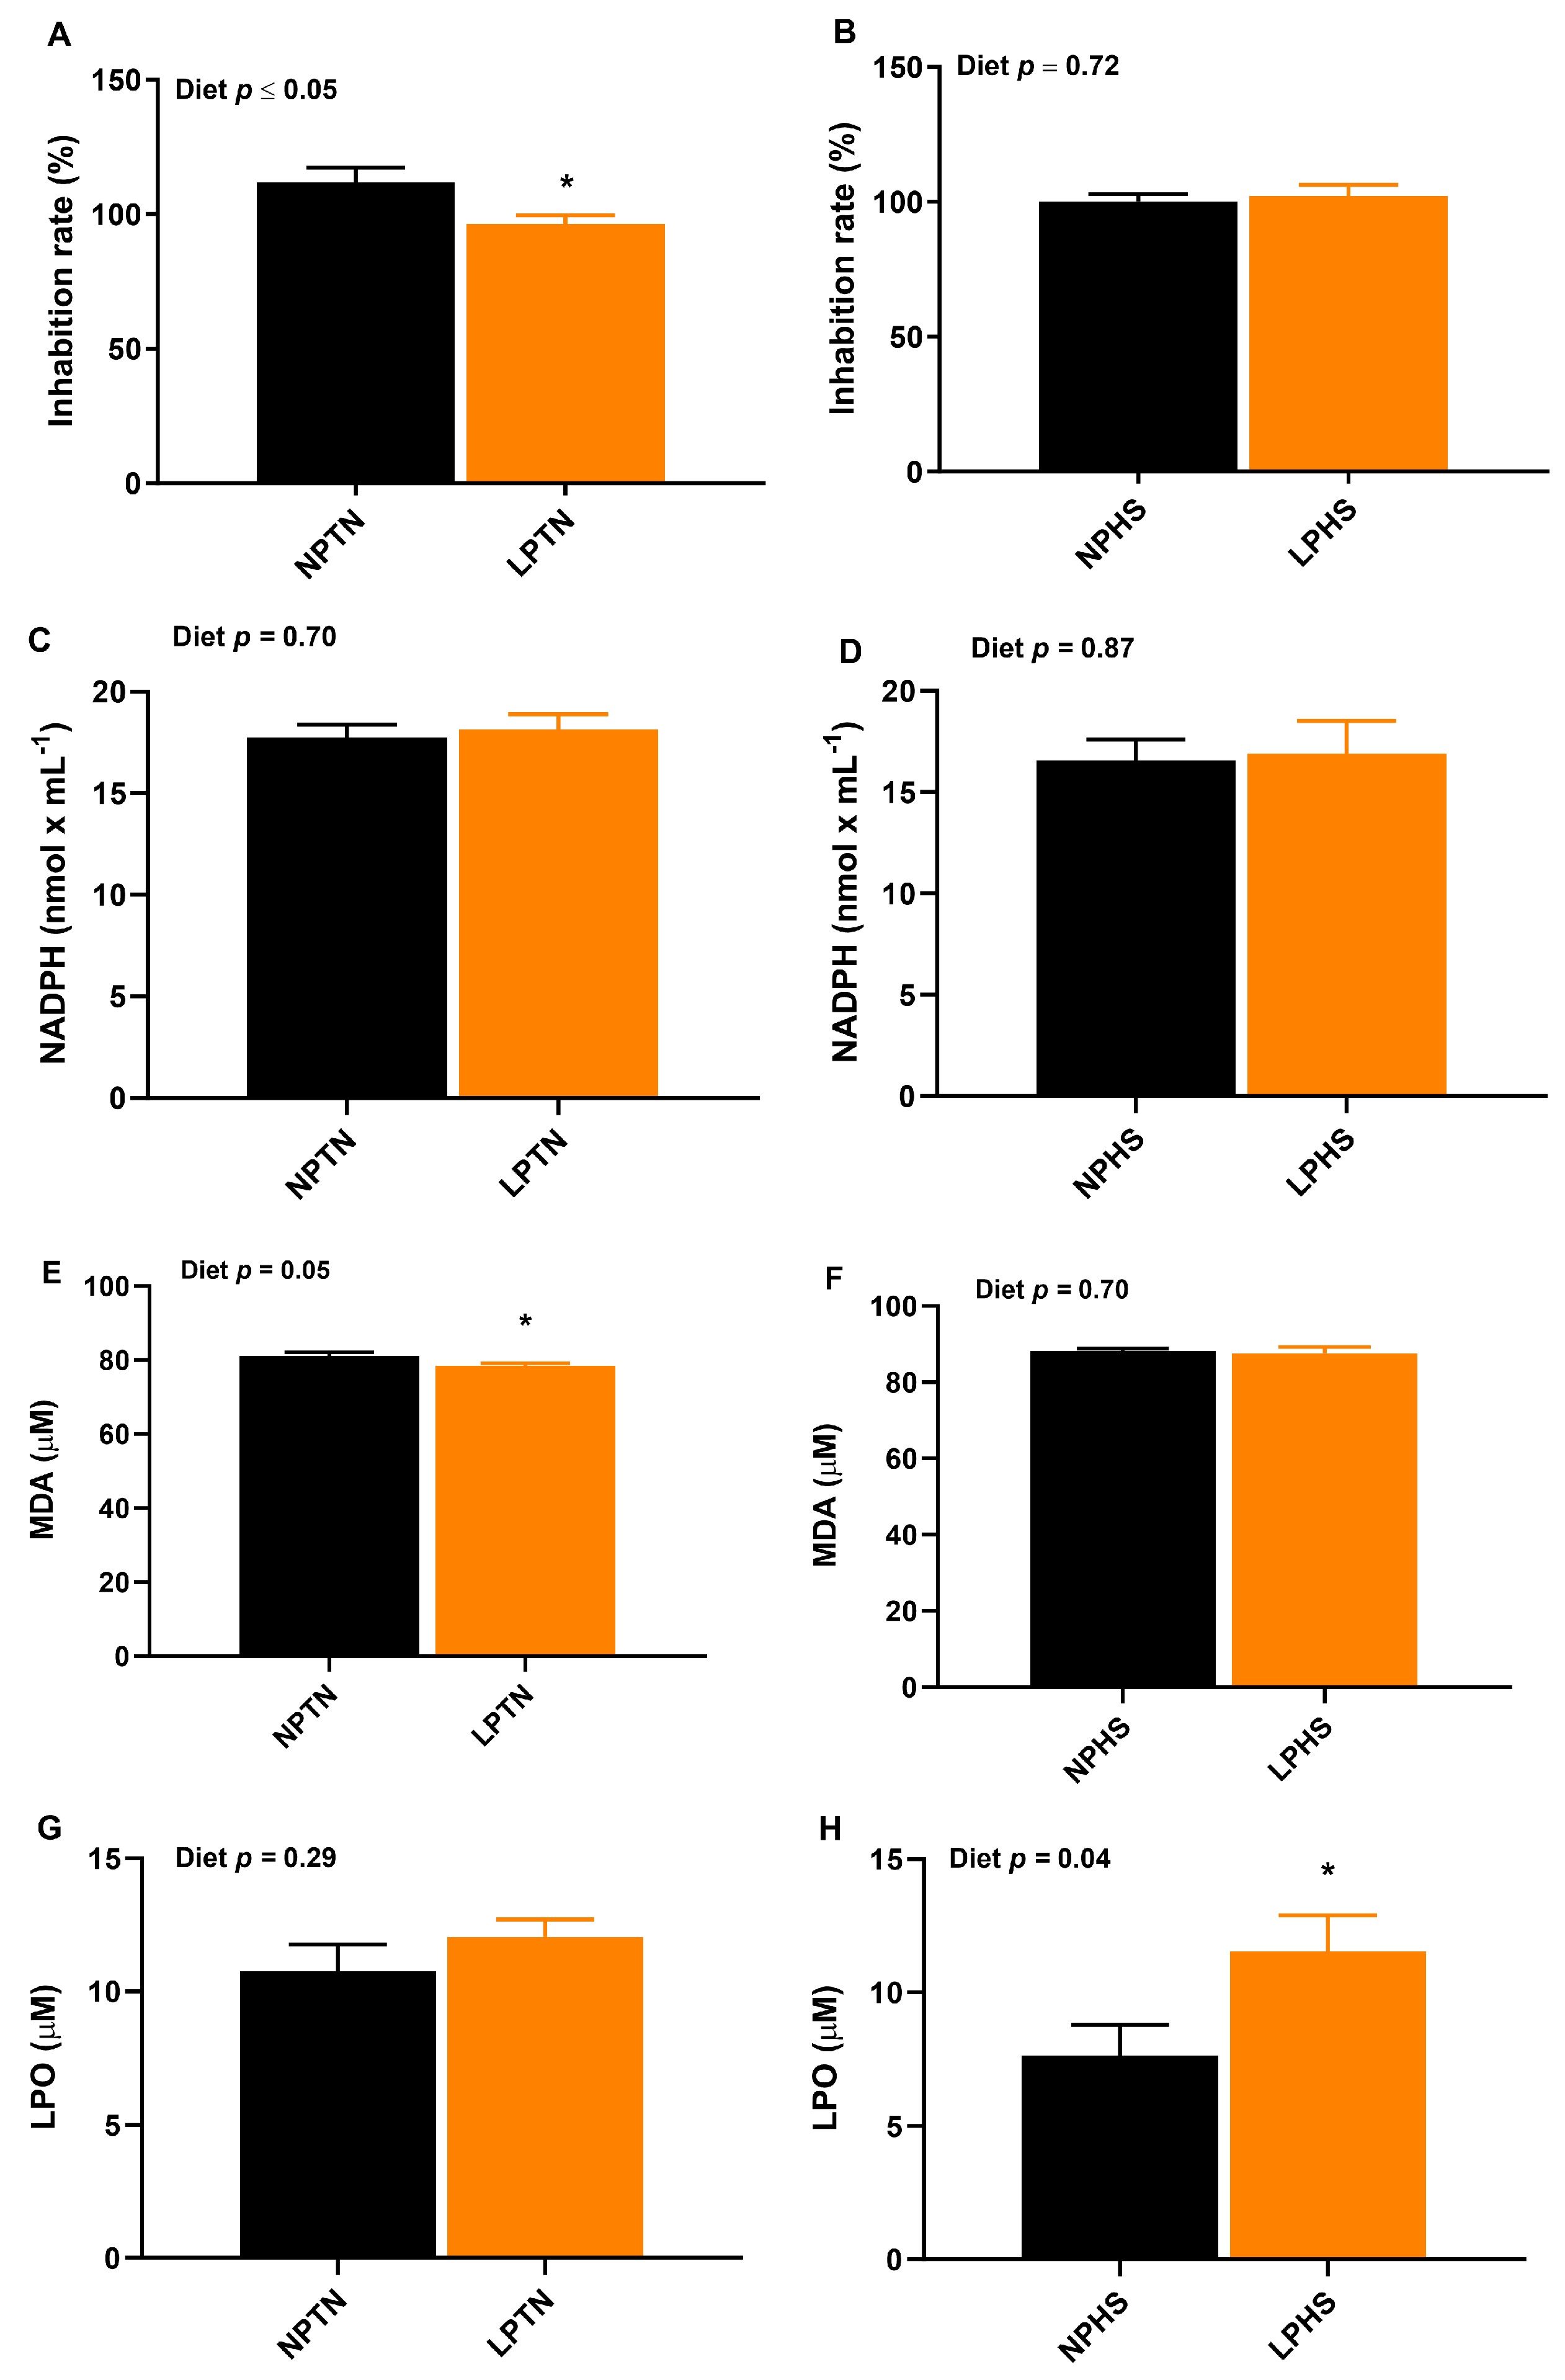
2.7. Oxidative Stress Biomarkers in Plasma
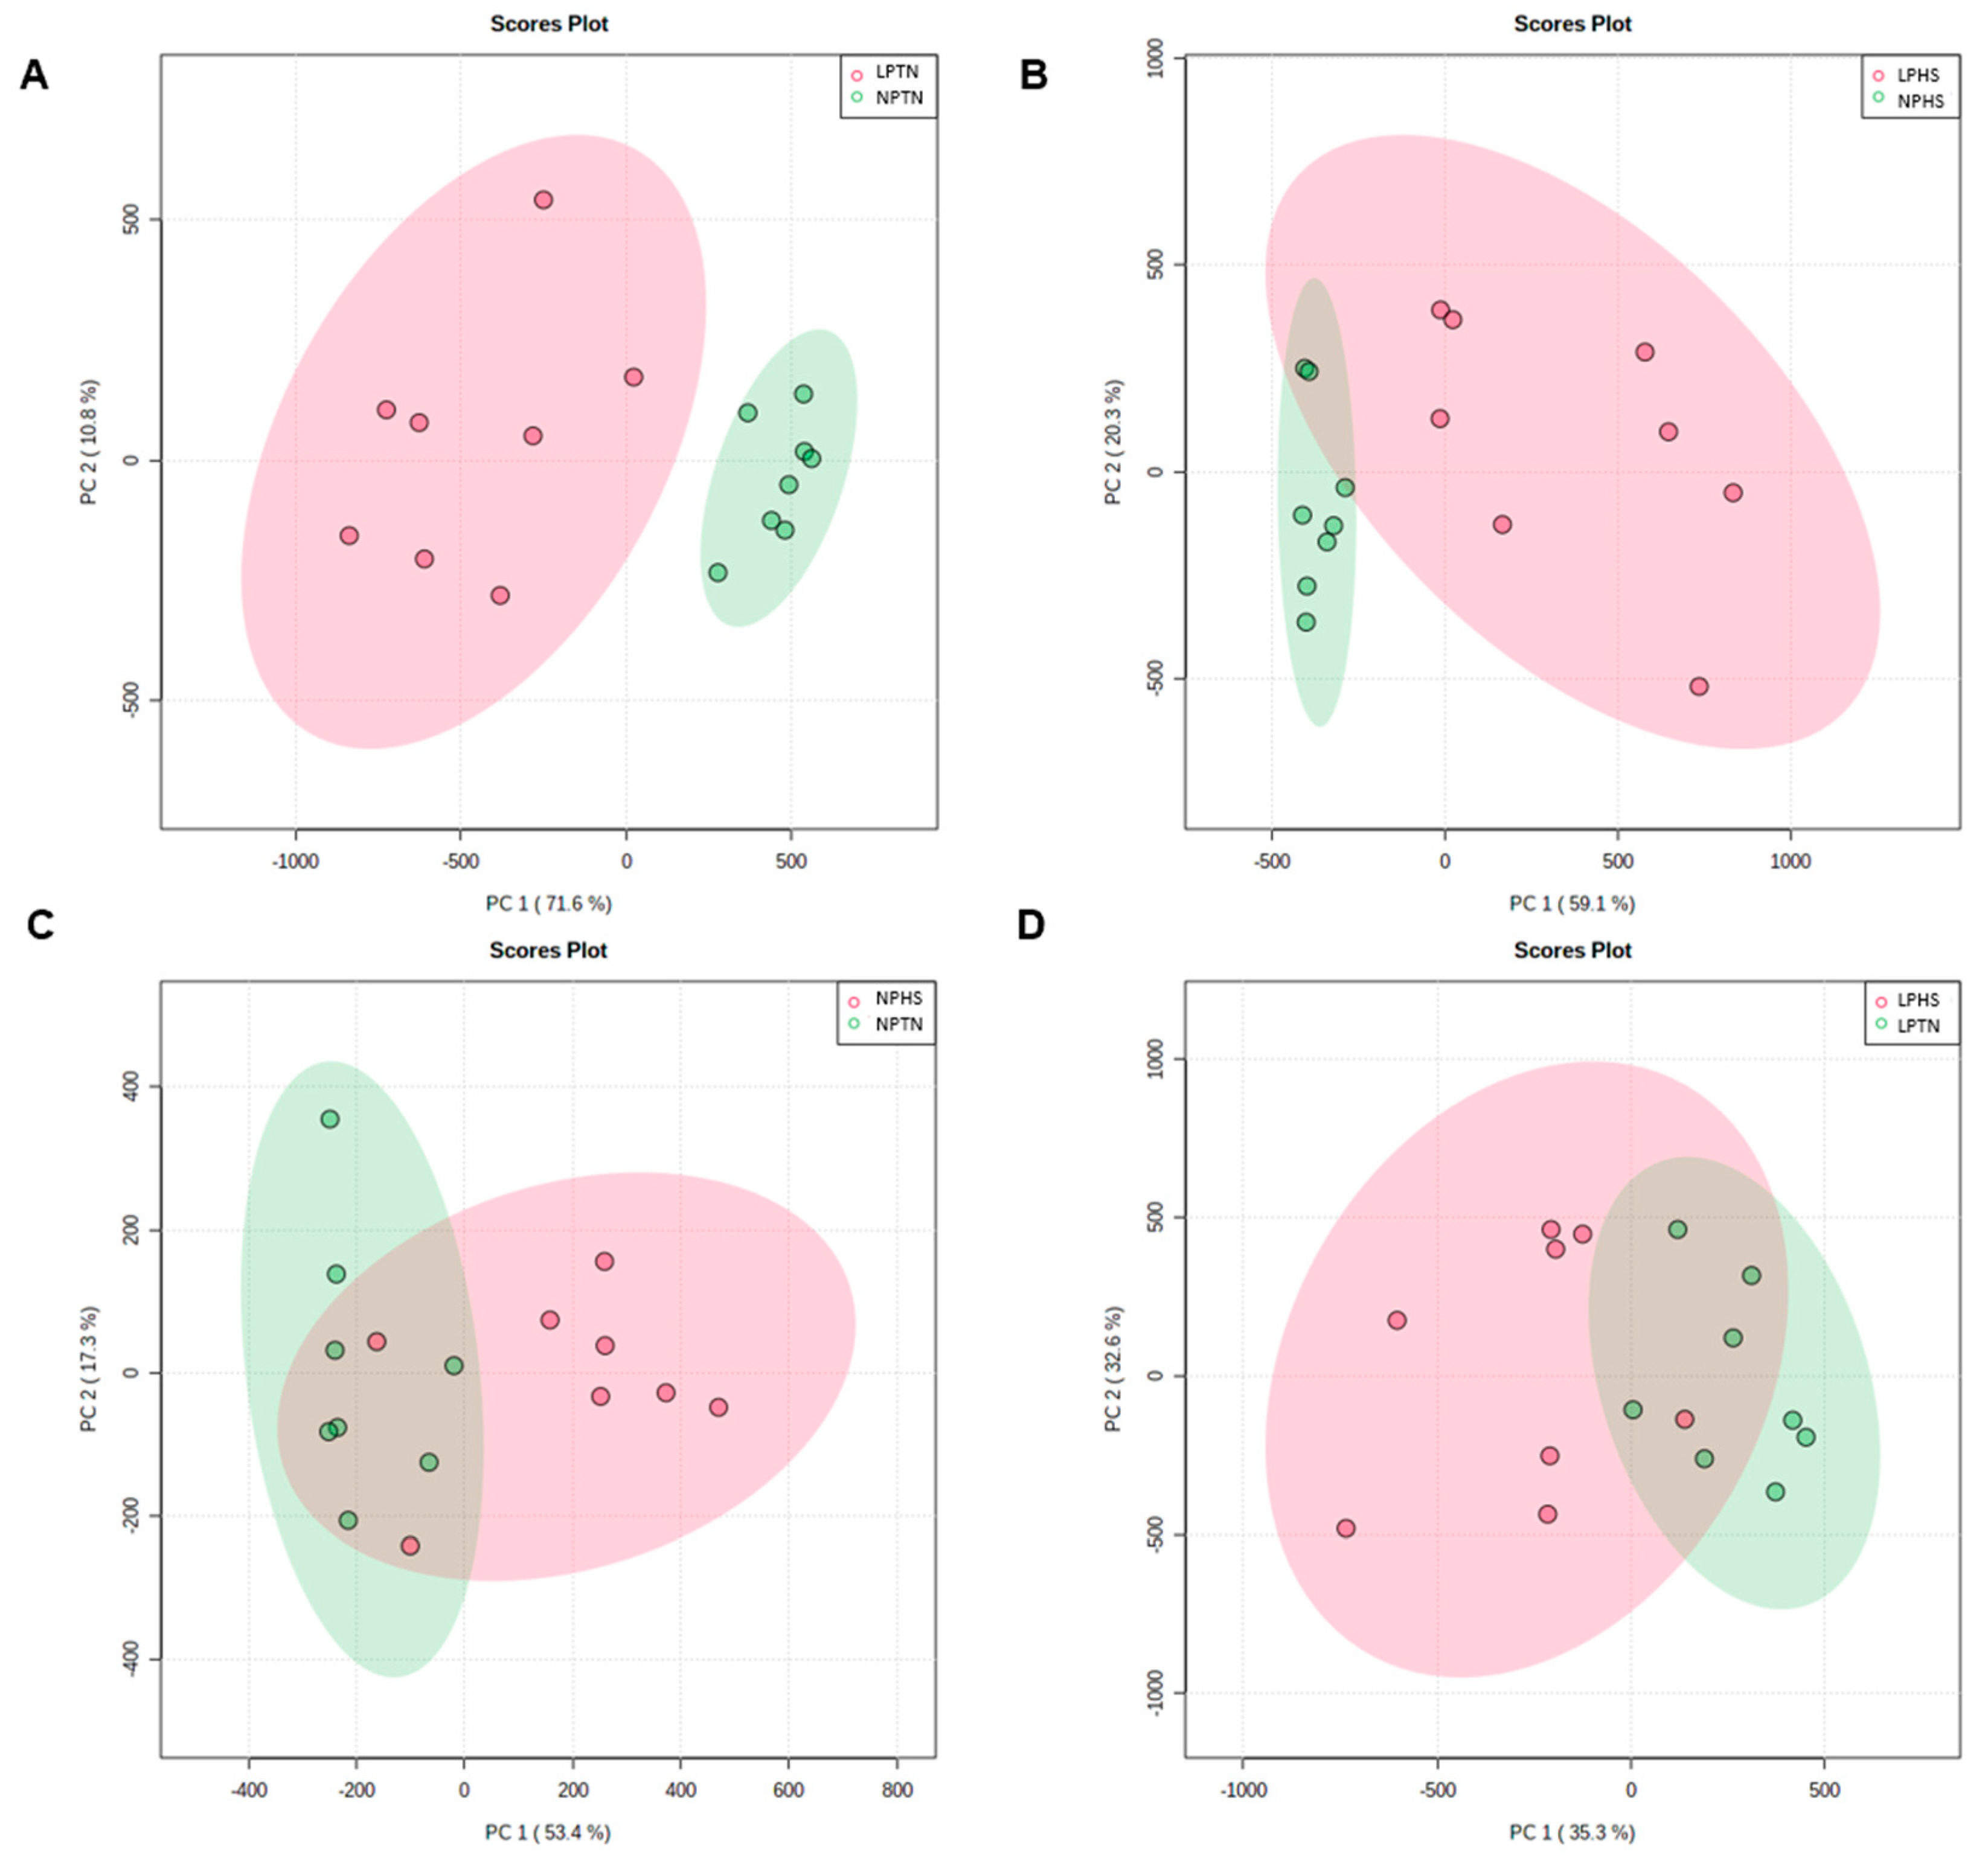
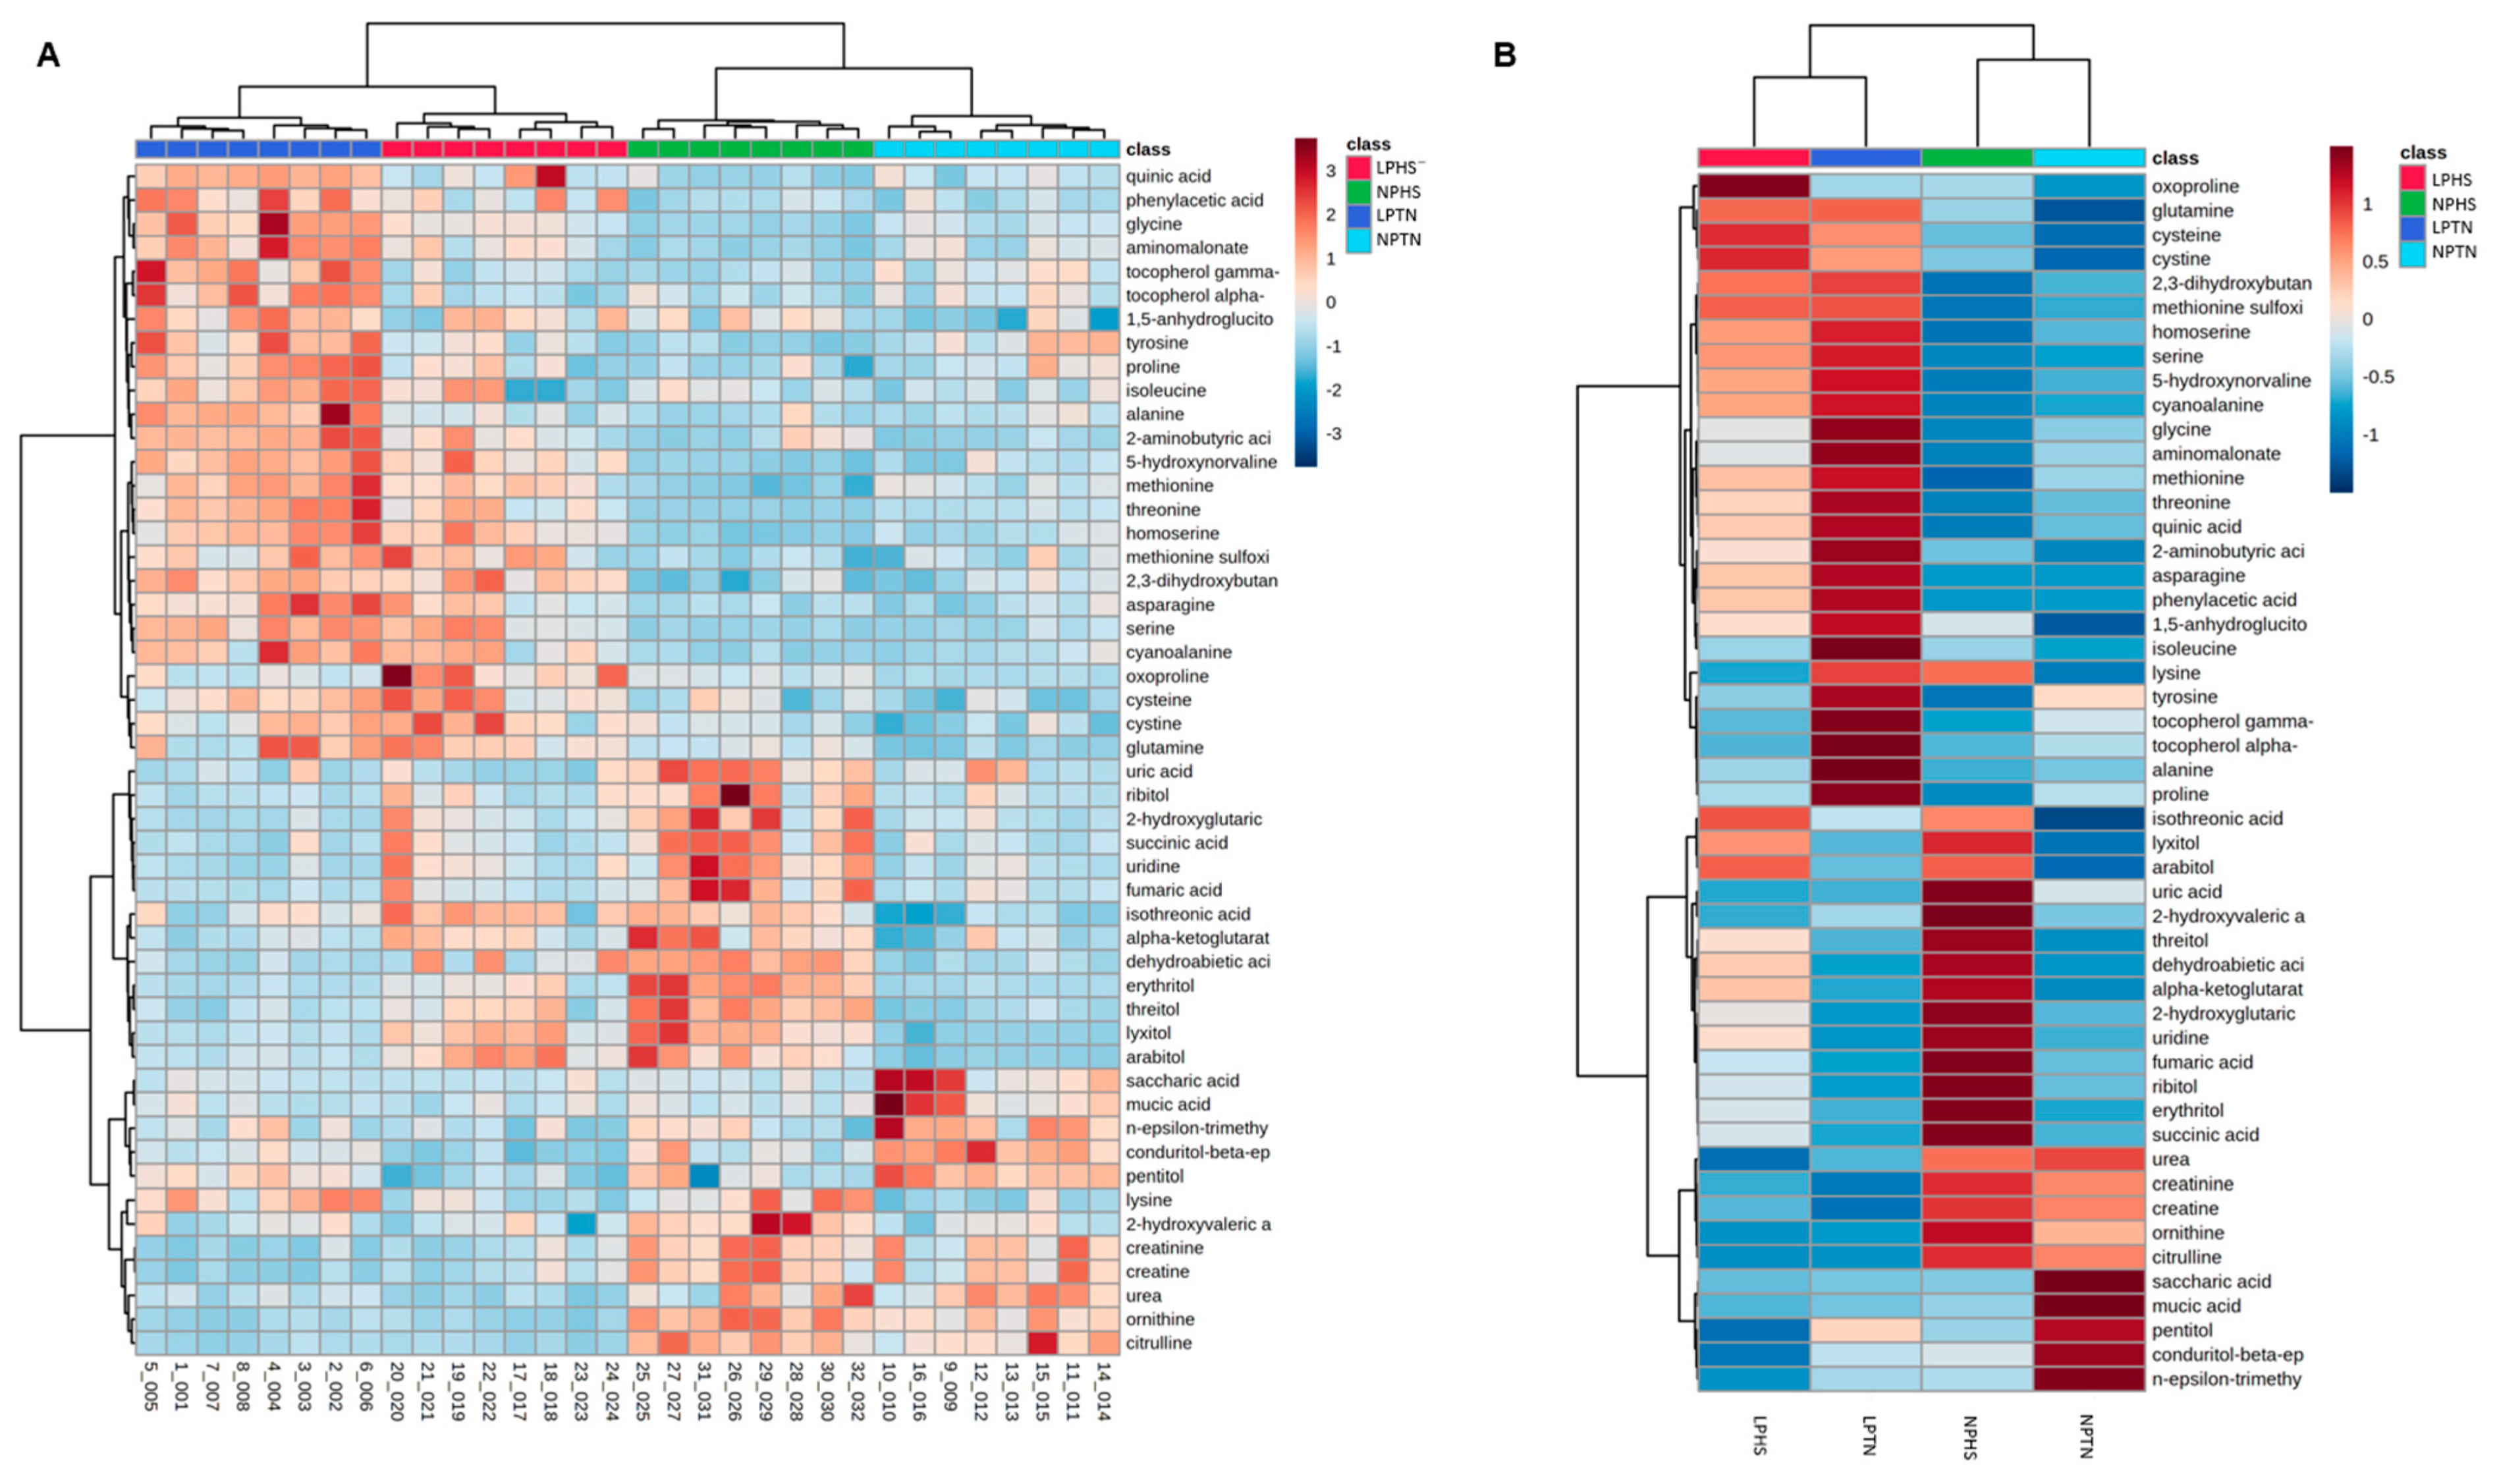
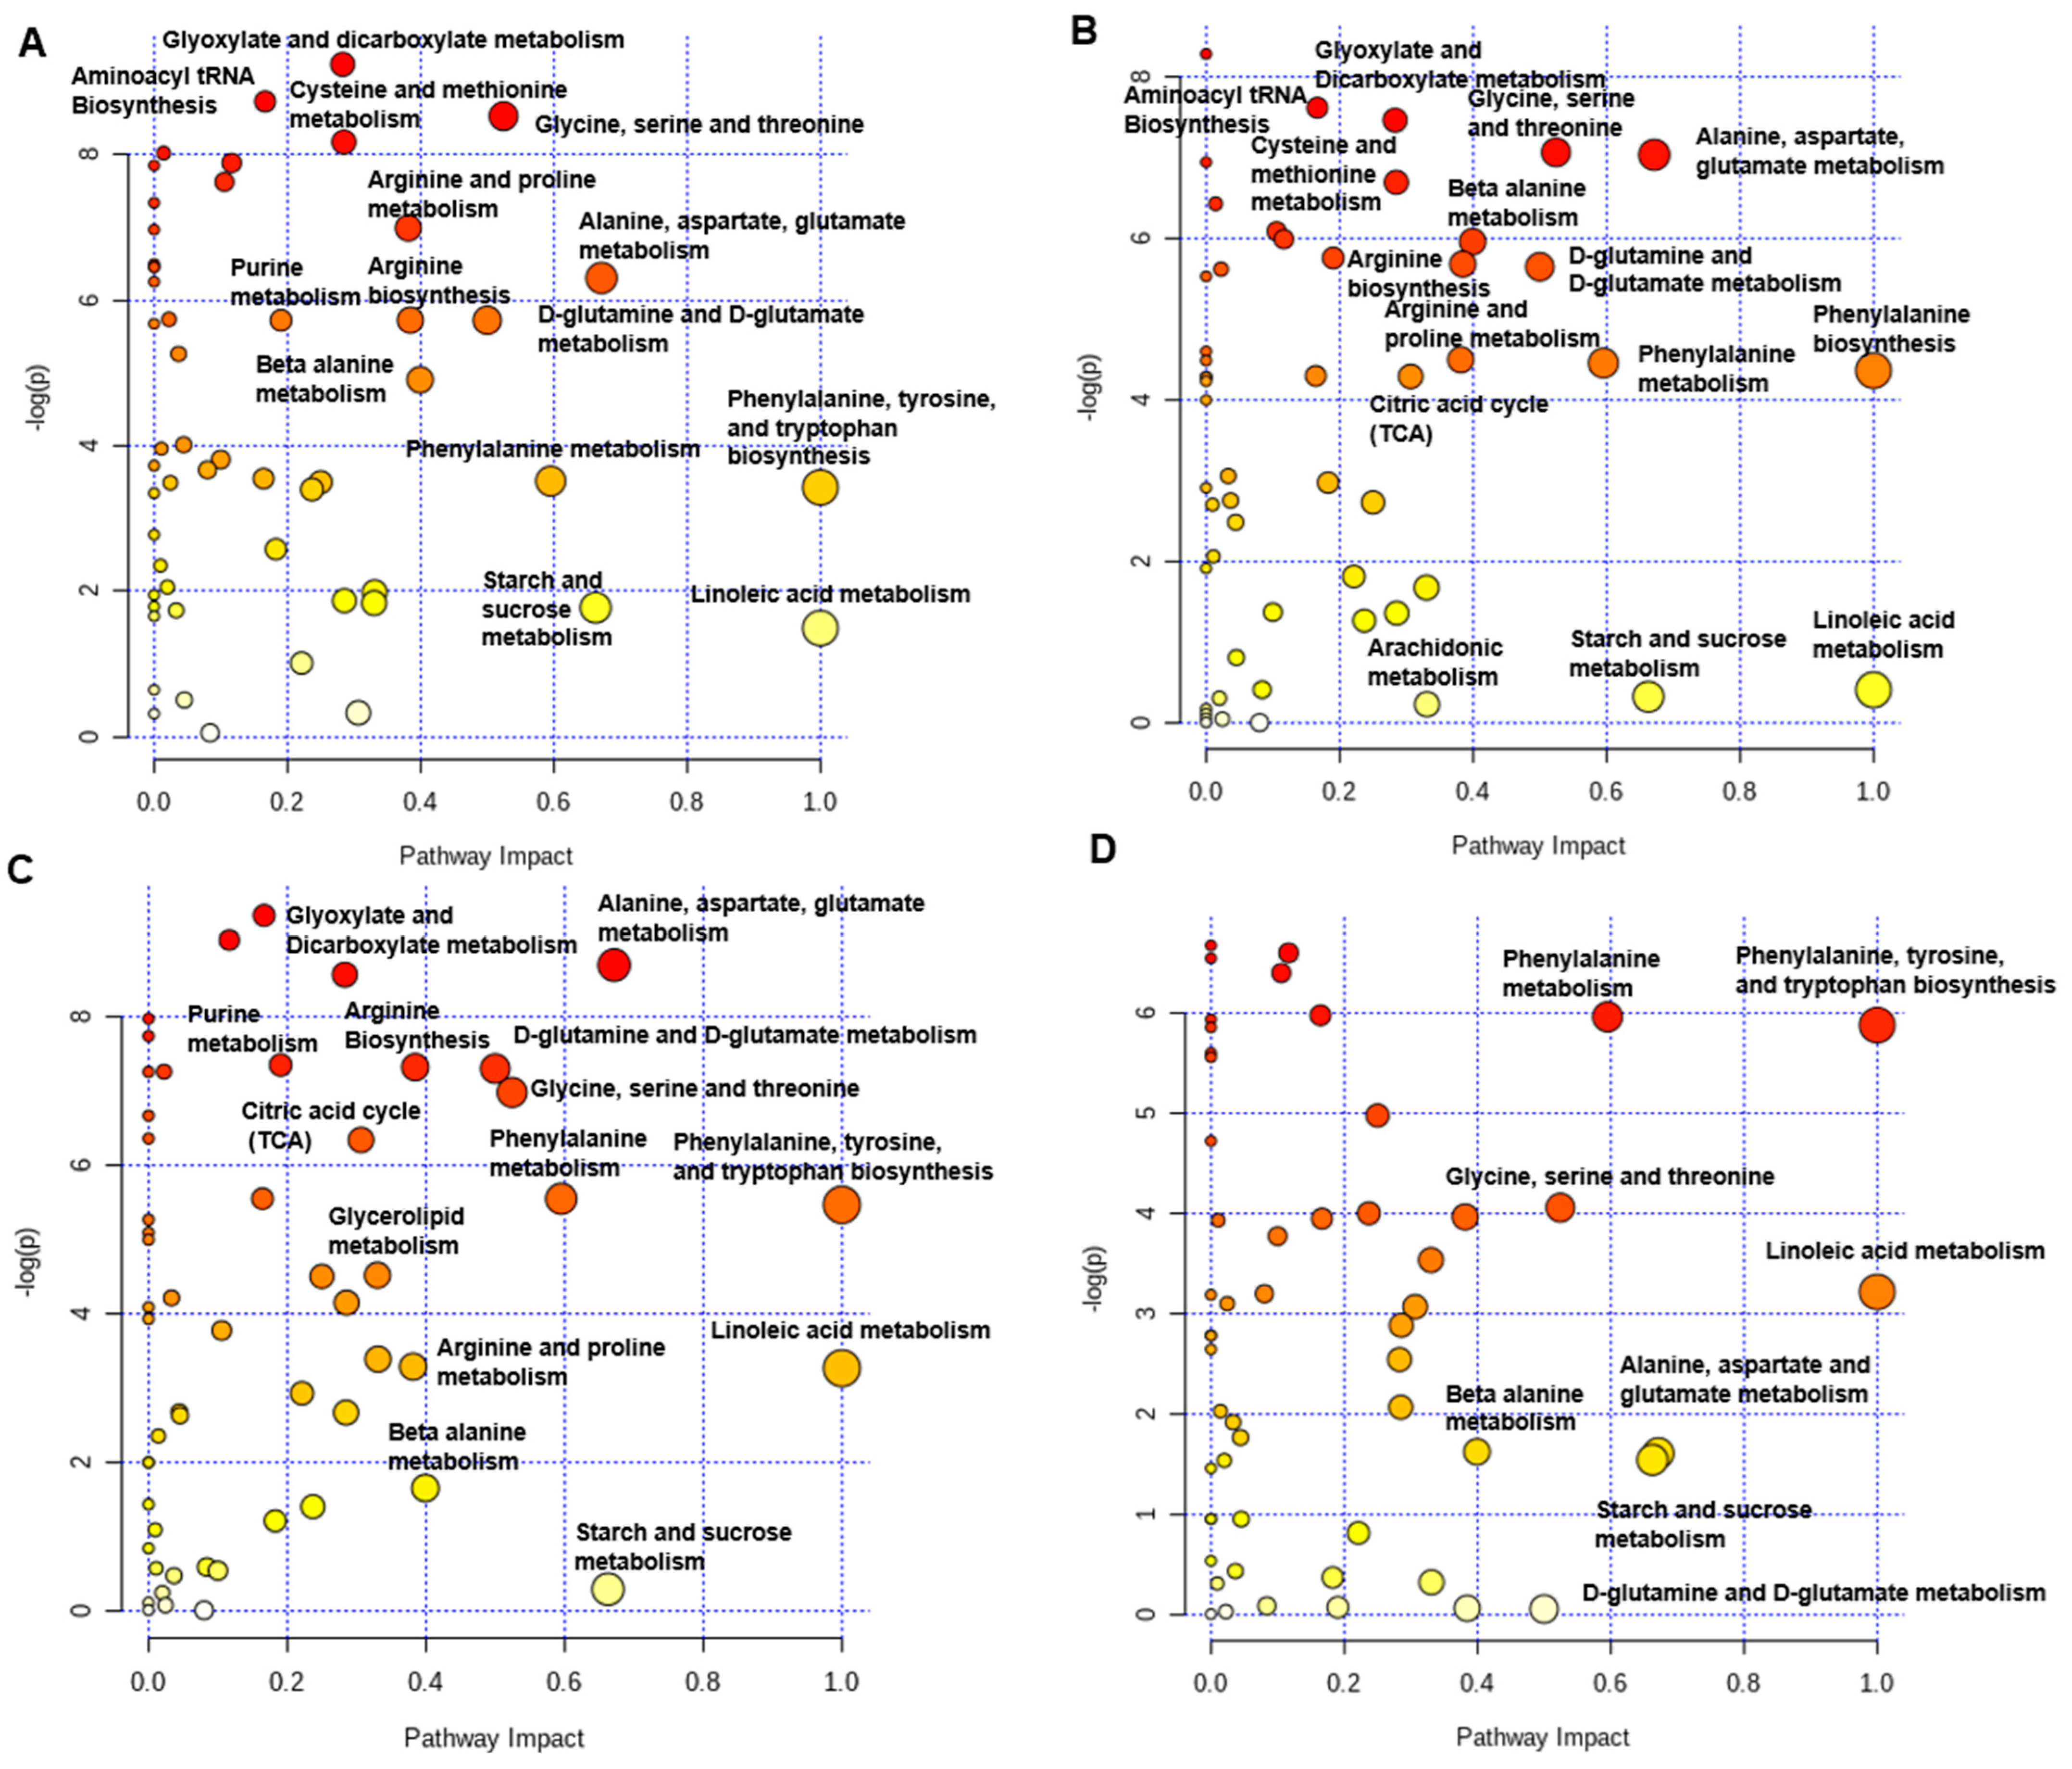
2.8. Plasma Metabolites
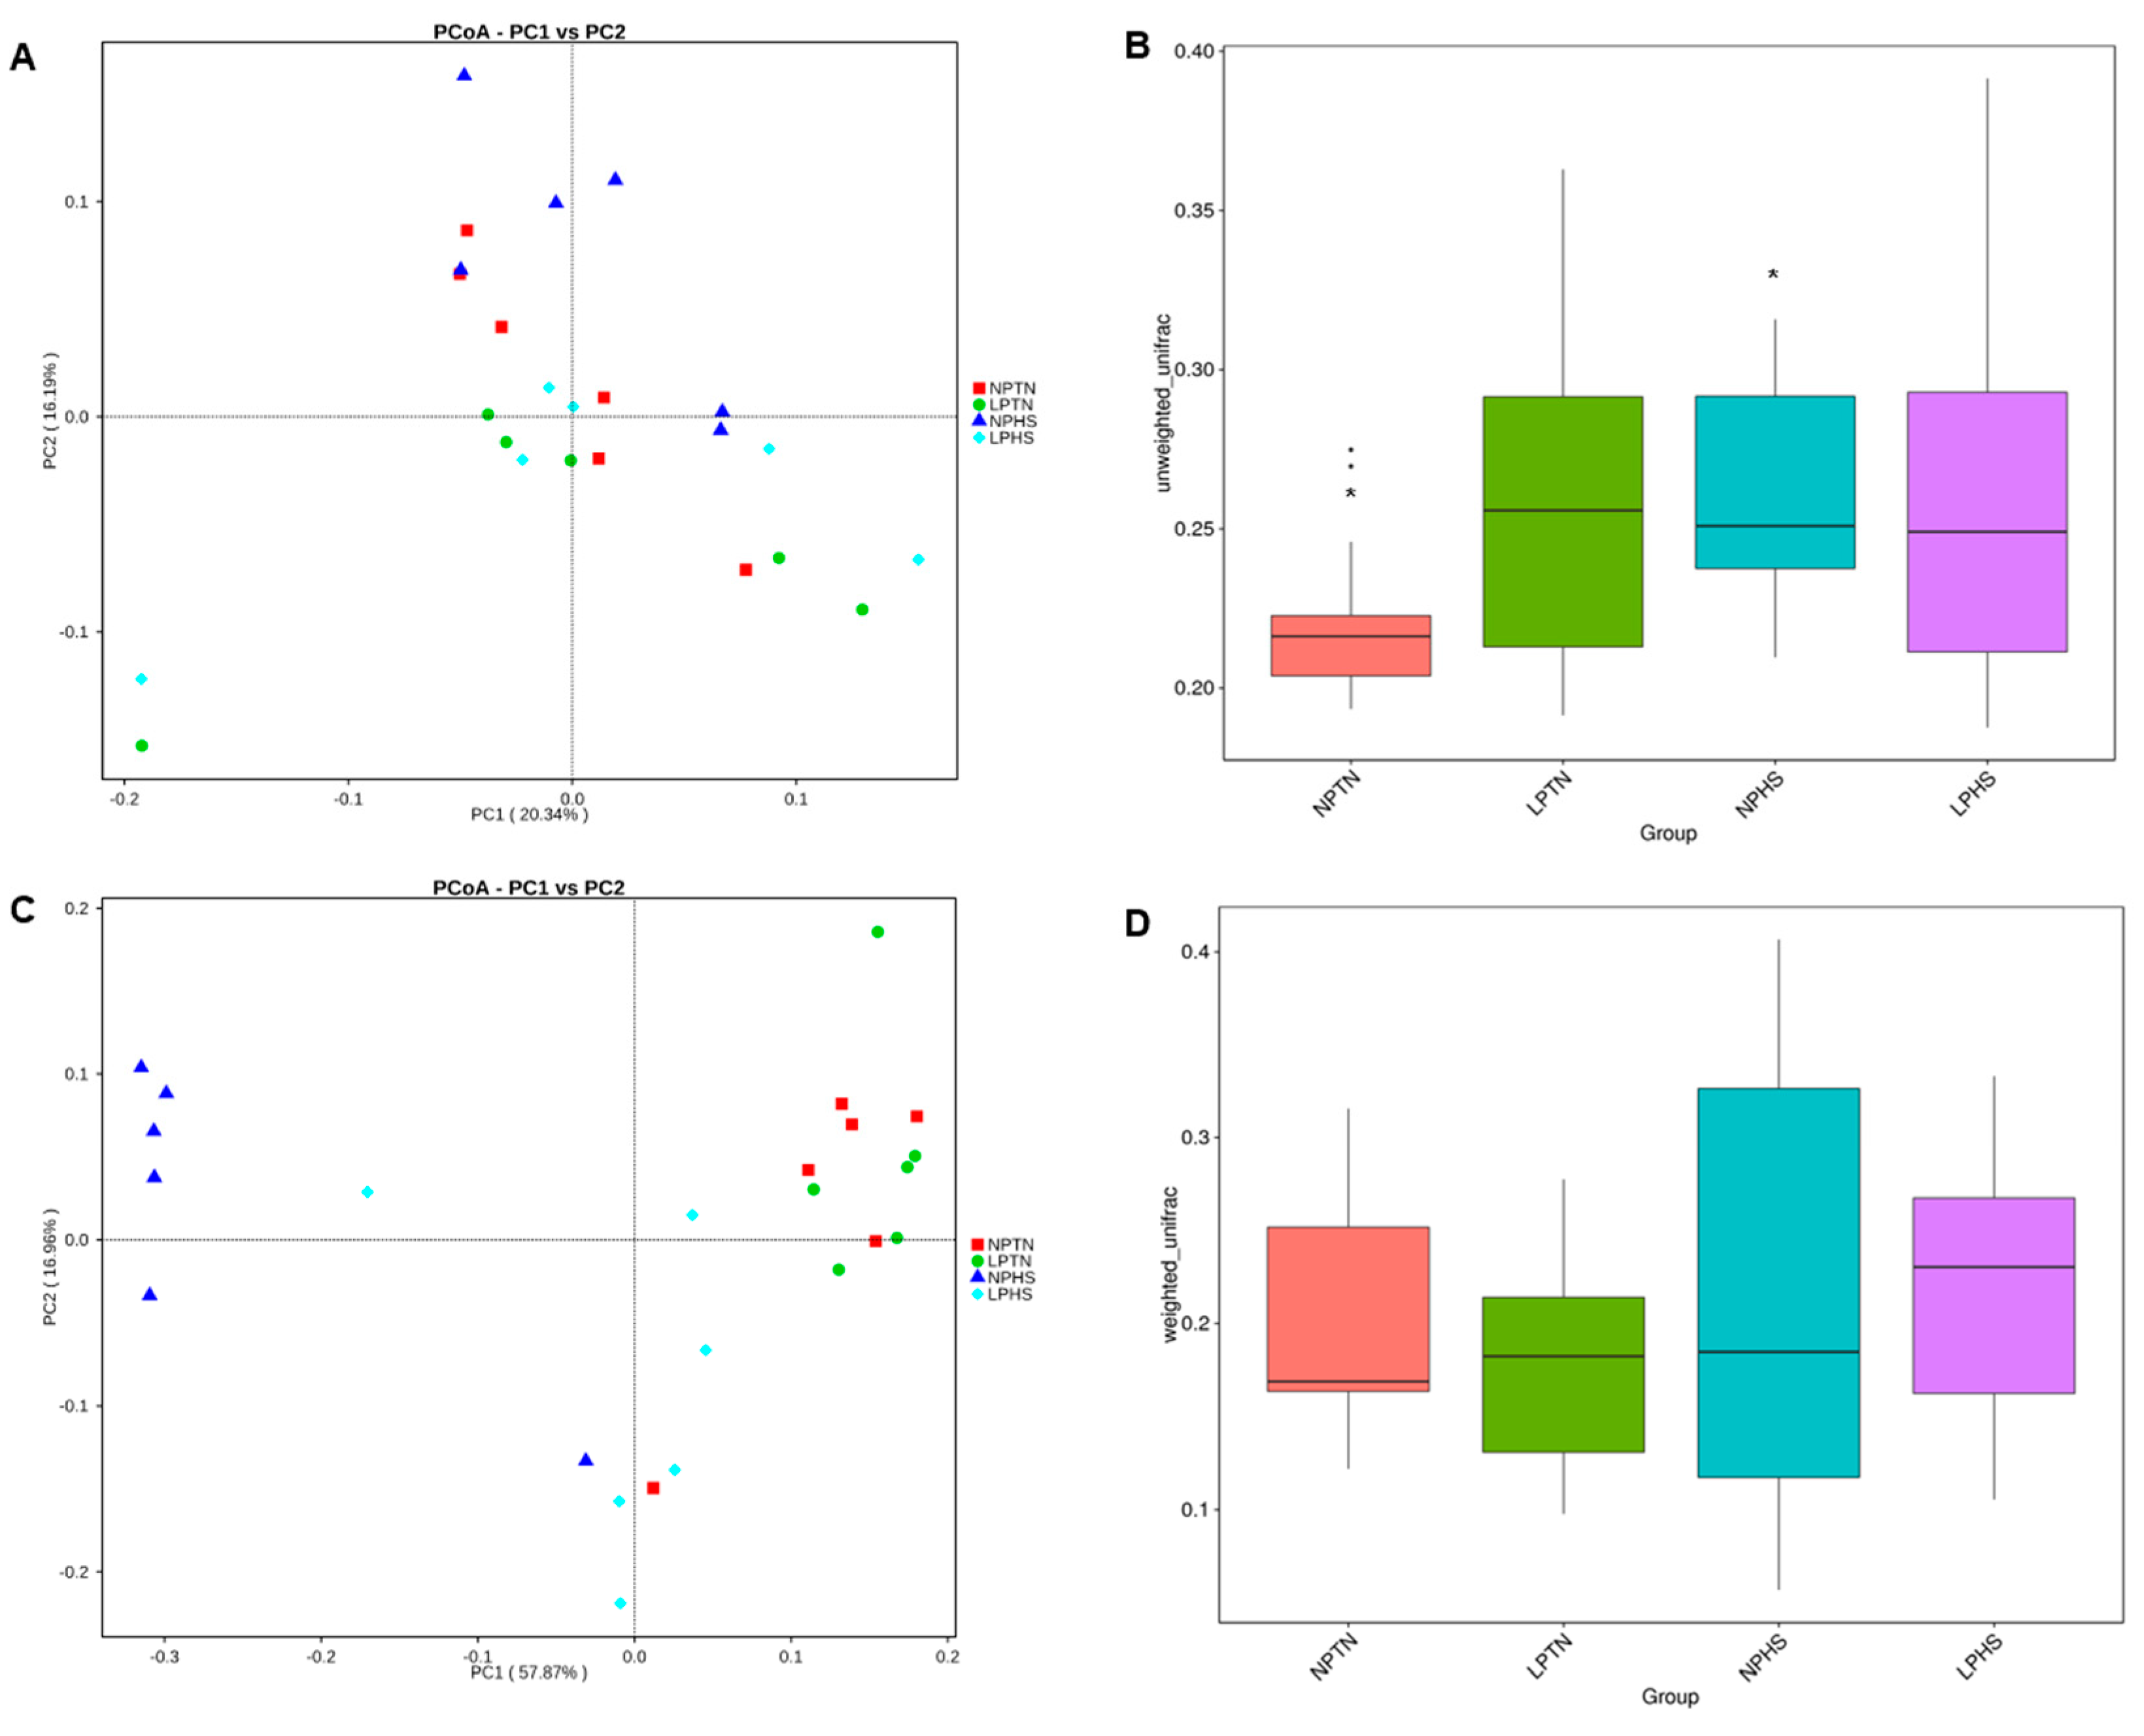
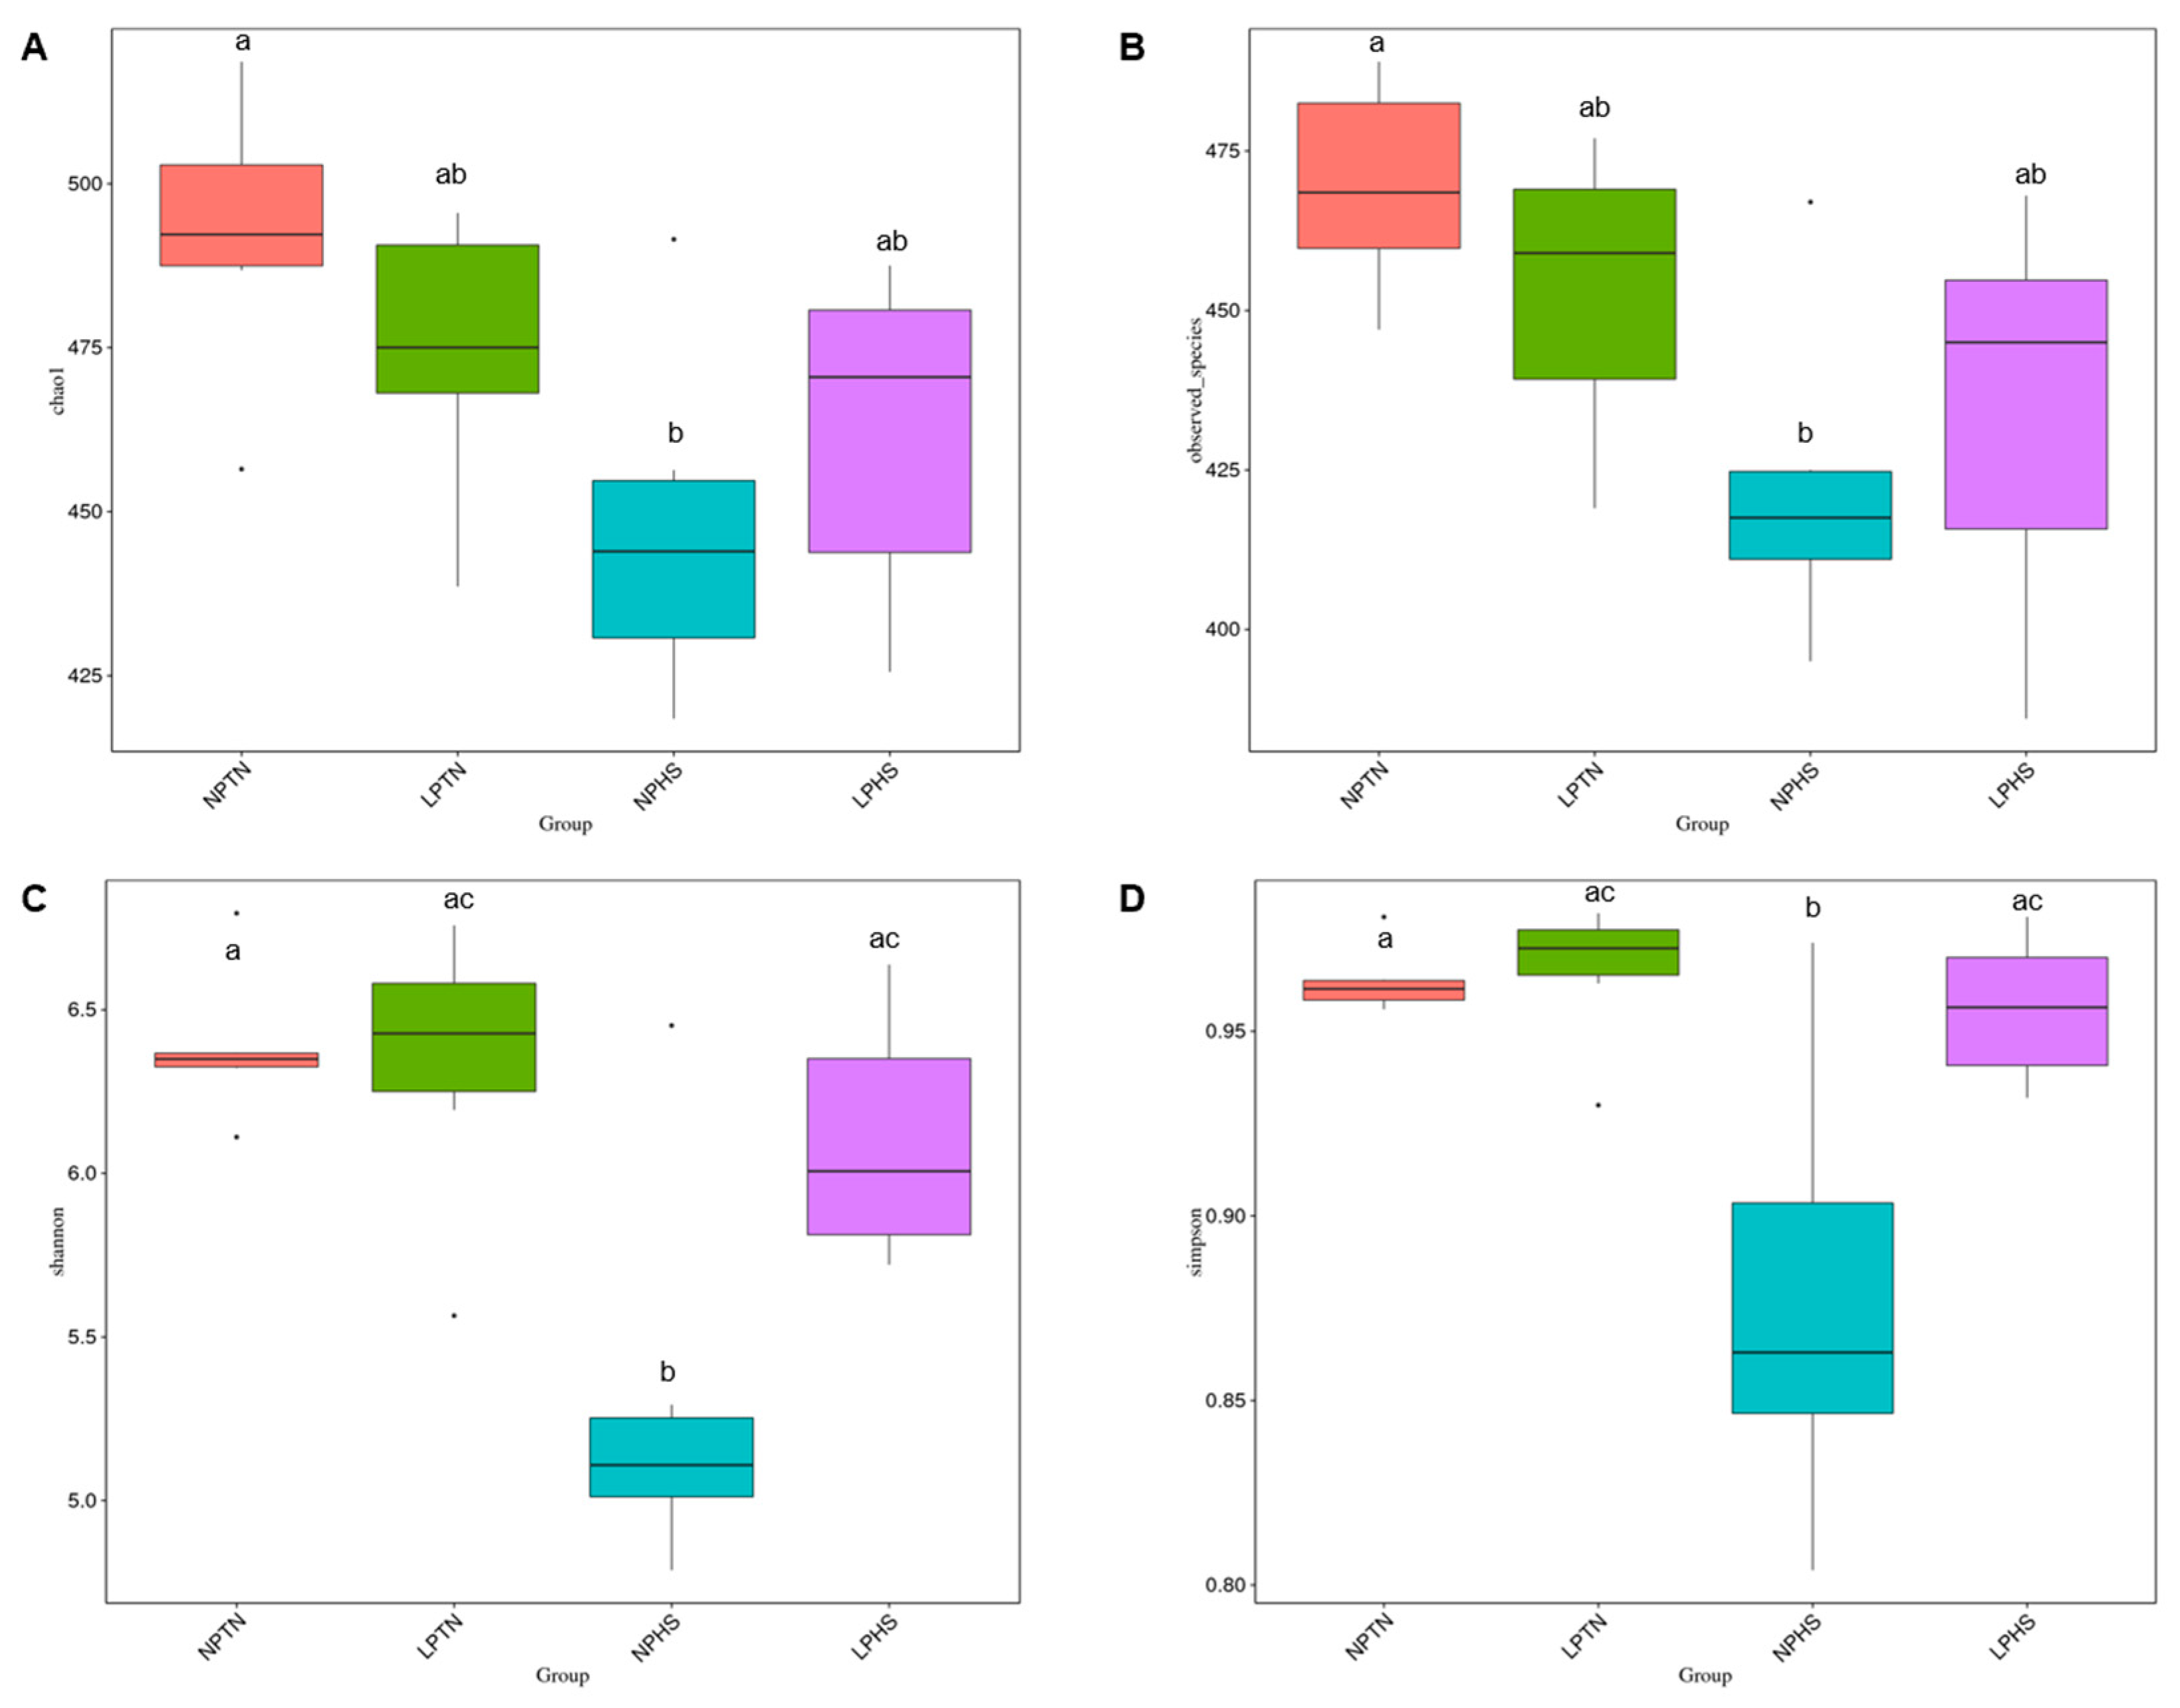
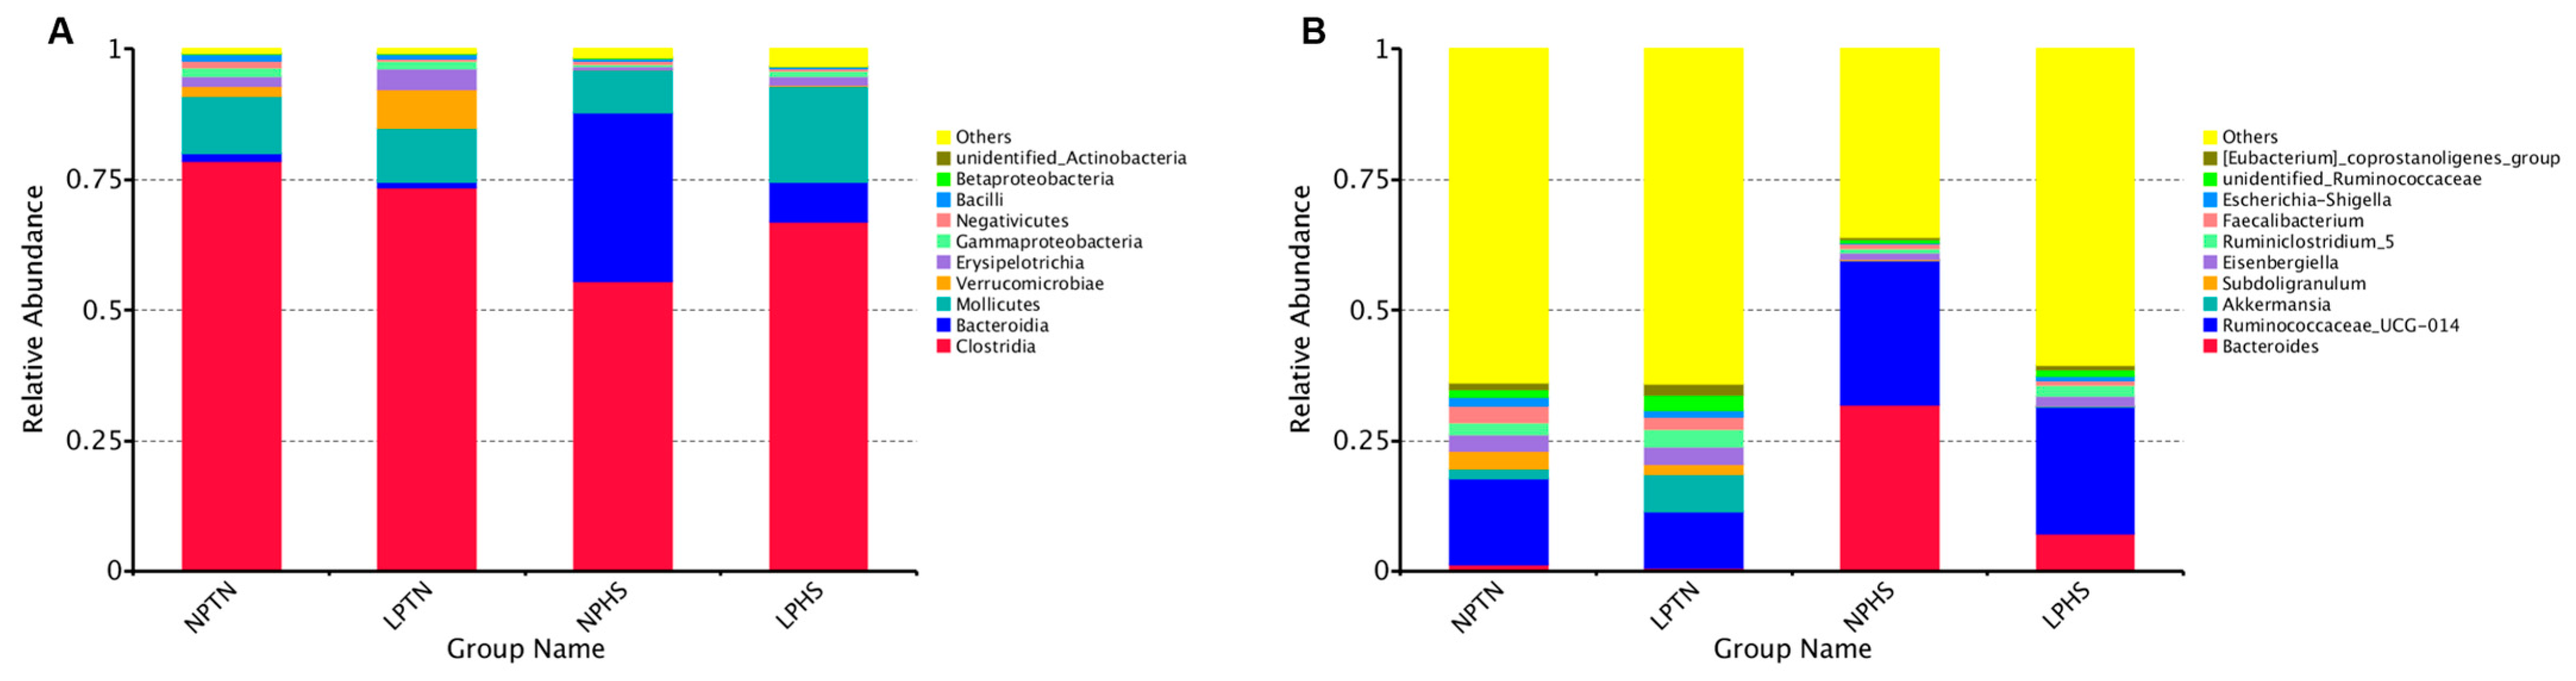
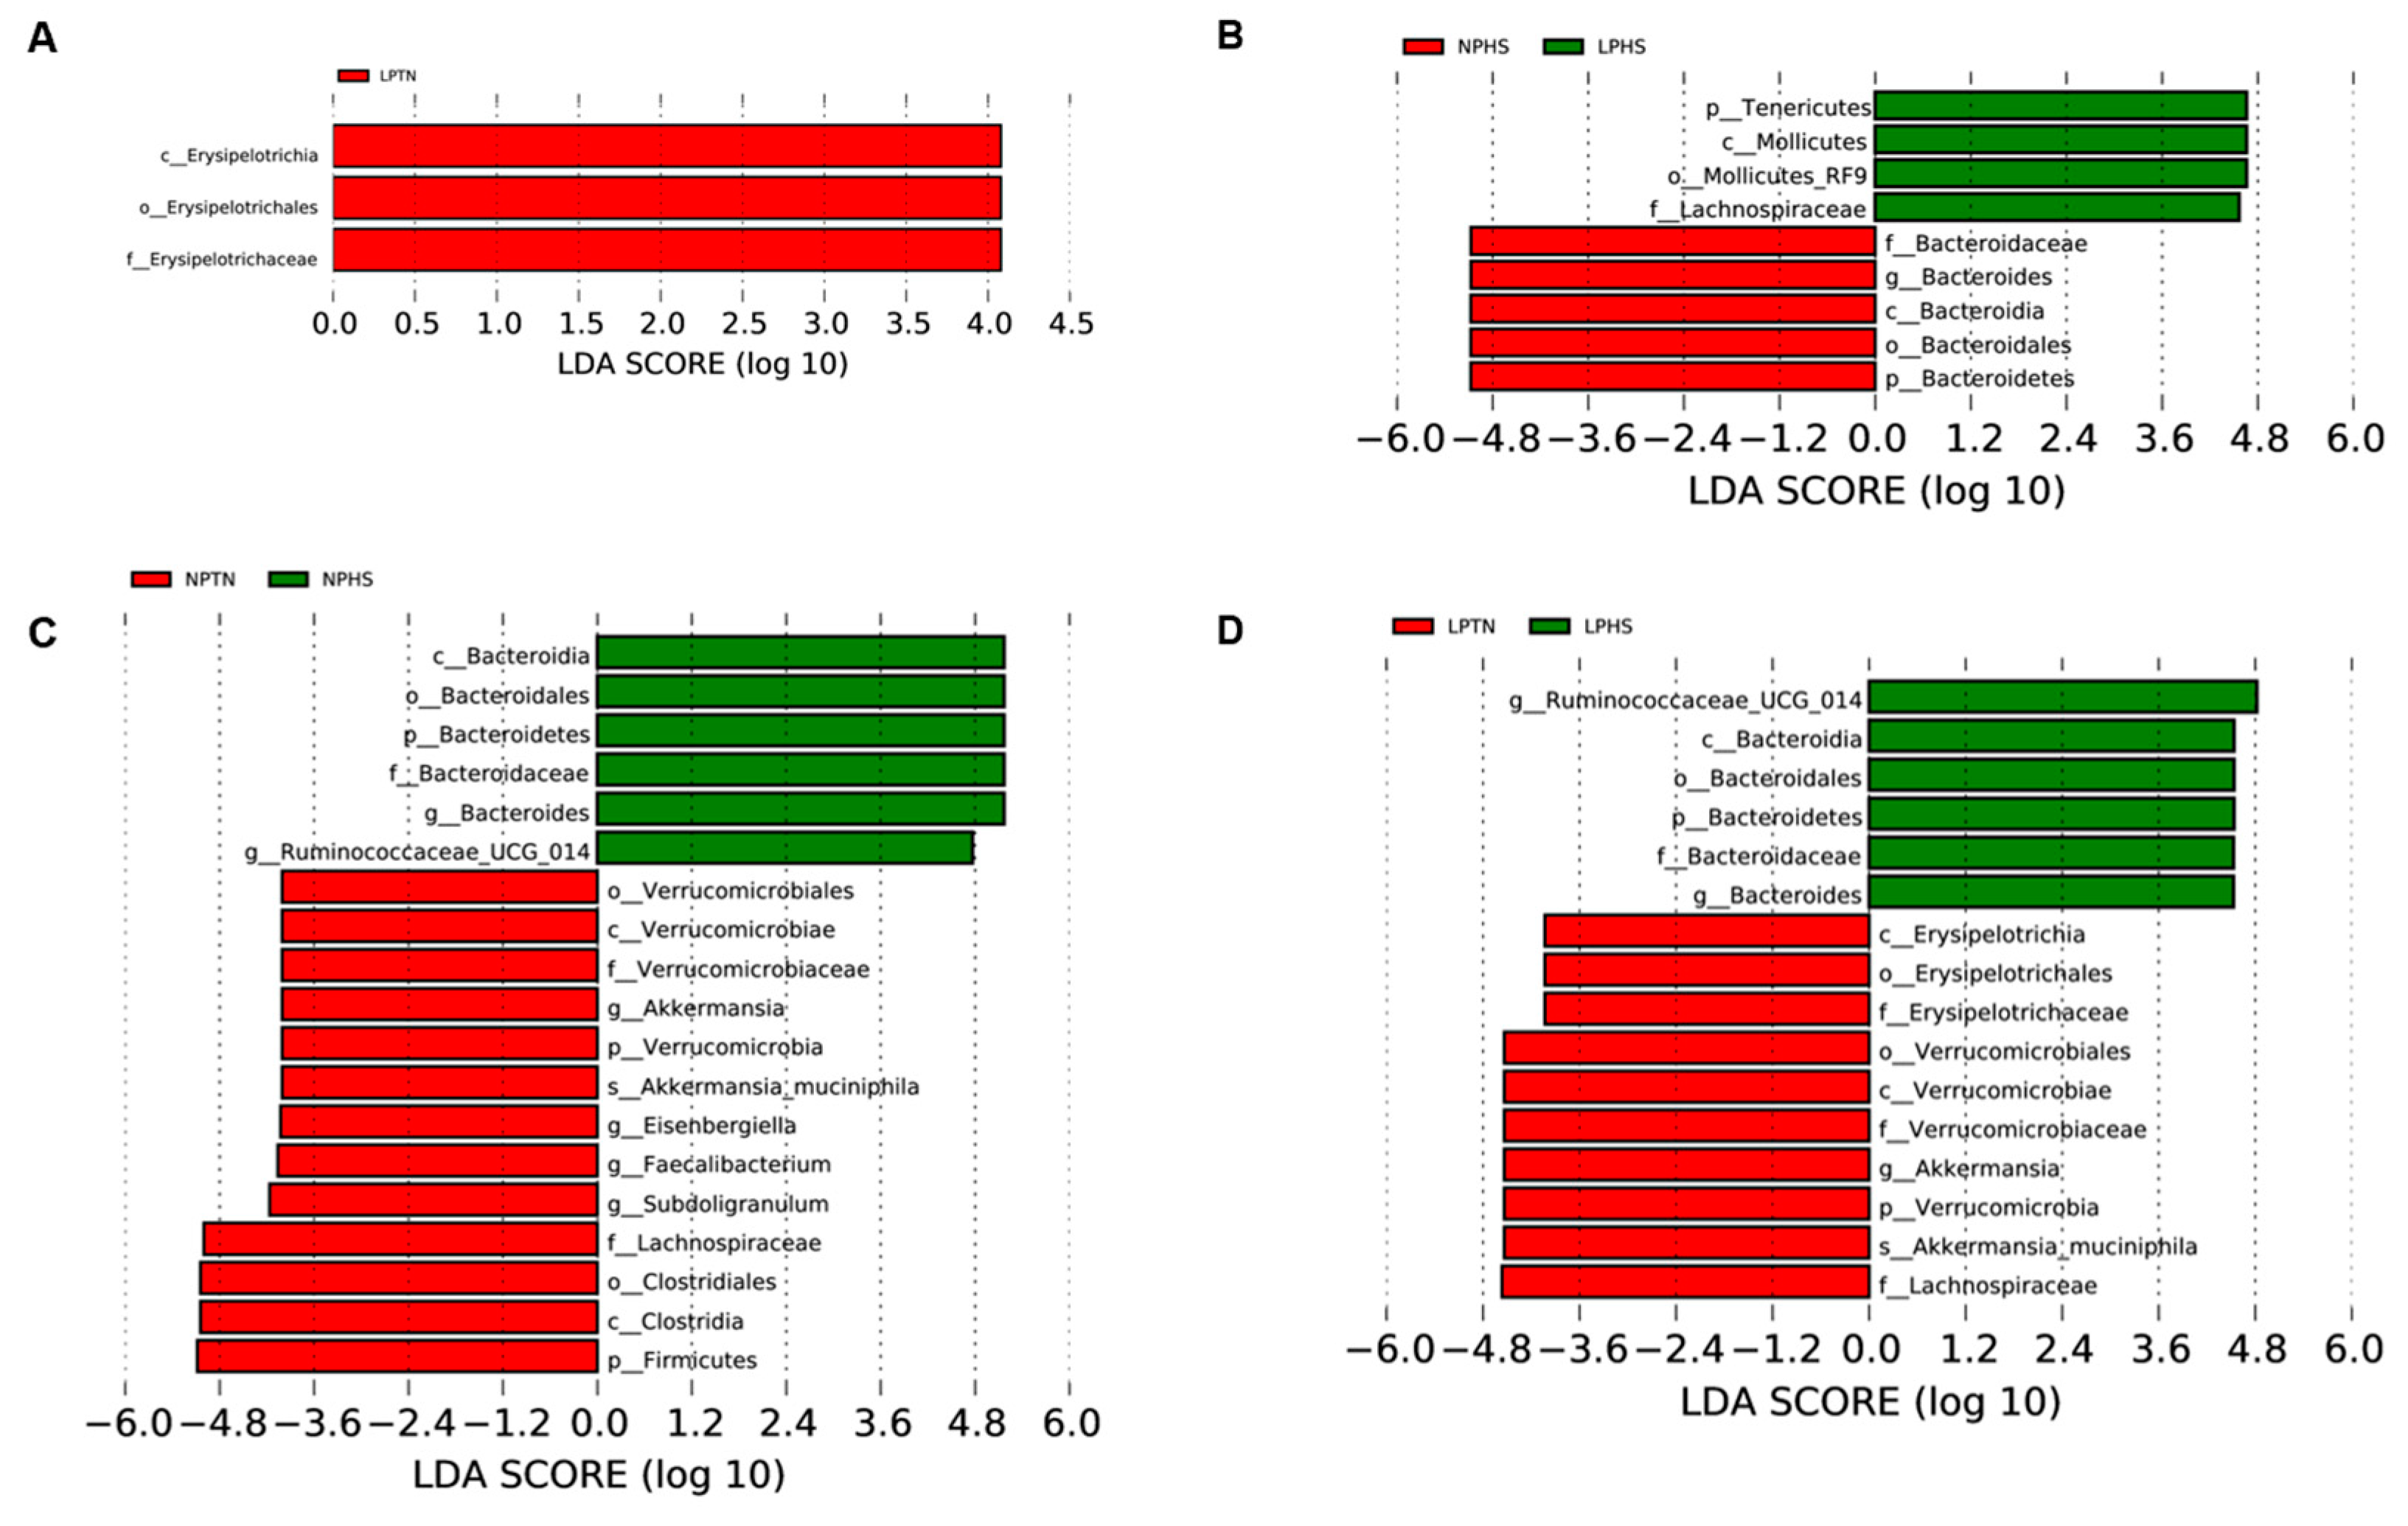
2.9. Cecal Microbiota
3. Discussion
4. Materials and Methods
4.1. The Animals and Housing
4.2. Diets, Experimental Design, and Heat Stress Protocol
4.3. Behaviors and Physiological Adaptations Measurements
4.4. Food Intake and Growth Measurements
4.5. Thermal Images
4.6. Feed Samples Collection
4.7. Blood and Tissue Samples Collection
4.8. Body Composition Analysis
4.9. Radiative Heat Transfer Analysis
4.10. Diet Composition Analysis
4.11. Reverse Transcription Polymerase Chain Reaction (RT-qPCR)
4.12. Plasma Oxidative Stress Biomarkers
4.13. Plasma Metabolomics
4.14. Cecal Contents Microbiome
4.15. Statistical Analysis
5. Conclusions
Supplementary Materials
Author Contributions
Funding
Institutional Review Board Statement
Informed Consent Statement
Data Availability Statement
Conflicts of Interest
References
- Syafwan, S.; Kwakkel, R.; Verstegen, M. Heat stress and feeding strategies in meat-type chickens. World’s Poult. Sci. J. 2011, 67, 653–674. [Google Scholar] [CrossRef]
- Lara, L.J.; Rostagno, M.H. Impact of Heat Stress on Poultry Production. Animals 2013, 3, 356–369. [Google Scholar] [CrossRef] [PubMed]
- Zulkifli, I.; Akmal, A.F.; Soleimani, A.F.; Hossain, M.A.; Awad, E.A. Effects of low-protein diets on acute phase proteins and heat shock protein 70 responses, and growth performance in broiler chickens under heat stress condition. Poult. Sci. 2018, 97, 1306–1314. [Google Scholar] [CrossRef] [PubMed]
- Waldroup, P.W. Influence of environmental temperature on protein and amino acid needs of poultry. Fed. Proc. 1982, 41, 2821–2823. [Google Scholar] [PubMed]
- Gous, R.M.; Morris, T.R. Nutritional interventions in alleviating the effects of high temperatures in broiler production. World’s Poult. Sci. J. 2005, 61, 463–475. [Google Scholar] [CrossRef]
- Musharaf, N.A.; Latshaw, J.D. Heat increment as affected by protein and amino acid nutrition. World’s Poult. Sci. J. 1999, 55, 233–240. [Google Scholar] [CrossRef]
- Awad, E.A.; Zulkifli, I.; Soleimani, A.F.; Aljuobori, A. Effects of feeding male and female broiler chickens on low-protein diets fortified with different dietary glycine levels under the hot and humid tropical climate. Ital. J. Anim. Sci. 2017, 16, 453–461. [Google Scholar] [CrossRef]
- Furlan, R.L.; de Faria Filho, D.E.; Rosa, P.S.; Macari, M. Does Low-Protein Diet Improve Broiler Performance under Heat Stress Conditions? Braz. J. Poult. Sci. 2004, 6, 71–79. [Google Scholar] [CrossRef][Green Version]
- Bregendahl, K.; Sell, J.L.; Zimmerman, D.R. Effect of low protein diet on performance and body composition of broiler chicks. Poult. Sci. 2002, 81, 1156–1167. [Google Scholar] [CrossRef] [PubMed]
- Davidson, J.; Mathieson, J.; Williams, R.B.; Boyne, A.W. Effects of animal fat and low ratios of protein to metabolizable energy on the utilization of dietary energy by medium- and fast-growing strains of poultry. J. Sci. Food Agric. 1964, 15, 316–325. [Google Scholar] [CrossRef]
- Marayat, J.; Lertpimonpan, S.; Rakangthong, C.; Sopannarath, P.; Bunchasak, C.; Loongyai, W. Effect of Low-Protein Diets Supplemented with Methionine on Growth Performance, Carcass Characteristics, and Expression of ANT and UCP Genes in the Breast Muscle of Betong Chickens. Songklanakarin J. Sci. Technol. 2019, 41, 1211–1218. [Google Scholar]
- Soares, K.R.; Lara, L.J.C.; da Silva Martins, N.R.; e Silva, R.R.; Pereira, L.F.P.; Cardeal, P.C.; Teixeira, M.D.P.F. Protein Diets for Growing Broilers Created under a Thermoneutral Environment or Heat Stress. Anim. Food Sci. Technol. 2020, 259, 114332. [Google Scholar] [CrossRef]
- Buyse, J.; Decuypere, E.; Berghman, L.; Kühn, E.R.; Vandesande, F. Effect of dietary protein content on episodic growth hormone secretion and on heat production of male broiler chickens. Br. Poult. Sci. 1992, 33, 1101–1109. [Google Scholar] [CrossRef] [PubMed]
- Nieto, R.; Aguilera, J.F.; Fernández-Fígares, I.; Prieto, C. Effect of a low protein diet on the energy metabolism of growing chickens. Arch. Tierernahr. 1997, 50, 105–119. [Google Scholar] [CrossRef] [PubMed]
- Li, Q.; Xu, Z.; Liu, L.; Yu, H.; Rong, H.; Tao, L.; Zhang, X.; Chen, X.; Gu, D.; Fan, Y.; et al. Effects of breeds and dietary protein levels on the growth performance, energy expenditure and expression of avUCP mRNA in chickens. Mol. Biol. Rep. 2013, 40, 2769–2779. [Google Scholar] [CrossRef] [PubMed]
- Aftab, U.; Ashraf, M.; Jiang, Z. Low protein diets for broilers. World’s Poult. Sci. J. 2006, 62, 688–701. [Google Scholar] [CrossRef]
- Richards, M.P. Genetic regulation of feed intake and energy balance in poultry. Poult. Sci. 2003, 82, 907–916. [Google Scholar] [CrossRef] [PubMed]
- Richards, M.P.; Rosebrough, R.W.; Coon, C.N.; McMurtry, J.P. Feed Intake Regulation for the Female Broiler Breeder: In Theory and in Practice. J. Appl. Poult. Res. 2010, 19, 182–193. [Google Scholar] [CrossRef]
- Honda, K.; Saneyasu, T.; Kamisoyama, H. Gut hormones and regulation of food intake in birds. J. Poult. Sci. 2017, 54, 103–110. [Google Scholar] [CrossRef] [PubMed]
- Monir, M.M.; Hiramatsu, K.; Matsumoto, S.; Nishimura, K.; Takemoto, C.; Shioji, T.; Watanabe, T.; Kita, K.; Yonekura, S.; Roh, S.G. Influences of protein ingestion on glucagon-like peptide (GLP)-1-immunoreactive endocrine cells in the chicken ileum. Anim. Sci. J. 2014, 85, 581–587. [Google Scholar] [CrossRef] [PubMed]
- Nishimura, K.; Hiramatsu, K.; Watanabe, T.; Makino, R.; Sasaki, N.; Kita, K. Amino acid supplementation to diet influences the activity of the L cells in chicken small intestine. J. Poult. Sci. 2015, 52, 221–226. [Google Scholar] [CrossRef]
- Tian, Y.; Li, G.; Chen, L.; Bu, X.; Shen, J.; Tao, Z.; Zeng, T.; Du, X.; Lu, L. High-temperature exposure alters the community structure and functional features of the intestinal microbiota in Shaoxing ducks (Anas platyrhynchos). Poult. Sci. 2020, 99, 2662–2674. [Google Scholar] [CrossRef] [PubMed]
- Shi, D.; Bai, L.; Qu, Q.; Zhou, S.; Yang, M.; Guo, S.; Li, Q.; Liu, C. Impact of gut microbiota structure in heat-stressed broilers. Poult. Sci. 2019, 98, 2405–2413. [Google Scholar] [CrossRef] [PubMed]
- Ostrowski-Meissner, H.T. The physiological and biochemical response of broilers exposed to short-term thermal stress. Comp. Biochem. Physiol. A 1981, 70, 1–8. [Google Scholar] [CrossRef]
- Xie, J.; Tang, L.; Lu, L.; Zhang, L.; Lin, X.; Liu, H.C.; Odle, J.; Luo, X. Effects of acute and chronic heat stress on plasma metabolites, hormones and oxidant status in restrictedly fed broiler breeders. Poult. Sci. 2015, 94, 1635–1644. [Google Scholar] [CrossRef] [PubMed]
- De Cesare, A.; Faria do Valle, Ì.; Sala, C.; Sirri, F.; Astolfi, A.; Castellani, G.; Manfreda, G. Effect of a low protein diet on chicken ceca microbiome and productive performances. Poult. Sci. 2019, 98, 3963–3976. [Google Scholar] [CrossRef] [PubMed]
- Hofmann, P.; Siegert, W.; Kenéz, Á.; Naranjo, V.D.; Rodehutscord, M. Very Low Crude Protein and Varying Glycine Concentrations in the Diet Affect Growth Performance, Characteristics of Nitrogen Excretion, and the Blood Metabolome of Broiler Chickens. J. Nutr. 2019, 149, 1122–1132. [Google Scholar] [CrossRef] [PubMed]
- Alleman, F.; Leclercq, B. Effect of dietary protein and environmental temperature on growth performance and water consumption of male broiler chickens. Br. Poult. Sci. 1997, 38, 607–610. [Google Scholar] [CrossRef] [PubMed]
- Si, J.; Fritts, C.A.; Burnham, D.J.; Waldroup, P.W. Extent to which crude protein may be reduced in corn-soybean meal broiler diets through amino acid supplementation. Int. J. Poult. Sci. 2004, 3, 46–50. [Google Scholar]
- Jiang, Q.; Waldroup, P.W.; Fritts, C.A. Improving utilization of diets low in crude protein for broiler chicken, 1. Evaluation of specific amino acid supplementation to diets low in crude protein. Int. J. Poult. Sci. 2005, 4, 115–122. [Google Scholar]
- Blair, R.; Jacob, J.P.; Ibrahim, S.; Wang, P. A quantitative assessment of reduced protein diets and supplements to improve nitrogen utilization. J. Appl. Poult. Res. 1999, 8, 25–47. [Google Scholar] [CrossRef]
- Raubenheimer, D.; Machovsky-Capuska, G.E.; Gosby, A.K.; Simpson, S. Nutritional ecology of obesity: From humans to companion animals. Br. J. Nutr. 2015, 113, S26–S39. [Google Scholar] [CrossRef] [PubMed]
- Simpson, S.J.; Raubenheimer, D. Obesity: The protein leverage hypothesis. Obes. Rev. 2005, 6, 133–142. [Google Scholar] [CrossRef] [PubMed]
- Drucker, D.J. The biology of incretin hormones. Cell Metab. 2006, 3, 153–165. [Google Scholar] [CrossRef] [PubMed]
- Shousha, S.; Nakahara, K.; Nasu, T.; Sakamoto, T.; Murakami, N. Effect of glucagon-like peptide-1 and -2 on regulation of food intake, body temperature and locomotor activity in the Japanese quail. Neurosci. Lett. 2007, 415, 102–107. [Google Scholar] [CrossRef] [PubMed]
- Shousha, S.; Nakahara, K.; Kojima, M.; Miyazato, M.; Hosoda, H.; Kangawa, K.; Murakami, N. Different effects of peripheral and central ghrelin on regulation of food intake in the Japanese quail. Gen. Comp. Endocrinol. 2005, 141, 178–183. [Google Scholar] [CrossRef] [PubMed]
- Roberge, J.N.; Brubaker, P.L. Regulation of intestinal proglucagon-derived peptide secretion by glucosedependent insulinotropic peptide in a novel enteroendocrine loop. Endocrinology 1993, 133, 233–240. [Google Scholar] [CrossRef] [PubMed]
- Damholt, A.B.; Buchan, A.M.J.; Kofod, H. Glucagon-likepeptide-1 secretion from canine L-cells is increased by glucose-dependent-insulinotropic peptide but unaffected by glucose. Endocrinology 1998, 139, 2085–2091. [Google Scholar] [CrossRef] [PubMed]
- Pezeshki, A.; Zapata, R.C.; Singh, A.; Yee, N.J.; Chelikani, P.K. Low protein diets produce divergent effects on energy balance. Sci. Rep. 2016, 6, 25145. [Google Scholar] [CrossRef] [PubMed]
- Laeger, T.; Albarado, D.C.; Burke, S.J.; Trosclair, L.; Hedgepeth, J.W.; Berthoud, H.R.; Gettys, T.W.; Collier, J.J.; Münzberg, H.; Morrison, C.D. Metabolic responses to dietary protein restriction require an increase in FGF21 that is delayed by the absence of GCN2. Cell Rep. 2016, 16, 707–716. [Google Scholar] [CrossRef]
- Zapata, R.C.; Singh, A.; Pezeshki, A.; Avirineni, B.S.; Patra, S.; Chelikani, P.K. Low protein diets with fixed carbohydrate content promote hyperphagia and sympathetically mediated increase in energy expenditure. Mol. Nutr. Food Res. 2019, 63, e1900088. [Google Scholar] [CrossRef] [PubMed]
- Spring, S.; Singh, A.; Zapata, R.C.; Chelikani, P.K.; Pezeshki, A. Methionine restriction partly recapitulates the sympathetically mediated enhanced energy expenditure induced by total amino acid restriction in rats. Nutrients 2019, 11, 707. [Google Scholar] [CrossRef] [PubMed]
- Spring, S.; Premathilake, H.; DeSilva, U.; Shili, C.; Carter, S.; Pezeshki, A. Low Protein-High Carbohydrate Diets Alter Energy Balance, Gut Microbiota Composition and Blood Metabolomics Profile in Young Pigs. Sci. Rep. 2020, 10, 3318. [Google Scholar] [CrossRef] [PubMed]
- Spring, S.; Premathilake, H.; Bradway, C.; Shili, C.; DeSilva, U.; Carter, S.; Pezeshki, A. Effect of very low-protein diets supplemented with branched-chain amino acids on energy balance, plasma metabolomics and fecal microbiome of pigs. Sci. Rep. 2020, 10, 15859. [Google Scholar] [CrossRef] [PubMed]
- Joubert, R.; Métayer Coustard, S.; Swennen, Q.; Sibut, V.; Crochet, S.; Cailleau-Audouin, E.; Buyse, J.; Decuypere, E.; Wrutniak-Cabello, C.; Cabello, G.; et al. The beta-adrenergic system is involved in the regulation of the expression of avian uncoupling protein in the chicken. Domest. Anim. Endocrinol. 2010, 38, 115–125. [Google Scholar] [CrossRef] [PubMed]
- Marmonier, F.; Duchamp, C.; Cohen-Adad, F.; Eldershaw, T.P.; Barré, H. Hormonal control of thermogenesis in perfused muscle of Muscovy ducklings. Am. J. Physiol. 1997, 273, R1638–R1648. [Google Scholar] [CrossRef] [PubMed]
- Lynch, G.S.; Ryall, J.G. Role of beta-adrenoceptor signaling in skeletal muscle: Implications for muscle wasting and disease. Physiol. Rev. 2008, 88, 729–767. [Google Scholar] [CrossRef] [PubMed]
- Carew, L.B.; Evarts, K.G.; Alster, F.A. Growth and plasma thyroid hormone concentrations of chicks fed diets deficient in essential amino acids. Poult. Sci. 1997, 76, 1398–1404. [Google Scholar] [CrossRef] [PubMed]
- Carew, L.B., Jr.; Alster, F.A.; Foss, D.C.; Scanes, C.G. Effect of a tryptophan deficiency on thyroid gland, growth hormone and testicular functions in chickens. J. Nutr. 1983, 113, 1756–1765. [Google Scholar] [CrossRef] [PubMed]
- Pezeshki, A.; Chelikani, P.K. Low Protein Diets and Energy Balance: Mechanisms of Action on Energy Intake and Expenditure. Front. Nutr. 2021, 8, 655833. [Google Scholar] [CrossRef] [PubMed]
- Johnston, D.W. The absence of brown adipose tissue in birds. Comp. Biochem. Physiol. 1971, 40A, 1107–1108. [Google Scholar] [CrossRef] [PubMed]
- Saarela, S.; Hissa, R.; Pyornila, A.; Harjula, R.; Ojanen, M.; Orell, M. Do birds possess brown adipose tissue? Comp. Biochem. Physiol. 1989, 92A, 219–228. [Google Scholar] [CrossRef]
- Moran, E.T., Jr.; Bushong, R.D.; Bilgili, S.F. Reducing dietary crude protein for broilers while satisfying amino acid requirements by least-cost formulation: Live performance, litter composition, and yield of fast-food carcass cuts at six weeks. Poult. Sci. 1992, 71, 1687–1694. [Google Scholar] [CrossRef]
- Fatufe, A.A.; Rodehutscord, M. Growth, body composition, and marginal efficiency of methionine utilization are affected by nonessential amino acid nitrogen supplementation in male broiler chicken. Poult. Sci. 2005, 84, 1584–1592. [Google Scholar] [CrossRef] [PubMed]
- Kita, K.; Muramatsu, T.; Okumura, J. Effect of dietary protein and energy intakes on whole-body protein turnover and its contribution to heat production in chicks. Br. J. Nutr. 1993, 69, 681–688. [Google Scholar] [CrossRef] [PubMed]
- Singh, K.M.; Shah, T.; Deshpande, S.; Jakhesara, S.J.; Koringa, P.G.; Rank, D.N.; Joshi, C.G. High through put 16S rRNA gene-based pyrosequencing analysis of the fecal microbiota of high FCR and low FCR broiler growers. Mol. Biol. Rep. 2012, 39, 10595–10602. [Google Scholar] [CrossRef] [PubMed]
- Beckmann, L.; Simon, O.; Vahjen, W. Isolation and Identification of Mixed Linkedβ -Glucan Degrading Bacteria in the Intestine of Broiler Chickens and Partial Characterization of Respective 1,3-1,4-β -Glucanase Activities. J. Basic. Microbiol. 2006, 46, 175–185. [Google Scholar] [CrossRef] [PubMed]
- Knudsen, K.E.B. Fiber and Nonstarch Polysaccharide Content and Variation in Common Crops Used in Broiler Diets. Poult. Sci. 2014, 93, 2380–2393. [Google Scholar] [CrossRef]
- Turnbaugh, P.J.; Bäckhed, F.; Fulton, L.; Gordon, J.I. Diet-induced obesity is linked to marked but reversible alterations in the mouse distal gut microbiome. Cell Host Microbe 2008, 3, 213–223. [Google Scholar] [CrossRef] [PubMed]
- Reimann, F.; Williams, L.; daSilva Xavier, G.; Rutter, G.A.; Gribble, F.M. Glutamine potently stimulates glucagon-like peptide-1 secretion from GLUTag cells. Diabetologia 2004, 47, 1592–1601. [Google Scholar] [CrossRef]
- Clemmensen, C.; Smajilovic, S.; Smith, E.P.; Woods, S.C.; Bräuner-Osborne, H.; Seeley, R.J.; D’Alessio, D.A.; Ryan, K.K. Oral L-arginine stimulates GLP-1 secretion to improve glucose tolerance in male mice. Endocrinology 2013, 154, 3978–3983. [Google Scholar] [CrossRef] [PubMed]
- Reeves, P.G.; O’Dell, B.L. The effect of dietary tyrosine levels on food intake in zinc-deficient rats. J. Nutr. 1984, 114, 761–767. [Google Scholar] [CrossRef] [PubMed]
- Zapata, R.C.; Singh, A.; Ajdari, N.M.; Chelikani, P.K. Dietary Tryptophan Restriction Dose-Dependently Modulates Energy Balance, Gut Hormones, and Microbiota in Obesity-Prone Rats. Obesity 2018, 26, 730–739. [Google Scholar] [CrossRef] [PubMed]
- Ain Baziz, H.; Geraert, P.A.; Padilha JC, F.; Guillaumin, S. Chronic heat exposure enhances fat deposition and modifies muscle and fat partition in broiler carcasses. Poult. Sci. 1996, 75, 505–513. [Google Scholar] [CrossRef] [PubMed]
- Lin, H.; Decuypere, E.; Buyse, J. Acute heat stress induces oxidative stress in broiler chickens. Comp. Biochem. Physiol. A Mol. Integr. Physiol. 2006, 144, 11–17. [Google Scholar] [CrossRef] [PubMed]
- Akbarian, A.; Michiels, J.; Degroote, J.; Majdeddin, M.; Golian, A.; De Smet, S. Association between heat stress and oxidative stress in poultry; mitochondrial dysfunction and dietary interventions with phytochemicals. J. Anim. Sci. Biotechnol. 2016, 7, 37. [Google Scholar] [CrossRef] [PubMed]
- Yang, L.; Tan, G.Y.; Fu, Y.Q.; Feng, J.H.; Zhang, M.H. Effects of acute heat stress and subsequent stress removal on function of hepatic mitochondrial respiration, ROS production and lipid peroxidation in broiler chickens. Comp. Biochem. Physiol. C Toxicol. Pharmacol. 2010, 151, 204–208. [Google Scholar] [CrossRef] [PubMed]
- Altan, O.; Pabuçcuoğlu, A.; Altan, A.; Konyalioğlu, S.; Bayraktar, H. Effect of heat stress on oxidative stress, lipid peroxidation and some stress parameters in broilers. Br. Poult. Sci. 2003, 44, 545–550. [Google Scholar] [CrossRef] [PubMed]
- National Research Council; Board on Agriculture; Subcommittee on Poultry Nutrition. Nutrient Requirements of Poultry: Ninth Revised Edition; The National Academies Press: Washington, DC USA, 1994. [Google Scholar] [CrossRef]
- Sohail, M.U.; Ijaz, A.; Yousaf, M.S.; Ashraf, K.; Zaneb, H.; Aleem, M.; Rehman, H. Alleviation of cyclic heat stress in broilers by dietary supplementation of mannan-oligosaccharide and Lactobacillus-based probiotic: Dynamics of cortisol, thyroid hormones, cholesterol, C-reactive protein, and humoral immunity. Poult. Sci. 2010, 89, 1934–1938. [Google Scholar] [CrossRef] [PubMed]
- Shili, C.N.; Broomhead, J.N.; Spring, S.C.; Lanahan, M.B.; Pezeshki, A. A Novel Corn-Expressed Phytase Improves Daily Weight Gain, Protein Efficiency Ratio and Nutrients Digestibility and Alters Fecal Microbiota in Pigs Fed with Very Low Protein Diets. Animals 2020, 10, 1926. [Google Scholar] [CrossRef] [PubMed]
- Goodarzi, P.; Wileman, C.M.; Habibi, M.; Walsh, K.; Sutton, J.; Shili, C.N.; Chai, J.; Zhao, J.; Pezeshki, A. Effect of Isoleucine and Added Valine on Performance, Nutrients Digestibility and Gut Microbiota Composition of Pigs Fed with Very Low Protein Diets. Int. J. Mol. Sci. 2022, 23, 14886. [Google Scholar] [CrossRef] [PubMed]
- Ferreira, V.M.O.S.; Francisco, N.S.; Belloni, M.; Aguirre, G.M.Z.; Caldara, F.R.; Nääs, I.A.; Garcia, R.G.; Almeida Paz, I.C.L.; Polycarpo, G.V. Infrared Thermography Applied to the Evaluation of Metabolic Heat Loss of Chicks Fed with Different Energy Densities. Braz. J. Poult. Sci. 2011, 13, 113–118. [Google Scholar] [CrossRef]
- Bakken, G.S. A heat transfer analysis of animals: Unifying concepts and the application of metabolism chamber data to field ecology. J. Theor. Biol. 1976, 60, 337–384. [Google Scholar] [CrossRef] [PubMed]
- Habibi, M.; Shili, C.; Sutton, J.; Goodarzi, P.; Maylem, E.R.; Spicer, L.; Pezeshki, A. Branched-chain amino acids partially recover the reduced growth of pigs fed with protein-restricted diets through both central and peripheral factors. Anim. Nutr. 2021, 7, 868–882. [Google Scholar] [CrossRef] [PubMed]
- Pezeshki, A.; Muench, G.P.; Chelikani, P.K. Short communication: Expression of peptide YY, proglucagon, neuropeptide Y receptor Y2, and glucagon-like peptide-1 receptor in bovine peripheral tissues. J. Dairy. Sci. 2012, 95, 5089–5094. [Google Scholar] [CrossRef] [PubMed]
- Shili, C.N.; Habibi, M.; Sutton, J.; Barnes, J.; Burch-Konda, J.; Pezeshki, A. Effect of a Phytogenic Water Additive on Growth Performance, Blood Metabolites and Gene Expression of Amino Acid Transporters in Nursery Pigs Fed with Low-Protein/High-Carbohydrate Diets. Animals 2021, 11, 555. [Google Scholar] [CrossRef] [PubMed]
- Habibi, M.; Shili, C.N.; Sutton, J.; Goodarzi, P.; Pezeshki, A. Dietary branched-chain amino acids modulate the dynamics of calcium absorption and reabsorption in protein-restricted pigs. J. Anim. Sci. Biotechnol. 2022, 13, 15. [Google Scholar] [CrossRef] [PubMed]
- Aoki, K.; Kondo, M.; Okuda, M.; Saneyasu, T.; Honda, K.; Kamisoyama, H. Identification, expression analysis, and functional characterization of peptide YY in chickens (Gallus gallus domesticus). Gen. Comp. Endocrinol. 2017, 242, 11–17. [Google Scholar] [CrossRef] [PubMed]
- Kolodziejski, P.A.; Sassek, M.; Chalupka, D.; Leciejewska, N.; Nogowski, L.; Mackowiak, P.; Jozefiak, D.; Stadnicka, K.; Siwek, M.; Bednarczyk, M.; et al. GLP1 and GIP are involved in the action of synbiotics in broiler chickens. J. Anim. Sci. Biotechnol. 2018, 9, 13. [Google Scholar] [CrossRef] [PubMed]
- Shimao, R.; Muroi, H.; Furukawa, K.; Toyomizu, M.; Kikusato, M. Effects of low-dose oleuropein diet supplementation on the oxidative status of skeletal muscles and plasma hormonal concentration of growing broiler chickens. Br. Poult. Sci. 2019, 60, 784–789. [Google Scholar] [CrossRef] [PubMed]
- Song, Z.; Liu, L.; Sheikhahmadi, A.; Jiao, H.; Lin, H. Effect of heat exposure on gene expression of feed intake regulatory peptides in laying hens. J. Biomed. Biotechnol. 2012, 2012, 484869. [Google Scholar] [CrossRef] [PubMed]
- Wang, Y.; Huang, G.; Li, J.; Meng, F.; He, X.; Leung, F.C. Characterization of chicken secretin (SCT) and secretin receptor (SCTR) genes: A novel secretin-like peptide (SCT-LP) and secretin encoded in a single gene. Mol. Cell Endocrinol. 2012, 348, 270–280. [Google Scholar] [CrossRef] [PubMed]
- Xu, P.; Siegel, P.B.; Denbow, D.M. AICAR and Compound C regulate food intake independently of AMP-activated protein kinase in lines of chickens selected for high or low body weight. Comp. Biochem. Physiol. A Mol. Integr. Physiol. 2011, 159, 401–412. [Google Scholar] [CrossRef] [PubMed]


| Items | Treatments 1 | SEM 2 | p-Values | |||||
|---|---|---|---|---|---|---|---|---|
| NPTN 2 | LPTN 2 | NPHS 2 | LPHS 2 | Diet | Temp 2 | Diet × Temp | ||
| Eating (%) | 9.0 | 10.2 | 3.0 | 3.6 | 0.6 | 0.13 | ≤0.01 | 0.64 |
| Drinking (%) | 8.2 | 5.6 * | 8.1 | 6.8 * | 0.3 | ≤0.01 | 0.17 | 0.14 |
| Panting (%) | 1.8 | 3.5 * | 87.2 | 86.5 | 7.3 | 0.61 | ≤0.01 | 0.24 |
| Wing spread (%) | 0.0 | 0.0 | 27.4 | 28.3 | 2.5 | 0.72 | ≤0.01 | 0.72 |
| Respiratory rate (breath/min) | 65.2 | 67.0 # | 199.5 | 199.8 | 11.6 | 0.34 | ≤0.01 | 0.52 |
| Rectal temperature (°C) | 40.3 | 40.4 | 42.0 | 42.2 | 0.2 | 0.28 | ≤0.01 | 0.79 |
| Items | Treatments 1 | SEM 2 | p-Values | |||||
|---|---|---|---|---|---|---|---|---|
| NPTN 2 | LPTN 2 | NPHS 2 | LPHS 2 | Diet | Temp 2 | Diet × Temp | ||
| Initial BW 3, g | 471 | 516 | 548 | 553 | 10 | 0.14 | 0.38 | 0.21 |
| Final BW 3, g | 2737 | 2688 | 2185 | 1901 | 65 | 0.21 | 0.22 | 0.13 |
| ADG 3, g/d | 78 | 74 | 54 | 44 * | 3 | ≤0.01 | ≤0.01 | 0.11 |
| ADFI 3, g/d | 169 | 181 | 158 | 140 # | 4 | 0.63 | ≤0.01 | 0.03 |
| ADPI 3, g/d | 36 | 27 * | 24 | 20 # | 1 | ≤0.01 | ≤0.01 | 0.02 |
| ADWI 3, mL/d | 319 | 241 * | 373 | 298 * | 9 | ≤0.01 | ≤0.01 | 0.76 |
| G:F 3, g/g | 0.5 | 0.4 * | 0.3 | 0.3 | 0.01 | 0.11 | 0.06 | 0.47 |
| G:P 3, g/g | 2.5 | 3.0 * | 4.3 | 4.0 | 0.19 | 0.51 | 0.03 | ≤0.01 |
| W:F 3, mL/g | 1.9 | 1.3 * | 2.4 | 2.2 | 0.08 | ≤0.01 | ≤0.01 | 0.05 |
| Items | Treatments 1 | SEM 2 | p-Values | |||||
|---|---|---|---|---|---|---|---|---|
| NPTN 2 | LPTN 2 | NPHS 2 | LPHS 2 | Diet | Temp 2 | Diet × Temp | ||
| BMC 3 (g) | 35.40 | 34.14 | 26.09 | 24.04 | 1.10 | 0.21 | ≤0.01 | 0.76 |
| BMC (%) | 1.18 | 1.24 | 1.09 | 1.12 | 0.02 | 0.27 | 0.02 | 0.65 |
| BMD 3 (g/cm2) | 0.15 | 0.15 | 0.14 | 0.14 | 0.002 | 0.97 | 0.04 | 0.17 |
| Lean mass (g) | 2747.85 | 2526.96 * | 2262.61 | 1983.51 * | 64.47 | ≤0.01 | ≤0.01 | 0.76 |
| Lean (%) | 94.40 | 88.00 * | 94.33 | 92.25 * | 0.65 | ≤0.01 | ≤0.01 | ≤0.01 |
| Fat mass (g) | 134.79 | 282.53 * | 109.64 | 142.51 * | 14.72 | ≤0.01 | ≤0.01 | ≤0.01 |
| Fat (%) | 4.46 | 9.96 * | 4.57 | 6.64 * | 0.64 | ≤0.01 | ≤0.01 | ≤0.01 |
| Metabolites | Treatments 1 | SEM 2 | p-Values | |||||
|---|---|---|---|---|---|---|---|---|
| NPTN 2 | LPTN 2 | NPHS 2 | LPHS 2 | Diet | Temp 2 | Diet × Temp 2 | ||
| Microbiome Metabolism | ||||||||
| Daidzein | 981 | 456 | 450 | 292 # | 77 | 0.11 | ≤0.01 | 0.57 |
| Dehydroabietic acid | 15,535 | 11,050 | 39,862 | 22,649 * | 2268 | 0.04 | ≤0.01 | 0.02 |
| D-erythro-sphingosine | 3241 | 1570 # | 4367 | 2602 | 274 | 0.05 | ≤0.01 | 0.57 |
| Lanosterol | 691 | 722 * | 437 | 615 * | 44 | ≤0.01 | 0.06 | 0.99 |
| Lyxitol | 67,091 | 80,787 * | 256,403 | 180,839 | 16,853 | 0.99 | ≤0.01 | 0.02 |
| Carbohydrate Derivatives | ||||||||
| Azelaic acid | 4516 | 954 * | 1010 | 2492 * | 420 | 0.45 | 0.26 | ≤0.01 |
| Conduritol-beta-epoxide | 101,941 | 35,050 * | 47,753 | 19,999 * | 6070 | ≤0.01 | ≤0.01 | 0.09 |
| Galactinol | 27,915 | 4352 # | 2314 | 4083 | 3215 | 0.08 | 0.02 | 0.03 |
| Gluconic acid | 13,217 | 7666 | 16,148 | 7308 * | 1067 | ≤0.01 | 0.25 | 0.05 |
| Hypoxanthine | 104,405 | 74,054 | 138,897 | 146,782 | 9351 | 0.23 | ≤0.01 | 0.45 |
| Inosine | 18,380 | 12,763 | 40,730 | 49,878 | 3913 | 0.16 | ≤0.01 | 0.22 |
| Inulotriose | 1236 | 382 | 236 | 313 # | 134 | 0.29 | 0.02 | 0.11 |
| Maltotriose | 1938 | 870 | 470 | 600 | 190 | 0.52 | ≤0.01 | 0.23 |
| Melezitose | 1386 | 413 # | 276 | 398 | 137 | 0.19 | 0.02 | 0.04 |
| Mucic acid | 6005 | 1306 * | 1860 | 1287 | 519 | ≤0.01 | ≤0.01 | 0.02 |
| Pinitol | 131,195 | 14,550 * | 25,924 | 14,371 * | 13,666 | ≤0.01 | 0.02 | 0.03 |
| Quinic acid | 754 | 679 * | 970 | 708 * | 202 | ≤0.01 | 0.03 | 0.38 |
| Ribonic acid | 4072 | 2204 # | 4061 | 4129 | 279 | 0.82 | 0.03 | 0.24 |
| Saccharic acid | 45,410 | 6313 * | 8514 | 6361 | 4327 | ≤0.01 | ≤0.01 | ≤0.01 |
| Uridine | 19,823 | 10,327 | 51,224 | 23,595 * | 3337 | 0.02 | ≤0.01 | 0.08 |
| Xylitol | 85,529 | 35,367 # | 146,623 | 74,144 # | 9576 | 0.02 | ≤0.01 | 0.33 |
| Carbohydrates | ||||||||
| Alpha-ketoglutarate | 72,780 | 52,059 | 109,710 | 72,904 # | 5242 | 0.25 | ≤0.01 | 0.08 |
| Anhydroglucitol | 17,074 | 22,049 * | 20,792 | 18,979 | 950 | ≤0.01 | 0.97 | 0.22 |
| Arabitol | 124,635 | 137,613 * | 342,129 | 290,263 | 23,793 | 0.24 | ≤0.01 | 0.24 |
| Ribose | 79,755 | 14,043 # | 28,413 | 14,838 * | 8831 | 0.03 | 0.18 | 0.15 |
| Erythritol | 102,640 | 76,671 | 482,304 | 169,023 * | 32,002 | ≤0.01 | ≤0.01 | ≤0.01 |
| Erythrose | 1857 | 940 | 1811 | 980 * | 115 | ≤0.01 | 0.50 | 0.42 |
| Fructose-6-phosphate | 2559 | 821 * | 1221 | 1088 | 169 | 0.02 | 0.16 | ≤0.01 |
| Galactitol | 68,449 | 42,934 | 135,739 | 49,422 * | 10,523 | 0.02 | 0.02 | 0.02 |
| Glucose-1-phosphate | 7286 | 3336 | 9567 | 4894 * | 616 | ≤0.01 | ≤0.01 | 0.23 |
| Glucose-6-phosphate | 4009 | 1353 * | 3123 | 2191 | 262 | ≤0.01 | 0.34 | 0.16 |
| Lactose | 30,940 | 11,331 | 9422 | 10,569 | 2704 | 0.21 | 0.02 | 0.06 |
| Maltose | 108,960 | 27,381 # | 14,205 | 24,420 | 11,347 | 0.15 | ≤0.01 | 0.03 |
| Raffinose | 134,815 | 11,567 * | 2275 | 12,737 | 16,955 | 0.07 | 0.02 | 0.03 |
| Ribitol | 17,360 | 8404 | 47,434 | 16,659 * | 3597 | 0.02 | ≤0.01 | 0.06 |
| Sorbital | 127,390 | 69,622 | 229,553 | 105,516 * | 15,463 | 0.02 | ≤0.01 | 0.08 |
| Sucrose | 229,381 | 19,729 # | 2622 | 24,149 | 31,247 | 0.12 | 0.04 | 0.05 |
| Tagatose | 2062 | 1328 | 2371 | 1370 * | 111 | 0.04 | 0.08 | 0.04 |
| Threitol | 13,480 | 10,000 | 24,489 | 14,506 * | 1117 | ≤0.01 | ≤0.01 | ≤0.01 |
| Xanthosine | 805 | 518 | 1309 | 837 | 97 | 0.50 | 0.02 | 0.57 |
| Xylose | 35,808 | 28,893 * | 36,246 | 31,959 | 1386 | 0.05 | 0.12 | 0.25 |
| Protein Metabolism | ||||||||
| Creatinine | 164,384 | 22,548 * | 161,980 | 47,249 * | 14,773 | ≤0.01 | 0.14 | 0.94 |
| Ornithine | 237,847 | 52,406 * | 295,108 | 49,267 * | 20,748 | ≤0.01 | ≤0.01 | ≤0.01 |
| Urea | 269,631 | 74,397 * | 216,172 | 45,945 * | 20,909 | ≤0.01 | 0.29 | 0.61 |
| Uric Acid | 448,970 | 204,713 | 698,371 | 192,455 * | 47,905 | ≤0.01 | 0.02 | ≤0.01 |
| Citrulline | 77,311 | 15,647 * | 79,028 | 16,167 * | 6222 | ≤0.01 | 0.42 | 0.36 |
| Xanthine | 20,784 | 11,974 | 31,289 | 21,351 | 2161 | 0.48 | ≤0.01 | 0.76 |
| Amino Acids | ||||||||
| Alanine | 973,266 | 2,008,637 * | 725,231 | 788,927 | 117,331 | ≤0.01 | ≤0.01 | ≤0.01 |
| Asparagine | 68,949 | 116,533 * | 58,051 | 87,093 * | 5217 | ≤0.01 | 0.08 | 0.08 |
| Aspartic Acid | 332,966 | 156,243 * | 262,639 | 169,632 # | 15,225 | ≤0.01 | 0.93 | 0.58 |
| Cyanoalanine | 1040 | 2143 * | 612 | 1741 * | 135 | ≤0.01 | 0.07 | 0.41 |
| Cysteine | 12,932 | 21,167 * | 15,309 | 24,415 * | 1342 | ≤0.01 | 0.12 | 0.83 |
| Cystine | 92,902 | 102,225 * | 101,022 | 122,176 * | 3516 | ≤0.01 | 0.06 | 0.81 |
| Glutamine | 1,543,054 | 4,304,606 * | 3,263,465 | 4,764,719 * | 294,103 | ≤0.01 | 0.17 | 0.15 |
| Glycine | 2,009,209 | 3,528,145 * | 864,965 | 1,947,990 * | 193,982 | ≤0.01 | ≤0.01 | ≤0.01 |
| Histidine | 119,164 | 76,831 | 148,762 | 52,758 * | 8802 | ≤0.01 | 0.63 | ≤0.01 |
| Homocystine | 3018 | 2565 | 5747 | 2782 # | 395 | 0.27 | 0.04 | 0.03 |
| Homoserine | 1206 | 2145 * | 525 | 1785 * | 130 | ≤0.01 | ≤0.01 | 0.81 |
| Isoleucine | 952,169 | 997,787 * | 875,481 | 709,461 | 31,524 | ≤0.01 | 0.05 | ≤0.01 |
| Leucine | 2,153,375 | 1,601,125 | 1,888,973 | 1,308,442 # | 69,567 | 0.86 | 0.14 | 0.05 |
| Lysine | 49,913 | 115,908 * | 138,591 | 49,868 * | 9792 | 0.42 | 0.87 | ≤0.01 |
| Methionine | 268,057 | 292,729 * | 145,867 | 248,519 * | 14,091 | ≤0.01 | ≤0.01 | 0.90 |
| Oxoproline | 1,529,819 | 1,806,087 * | 2,423,289 | 4,983,321 * | 292,809 | ≤0.01 | ≤0.01 | 0.03 |
| Proline | 602,393 | 622,686 * | 403,365 | 419,135 | 24,679 | ≤0.01 | ≤0.01 | 0.06 |
| Serine | 3,638,367 | 8,429,353 * | 2,420,920 | 6,817,181 * | 483,269 | ≤0.01 | 0.06 | 0.30 |
| Threonine | 1,363,373 | 4,080,860 * | 278,928 | 2,330,931 * | 281,695 | ≤0.01 | ≤0.01 | 0.07 |
| Tryptophan | 632,209 | 529,272 * | 601,717 | 472,079 | 20,849 | 0.20 | 0.41 | 0.02 |
| Tyrosine | 1,687,441 | 1,592,337 * | 760,553 | 936,369 * | 88,889 | ≤0.01 | ≤0.01 | 0.33 |
| Valine | 839,510 | 641,914 # | 670,200 | 567,541 | 23,844 | 0.13 | 0.02 | 0.12 |
| Fatty Acid Metabolism | ||||||||
| 2-aminobutyric acid | 22,894 | 51,013 * | 28,548 | 33,046 # | 2581 | ≤0.01 | 0.05 | ≤0.01 |
| 2-deoxytetronic acid | 6335 | 3268 * | 6897 | 5090 | 355 | 0.03 | ≤0.01 | 0.82 |
| 2-hydroxyglutaric acid | 16,007 | 7221 | 52,619 | 19,386 * | 3798 | ≤0.01 | ≤0.01 | 0.04 |
| 2-hydroxyvaleric acid | 12,376 | 84,595 | 15,595 | 8457 * | 739 | ≤0.01 | 0.03 | ≤0.01 |
| 3-hydroxybutyric acid | 906,092 | 783,907 | 1,457,671 | 740,685 * | 90,306 | 0.72 | ≤0.01 | 0.92 |
| Beta-sitosterol | 10,643 | 5324 | 5284 | 5139 | 592 | 0.41 | ≤0.01 | 0.10 |
| Cholesterol | 4,343,379 | 3,459,489 # | 3,347,360 | 3,539,811 # | 175,985 | ≤0.01 | 0.39 | 0.72 |
| Glycerol | 1,517,631 | 714,810 | 3,270,495 | 1,716,658 | 244,585 | 0.11 | ≤0.01 | 0.37 |
| Glycerol-alpha-phosphate | 8362 | 3151 * | 10,609 | 5407 # | 681 | ≤0.01 | ≤0.01 | 0.51 |
| Lauric acid | 27,298 | 24,131 # | 19,406 | 17,229 | 1231 | 0.08 | ≤0.01 | 0.09 |
| Linoleic acid | 5170 | 4769 | 3030 | 2728 | 391 | 0.21 | ≤0.01 | 0.37 |
| Monostearin | 1149 | 817 | 661 | 684 | 78 | 0.37 | 0.07 | ≤0.01 |
| Palmitoleic acid | 1475 | 1349 * | 2359 | 2237 | 204 | 0.18 | ≤0.01 | 0.93 |
| Amino Acid Metabolism | ||||||||
| 3-hydroxyanthralinic acid | 755 | 1316 * | 989 | 580 | 97 | 0.06 | 0.11 | ≤0.01 |
| Aminomalonate | 173,601 | 301,913 * | 63,777 | 164,296 * | 18,198 | ≤0.01 | ≤0.01 | 0.03 |
| Aminoisobutyric acid | 7837 | 5210 | 4341 | 4472 | 465 | |||
| Fumaric acid | 257,967 | 98,137 | 1,051,705 | 274,893 * | 87,753 | ≤0.01 | ≤0.01 | 0.03 |
| Guanidinosuccinate | 1975 | 1478 | 1359 | 1406 * | 71 | ≤0.01 | ≤0.01 | 0.60 |
| Ketoisocaproic acid | 35,336 | 25,286 | 29,942 | 15,621 # | 2043 | 0.18 | 0.06 | 0.05 |
| Amino Acid Derivatives | ||||||||
| Cytosin | 1575 | 920 | 2333 | 994 * | 179 | 0.04 | 0.08 | 0.10 |
| Dihydroxypyrazine | 12,424 | 12,135 * | 10,803 | 12,094 # | 359 | ≤0.01 | 0.98 | 0.56 |
| 5-hydroxynorvaline | 6412 | 11,442 * | 3516 | 9150 * | 627 | ≤0.01 | ≤0.01 | 0.36 |
| Maleimide | 12,622 | 9896 # | 6841 | 8918 * | 584 | ≤0.01 | ≤0.01 | 0.40 |
| Malic acid | 443,186 | 164,881 | 1,208,719 | 421,807 # | 100,106 | 0.03 | ≤0.01 | 0.16 |
| Malonic acid | 1616 | 662 | 542 | 448 | 131 | 0.11 | ≤0.01 | 0.16 |
| Phosphoethanolamine | 195,180 | 129,800 # | 114,912 | 147,009 * | 376 | 0.01 | 0.22 | 0.67 |
| Pimelic acid | 7760 | 3957 # | 3794 | 7610 * | 614 | 0.11 | 0.70 | ≤0.01 |
| Pipecolinic acid | 1964 | 1603 * | 1041 | 1805 * | 123 | ≤0.01 | 0.16 | 0.11 |
| Serotonin | 38,246 | 3197 * | 8308 | 7403 | 4485 | 0.04 | 0.15 | 0.04 |
| Spermidine | 1623 | 1769 * | 1350 | 2194 * | 125 | ≤0.01 | 0.40 | 0.44 |
| Trans-4-hydroxyproline | 581,997 | 650,934 * | 462,090 | 587,206 * | 30,640 | ≤0.01 | 0.25 | 0.51 |
| Vitamins | ||||||||
| Creatine | 202,876 | 24,225 * | 194,651 | 61,177 * | 18,256 | ≤0.01 | 0.12 | 0.80 |
| Isothreonic acid | 31,145 | 28,587 * | 44,912 | 38,834 | 1612 | 0.02 | ≤0.01 | 0.11 |
| Methionine sulfoxide | 46,777 | 50,248 * | 33,994 | 54,009 * | 2550 | ≤0.01 | 0.52 | 0.64 |
| N-acetyl-D-galactosamine | 4327 | 3112 | 9057 | 4913 # | 608 | 0.23 | ≤0.01 | 0.09 |
| N-acetylglycine | 2720 | 1839 | 916 | 1069 | 300 | 0.61 | ≤0.01 | 0.79 |
| N-epsilon-trimethyllysine | 5077 | 2024 * | 2594 | 1728 | 304 | ≤0.01 | ≤0.01 | 0.09 |
| Nicotinamide | 7677 | 13,374 * | 106,67 | 10,662 | 655 | ≤0.01 | 0.91 | 0.02 |
| Pentitol | 1914 | 927 * | 954 | 587 | 110 | ≤0.01 | ≤0.01 | 0.54 |
| Threonic acid | 18,822 | 12,198 | 19,678 | 10,973 * | 851 | ≤0.01 | 0.50 | ≤0.01 |
| Tocopherol alpha | 38,575 | 49,087 * | 27,368 | 22,267 | 2628 | ≤0.01 | ≤0.01 | ≤0.01 |
| Tocopherol gamma | 2279 | 2942 * | 1236 | 1220 | 172 | ≤0.01 | ≤0.01 | ≤0.01 |
| Lipids | ||||||||
| Zymosterol | 9932 | 8408 # | 5406 | 8045 * | 619 | ≤0.01 | 0.07 | 0.37 |
| Miscellaneous | ||||||||
| Butyrolactam | 22,155 | 17,057 | 25,627 | 16,183 # | 1314 | 0.42 | 0.73 | 0.04 |
| Dihydroxybutanoic acid 2-3 | 30,697 | 39,023 * | 19,976 | 39,404 * | 2054 | ≤0.01 | 0.13 | 0.56 |
| Ethanolamine | 159,642 | 114,369 | 185,066 | 136,941 | 8063 | 0.73 | 0.05 | 0.34 |
| Phenylacetic acid | 2038 | 3109 * | 1674 | 2521 * | 172 | ≤0.01 | 0.09 | 0.11 |
| Pseudouridine | 4679 | 2651 | 5355 | 3891 | 337 | 0.34 | 0.02 | 0.99 |
| Succinic acid | 907,060 | 509,673 | 2,894,350 | 982,356 * | 201,883 | ≤0.01 | ≤0.01 | 0.02 |
| Ingredients 5, % | Starter 2 | Grower 3 | Finisher 4 | ||
|---|---|---|---|---|---|
| NP | LP | NP | LP | ||
| Corn, yellow dent | 60.58 | 65.34 | 79.59 | 69.99 | 83.81 |
| Soybean meal, 47.5% CP | 33.05 | 28.94 | 13.26 | 25.04 | 9.58 |
| Dicalcium phosphate 18.5% | 2.09 | 1.71 | 2.12 | 1.50 | 1.98 |
| Limestone | 1.18 | 1.09 | 1.07 | 0.95 | 0.95 |
| Salt | 0.44 | 0.33 | 0.32 | 0.25 | 0.25 |
| Choline Chloride 60% | 0.12 | 0.08 | 0.08 | 0.03 | 0.03 |
| Minerals and vitamins premix 6 | 0.40 | 0.40 | 0.40 | 0.37 | 0.40 |
| Magnesium oxide | 0.83 | 0.72 | 0.70 | 0.75 | 0.75 |
| L-Lysine HCl | 0.19 | 0.17 | 0.64 | 0.10 | 0.57 |
| DL-Methionine | 0.23 | 0.12 | 0.19 | 0.08 | 0.14 |
| L-Threonine | 0.17 | 0.16 | 0.37 | 0.15 | 0.36 |
| L-Tryptophan | - | - | 0.09 | - | 0.10 |
| L-Isoleucine | 0.07 | 0.06 | 0.05 | 0.05 | 0.06 |
| L-Valine | 0.10 | 0.09 | 0.11 | 0.05 | 0.12 |
| Glycine | 0.55 | 0.49 | 0.72 | 0.37 | 0.60 |
| Chromium oxide | - | 0.30 | 0.30 | 0.30 | 0.31 |
| Calculated Nutrient Content | |||||
| Dry matter, % | 88.98 | 88.93 | 88.70 | 88.97 | 88.73 |
| ME, kcal/kg | 3256 | 3270 | 3274 | 3284 | 3285 |
| Crude protein, % | 21.80 | 20.09 | 14.75 | 18.39 | 13.17 |
| Crude fiber, % | 2.52 | 2.49 | 2.28 | 2.46 | 2.25 |
| Crude fat, % | 3.35 | 3.42 | 3.50 | 3.48 | 3.56 |
| L-Lysine, % | 1.11 | 1.00 | 0.99 | 0.85 | 0.85 |
| L-Threonine, % | 0.80 | 0.73 | 0.73 | 0.68 | 0.68 |
| DL-Methionine, % | 0.50 | 0.38 | 0.38 | 0.33 | 0.32 |
| L-Tryptophan, % | 0.23 | 0.21 | 0.21 | 0.19 | 0.19 |
| Glycine, % | 1.25 | 1.14 | 1.14 | 0.97 | 0.97 |
| L-Isoleucine, % | 0.80 | 0.73 | 0.47 | 0.66 | 0.42 |
| L-Valine, % | 0.89 | 0.83 | 0.60 | 0.73 | 0.55 |
| L-Leucine, % | 1.50 | 1.42 | 1.06 | 1.34 | 0.99 |
| L-Histidine, % | 0.65 | 0.59 | 0.37 | 0.54 | 0.32 |
| L-Arginine, % | 1.21 | 1.09 | 0.66 | 0.99 | 0.56 |
| L-Phenylalanine, % | 0.87 | 0.80 | 0.53 | 0.74 | 0.47 |
| Calcium, % | 1.04 | 0.90 | 0.93 | 0.80 | 0.85 |
| Phosphorus, % | 0.79 | 0.70 | 0.71 | 0.65 | 0.67 |
| Analyzed Chemical Composition | |||||
| Dry matter, % | 87.00 | 87.60 | 87.20 | 86.80 | 87.10 |
| Crude protein, % | 18.50 | 19.40 | 14.10 | 17.20 | 12.70 |
| Crude fat, % | 2.40 | 2.30 | 2.50 | 2.50 | 2.60 |
| Calcium, % | 1.33 | 1.34 | 1.07 | 1.08 | 1.15 |
| Phosphorus, % | 0.83 | 0.73 | 0.78 | 0.69 | 0.67 |
Disclaimer/Publisher’s Note: The statements, opinions and data contained in all publications are solely those of the individual author(s) and contributor(s) and not of MDPI and/or the editor(s). MDPI and/or the editor(s) disclaim responsibility for any injury to people or property resulting from any ideas, methods, instructions or products referred to in the content. |
© 2024 by the authors. Licensee MDPI, Basel, Switzerland. This article is an open access article distributed under the terms and conditions of the Creative Commons Attribution (CC BY) license (https://creativecommons.org/licenses/by/4.0/).
Share and Cite
Sutton, J.; Habibi, M.; Shili, C.N.; Beker, A.; Salak-Johnson, J.L.; Foote, A.; Pezeshki, A. Low-Protein Diets Differentially Regulate Energy Balance during Thermoneutral and Heat Stress in Cobb Broiler Chicken (Gallus domesticus). Int. J. Mol. Sci. 2024, 25, 4369. https://doi.org/10.3390/ijms25084369
Sutton J, Habibi M, Shili CN, Beker A, Salak-Johnson JL, Foote A, Pezeshki A. Low-Protein Diets Differentially Regulate Energy Balance during Thermoneutral and Heat Stress in Cobb Broiler Chicken (Gallus domesticus). International Journal of Molecular Sciences. 2024; 25(8):4369. https://doi.org/10.3390/ijms25084369
Chicago/Turabian StyleSutton, Julia, Mohammad Habibi, Cedrick N. Shili, Ali Beker, Janeen L. Salak-Johnson, Andrew Foote, and Adel Pezeshki. 2024. "Low-Protein Diets Differentially Regulate Energy Balance during Thermoneutral and Heat Stress in Cobb Broiler Chicken (Gallus domesticus)" International Journal of Molecular Sciences 25, no. 8: 4369. https://doi.org/10.3390/ijms25084369
APA StyleSutton, J., Habibi, M., Shili, C. N., Beker, A., Salak-Johnson, J. L., Foote, A., & Pezeshki, A. (2024). Low-Protein Diets Differentially Regulate Energy Balance during Thermoneutral and Heat Stress in Cobb Broiler Chicken (Gallus domesticus). International Journal of Molecular Sciences, 25(8), 4369. https://doi.org/10.3390/ijms25084369