
Review of Patient Gene Profiles Obtained through a Non-Negative Matrix Factorization-Based Framework to Determine the Role Inflammation Plays in Neuroblastoma Pathogenesis


Abstract
1. Introduction
- (i)
- MYCN signaling promoting NB cell proliferation and activating MDM2 expression.
- (ii)
- Wnt signaling, which is involved in stemness and increases the level of MYCN.
- (iii)
- ALK signaling, which activates the expression of PI3K/AKT/mTOR, RAS-MAPK, and MYCN.
- (iv)
- p53-MDM2 pathway, which promotes angiogenesis, MYCN translation and drug resistance.
- (v)
- PI3K/AKT/mTOR pathway which promotes survival and chemoresistance of NB cells.
- (vi)
- RAS-MAPK signaling, which is activated by EGFR, promotes neuroblastoma cell survival.
- (vii)
2. Results and Discussions
- i.
- B-cell activation.
- ii.
- Axon growth guidance mediated by netrins, which act as growth factors and promote growth activity in target cells (netrin-mediated axon guidance) [19].
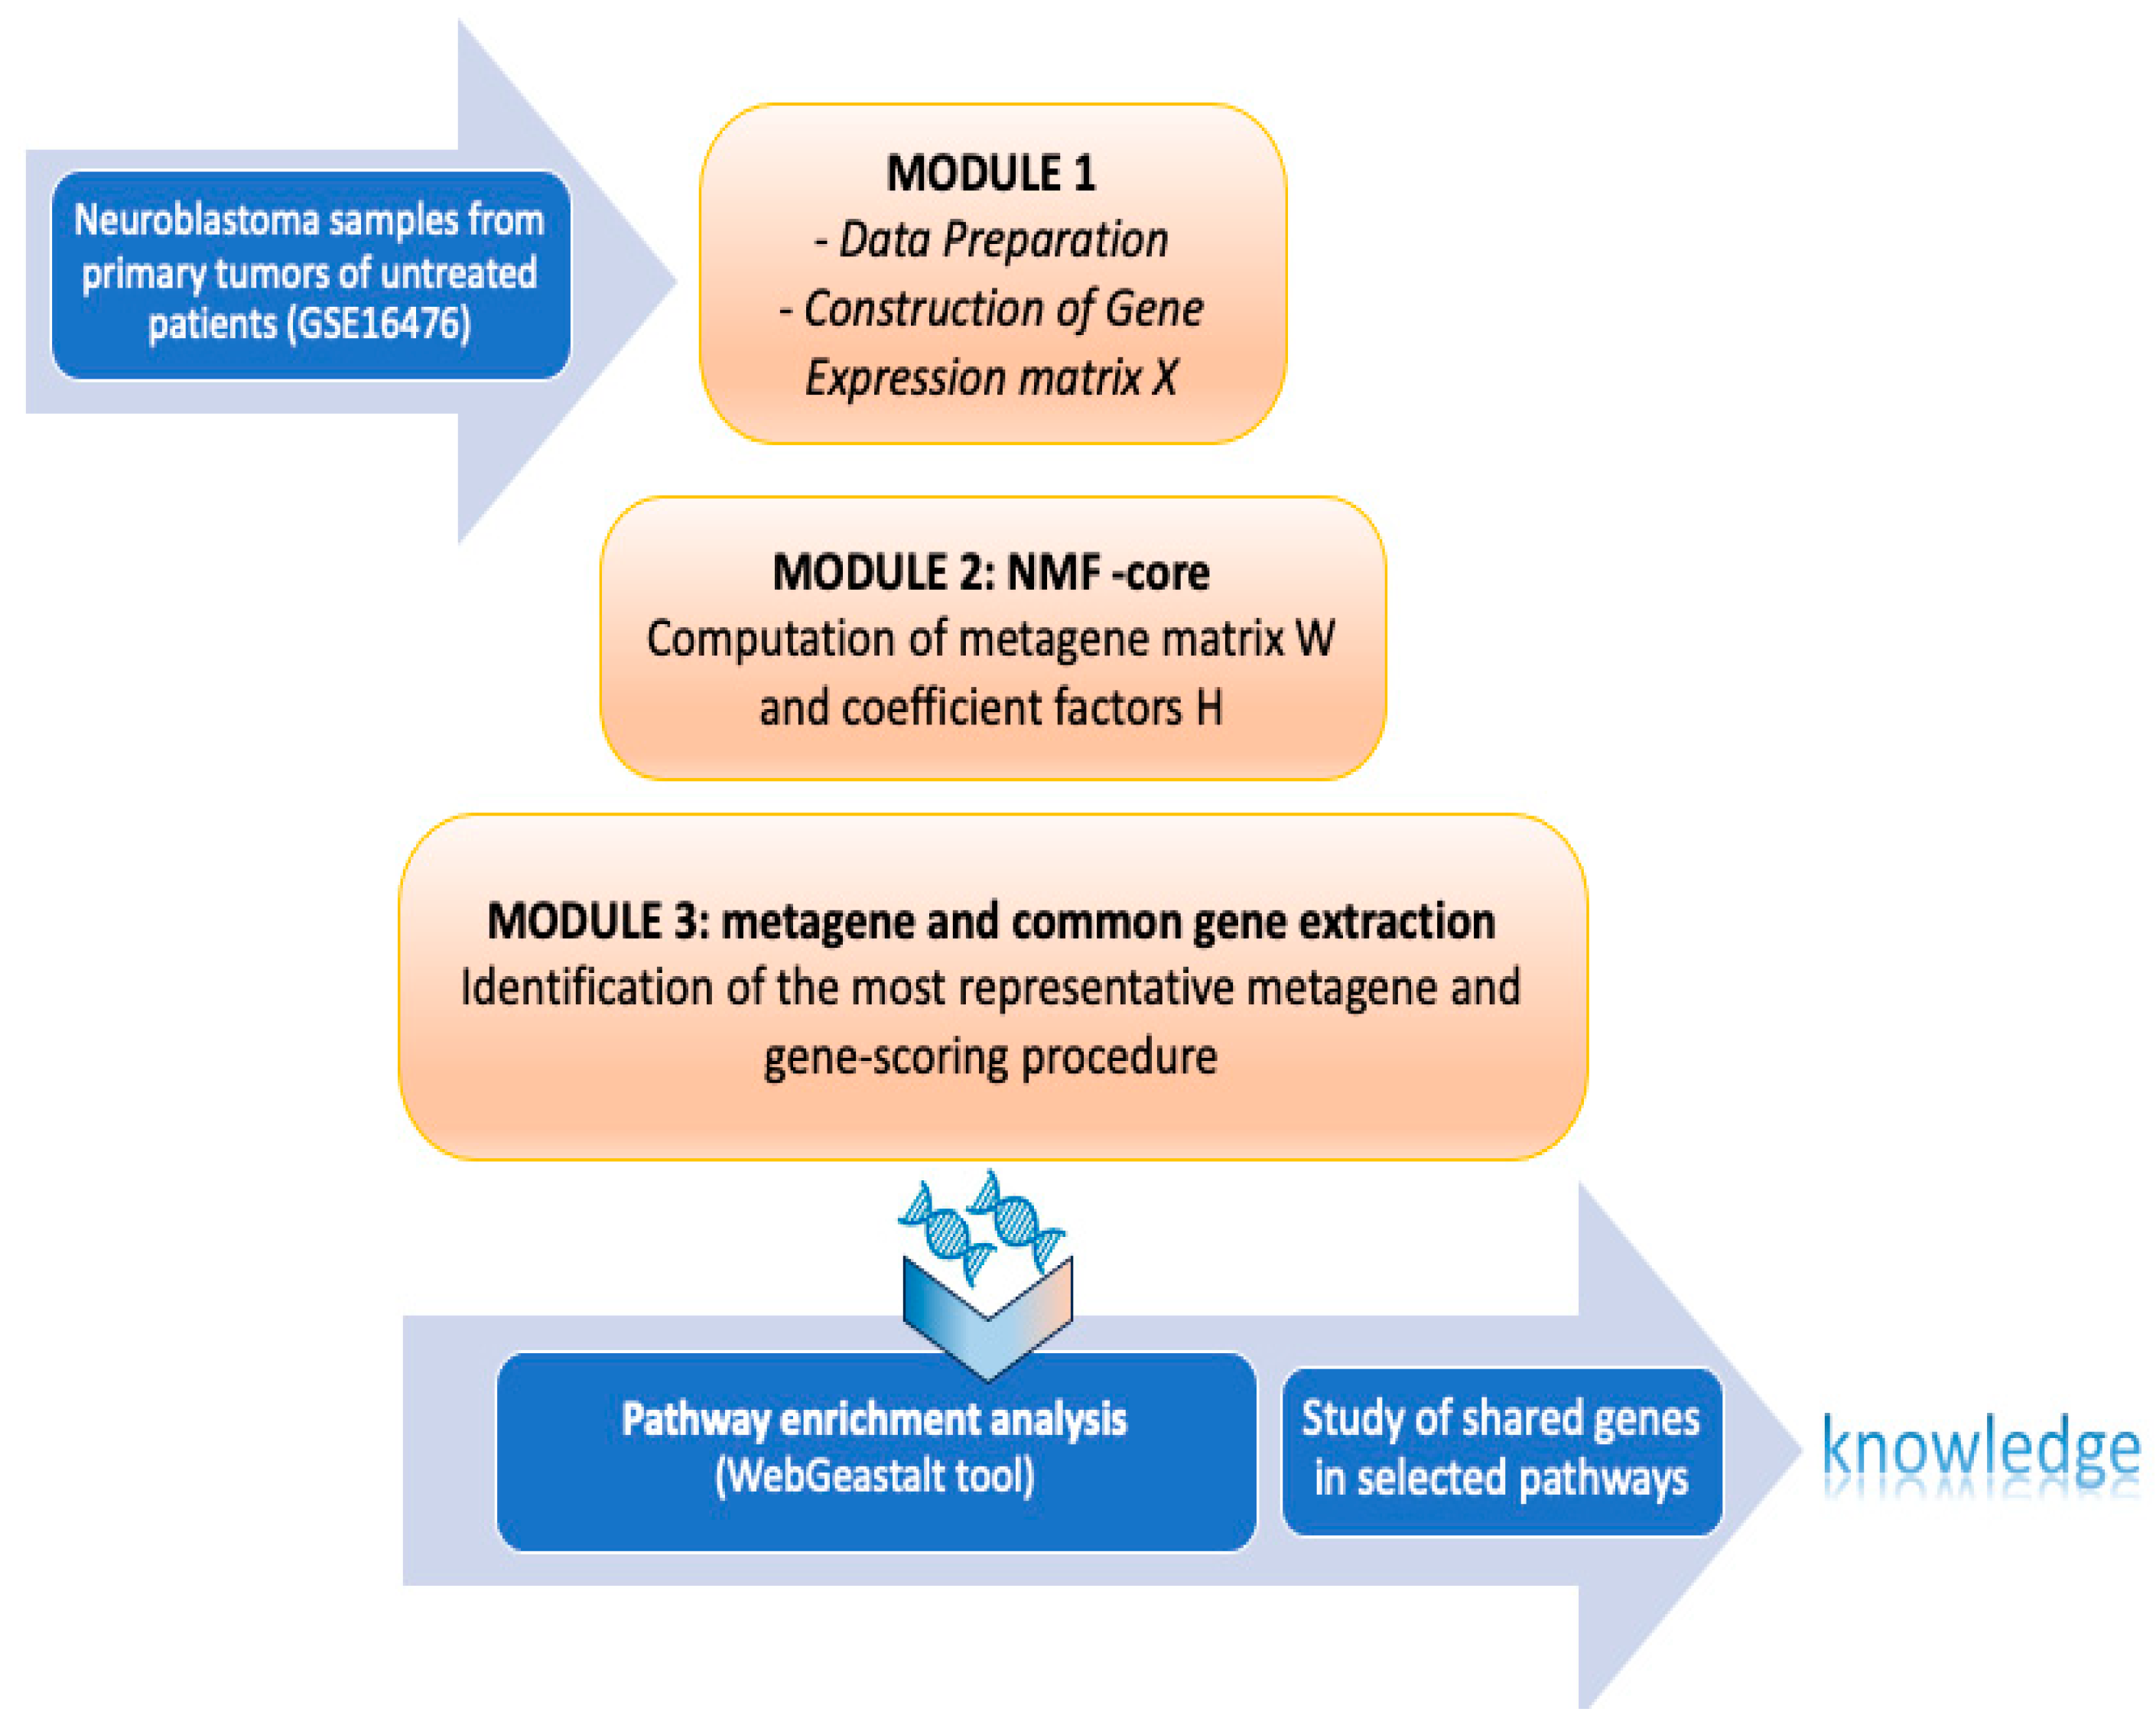
3. Materials and Methods
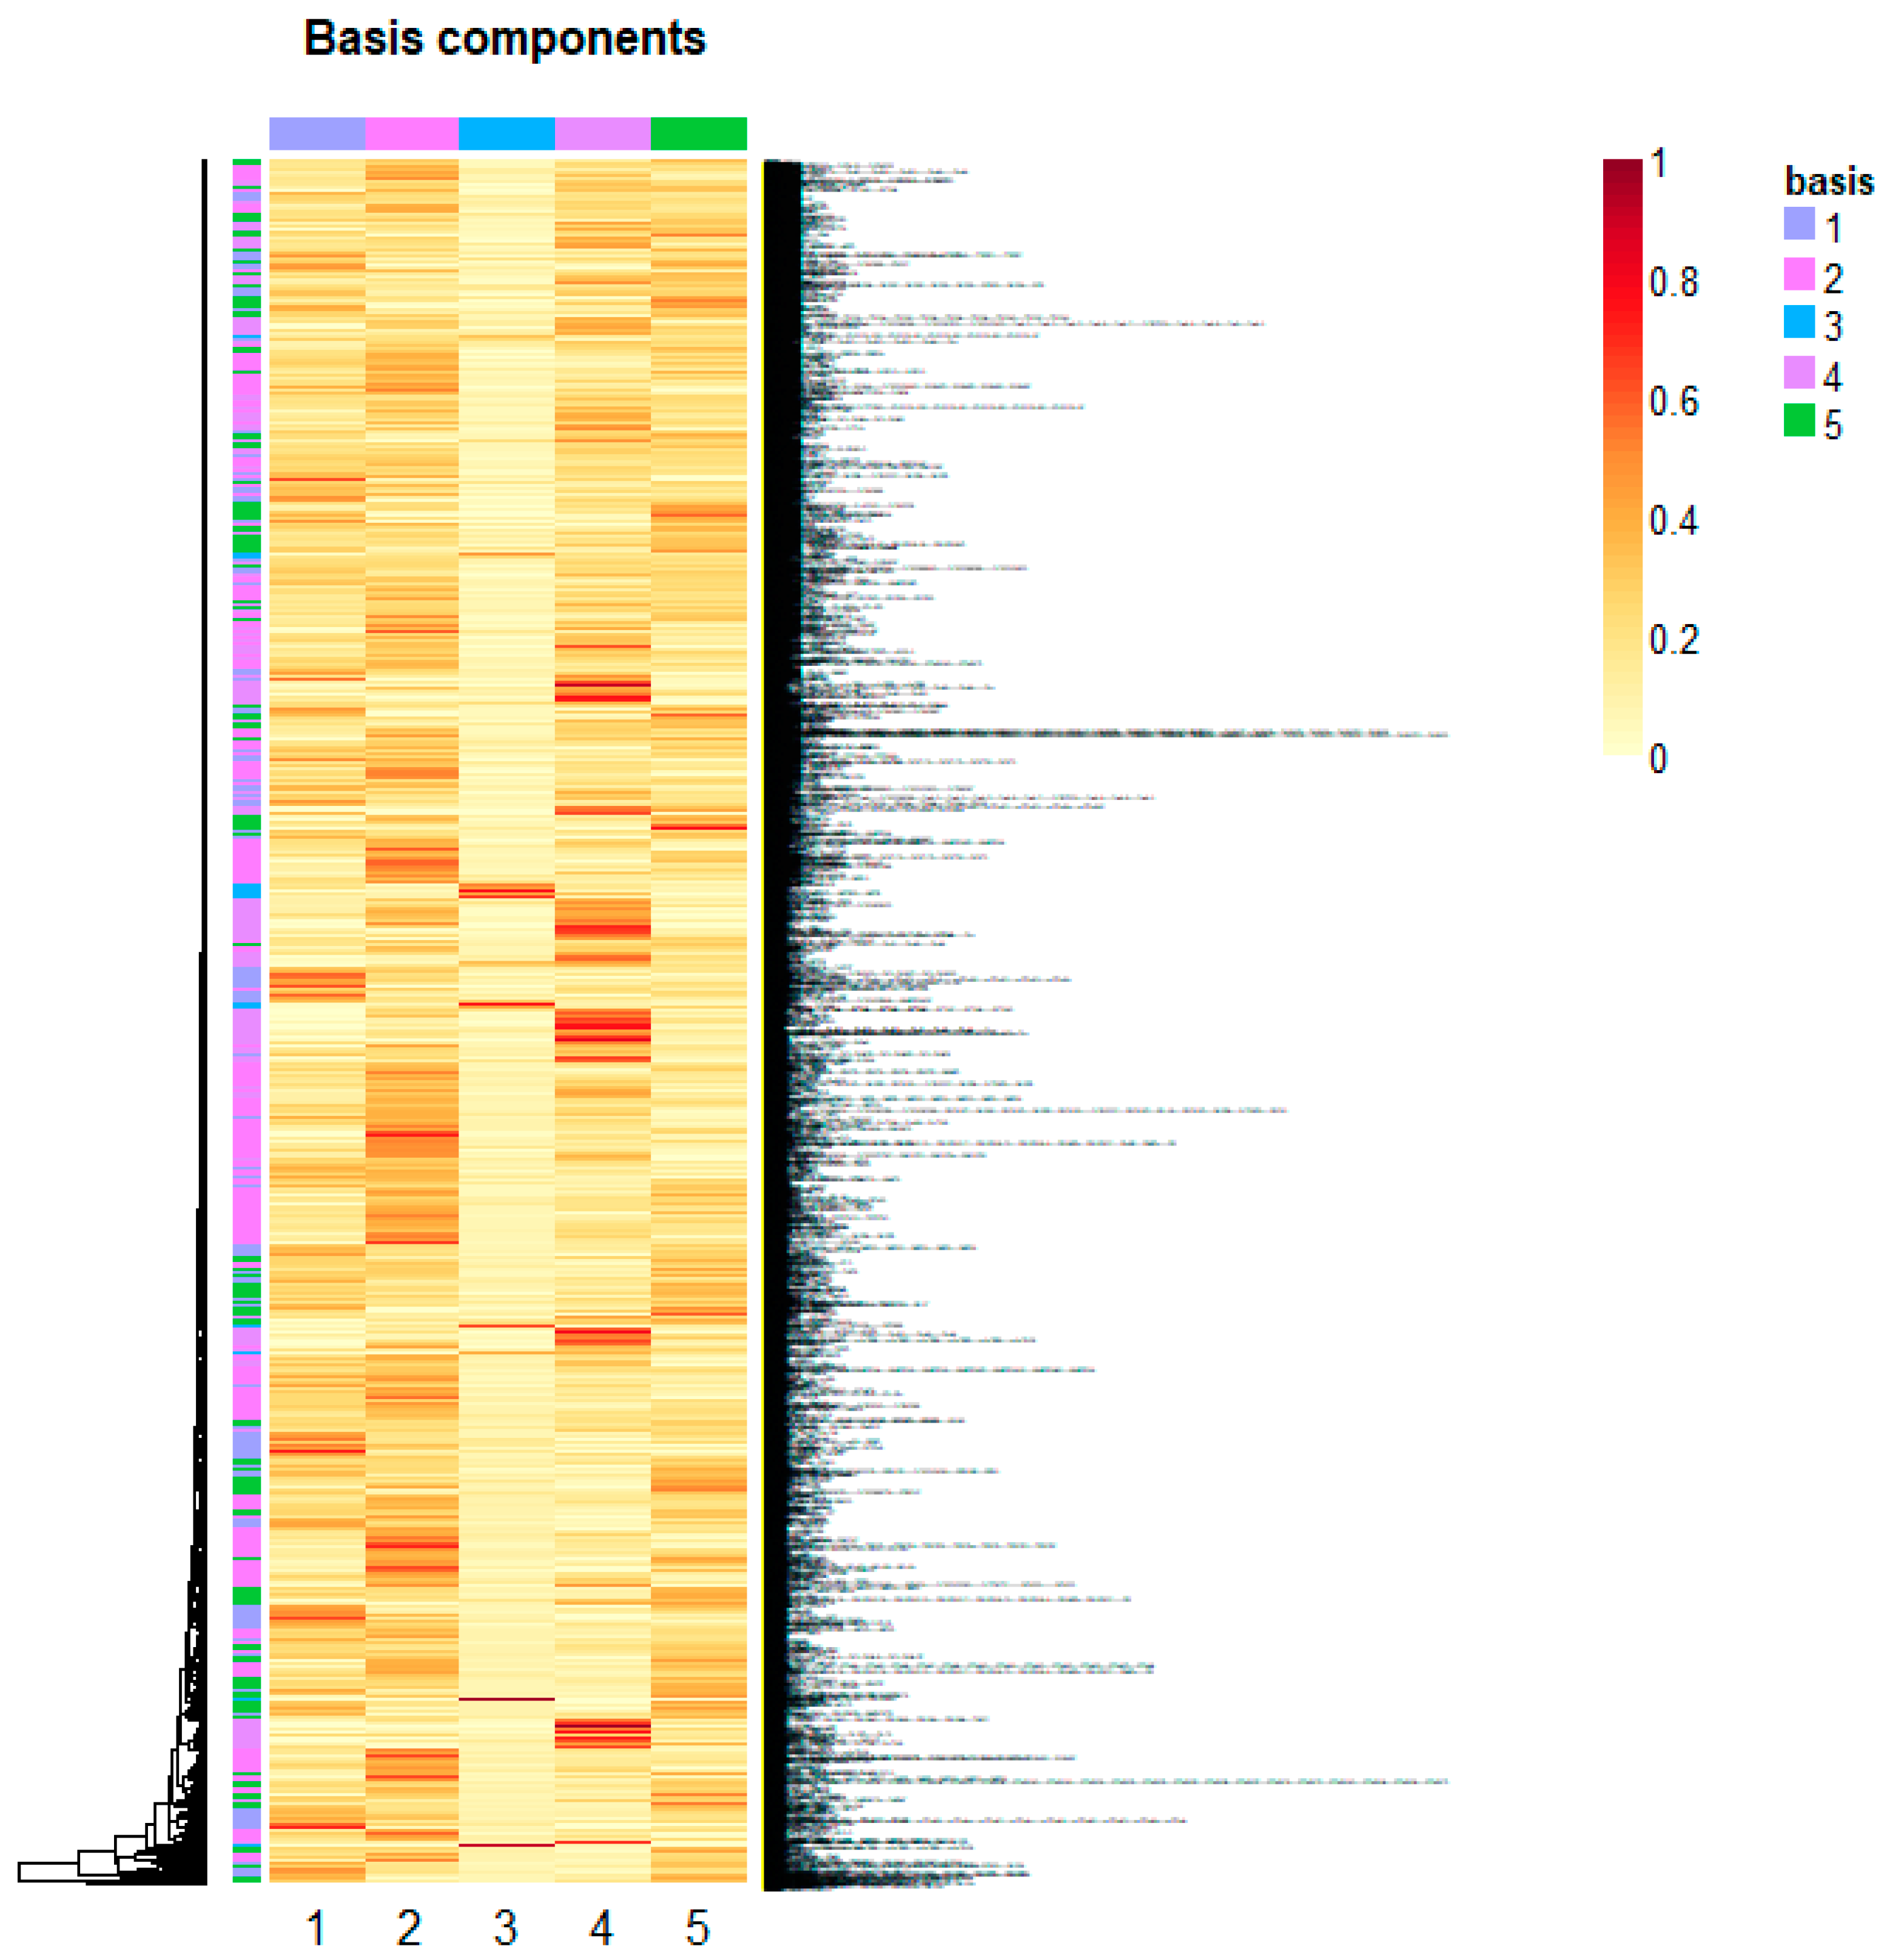
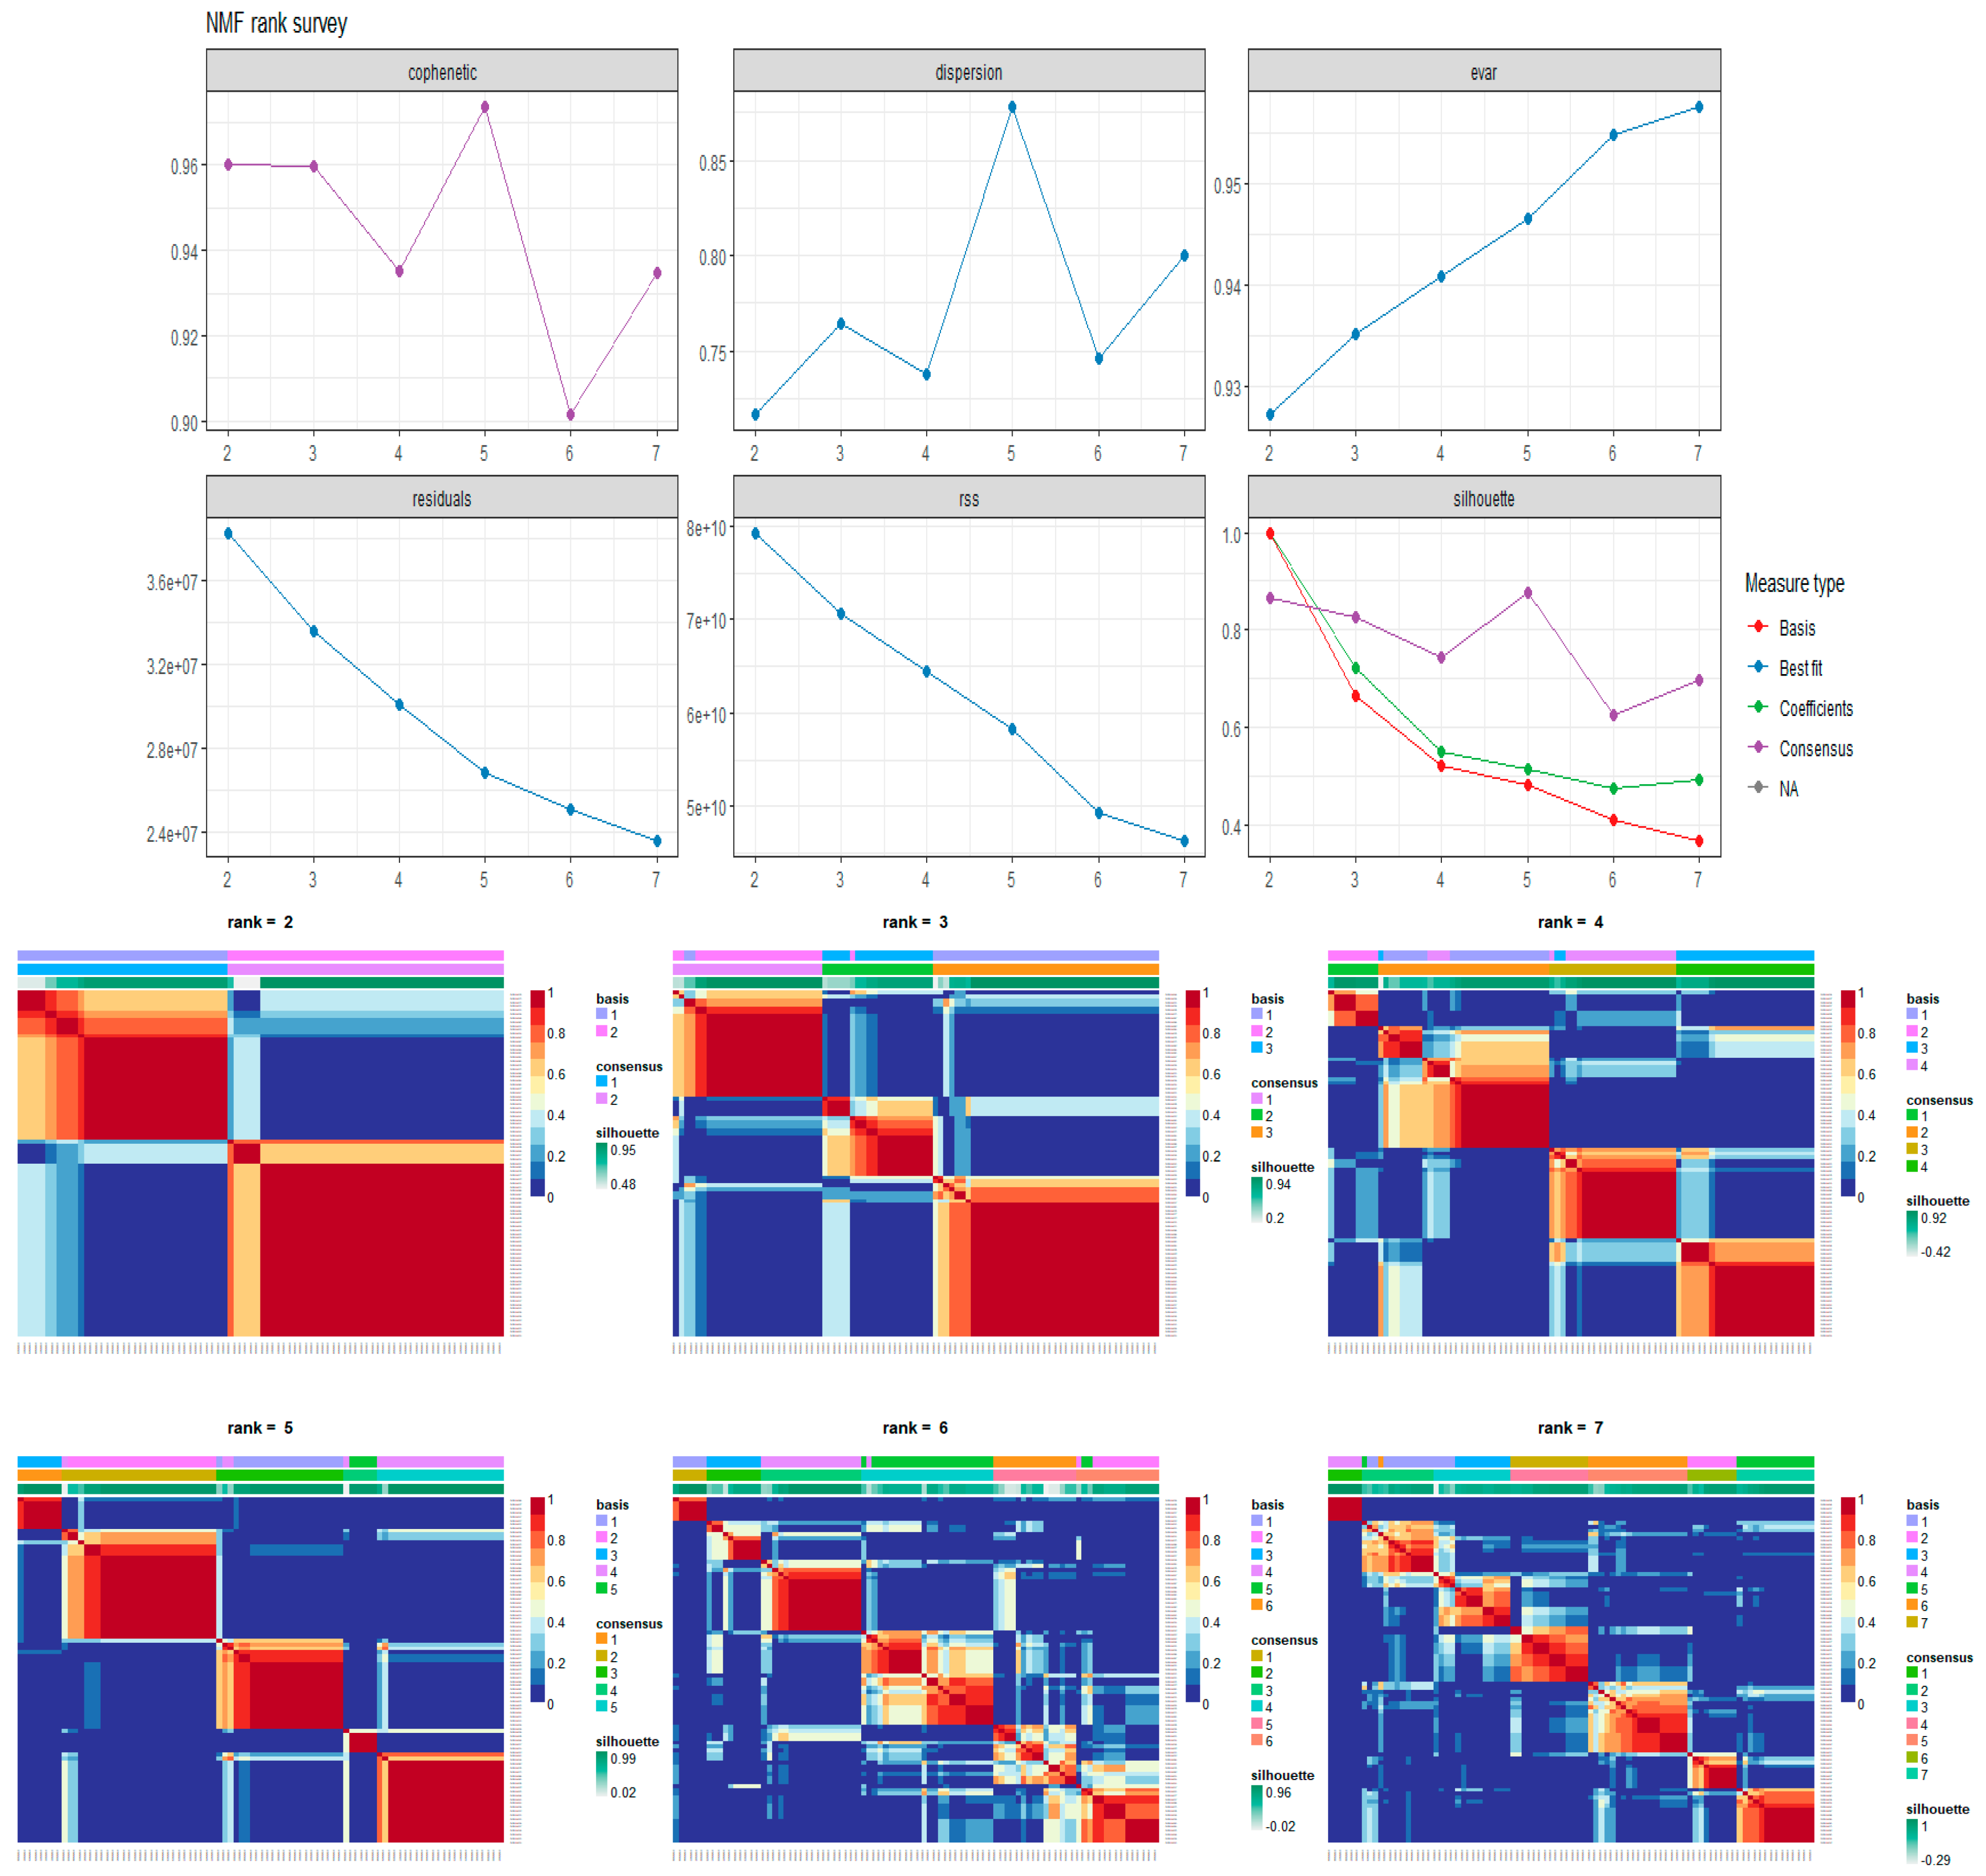
Non-Negative Matrix Factorization for Automatic Gene Extraction
4. Conclusions
Supplementary Materials
Author Contributions
Funding
Institutional Review Board Statement
Informed Consent Statement
Data Availability Statement
Acknowledgments
Conflicts of Interest
Abbreviations
| ACTA2 | actin alpha 2, smooth muscle |
| ACTG2 | actin gamma 2, smooth muscle |
| AKT | Akt kinase |
| ALK | ALK receptor tyrosine kinase |
| ALOX5AP | arachidonate 5-lipoxygenase activating protein |
| AP1 | K-box region and MADS-box transcription factor family protein |
| BLNK | B cell linker |
| BTK | Bruton tyrosine kinaseC5AR1 |
| C5AR1 | complement C5a receptor 1 |
| CCL1 | C-C motif chemokine ligand 1 |
| CCL11 | C-C motif chemokine ligand 11 |
| CCL13 | C-C motif chemokine ligand 13 |
| CCL18 | C-C motif chemokine ligand 18 |
| CCL2 | C-C motif chemokine ligand 2 |
| CCL21 | C-C motif chemokine ligand 21 |
| CCL4 | C-C motif chemokine ligand 4 |
| CCL5 | C-C motif chemokine ligand 5 |
| CCL8 | C-C motif chemokine ligand 8 |
| CCR1 | C-C motif chemokine receptor 1 |
| CCR2 | C-C motif chemokine receptor 2 |
| CCR5 | C-C motif chemokine receptor 5 |
| CCR7 | C-C motif chemokine receptor 7 |
| CD14 | CD14 molecule |
| CD19 | CD19 molecule |
| CD247 | CD247 molecule |
| CD28 | CD28 molecule |
| CD3D | CD3 delta subunit of T-cell receptor |
| CD3E | CD3 epsilon subunit of T-cell receptor complex |
| CD3G | CD3 gamma subunit of T-cell receptor complex |
| CD74 | CD74 molecule |
| CD86 | CD86 molecule |
| COL10A1 | collagen type X alpha 1 chain |
| COL11A1 | collagen type XI alpha 1 chain |
| COL12A1 | collagen type XII alpha 1 chain |
| COL14A1 | collagen type XIV alpha 1 chain |
| COL15A1 | collagen type XV alpha 1 chain |
| COL4A5 | collagen type IV alpha 5 chain |
| COL5A1 | collagen type V alpha 1 chain |
| COL5A2 | collagen type V alpha 2 chain |
| COL5A3 | collagen type V alpha 3 chain |
| COL6A2 | collagen type VI alpha 2 chain |
| COL6A3 | collagen type VI alpha 3 chain |
| COL8A1 | collagen type VIII alpha 1 chain |
| COL8A2 | collagen type VIII alpha 2 chain |
| CX3CR1 | C-X3-C motif chemokine receptor 1 |
| CXCL10 | C-X-C motif chemokine ligand 10 |
| CXCR1 | C-X-C motif chemokine receptor 1 |
| EGFR | epidermal growth factor receptor |
| FACIT | collageni associati a fibrille con triple eliche interrotte |
| FLNA | filamin A |
| FOS | Fos proto-oncogene, AP-1 transcription factor subunit |
| FPR1 | formyl peptide receptor 1 |
| FPR3 | formyl peptide receptor 3 |
| HLA-DMB | major histocompatibility complex, class II, DM beta |
| HLA-DPA1 | major histocompatibility complex, class II, DP alpha 1 |
| HLA-DQA1 | major histocompatibility complex, class II, DQ alpha 1 |
| HLA-DQA2 | major histocompatibility complex, class II, DQ alpha 2 |
| HLA-DRA | major histocompatibility complex, class II, DR alpha |
| INF I | interferon I |
| ITGAL | integrin subunit alpha L |
| ITGB7 | integrin subunit beta 7 |
| ITPR3 | inositol 1,4,5-trisphosphate receptor type 3 |
| JUNB | JunB proto-oncogene, AP-1 transcription factor subunit |
| LCK | LCK proto-oncogene, Src family tyrosine kinase |
| LCP2 | lymphocyte cytosolic protein 2 |
| LY96 | lymphocyte antigen 96 |
| MAP3K8 | mitogen-activated protein kinase kinase kinase 8 |
| MAPK | map kinase |
| MDM2 | MDM2 proto-oncogene |
| MHC-I | histocompatibility-1, MHC |
| MHC-II | histocompatibility-2, MHC |
| mTOR | mechanistic target of rapamycin kinase |
| MYC | MYC proto-oncogene |
| MYH11 | myosin heavy chain 11 |
| MYH9 | myosin heavy chain 9 |
| NFATC2 | nuclear factor of activated T cells 2 |
| P53 | tumor protein p53 |
| PGE2 | prostaglandin E2 |
| PI3K | phosphatidylinositol 3-kinase |
| PIK3CG | phosphatidylinositol-4,5-bisphosphate 3-kinase catalytic subunit gamma |
| PIK3R2 | phosphoinositide-3-kinase regulatory subunit 2 |
| PIK3R5 | phosphoinositide-3-kinase regulatory subunit 5 |
| PRRX1 | paired related homeobox 1 |
| PTGS2 | prostaglandin-endoperoxide synthase 2 |
| PTPRC | protein tyrosine phosphatase receptor type C |
| RAC2 | Rac family small GTPase 2 |
| RAS | RAS p21 protein activator 1 |
| SYK | spleen associated tyrosine kinase |
| TLR2 | Toll like receptor 2 |
| TLR3 | Toll like receptor 3 |
| TLR7 | Toll like receptor 7 |
| TrKB | neurotrophic receptor tyrosine kinase 2 |
| VAV1 | vav guanine nucleotide exchange factor |
| VWF | von Willebrand factor |
| WAS | WASP actin nucleation promoting factor |
| WNT | Wnt family signaling pathway |
| ZAP70 | zeta chain of T cell receptor associated protein kinase 70 |
References
- Irwin, M.S.; Park, J.R. Neuroblastoma: Paradigm for precision medicine. Pediatr. Clin. N. Am. 2015, 62, 225–256. [Google Scholar] [CrossRef] [PubMed]
- Kholodenko, I.V.; Kalinovsky, D.V.; Doronin, I.I.; Deyev, S.M.; Kholodenko, R.V. Neuroblastoma Origin and Therapeutic Targets for Immunotherapy. J. Immunol. Res. 2018, 2018, 7394268. [Google Scholar] [CrossRef] [PubMed]
- Pathania, A.S.; Prathipati, P.; Murakonda, S.P.; Murakonda, A.B.; Srivastava, A.; Avadhesh; Byrareddy, S.N.; Coulter, D.W.; Gupta, S.C.; Challagundla, K.B. Immune checkpoint molecules in neuroblastoma: A clinical perspective. Semin. Cancer Biol. 2022, 86 Pt 2, 247–258. [Google Scholar] [CrossRef] [PubMed]
- Lundberg, K.I.; Treis, D.; Johnsen, J.I. Neuroblastoma Heterogeneity, Plasticity, and Emerging Therapies. Curr. Onc. Rep. 2022, 24, 1053–1062. [Google Scholar] [CrossRef] [PubMed]
- Aravindan, N.; Jain, D.; Somasundaram, D.B.; Herman, E.S.; Aravindan, S. Cancer stem cells in neuroblastoma therapy resistance. Cancer Drug Resist. 2019, 2, 948–967. [Google Scholar] [CrossRef]
- Zafar, A.; Wang, W.; Liu, G.; Wang, X.; Xian, W.; McKeon, F.; Foster, J.; Zhou, J.; Zhang, R. Molecular targeting therapies for neuroblastoma: Progress and challenges. Med. Res. Rev. 2021, 41, 961–1021, Erratum in Med. Res. Rev. 2022, 42, 641. [Google Scholar] [CrossRef] [PubMed]
- Ciaccio, R.; De Rosa, P.; Aloisi, S.; Viggiano, M.; Cimadom, L.; Zadran, S.K.; Perini, G.; Milazzo, G. Targeting Oncogenic Transcriptional Networks in Neuroblastoma: From N-Myc to Epigenetic Drugs. Int. J. Mol. Sci. 2021, 22, 12883. [Google Scholar] [CrossRef] [PubMed]
- van Groningen, T.; Koster, J.; Valentijn, L.J.; A Zwijnenburg, D.; Akogul, N.; E Hasselt, N.; Broekmans, M.; Haneveld, F.; E Nowakowska, N.; Bras, J.; et al. Neuroblastoma is composed of two super-enhancer-associated differentiation states. Nat. Genet. 2017, 49, 1261–1266. [Google Scholar] [CrossRef]
- Boeva, V.; Louis-Brennetot, C.; Peltier, A.; Durand, S.; Pierre-Eugène, C.; Raynal, V.; Etchevers, H.C.; Thomas, S.; Lermine, A.; Daudigeos-Dubus, E.; et al. Heterogeneity of neuroblastoma cell identity defined by transcriptional circuitries. Nat. Genet. 2017, 49, 1408–1413. [Google Scholar] [CrossRef]
- van Groningen, T.; Akogul, N.; Westerhout, E.M.; Chan, A.; Hasselt, N.E.; Zwijnenburg, D.A.; Broekmans, M.; Stroeken, P.; Haneveld, F.; Hooijer, G.K.J.; et al. A NOTCH feed-forward loop drives reprogramming from adrenergic to mesenchymal state in neuroblastoma. Nat. Commun. 2019, 10, 1530. [Google Scholar] [CrossRef]
- van Wezel, E.M.; van Zogchel, L.M.; van Wijk, J.; Timmerman, I.; Vo, N.-K.; Zappeij-Kannegieter, L.; Decarolis, B.; Simon, T.; van Noesel, M.M.; Molenaar, J.J.; et al. Mesenchymal Neuroblastoma Cells Are Undetected by Current mRNA Marker Panels: The Development of a Specific Neuroblastoma Mesenchymal Minimal Residual Disease Panel. JCO Precis. Oncol. 2019, 3, 1–11. [Google Scholar] [CrossRef] [PubMed]
- Wolpaw, A.J.; Grossmann, L.D.; Dessau, J.L.; Dong, M.M.; Aaron, B.J.; Brafford, P.A.; Volgina, D.; Pascual-Pasto, G.; Rodriguez-Garcia, A.; Uzun, Y.; et al. Epigenetic state determines inflammatory sensing in neuroblastoma. Proc. Natl. Acad. Sci. USA 2022, 119, e2102358119. [Google Scholar] [CrossRef] [PubMed]
- Liao, Y.; Wang, J.; Jaehnig, E.J.; Shi, Z.; Zhang, B. WebGestalt 2019: Gene set analysis toolkit with revamped UIs and APIs. Nucleic Acids Res. 2019, 47, W199–W205. [Google Scholar] [CrossRef] [PubMed]
- Krzywinski, M.; Schein, J.; Birol, I.; Connors, J.; Gascoyne, R.; Horsman, D.; Jones, S.J.; Marra, M.A. Circos: An information aesthetic for comparative genomics. Genome Res. 2009, 19, 1639–1645. [Google Scholar] [CrossRef]
- Schmid, M.C.; Avraamides, C.J.; Dippold, H.C.; Franco, I.; Foubert, P.; Ellies, L.G.; Acevedo, L.M.; Manglicmot, J.R.; Song, X.; Wrasidlo, W.; et al. Receptor tyrosine kinases and TLR/IL1Rs unexpectedly activate myeloid cell PI3kγ, a single convergent point promoting tumor inflammation and progression. Cancer Cell. 2011, 19, 715–727. [Google Scholar] [CrossRef]
- Müller, M.R.; Rao, A. NFAT, immunity and cancer: A transcription factor comes of age. Nat. Rev. Immunol. 2010, 10, 645–656. [Google Scholar] [CrossRef]
- Nguyen, T.; Di Giovanni, S. NFAT signaling in neural development and axon growth. Int. J. Dev. Neurosci. 2008, 26, 141–145. [Google Scholar] [CrossRef]
- Shou, J.; Jing, J.; Xie, J.; You, L.; Jing, Z.; Yao, J.; Han, W.; Pan, H. Nuclear factor of activated T cells in cancer development and treatment. Cancer Lett. 2015, 361, 174–184. [Google Scholar] [CrossRef]
- Boneschansker, L.; Nakayama, H.; Eisenga, M.; Wedel, J.; Klagsbrun, M.; Irimia, D.; Briscoe, D.M. Netrin-1 Augments Chemokinesis in CD4+ T Cells In Vitro and Elicits a Proinflammatory Response In Vivo. J. Immunol. 2016, 197, 1389–1398. [Google Scholar] [CrossRef]
- Papavassiliou, A.G.; Musti, A.M. The Multifaceted Output of c-Jun Biological Activity: Focus at the Junction of CD8 T Cell Activation and Exhaustion. Cells 2020, 9, 2470. [Google Scholar] [CrossRef]
- Perotti, V.; Baldassari, P.; Molla, A.; Nicolini, G.; Bersani, I.; Grazia, G.; Benigni, F.; Maurichi, A.; Santinami, M.; Anichini, A.; et al. An actionable axis linking NFATc2 to EZH2 controls the EMT-like program of melanoma cells. Oncogene 2019, 38, 4384–4396. [Google Scholar] [CrossRef] [PubMed]
- Abrial, C.; Grassin-Delyle, S.; Salvator, H.; Brollo, M.; Naline, E.; Devillier, P. 15-Lipoxygenases regulate the production of chemokines in human lung macrophages. Br. J. Pharmacol. 2015, 172, 4319–4330. [Google Scholar] [CrossRef] [PubMed]
- Matthay, K.K.; Maris, J.M.; Schleiermacher, G.; Nakagawara, A.; Mackall, C.L.; Diller, L.; Weiss, W.A. Neuroblastoma. Nat. Rev. Dis. Primers. 2016, 2, 16078. [Google Scholar] [CrossRef] [PubMed]
- Ala, M. The footprint of kynurenine pathway in every cancer: A new target for chemotherapy. Eur. J. Pharmacol. 2021, 896, 173921. [Google Scholar] [CrossRef] [PubMed]
- Santos-Sierra, S. Targeting. Toll-like Receptor (TLR) Pathways in Inflammatory Arthritis: Two Better Than One? Biomolecules 2021, 11, 1291. [Google Scholar] [CrossRef] [PubMed]
- Takeuchi, O.; Akira, S. Pattern recognition receptors and inflammation. Cell 2010, 140, 805–820. [Google Scholar] [CrossRef] [PubMed]
- Axelrod, M.L.; Cook, R.S.; Johnson, D.B.; Balko, J.M. Biological Consequences of MHC-II Expression by Tumor Cells in Cancer. Clin. Cancer Res. 2019, 25, 2392–2402. [Google Scholar] [CrossRef] [PubMed]
- Rodig, S.J.; Gusenleitner, D.; Jackson, D.G.; Gjini, E.; Giobbie-Hurder, A.; Jin, C.; Chang, H.; Lovitch, S.B.; Horak, C.; Weber, J.S.; et al. MHC proteins confer differential sensitivity to CTLA-4 and PD-1 blockade in untreated metastatic melanoma. Sci. Transl. Med. 2018, 10, eaar3342. [Google Scholar] [CrossRef] [PubMed]
- Wang, Z.Q.; Milne, K.; Webb, J.R.; Watson, P.H. CD74 and intratumoral immune response in breast cancer. Oncotarget 2017, 8, 12664–12674. [Google Scholar] [CrossRef]
- Bacolod, M.D.; Talukdar, S.; Emdad, L.; Das, S.K.; Sarkar, D.; Wang, X.-Y.; Barany, F.; Fisher, P.B. Immune infiltration, glioma stratification, and therapeutic implications. Transl. Cancer Res. 2016, 5 (Suppl. S4), S652–S656. [Google Scholar] [CrossRef]
- Rheinländer, A.; Schraven, B.; Bommhardt, U. CD45 in human physiology and clinical medicine. Immunol. Lett. 2018, 196, 22–32. [Google Scholar] [CrossRef]
- Dexiu, C.; Xianying, L.; Yingchun, H.; Jiafu, L. Advances in CD247. Scand. J. Immunol. 2022, 96, e13170. [Google Scholar] [CrossRef] [PubMed]
- Esensten, J.H.; Helou, Y.A.; Chopra, G.; Weiss, A.; Bluestone, J.A. CD28 Costimulation: From Mechanism to Therapy. Immunity 2016, 44, 973–988. [Google Scholar] [CrossRef]
- Kennedy, A.; Waters, E.; Rowshanravan, B.; Hinze, C.; Williams, C.; Janman, D.; Fox, T.A.; Booth, C.; Pesenacker, A.M.; Halliday, N.; et al. Differences in CD80 and CD86 transendocytosis reveal CD86 as a key target for CTLA-4 immune regulation. Nat. Immunol. 2022, 23, 1365–1378. [Google Scholar] [CrossRef]
- Fujimoto, M.; Poe, J.C.; Hasegawa, M.; Tedder, T.F. CD19 regulates intrinsic B lymphocyte signal transduction and activation through a novel mechanism of processive amplification. Immunol. Res. 2000, 22, 281–298. [Google Scholar] [CrossRef] [PubMed]
- Mócsai, A.; Ruland, J.; Tybulewicz, V.L. The SYK tyrosine kinase: A crucial player in diverse biological functions. Nat. Rev. Immunol. 2010, 10, 387–402. [Google Scholar] [CrossRef] [PubMed]
- Patmore, S.; Dhami, S.P.S.; O’Sullivan, J.M. Von Willebrand factor and cancer, metastasis and coagulopathies. J. Thromb. Haemost. 2020, 18, 2444–2456. [Google Scholar] [CrossRef]
- Jiang, X.; Wu, M.; Xu, X.; Zhang, L.; Huang, Y.; Xu, Z.; He, K.; Wang, H.; Wang, H.; Teng, L. COL12A1, a novel potential prognostic factor and therapeutic target in gastric cancer. Mol. Med. Rep. 2019, 20, 3103–3112. [Google Scholar] [CrossRef]
- Fitzgerald, J.; Bateman, J.F. A new FACIT of the collagen family: COL21A1. FEBS Lett. 2001, 505, 275–280. [Google Scholar] [CrossRef] [PubMed]
- Wu, Y.; Xu, Y. Integrated bioinformatics analysis of expression and gene regulation network of COL12A1 in colorectal cancer. Cancer Med. 2020, 9, 4743–4755. [Google Scholar] [CrossRef]
- Vallejo-Díaz, J.; Chagoyen, M.; Olazabal-Morán, M.; González-García, A.; Carrera, A.C. The Opposing Roles of PIK3R1/p85α and PIK3R2/p85β in Cancer. Trends Cancer 2019, 5, 233–244. [Google Scholar] [CrossRef]
- Sivoňová, M.K.; Tatarková, Z.; Jurečeková, J.; Kliment, J.; Híveš, M.; Lichardusová, L.; Kaplán, P. Differential profiling of prostate tumors versus benign prostatic tissues by using a 2DE-MALDI-TOF-based proteomic approach. Neoplasma 2021, 68, 154–164. [Google Scholar] [CrossRef] [PubMed]
- Jo, Y.S.M.; Kim, M.S.; Yoo, N.J.; Lee, S.H. Somatic Mutations and Intratumoral Heterogeneity of MYH11 Gene in Gastric and Colorectal Cancers. Appl. Immunohistochem. Mol. Morphol. 2018, 26, 562–566. [Google Scholar] [CrossRef] [PubMed]
- Montojo, J.; Zuberi, K.; Rodriguez, H.; Kazi, F.; Wright, G.; Donaldson, S.L.; Morris, Q.; Bader, G.D. GeneMANIA Cytoscape plugin: Fast gene function predictions on the desktop. Bioinformatics 2010, 26, 2927–2928. [Google Scholar] [CrossRef] [PubMed]
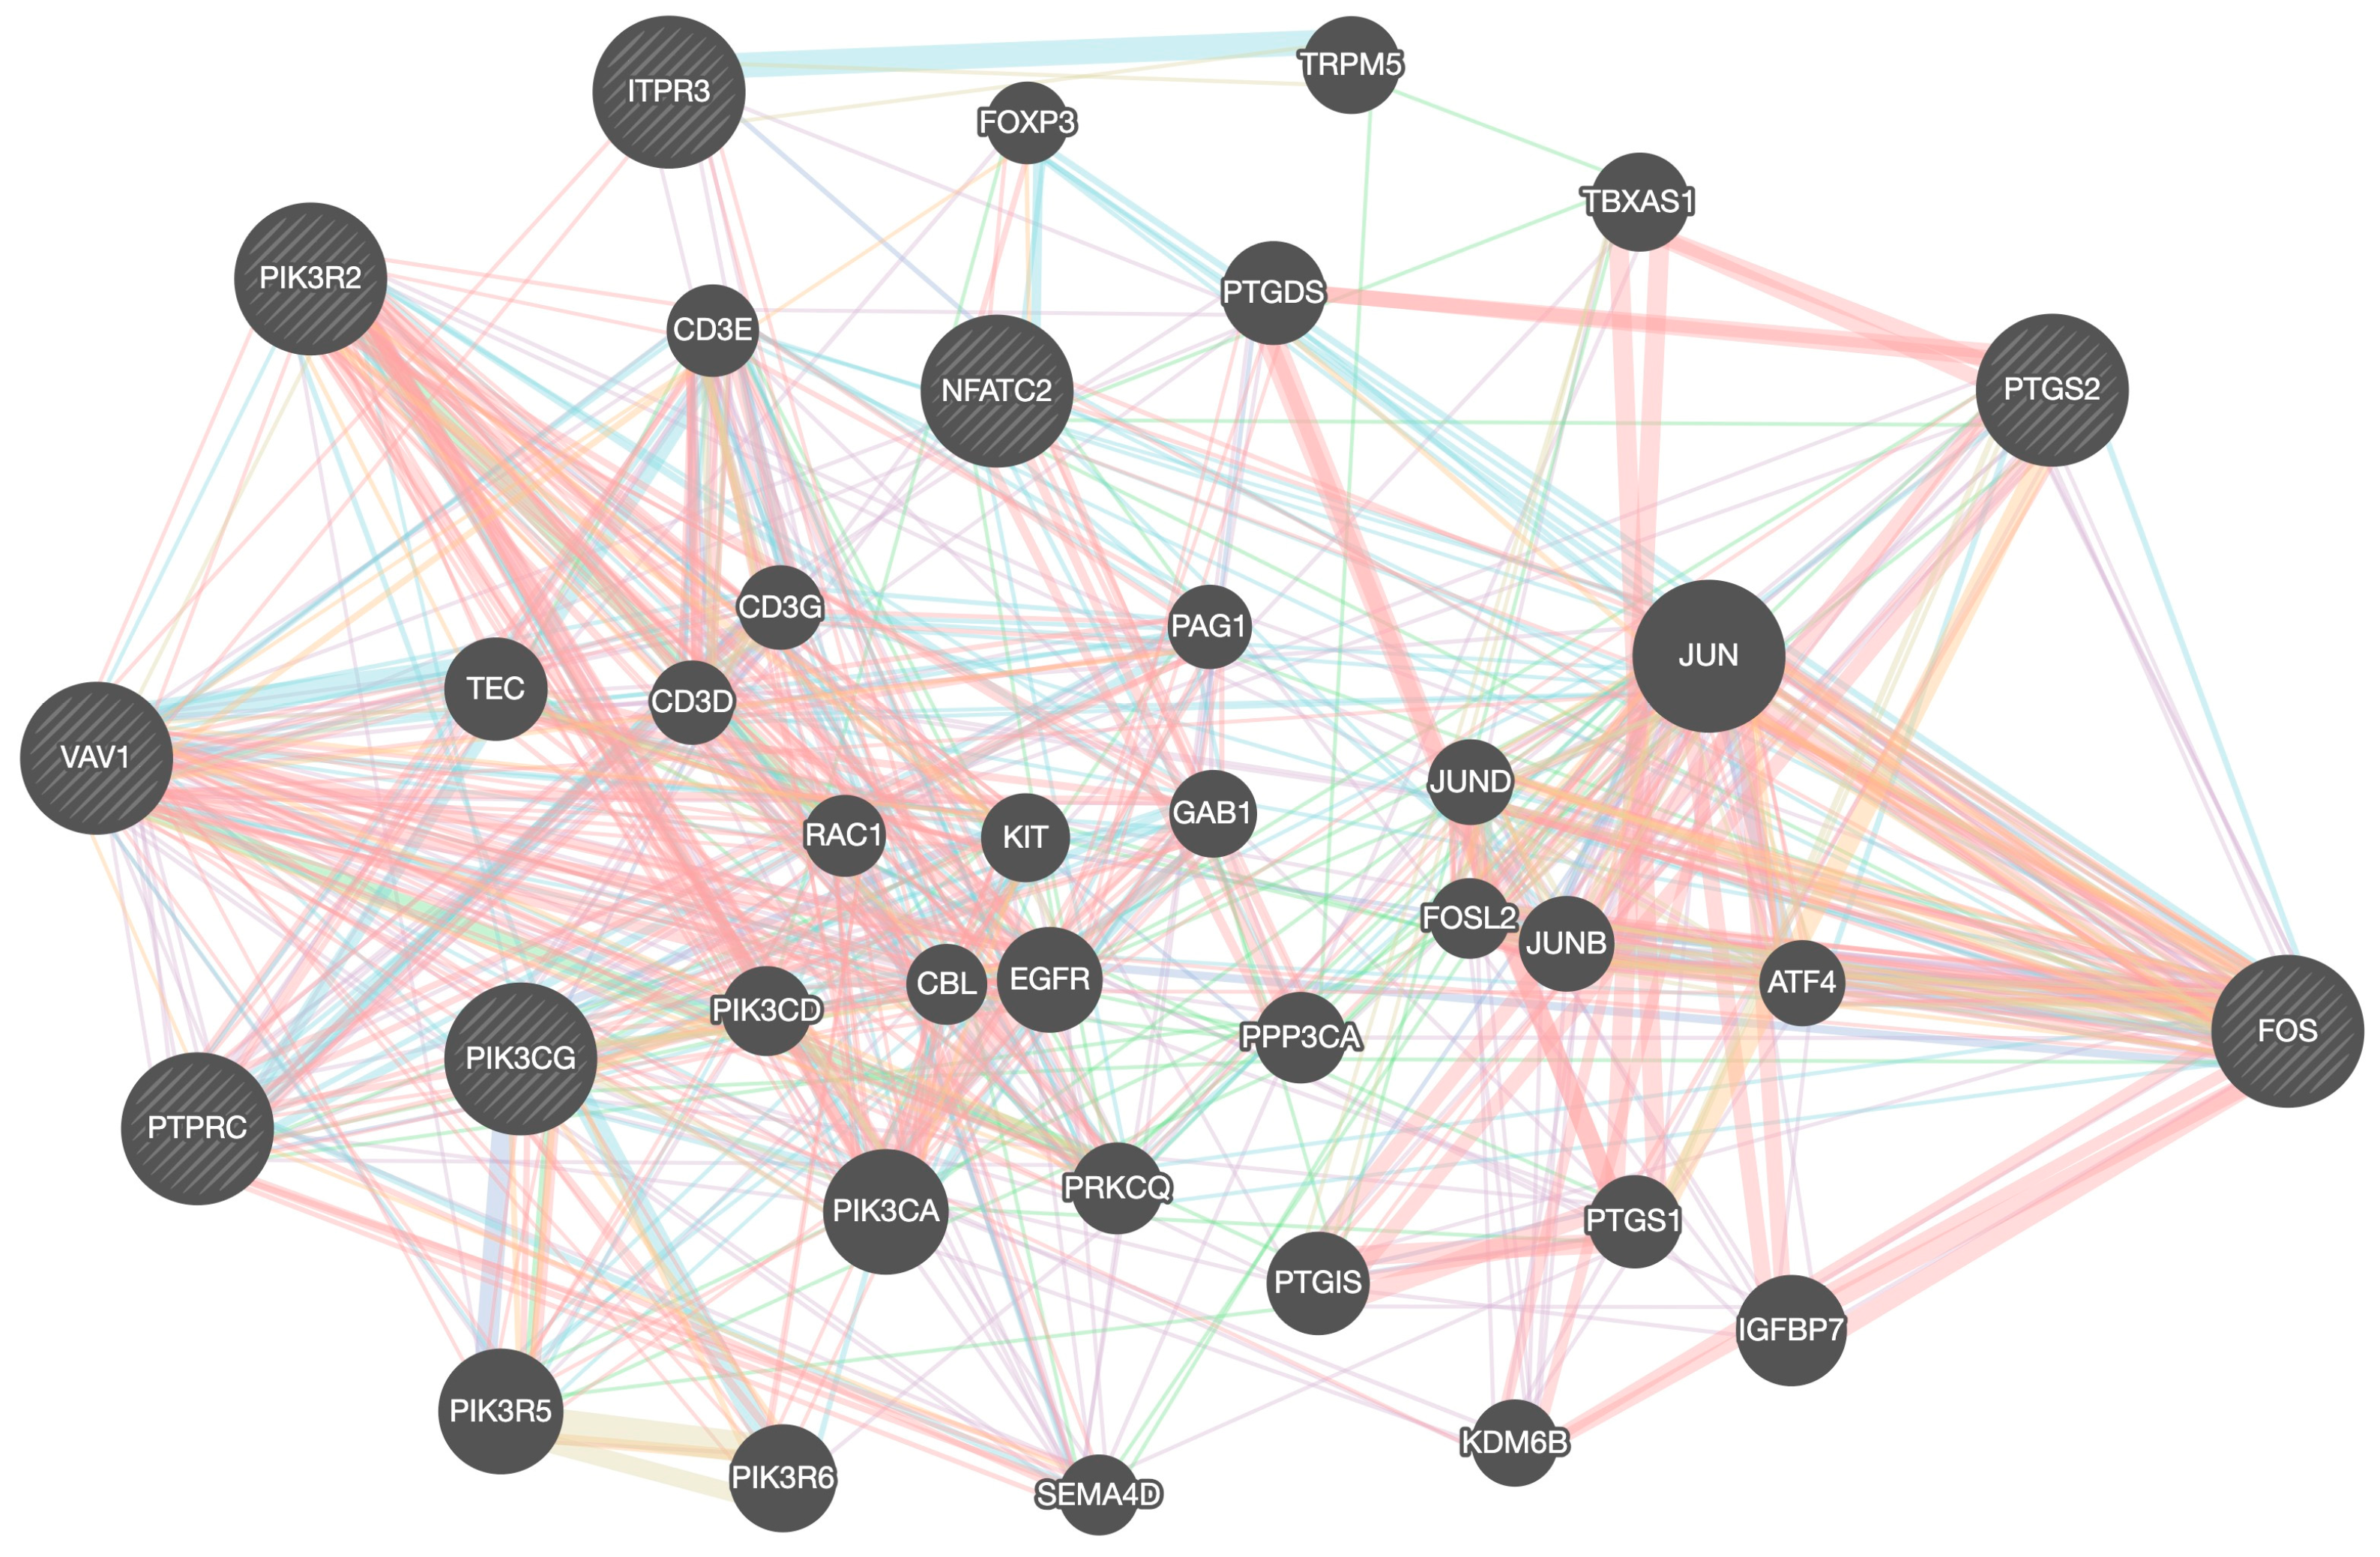
- Szklarczyk, D.; Kirsch, R.; Koutrouli, M.; Nastou, K.; Mehryary, F.; Hachilif, R.; von Mering, C. The STRING database in 2023: Protein–protein association networks and functional enrichment analyses for any sequenced genome of interest. Nucleic Acids Res. 2023, 51, D638–D646. [Google Scholar] [CrossRef] [PubMed]
- Edgar, R.; Domrachev, M.; Lash, A.E. Gene Expression Omnibus: NCBI gene expression and hybridization array data repository. Nucleic Acids Res. 2002, 30, 207–210. [Google Scholar] [CrossRef] [PubMed]
- Molenaar, J.J.; Koster, J.; Zwijnenburg, D.A.; van Sluis, P.; Valentijn, L.J.; van der Ploeg, I.; Hamdi, M.; van Nes, J.; Westerman, B.A.; van Arkel, J.; et al. Sequencing of neuroblastoma identifies chromothripsis and defects in neuritogenesis genes. Nature 2012, 483, 589–593. [Google Scholar] [CrossRef] [PubMed]
- Esposito, F.; Boccarelli, A.; Del Buono, N. An NMF-Based Methodology for Selecting Biomarkers in the Landscape of Genes of Heterogeneous Cancer-Associated Fibroblast Populations. Bioinform. Biol. Insights 2020, 14, 1177932220906827. [Google Scholar] [CrossRef] [PubMed]
- Boccarelli, A.; Del Buono, N.; Esposito, F. Cluster of resistance-inducing genes in MCF-7 cells by estrogen, insulin, methotrexate and tamoxifen extracted via NMF. Pathol. Res. Pract. 2023, 242, 154347. [Google Scholar] [CrossRef]
- Boccarelli, A.; Del Buono, N.; Esposito, F. Colorectal cancer in Crohn’s disease evaluated with genes belonging to fibroblasts of the intestinal mucosa selected by NMF. Pathol. Res. Pract. 2022, 229, 153728. [Google Scholar] [CrossRef]
- Boccarelli, A.; Del Buono, N.; Esposito, F. Analysis of fibroblast genes selected by NMF to reveal the potential crosstalk between ulcerative colitis and colorectal cancer. Exp. Mol. Pathol. 2021, 123, 104713. [Google Scholar] [CrossRef] [PubMed]
- Kim, H.; Park, H. Sparse non-negative matrix factorizations via alternating non-negativity-constrained least squares for microarray data analysis. Bioinformatics 2007, 23, 1495–1502. [Google Scholar] [CrossRef] [PubMed]
- Brunet, J.-P.; Tamayo, P.; Golub, T.R.; Mesirov, J.P. Metagenes and molecular pattern discovery using matrix factorization. Proc. Natl. Acad. Sci. USA 2004, 101, 4164–4169. [Google Scholar] [CrossRef] [PubMed]
- Vayani, O.R.; Kaufman, M.E.; Moore, K.; Chennakesavalu, M.; TerHaar, R.; Chaves, G.; Chlenski, A.; He, C.; Cohn, S.L.; Applebaum, M.A. Adrenergic and mesenchymal signatures are identifiable in cell-free DNA and correlate with metastatic disease burden in children with neuroblastoma. Pediatr. Blood Cancer 2024, 71, e30735. [Google Scholar] [CrossRef] [PubMed]


| Gene Set | Description | Size | Expect | Ratio | p Value | FDR |
|---|---|---|---|---|---|---|
| P00053 | T-cell activation | 75 | 4.8985 | 4.4912 | 4.9299 × 10⁻¹⁰ | 5.5708 × 10⁻⁸ |
| P00031 | Inflammation mediated by chemokine and cytokine signaling pathway | 200 | 13.063 | 2.7559 | 3.6630 × 10⁻⁹ | 2.0696 × 10⁻⁷ |
| P00034 | Integrin signaling pathway | 166 | 10.842 | 2.1214 | 0.00030327 | 0.011423 |
| P00010 | B-cell activation | 58 | 3.7882 | 2.9038 | 0.00099971 | 0.028242 |
| P00054 | Toll receptor signaling pathway | 50 | 3.2657 | 2.1435 | 0.041004 | 0.79098 |
| P00009 | Axon guidance mediated by netrin | 30 | 1.9594 | 2.5518 | 0.041999 | 0.79098 |
| P00050 | Plasminogen activation cascade | 15 | 0.97970 | 3.0622 | 0.069606 | 1 |
| P00033 | Insulin/IGF pathway–protein kinase B signaling cascade | 35 | 2.2860 | 2.1873 | 0.073811 | 1 |
| P00011 | Blood coagulation | 38 | 2.4819 | 2.0146 | 0.097796 | 1 |
| P00047 | PDGF signaling pathway | 125 | 8.1642 | 1.4698 | 0.11051 | 1 |
| T-cell activation | CD247, CD28, CD3D, CD3E, CD3G, CD74, CD86, FOS, HLA-DMB, HLA-DPA1, HLA-DQA1, HLA-DQA2, HLA-DRA, LCK, LCP2, NFATC2, PIK3CG, PIK3R2, PTPRC, VAV1, WAS, ZAP70 |
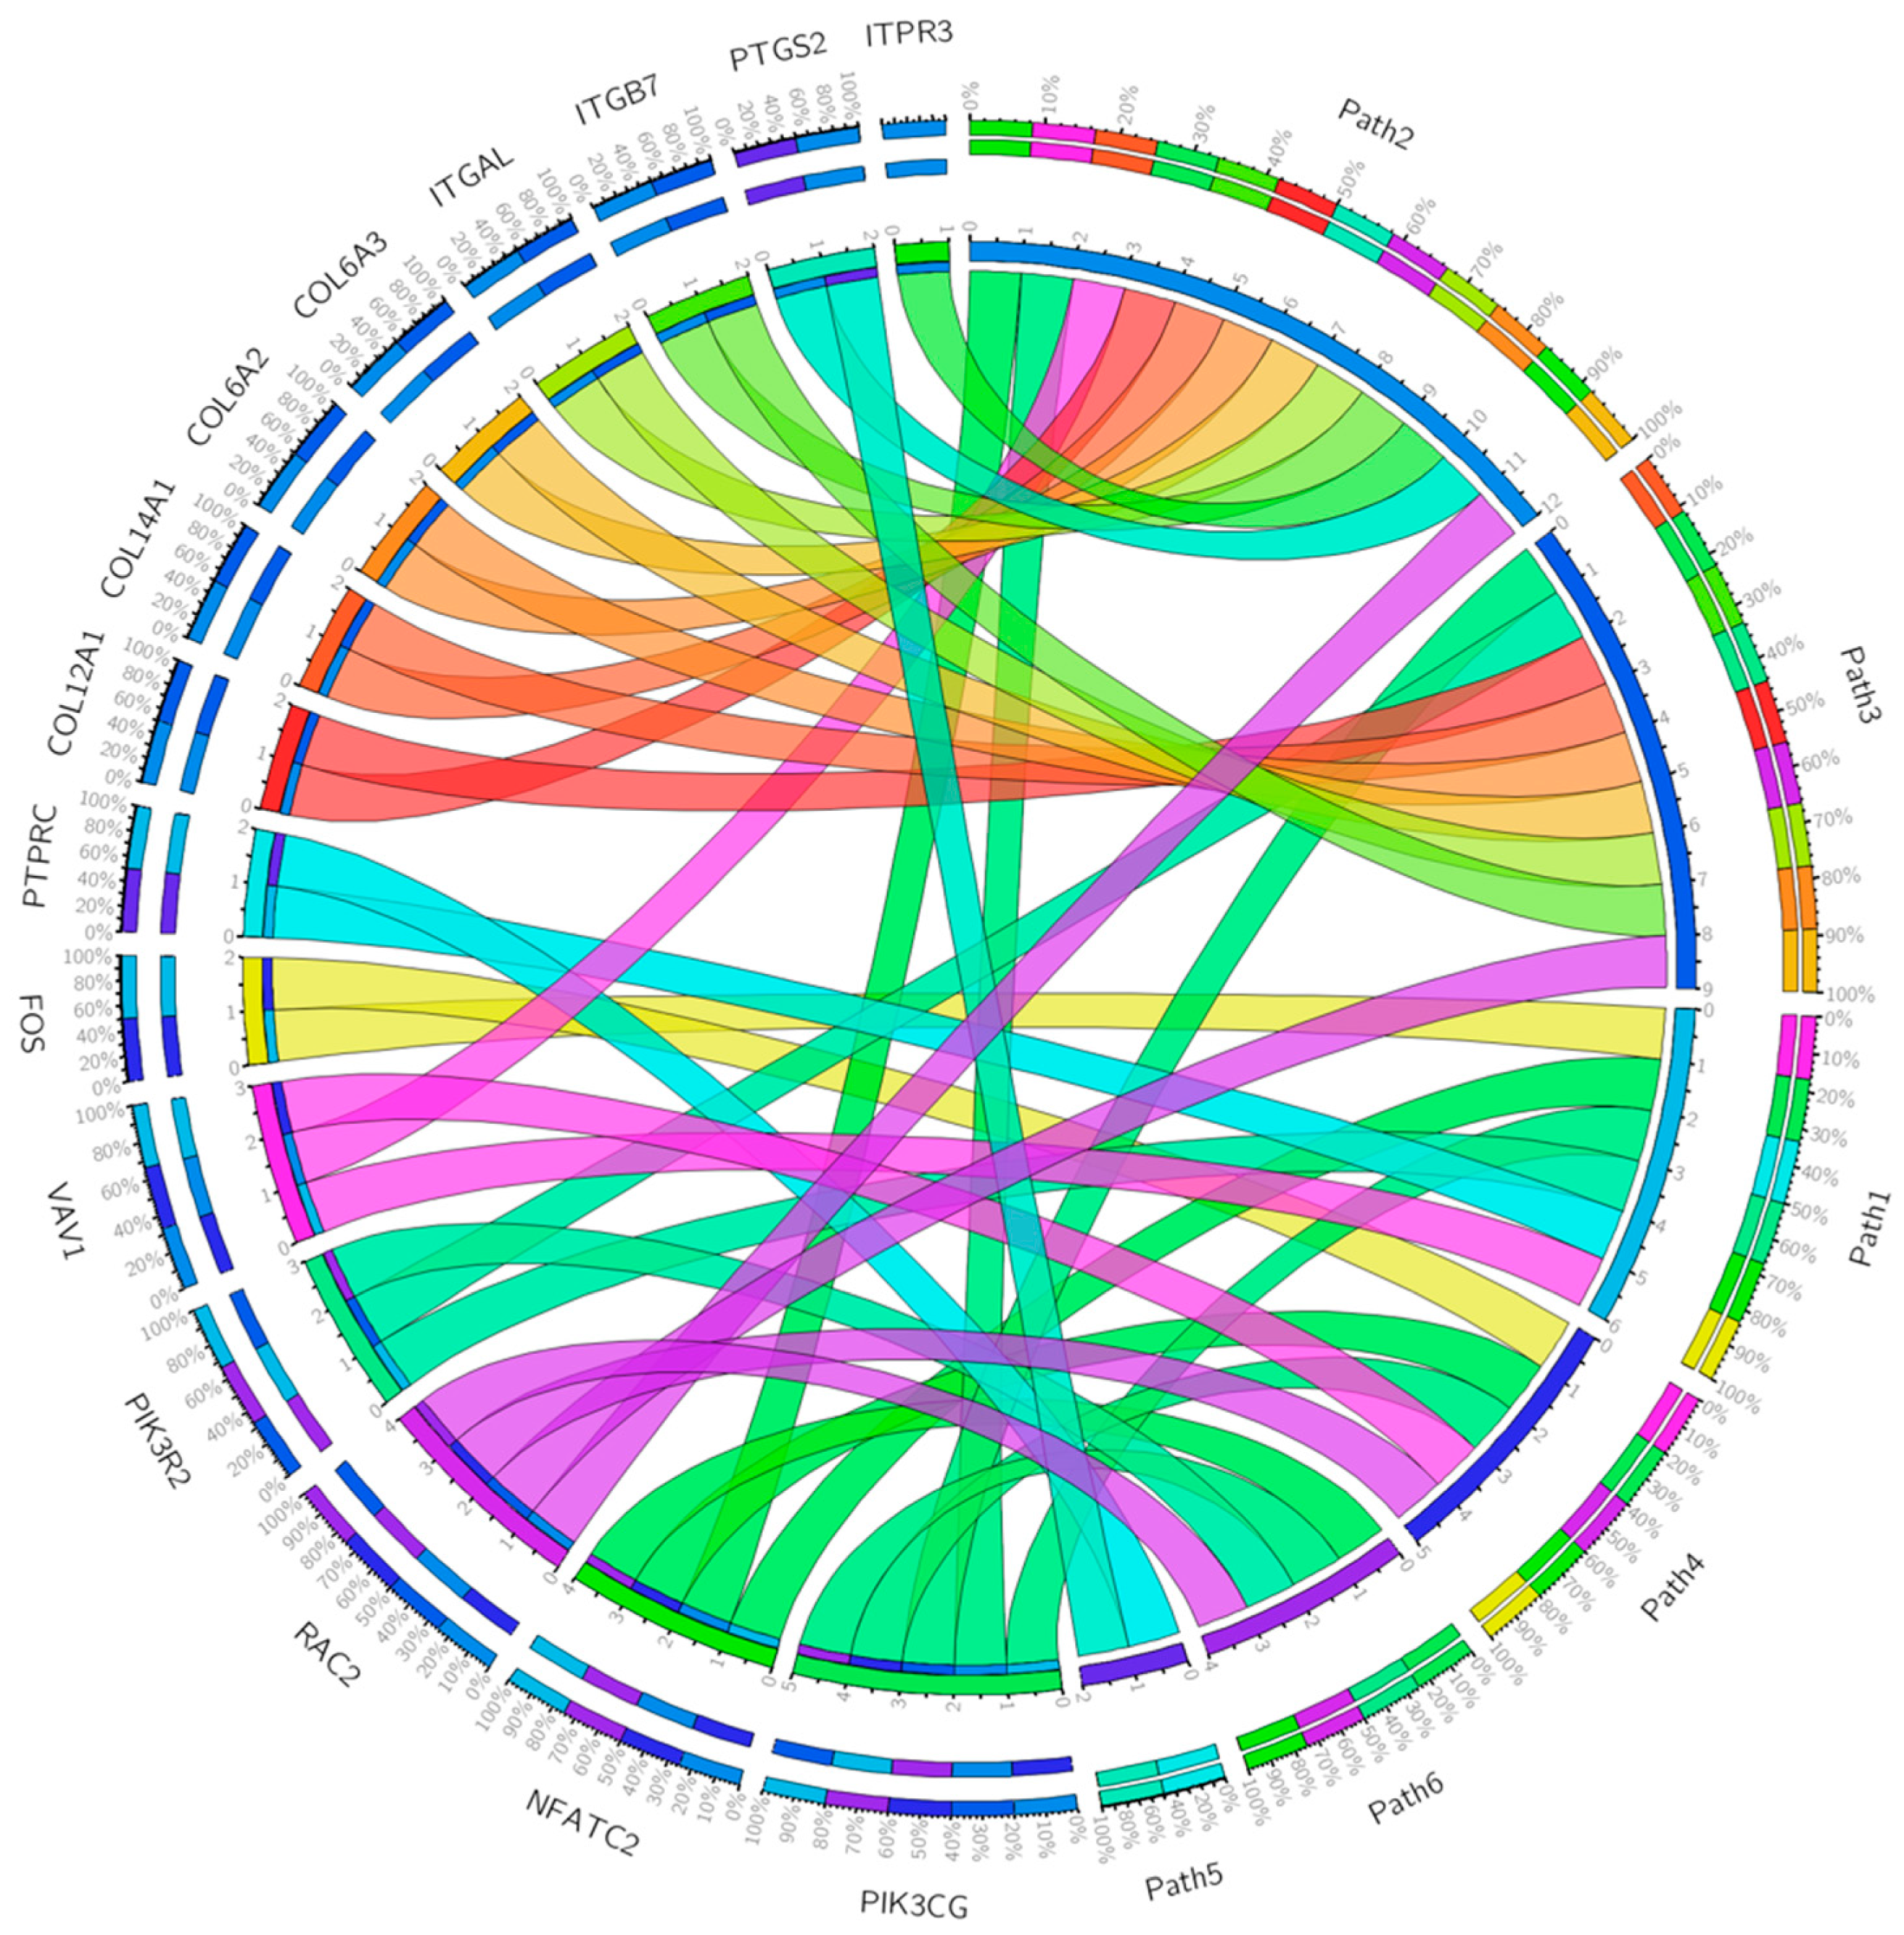
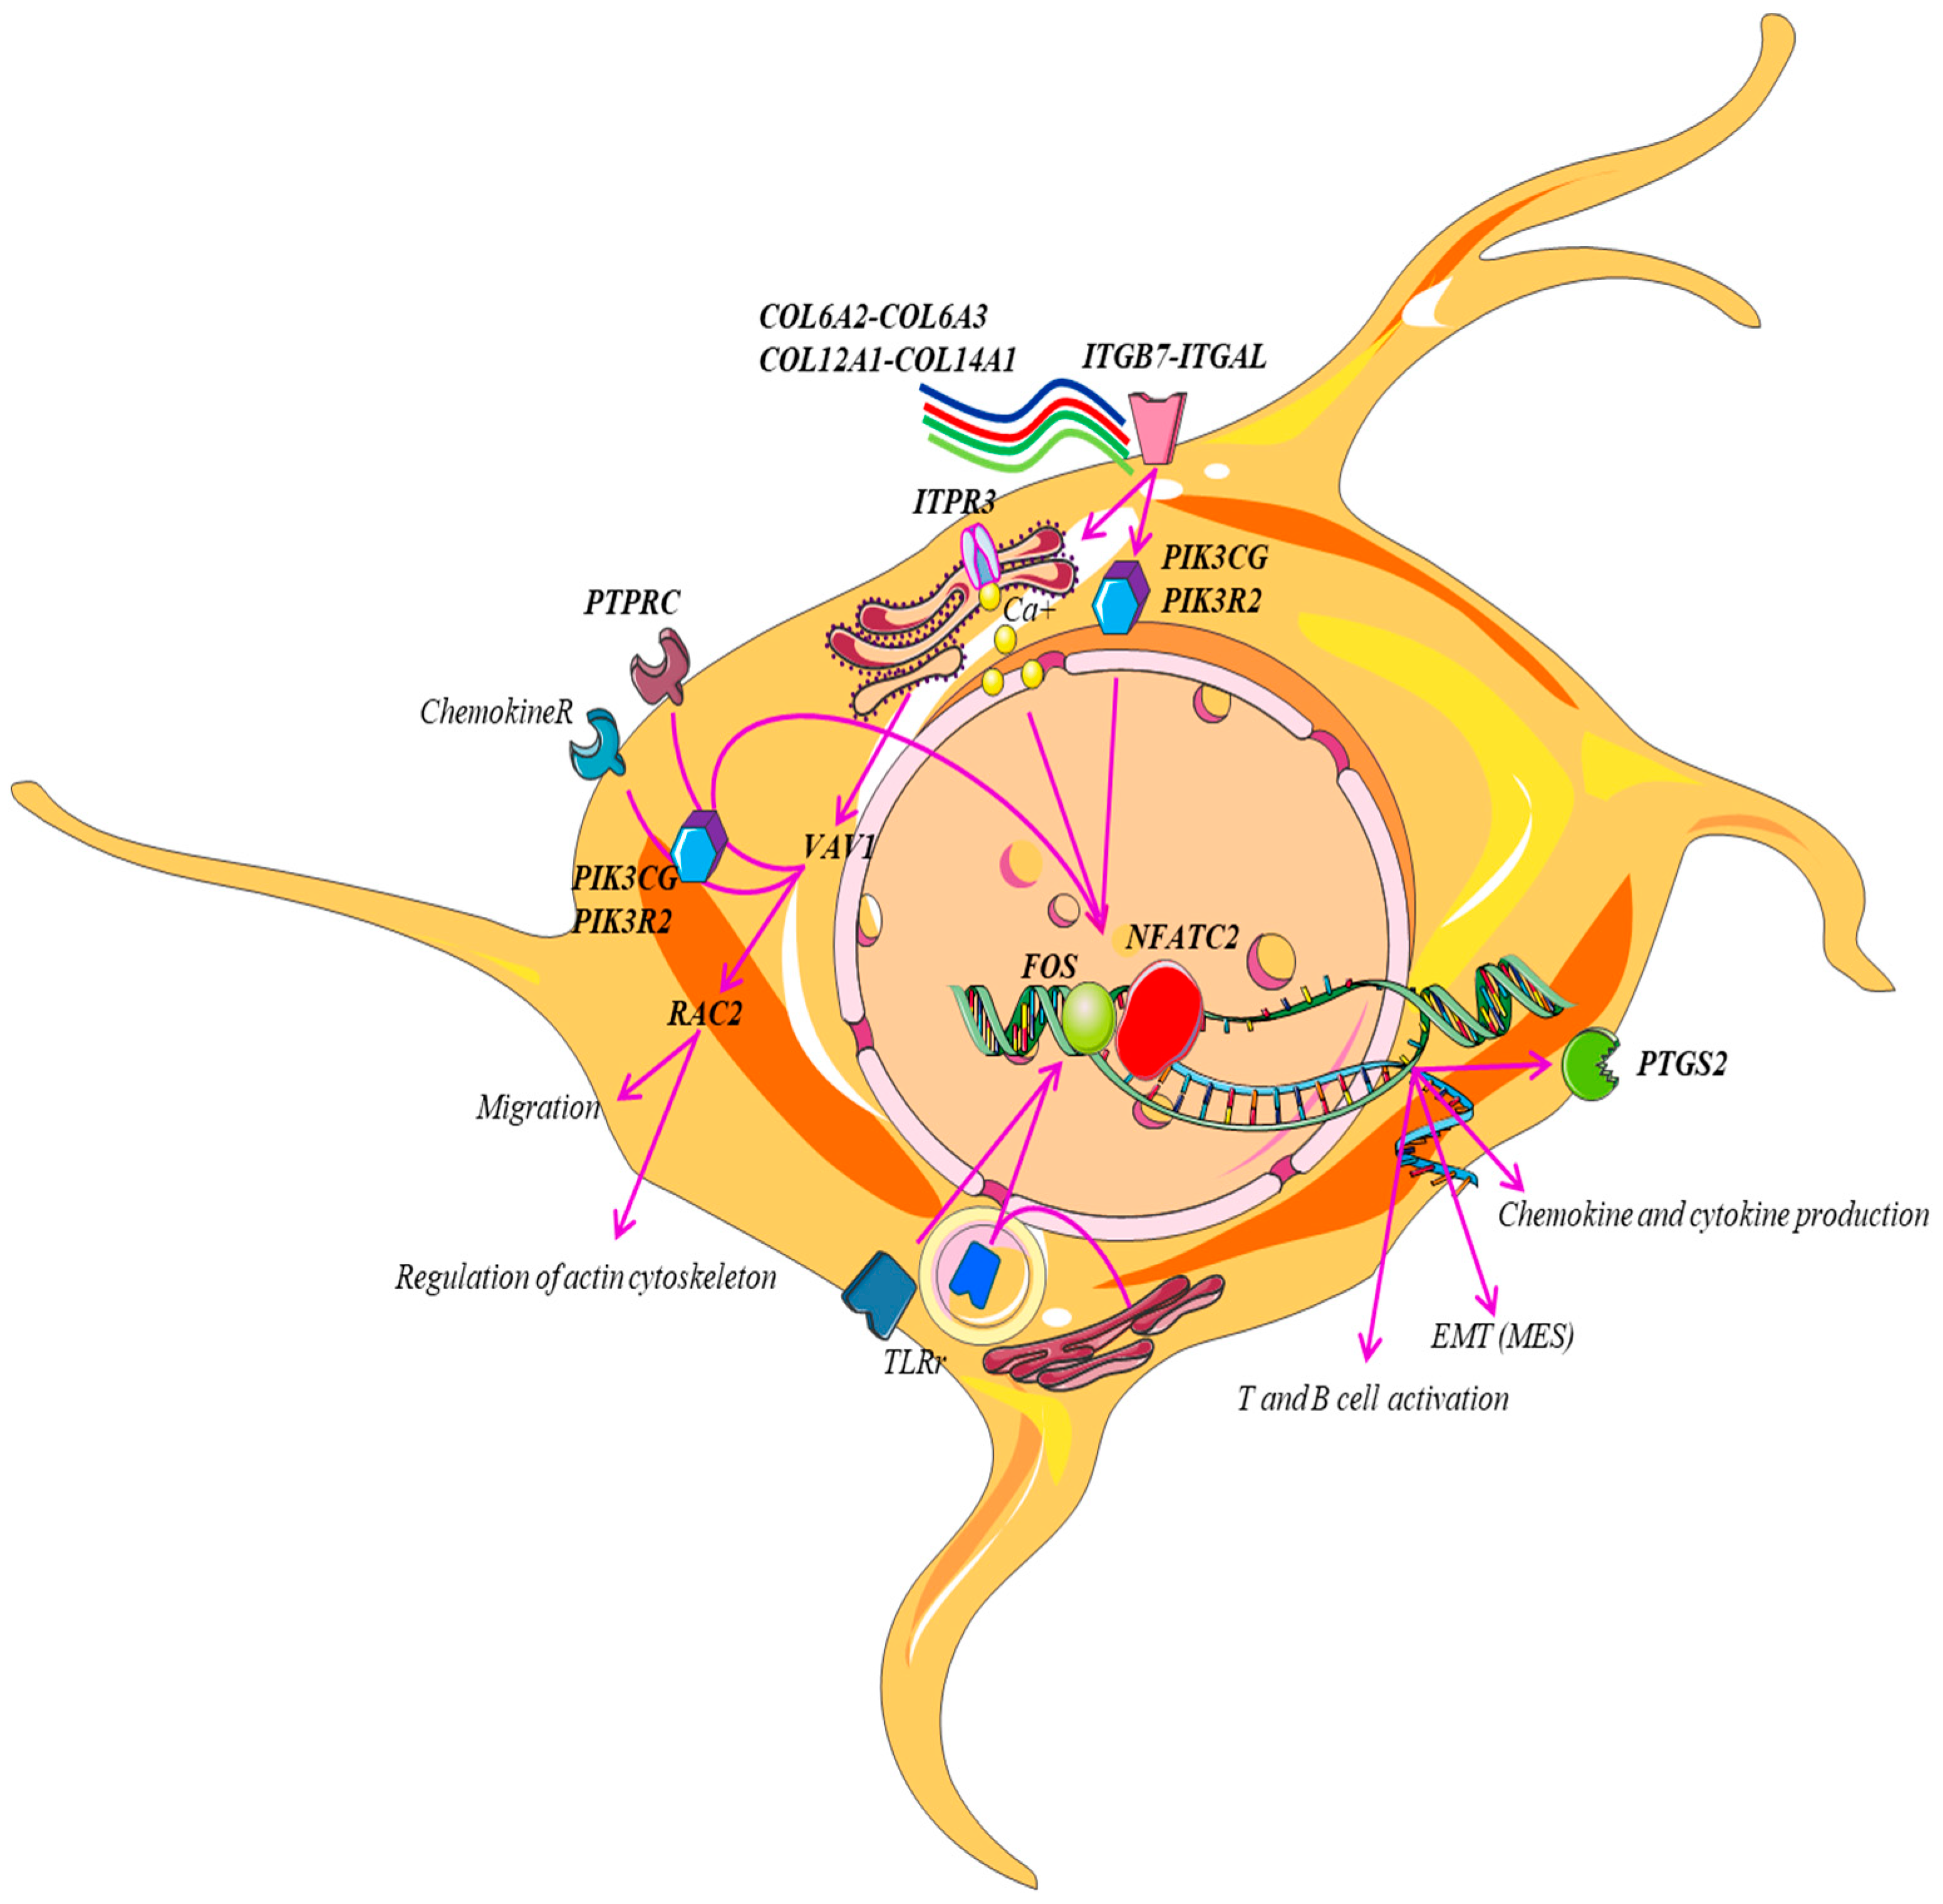
| Inflammation mediated by chemokine and cytokine signaling pathway | ACTA2, ACTG2, ALOX5AP, C5AR1, CCL11, CCL13, CCL18, CCL2, CCL21, CCL4, CCL5, CCL8, CCR1, CCR2, CCR5, CCR7, COL12A1, COL14A1 COL6A2, COL6A2, COL6A3, CX3CR1, CXCL10, FPR1, FPR3, ITGAL, ITGB7, ITPR3, JUNB, MYH11, MYH9, NFATC2, PIK3CG, PTGS2, RAC2, VAV1, VWF |
| Integrin signaling pathway | COL10A1, COL11A1 COL12A1, COL14A1, COL15A1, COL1A2, COL4A5, COL5A1, COL5A2, COL5A2, COL6A2, COL6A3, COL8A1, COL8A1, FLNA, ITGAL, ITGAX, ITGAX, ITGB7, ITGBL1, PIK3CG, PIK3R2, PTGS2, RAC2 |
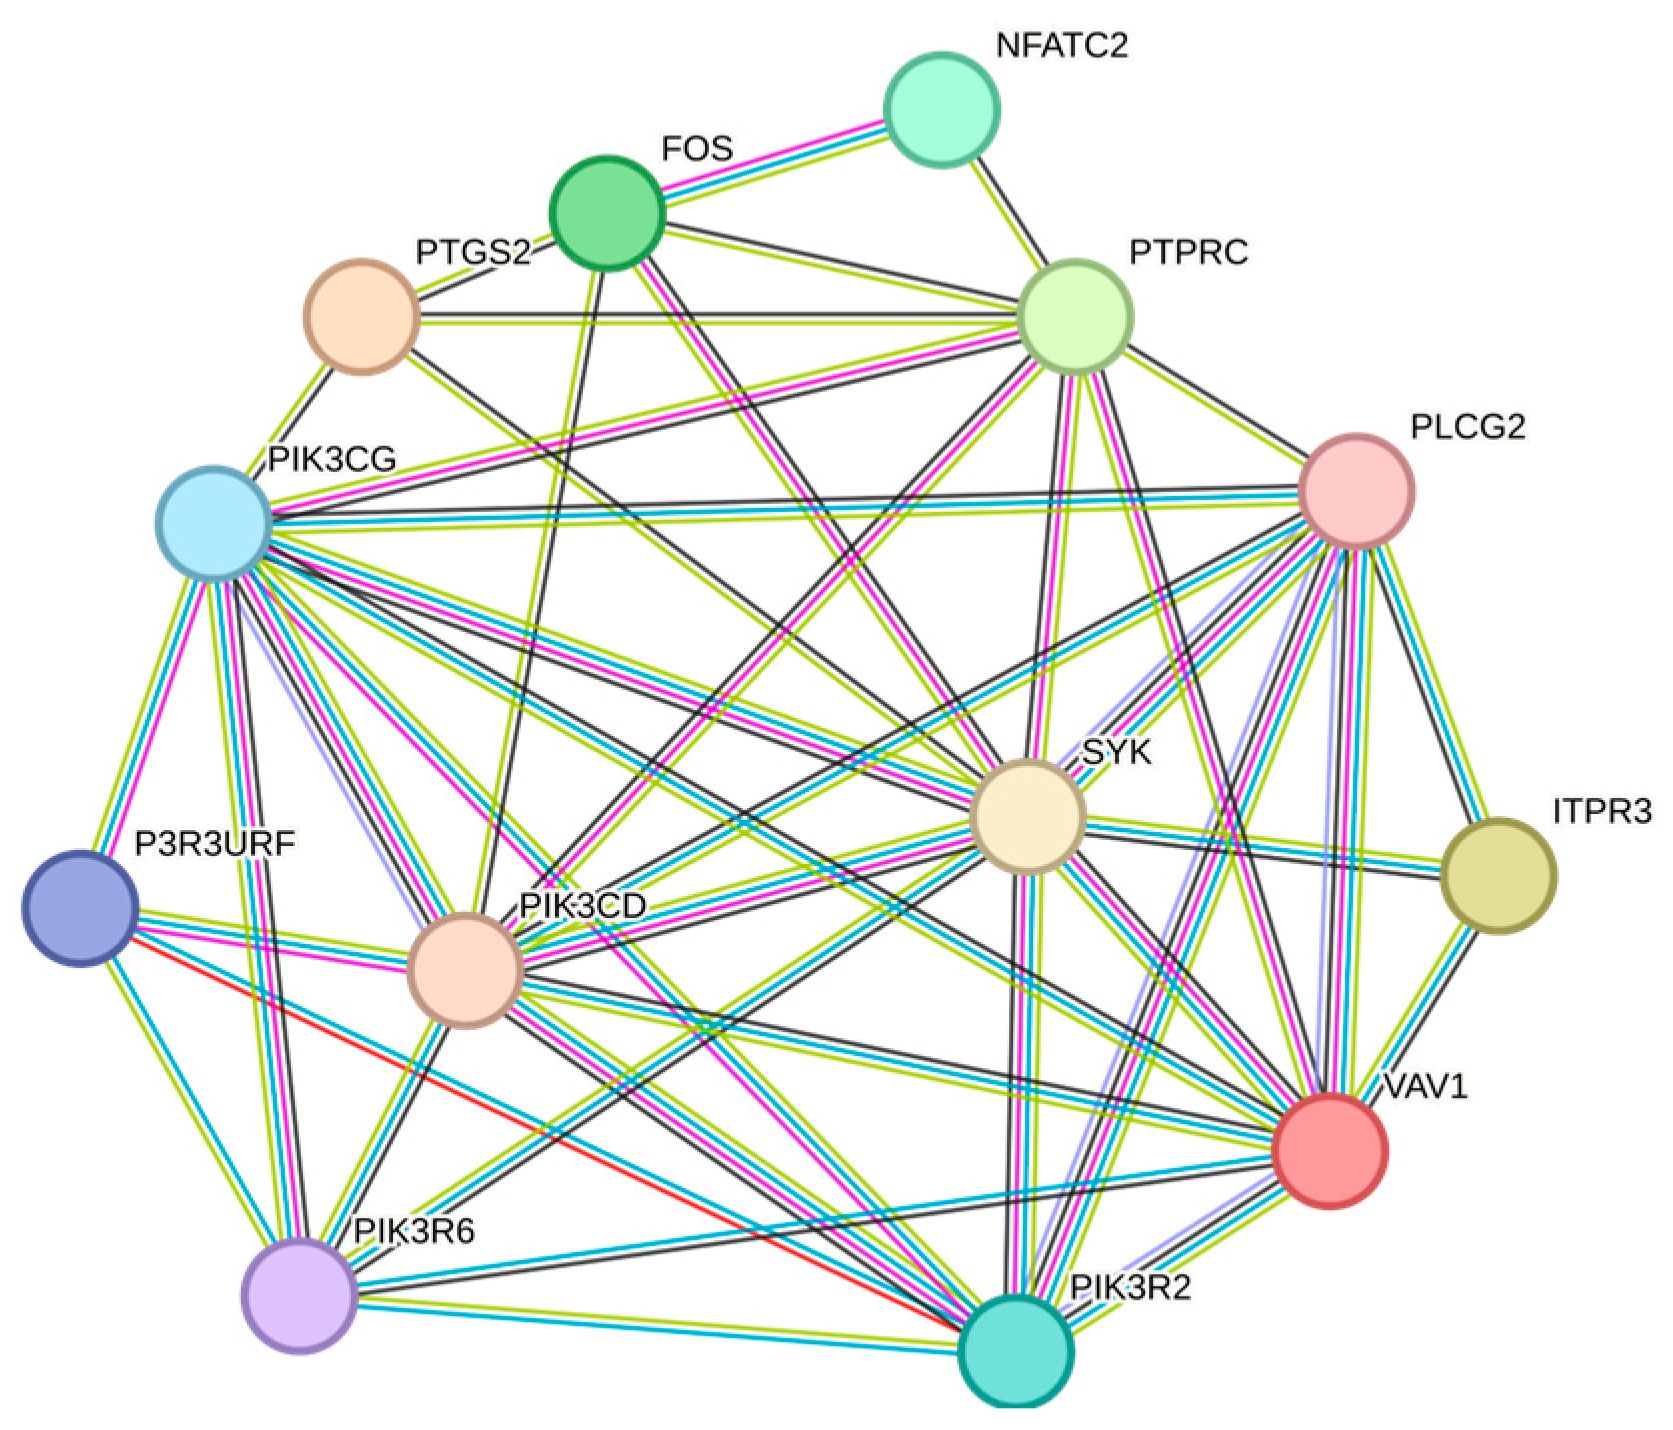
| B-cell activation | BLNK, BTK, CD19, FOS, ITPR3, NFATC2, PIK3CG, PTPRC, RAC2, SYK, VAV1 |
| Toll receptor signaling pathway | CD14, LY96, MAP3K8, PTGS2, TLR2, TLR3, TLR7 |
| Axon guidance mediated by netrin | NFATC2, PIK3CG, PIK3R2, PIK3R5, RAC2 |
Disclaimer/Publisher’s Note: The statements, opinions and data contained in all publications are solely those of the individual author(s) and contributor(s) and not of MDPI and/or the editor(s). MDPI and/or the editor(s) disclaim responsibility for any injury to people or property resulting from any ideas, methods, instructions or products referred to in the content. |
© 2024 by the authors. Licensee MDPI, Basel, Switzerland. This article is an open access article distributed under the terms and conditions of the Creative Commons Attribution (CC BY) license (https://creativecommons.org/licenses/by/4.0/).
Share and Cite
Boccarelli, A.; Del Buono, N.; Esposito, F. Review of Patient Gene Profiles Obtained through a Non-Negative Matrix Factorization-Based Framework to Determine the Role Inflammation Plays in Neuroblastoma Pathogenesis. Int. J. Mol. Sci. 2024, 25, 4406. https://doi.org/10.3390/ijms25084406
Boccarelli A, Del Buono N, Esposito F. Review of Patient Gene Profiles Obtained through a Non-Negative Matrix Factorization-Based Framework to Determine the Role Inflammation Plays in Neuroblastoma Pathogenesis. International Journal of Molecular Sciences. 2024; 25(8):4406. https://doi.org/10.3390/ijms25084406
Chicago/Turabian StyleBoccarelli, Angelina, Nicoletta Del Buono, and Flavia Esposito. 2024. "Review of Patient Gene Profiles Obtained through a Non-Negative Matrix Factorization-Based Framework to Determine the Role Inflammation Plays in Neuroblastoma Pathogenesis" International Journal of Molecular Sciences 25, no. 8: 4406. https://doi.org/10.3390/ijms25084406
APA StyleBoccarelli, A., Del Buono, N., & Esposito, F. (2024). Review of Patient Gene Profiles Obtained through a Non-Negative Matrix Factorization-Based Framework to Determine the Role Inflammation Plays in Neuroblastoma Pathogenesis. International Journal of Molecular Sciences, 25(8), 4406. https://doi.org/10.3390/ijms25084406