Article

Effects of the Interactions Between Food Additive Titanium Dioxide and Matrices on Genotoxicity

Department of Food Science & Technology, Seoul Women’s University, Seoul 01797, Republic of Korea
*
Author to whom correspondence should be addressed.
Int. J. Mol. Sci. 2025, 26(2), 617; https://doi.org/10.3390/ijms26020617
Submission received: 4 December 2024 / Revised: 8 January 2025 / Accepted: 9 January 2025 / Published: 13 January 2025
(This article belongs to the Collection New Advances in Molecular Toxicology)

Abstract

:
Titanium dioxide (TiO2), a white color food additive, is widely used in bakery products, candies, chewing gums, soups, and creamers. Concerns about its potential genotoxicity have recently emerged, particularly following the European Union’s ban on its usage as a food additive due to its genotoxicity potential. Conflicting in vitro and in vivo results regarding its genotoxicity highlight the need for further in-depth investigation. Moreover, food additives can interact with food components or biological matrices, potentially altering their biological responses and genotoxicity. In this study, we evaluated the interactions between two different sizes of additive TiO2 particles and food or biological matrices, including albumin, fetal bovine serum (FBS), and glucose. The results showed that the hydrodynamic diameters of TiO2 increased upon interaction with albumin or FBS, but not with glucose. The presence of albumin or FBS reduced TiO2-induced cytotoxicity, oxidative stress, in vitro intestinal transport, and ex vivo intestinal absorption to untreated control levels, regardless of particle size. While TiO2 caused DNA damage in intestinal Caco-2 cells, the interactions with albumin or FBS significantly reduced the DNA damage to levels comparable to untreated controls. The DNA damage was closely related to oxidative stress caused by TiO2. These findings suggest that the interaction of TiO2 with albumin or FBS, resulting in increased hydrodynamic diameters, mitigates its cytotoxicity, oxidative stress, intestinal transport, and genotoxicity. Further investigation is required to fully understand the potential genotoxicity of TiO2 in food contexts.

1. Introduction

Titanium dioxide (TiO2), also known as titania, is an inorganic compound formed naturally through the interaction of titanium with oxygen. It is widely used as a white pigment in various products, including foods, paints, coatings, pharmaceutics, medicines, cosmetics, and toothpaste. In the food industry, TiO2 serves as a white color additive in items, such as bakery products, candies, chocolates, chewing gums, soups, and creamers. It is authorized as the food additive E171 in the European Union (EU) under Annex II of Regulation (EC) No. 1333/2008. However, the European Food Safety Authority (EFSA) reassessed the safety of TiO2 in 2021 and determined that its potential genotoxicity could not be ruled out based on new data, although the evidence for genotoxic effect was not conclusive. Consequently, TiO2 was considered no longer safe as a food additive [1]. Following EFSA’s reassessment, the European Commission banned the use of TiO2 as a food additive in 2022 [2]. On the other hand, the United States Food and Drug Administration (FDA) approved the use of TiO2 in food in 1966, under the specifications and conditions outlined in (21 CRF 73.575), including a restriction that its concentration must not exceed 1% by weight of the food [3]. In 2023, the FDA identified no concerns regarding potential genotoxicity of TiO2 based on available data and stated that studies by National Toxicology Program did not indicate cancer risk of TiO2 [4]. The Joint Food and Agriculture Organization of the United Nations (FAO)/World Health Organization (WHO) Expert Committee on Food Additives (JECFA) did not establish a limit on its intake, citing its insolubility, inertness, and low oral absorption as evidence of its safety [5]. The FAO/WHO JECFA reaffirmed a “not specified” acceptable daily intake (ADI) for TiO2 in November 2023 [6]. Other regulatory authorities, including the United Kingdom’s Food Standards Authority, Health Canada, and Food Standards Australia New Zealand have not aligned with EFSA’s assessment and continue to permit the use of TiO2 in food products due to insufficient in vivo and human data on its genotoxicity [7,8,9].
As mentioned above, there are conflicting opinions regarding the genotoxicity of the food additive TiO2. Concerns have been raised about the potential toxicity of food-grade TiO2, particularly its effect on intestinal inflammation or function, intestinal diseases or cancer, and embryonic development in mice [10,11,12,13]. A meta-analysis of in vivo and in vitro studies concluded that TiO2 nanoparticles (NPs) induced genotoxic effects, including DNA damage, chromosomal aberrations, and gene mutations [14]. On the other hand, developmental oral toxicity studies involving six forms of TiO2 determined a no observed adverse effect level (NOAEL) of 1000 mg/kg [15]. A 90 d repeated oral toxicity study of E171 TiO2 also reported a NOAEL ranging from 100 to 1000 mg/kg, based on gene profile analyses [16]. Furthermore, recent standardized in vivo tests demonstrated that food additive TiO2 shows no genotoxic potential at doses up to 1000 mg/kg [17]. The oral absorption and bioavailability of food-grade TiO2 were found to be less than 0.1%, although oral absorption increased to 0.8% when interacting with food matrices [18]. These conflicting findings seem to be influenced by variations in test materials (food- or general grade, particle size, and surface characteristics), biological systems used (in vitro, in vivo, and matrices), and doses (concentrations).
TiO2 is well known for its photocatalytic activity, producing electrons that react with environmental molecules to generate free radicals, including reactive oxygen species (ROS) [19,20,21]. ROS, being highly reactive, can interact with cellular components, causing damage to DNA, RNA, proteins, and membranes, which may ultimately lead to cell death. Several studies have demonstrated that TiO2 exposure induces oxidative stress in cultured cells [22,23,24]. Concerns about the potential genotoxicity of TiO2 are strongly linked to its role in generating ROS and causing oxidative stress. Indeed, oral intake of TiO2 NPs was reported to increase ROS levels in the colon, triggering oxidative stress in mice [25]. Additionally, food-grade TiO2 may interact with other molecules in foods and biological fluids, forming a particle-molecule corona that alters its physicochemical property, biological responses, and toxicity [18,26,27]. The matrix covers the surface of the particles, leading to changes in particle size or modifications in surface charges. Such interactions between particles and food components or biological matrices can significantly influence its biological effects. For instance, oral absorption of food additive TiO2 has been shown to increase in the presence of albumin or glucose associated with reduced hydrodynamic diameters of TiO2 [18].
We hypothesized that the potential genotoxicity of TiO2, associated with its ROS-generation properties, could be mitigated through interactions with food or biological matrices. This study aimed to investigate the genotoxic potential of food additive TiO2 in various in vitro biological systems, including cultured cell lines and 2D/3D intestinal barrier models. Furthermore, we evaluated the impact of TiO2-matrix interactions on its genotoxicity.

2. Results and Discussion

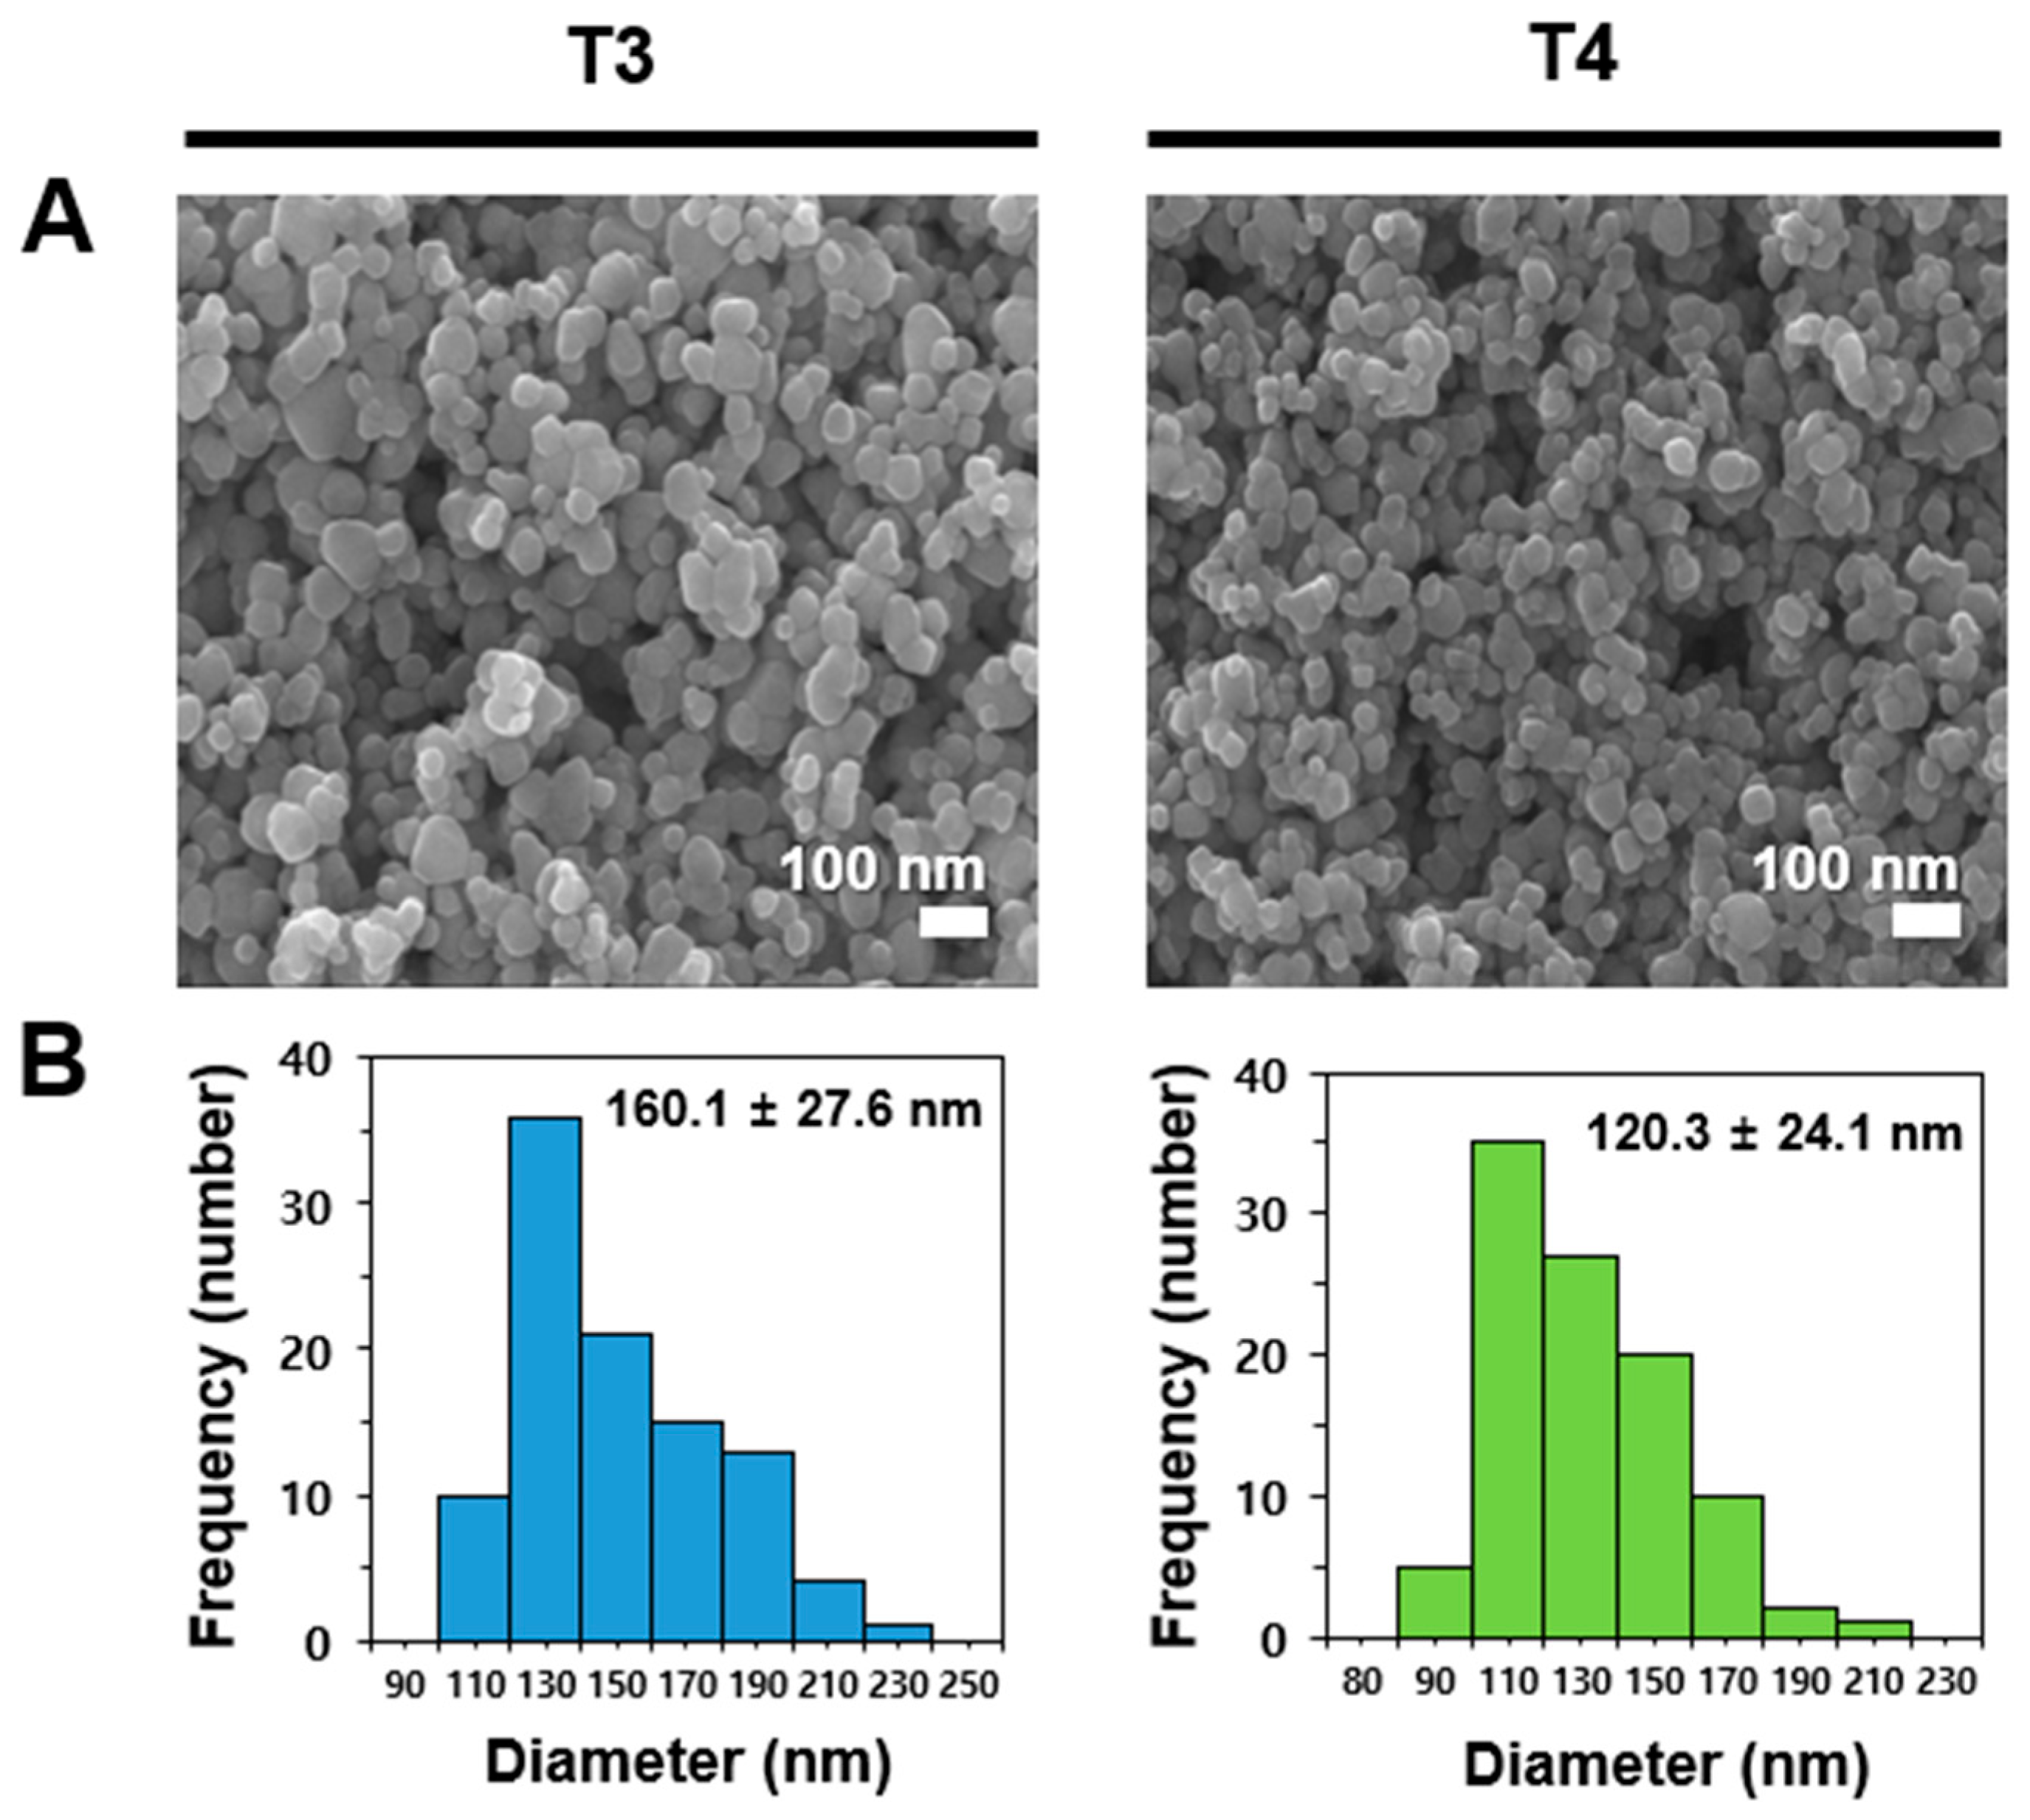
2.1. Characterization of Food Additive TiO2 Interacted with Matices

For this study, we selected two differently sized food additive TiO2 particles, representing the largest (T3) and smallest (T4) particles among the five most widely commercially available types identified in our previous report [24]. The shape and constituent particle size of TiO2 particles were determined by scanning electron microscopy (SEM), showing average constituent particle sizes of 160.1 ± 27.6 nm and 120.3 ± 24.1 nm for T3 and T4, respectively, with irregular shape (Figure 1). The crystal structure was determined to be anatase forms for both particles [24].
The hydrodynamic diameters of two particles were measured in distilled and deionized water (DDW) and minimum essential medium (MEM) (Table 1), which reflect environments for characterization and cell culture experiments, respectively. The hydrodynamic diameters of T3 and T4 in DDW increased compared to its constituent particle size measured by SEM (Table S1), showing 304.7 ± 0.9 nm and 295.7 ± 2.9 nm for the former and latter, respectively, indicating aggregate formation under aqueous solution. The hydrodynamic radii in MEM were 440.9 ± 4.3 nm and 377.3 ± 2.8 nm for T3 and T4, respectively, and significantly increased compared to those in DDW. This result may be attributed to the interaction between particles and diverse biological matrices present in MEM. Meanwhile, the presence of food or biological matrices affected differently the hydrodynamic diameters of TiO2. Albumin and glucose were selected as food matrices due to their ability to increase oral absorption of TiO2 particles [18], and fetal bovine serum (FBS) was also included as a representative biological matrix. The interaction between TiO2 and FBS or albumin significantly increased the hydrodynamic diameters compared to those in DDW or MEM, whereas the hydrodynamic radii of TiO2 interacted with glucose was statistically same to those in DDW or MEM. It is likely that large molecules, such as FBS and albumin, increase the hydrodynamic diameters of TiO2 by forming large FBS– or albumin–particle corona [28,29]. The relatively decreased hydrodynamic diameters observed in the presence of glucose are likely to be related to the dispersant capacity of glucose for particles [30,31]. Various components in MEM, such as vitamins, minerals, amino acids, glucose, and others, can also help reduce particle aggregation to some extent. These results clearly suggest that the TiO2 interactions with food or biological matrices differently influence the hydrodynamic diameters and aggregate formation of TiO2 particles.

2.2. In Vitro Solubility in Digestive Fluids of Food Additive TiO2 Interacted with Matices

The interaction effects of TiO2 particles interacted with matrices on solubility were investigated in simulated digestive systems (saliva + gastric + intestinal fluids). The solubilities of T3 and T4 in distilled water (DW) were 0.15% and 0.18%, respectively, without significant differences (p > 0.05). The solubility levels of TiO2 particles interacted with FBS, albumin, or glucose were not affected, ranging from 0.11% and 0.18% without any statistical differences (p > 0.05). The results suggest that the oral solubility of TiO2 particles was extremely low, regardless of interacting matrix types or particle size. The low and slow dissolution properties of TiO2 particles in diverse biological fluids were demonstrated by several previous reports [18,32,33]. Indeed, TiO2 particles are generally considered to be insoluble and resistant to dissolution [34,35]. Hence, it seems that the solubility is not a crucial factor affecting the toxicity of TiO2 particles; rather, its biopersistence in particle forms may cause long-term health effects.

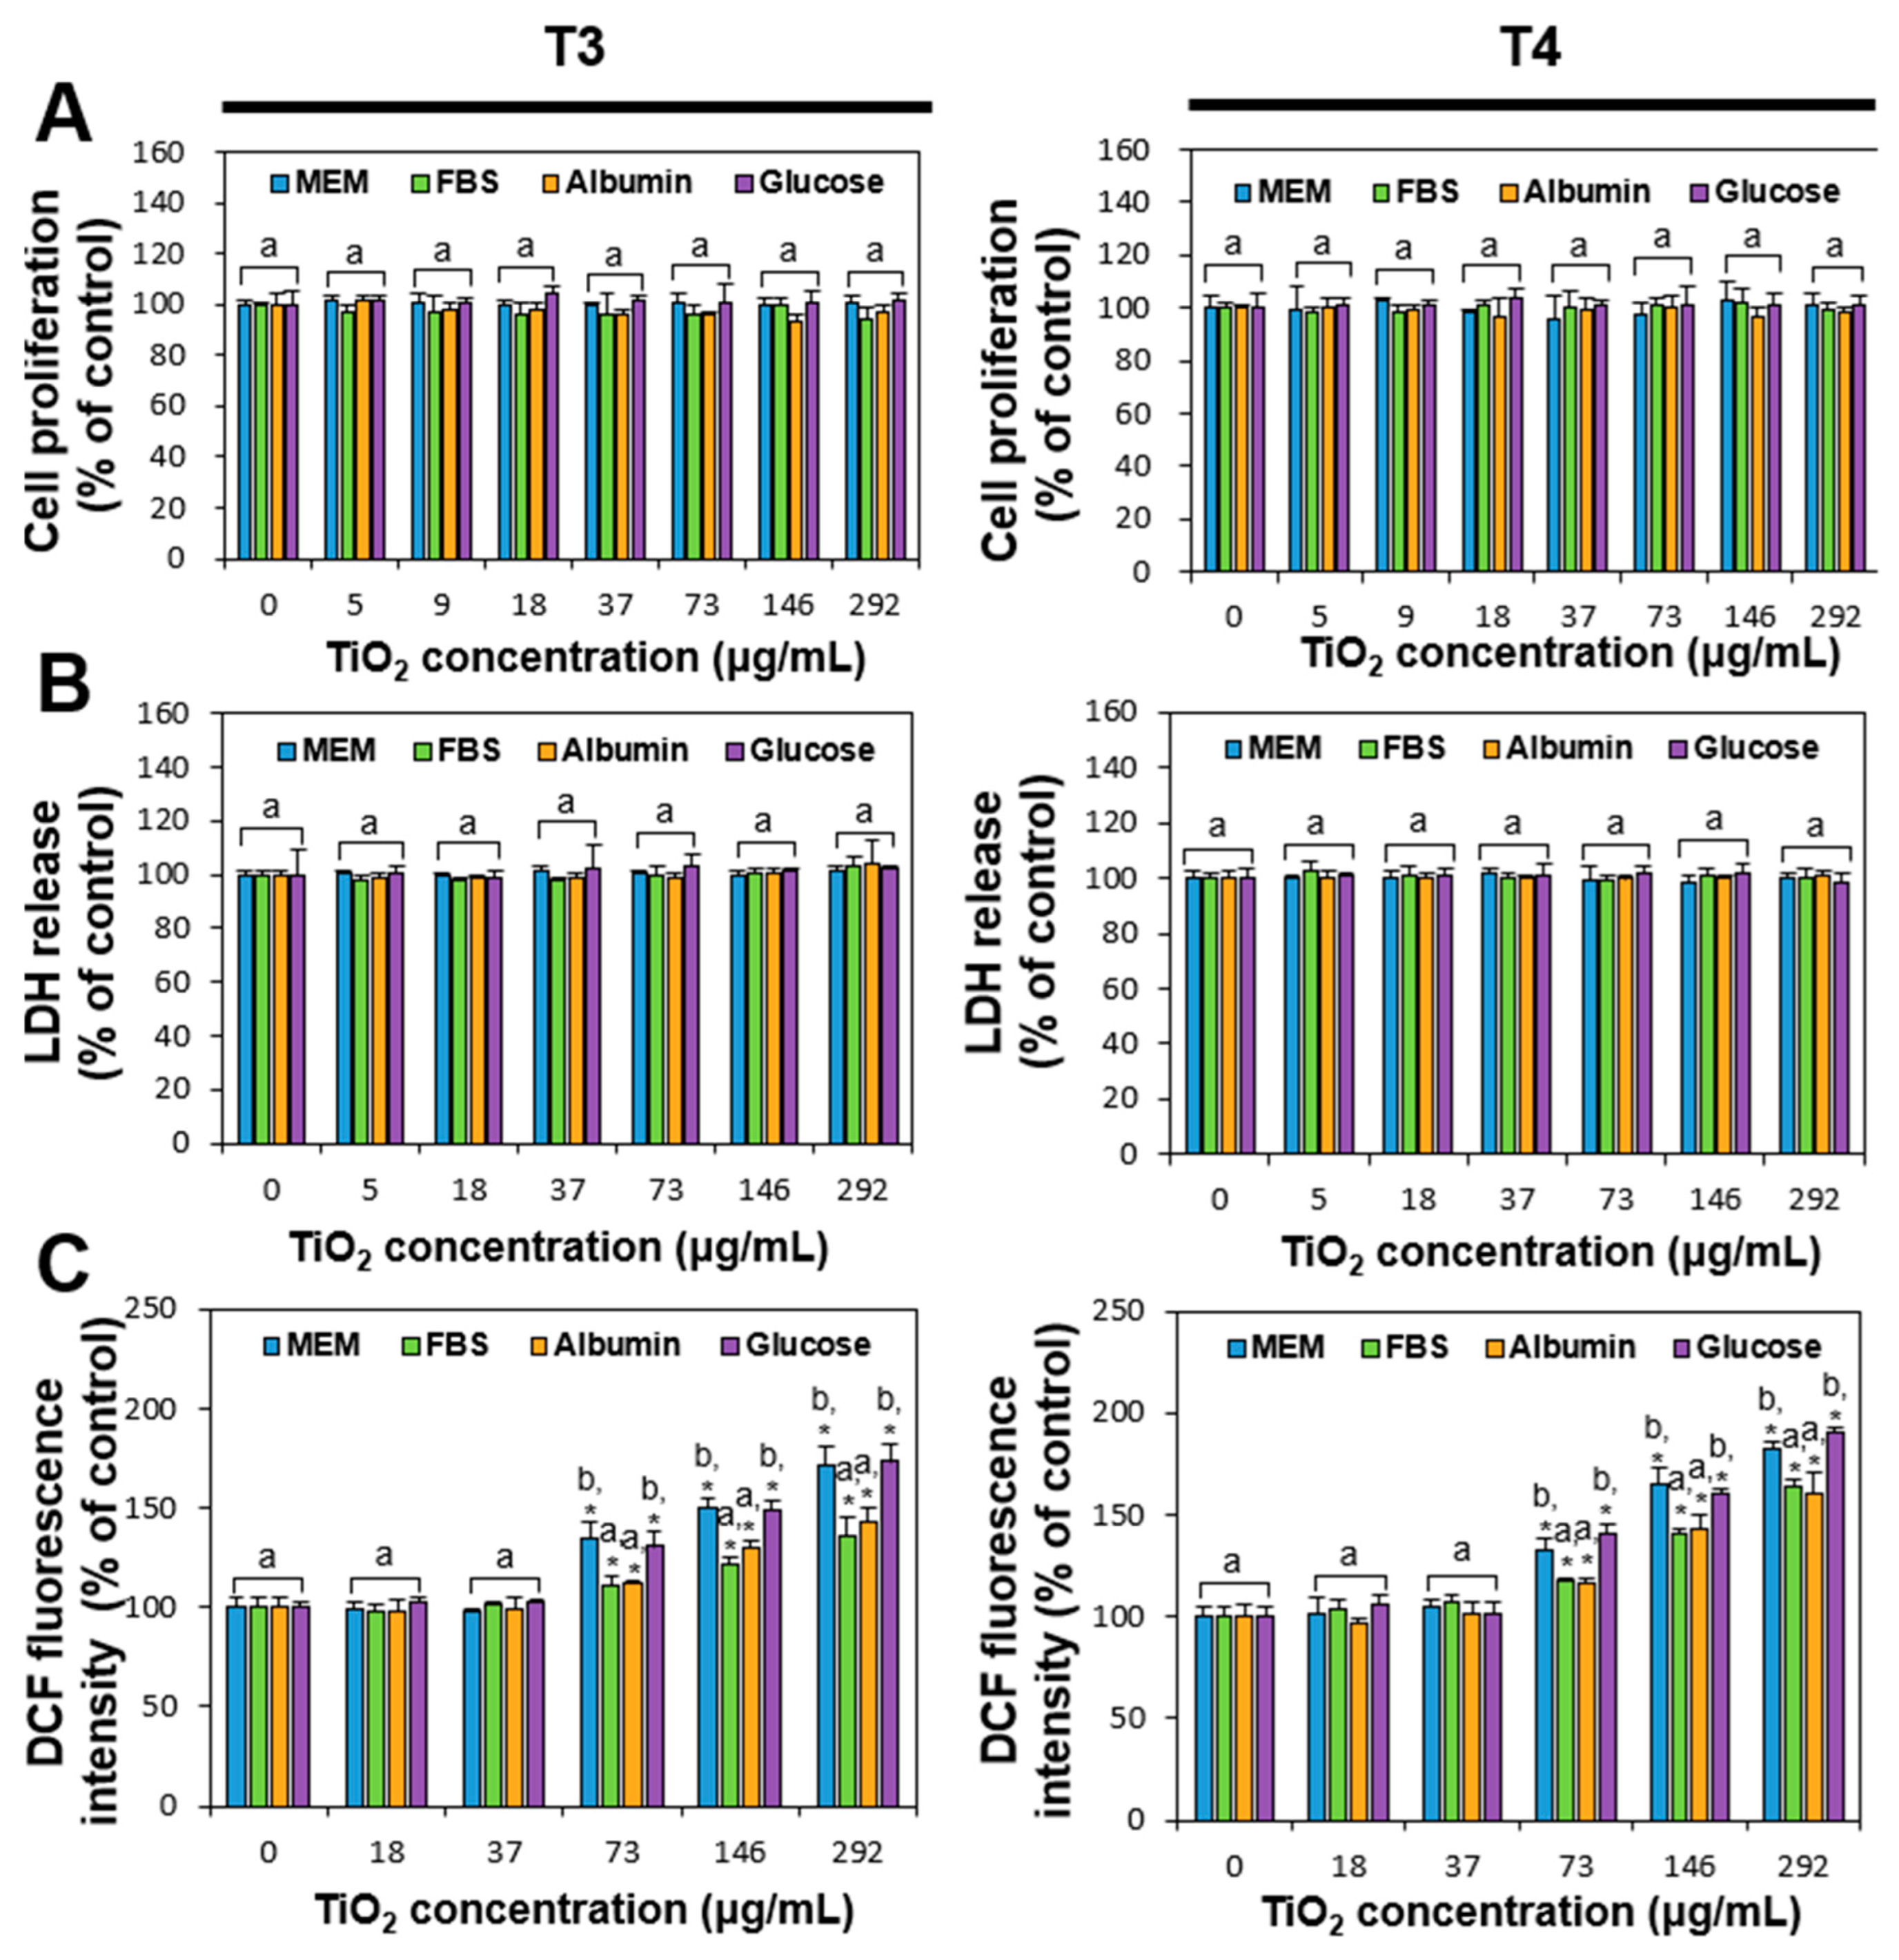
2.3. Cytotoxicity of Food Additive TiO2 Interacted with Matices

The effects of the TiO2 interactions with food or biological matrices on cell proliferation, lactate dehydrogenase (LDH) release, and ROS generation were evaluated in human intestinal Caco-2 cells. The maximum concentration of 292 μg/mL was chosen based on maximum usage from Manufacturing Report (2018–2019) and daily intake levels from Item and National Food and Nutrition Statistics (2017) in the Republic of Korea, and adjusted for cell experiment conditions reflecting volume of human intestinal fluids [36,37]. The results demonstrate that both TiO2 particles with or without food or biological matrices did not affect cell proliferation and LDH release level at the highest concentration tested (Figure 2), which is consistent with our previous report [24]. Meanwhile, TiO2 particles significantly increased ROS generation in a concentration-dependent manner at above 73 μg/mL, regardless of particle size (T3 or T4) (Figure 2C). It is interesting to note that ROS generation significantly increased when TiO2 particles dispersed in MEM or glucose compared to those in FBS or albumin. This result can be explained by the hydrodynamic radii of TiO2 interacted with matrices (Table 1), showing larger hydrodynamic diameters in FBS or albumin than those in MEM or glucose. Hence, TiO2 particles in MEM or glucose had small hydrodynamic diameters, which may lead to high cytotoxicity. It was demonstrated that small-sized particles induced higher cytotoxicity than large particles [38,39,40]. In other words, biological matrices, such as FBS and albumin, can reduce ROS generation by TiO2 particles through interactions that form large matrix–particle aggregates.

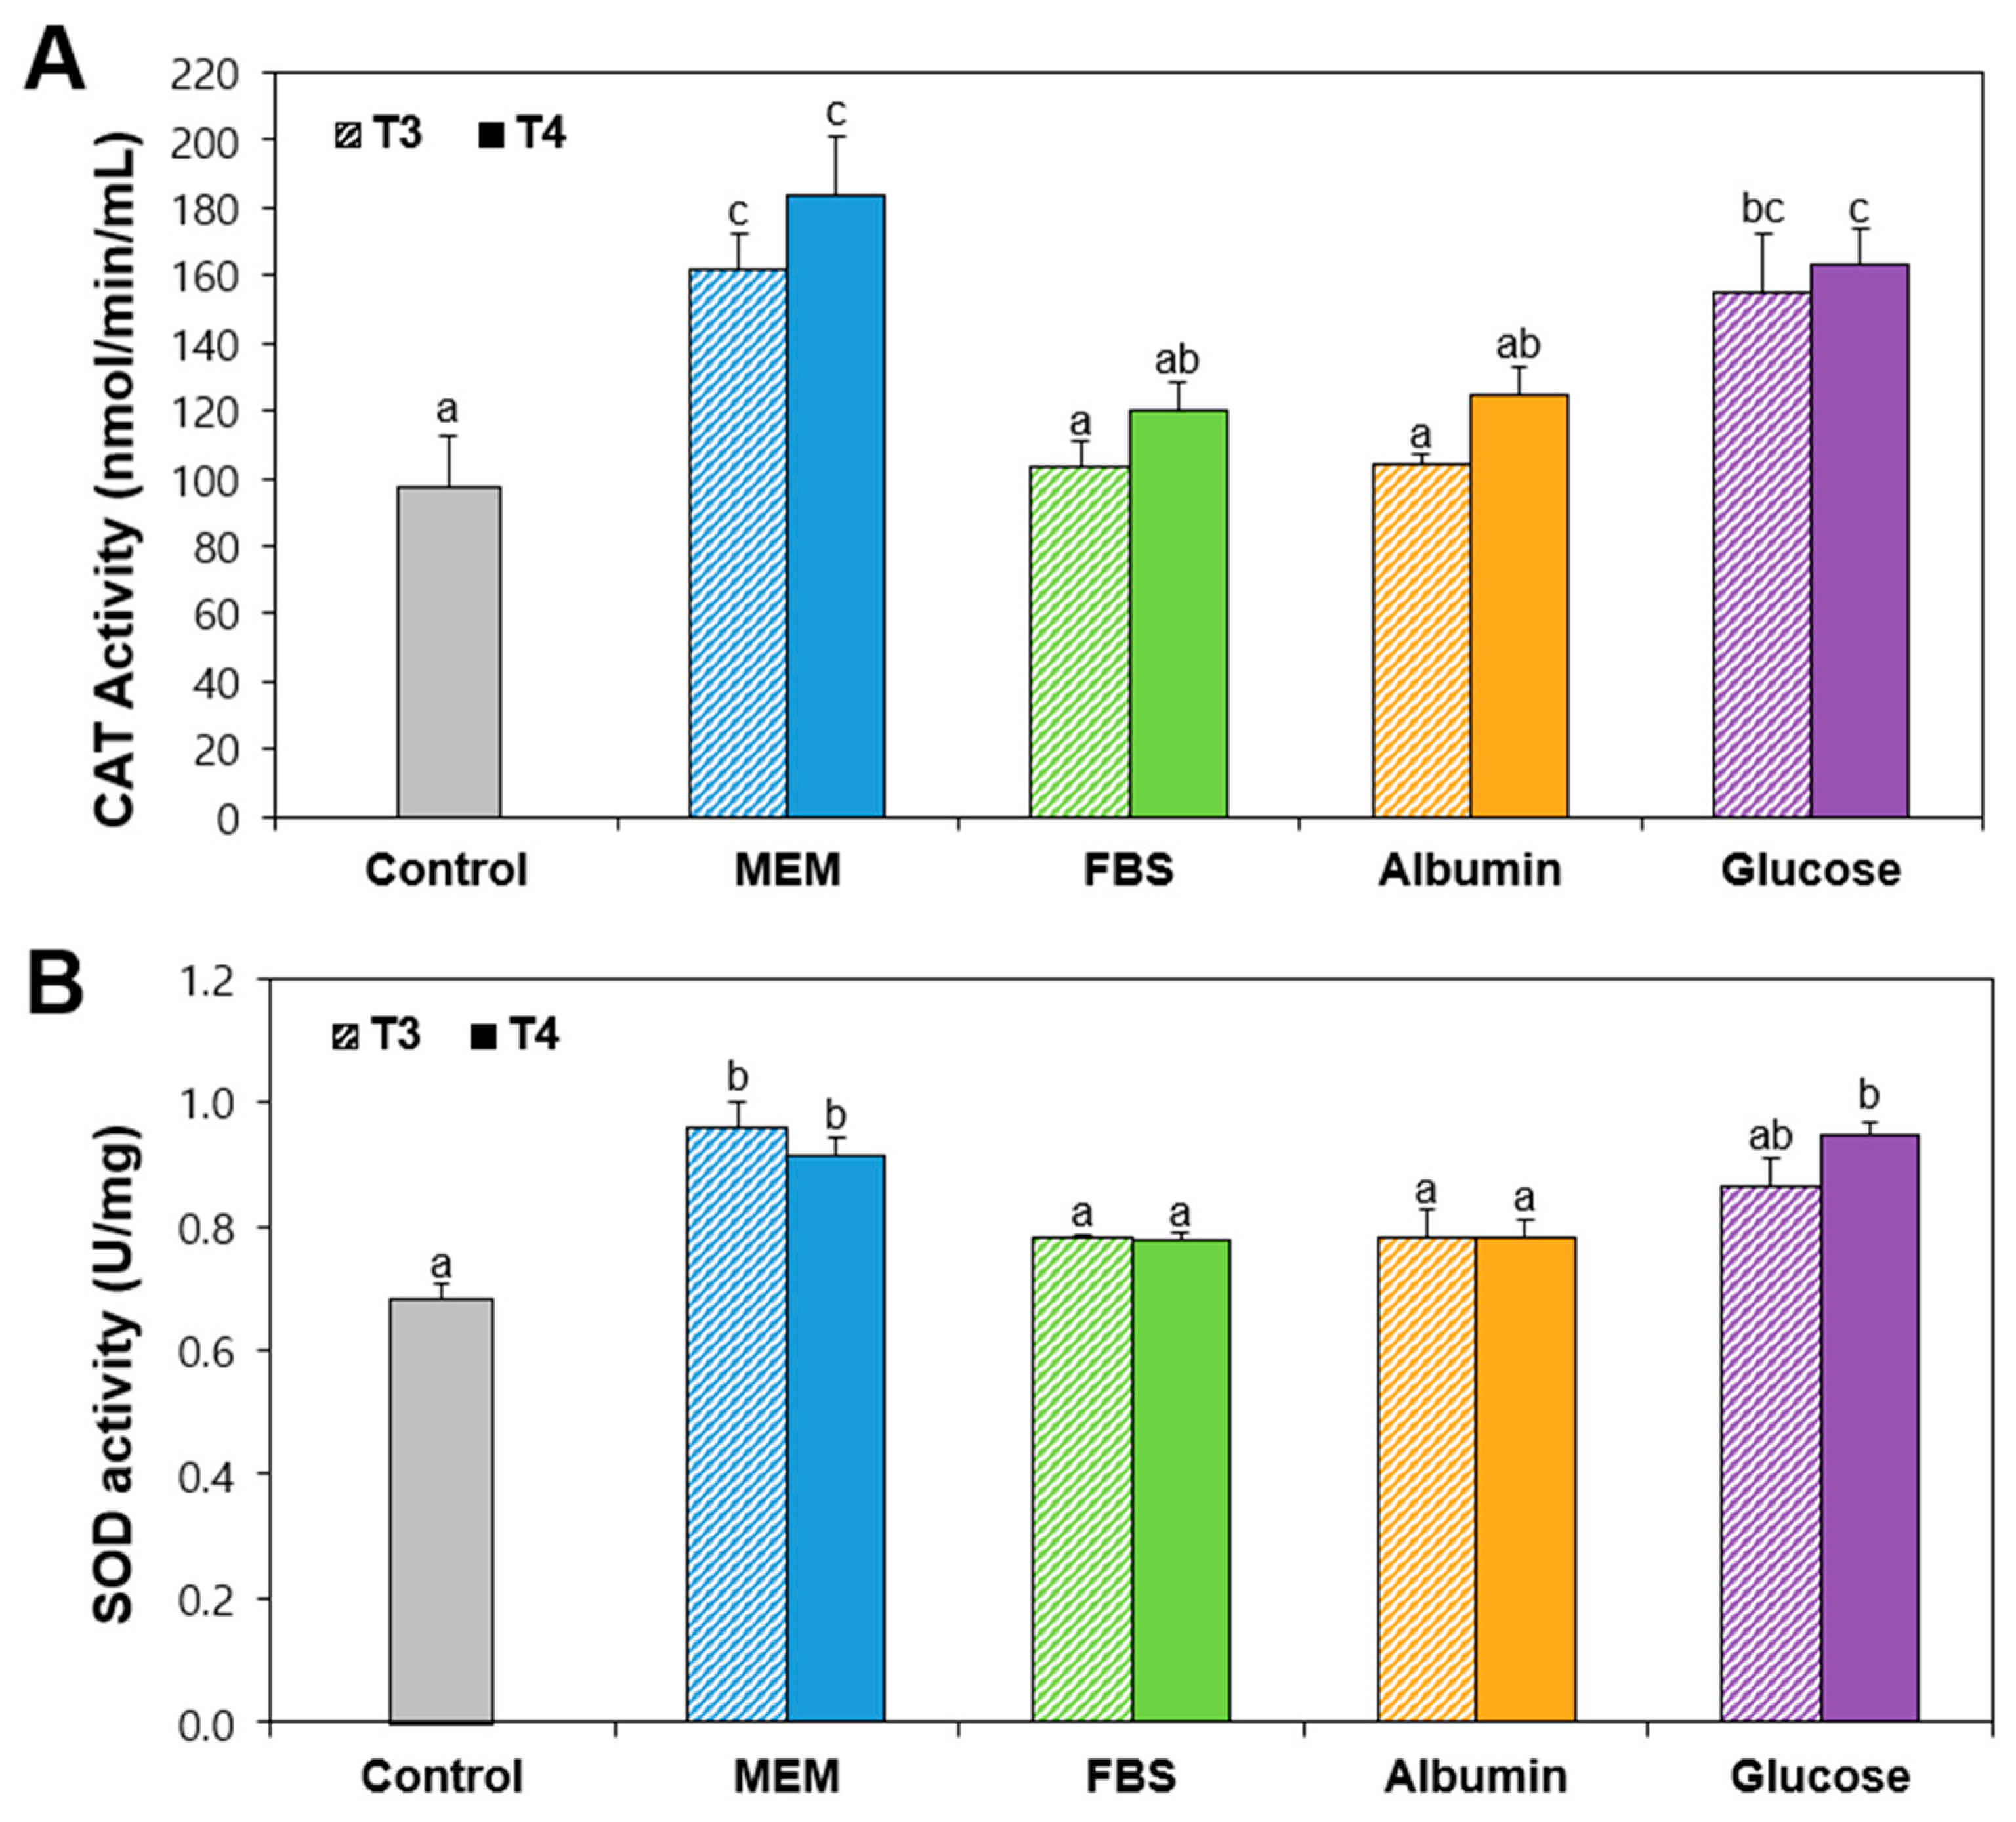
2.4. Antioxidant Enzyme Activity of Food Additive TiO2 Interacted with Matices

The activities of catalase (CAT) and superoxide dismutase (SOD) in Caco-2 cells exposed to TiO2 particles were investigated because both T3 and T4 particles induced ROS in a concentration-dependent manner (Figure 2C). Figure 3 demonstrates that the activities of both CAT and SOD significantly increased by TiO2 particles prepared in MEM or glucose, whereas the enzyme activities by TiO2 interaction with FBS or albumin were statistically same to untreated control cells, regardless of particle size (T3 and T4). This result suggests the induction of oxidative stress by TiO2 particles, especially when interacting with MEM or glucose. In other words, TiO2 in the presence of FBS or albumin can reduce oxidative stress.

2.5. In Vitro Intestinal Transport of Food Additive TiO2 Interacted with Matices

The TiO2 interaction effects on intestinal transport were evaluated using a Caco-2 monolayer model reflecting intestinal tight junction barrier and follicle-associated epithelial (FAE) models, representing microfold (M) cells found in the intestinal epithelium which play a role in immune response. The transport amounts of both T3 and T4 particles dispersed in MEM or glucose were significantly higher than those in FBS or albumin in both Caco-2 monolayers and FAE models without statistical significances between T3 and T4 (Figure 4). It is worth noting that transported levels of TiO2 though Caco-2 monolayers and M cells in the presence of FBS or albumin were extremely low, below 0.13%. These results seem to be strongly related to the hydrodynamic radii of TiO2 particles, showing increased hydrodynamic radii in FBS or albumin, but relatively small diameters in MEM or glucose (Table 1). Indeed, increased transport levels of small particles compared to bulk particles were demonstrated in several studies [41,42,43]. No remarkable differences in transport amounts between T3 and T4 particles were found, which is consistent with our previous research [18]. Meanwhile, total transport levels of TiO2 particles through the two intestinal barrier models were less than 1% in all cases, indicating extremely low in vitro intestinal transport at real intake levels. These results also imply that the interactions between TiO2 and FBS or albumin can decrease in vitro intestinal transport levels.

2.6. Ex Vivo Intestinal Absorption of Food Additive TiO2 Interacted with Matices

Ex vivo intestinal absorption amounts of TiO2 particles were evaluated using an everted gut sac model as previously reported [44,45,46]. The dose of 40 μg/mL was chosen based on actual oral intake levels in rats (converted from human intake) and ex vivo experimental everted rat gut sac conditions (gut sac length and test volume). A higher dose of 80 μg/mL was also included to investigate potential effect of high exposure on intestinal absorption. The results show similar tendency to in vitro intestinal transport results (Figure 4). Higher intestinal absorptions of TiO2 particles in Tyrode’s solution (without matrices) or glucose were found relative to those in FBS or albumin (Figure 5). These results can be also explained by increased hydrodynamic diameters of TiO2 in FBS or albumin relative to those in glucose (Table 1). No effect of particle size (T3 and T4) or dose was found (p > 0.05). Notably, the maximum intestinal absorption levels of TiO2 were below 1.5% and decreased to basal levels (comparable to those without particles) when interacting with FBS or albumin. These findings imply that the interactions between TiO2 particles and food or biological matrices, such as albumin or FBS, can decrease in vitro and ex vivo intestinal absorption, potentially contributing to their low oral toxicity.

2.7. DNA Damage Caused by Food Additive TiO2 Interacted with Matices

The potential genotoxicity was assessed with the comet assay, a sensitive and cost-effective technique used to measure DNA damage. The percentage (%) of total DNA in the comet tail serves as a quantitative indicator of the frequency of DNA breaks or fragments in cells. Figure 6 shows that both T3 and T4 particles in MEM caused DNA damage in Caco-2 cells, even if the damage levels were significantly much lower than well-known positive control for DNA damage, H2O2. The result indicates that food additive TiO2 particles have potential to cause DNA damage, probably related to their ROS generation and oxidative stress (Figure 2C and Figure 3). Several reports demonstrated DNA damage caused by TiO2 particles in cultured cell lines [47,48,49]. On the other hand, the statistically same DNA damage level by TiO2 particles was found when they interacted with glucose. Interestingly, total DNA (%) in comet tail significantly decreased by TiO2 particles dispersed in FBS or albumin, regardless of particle size. These results can be explained by decreased in vitro intestinal absorption of TiO2 particles (Figure 4) related to their large hydrodynamic diameters in FBS or albumin (Table 1). These findings suggest that the interactions between TiO2 particles and food or biological matrices may reduce the genotoxicity potential of TiO2.

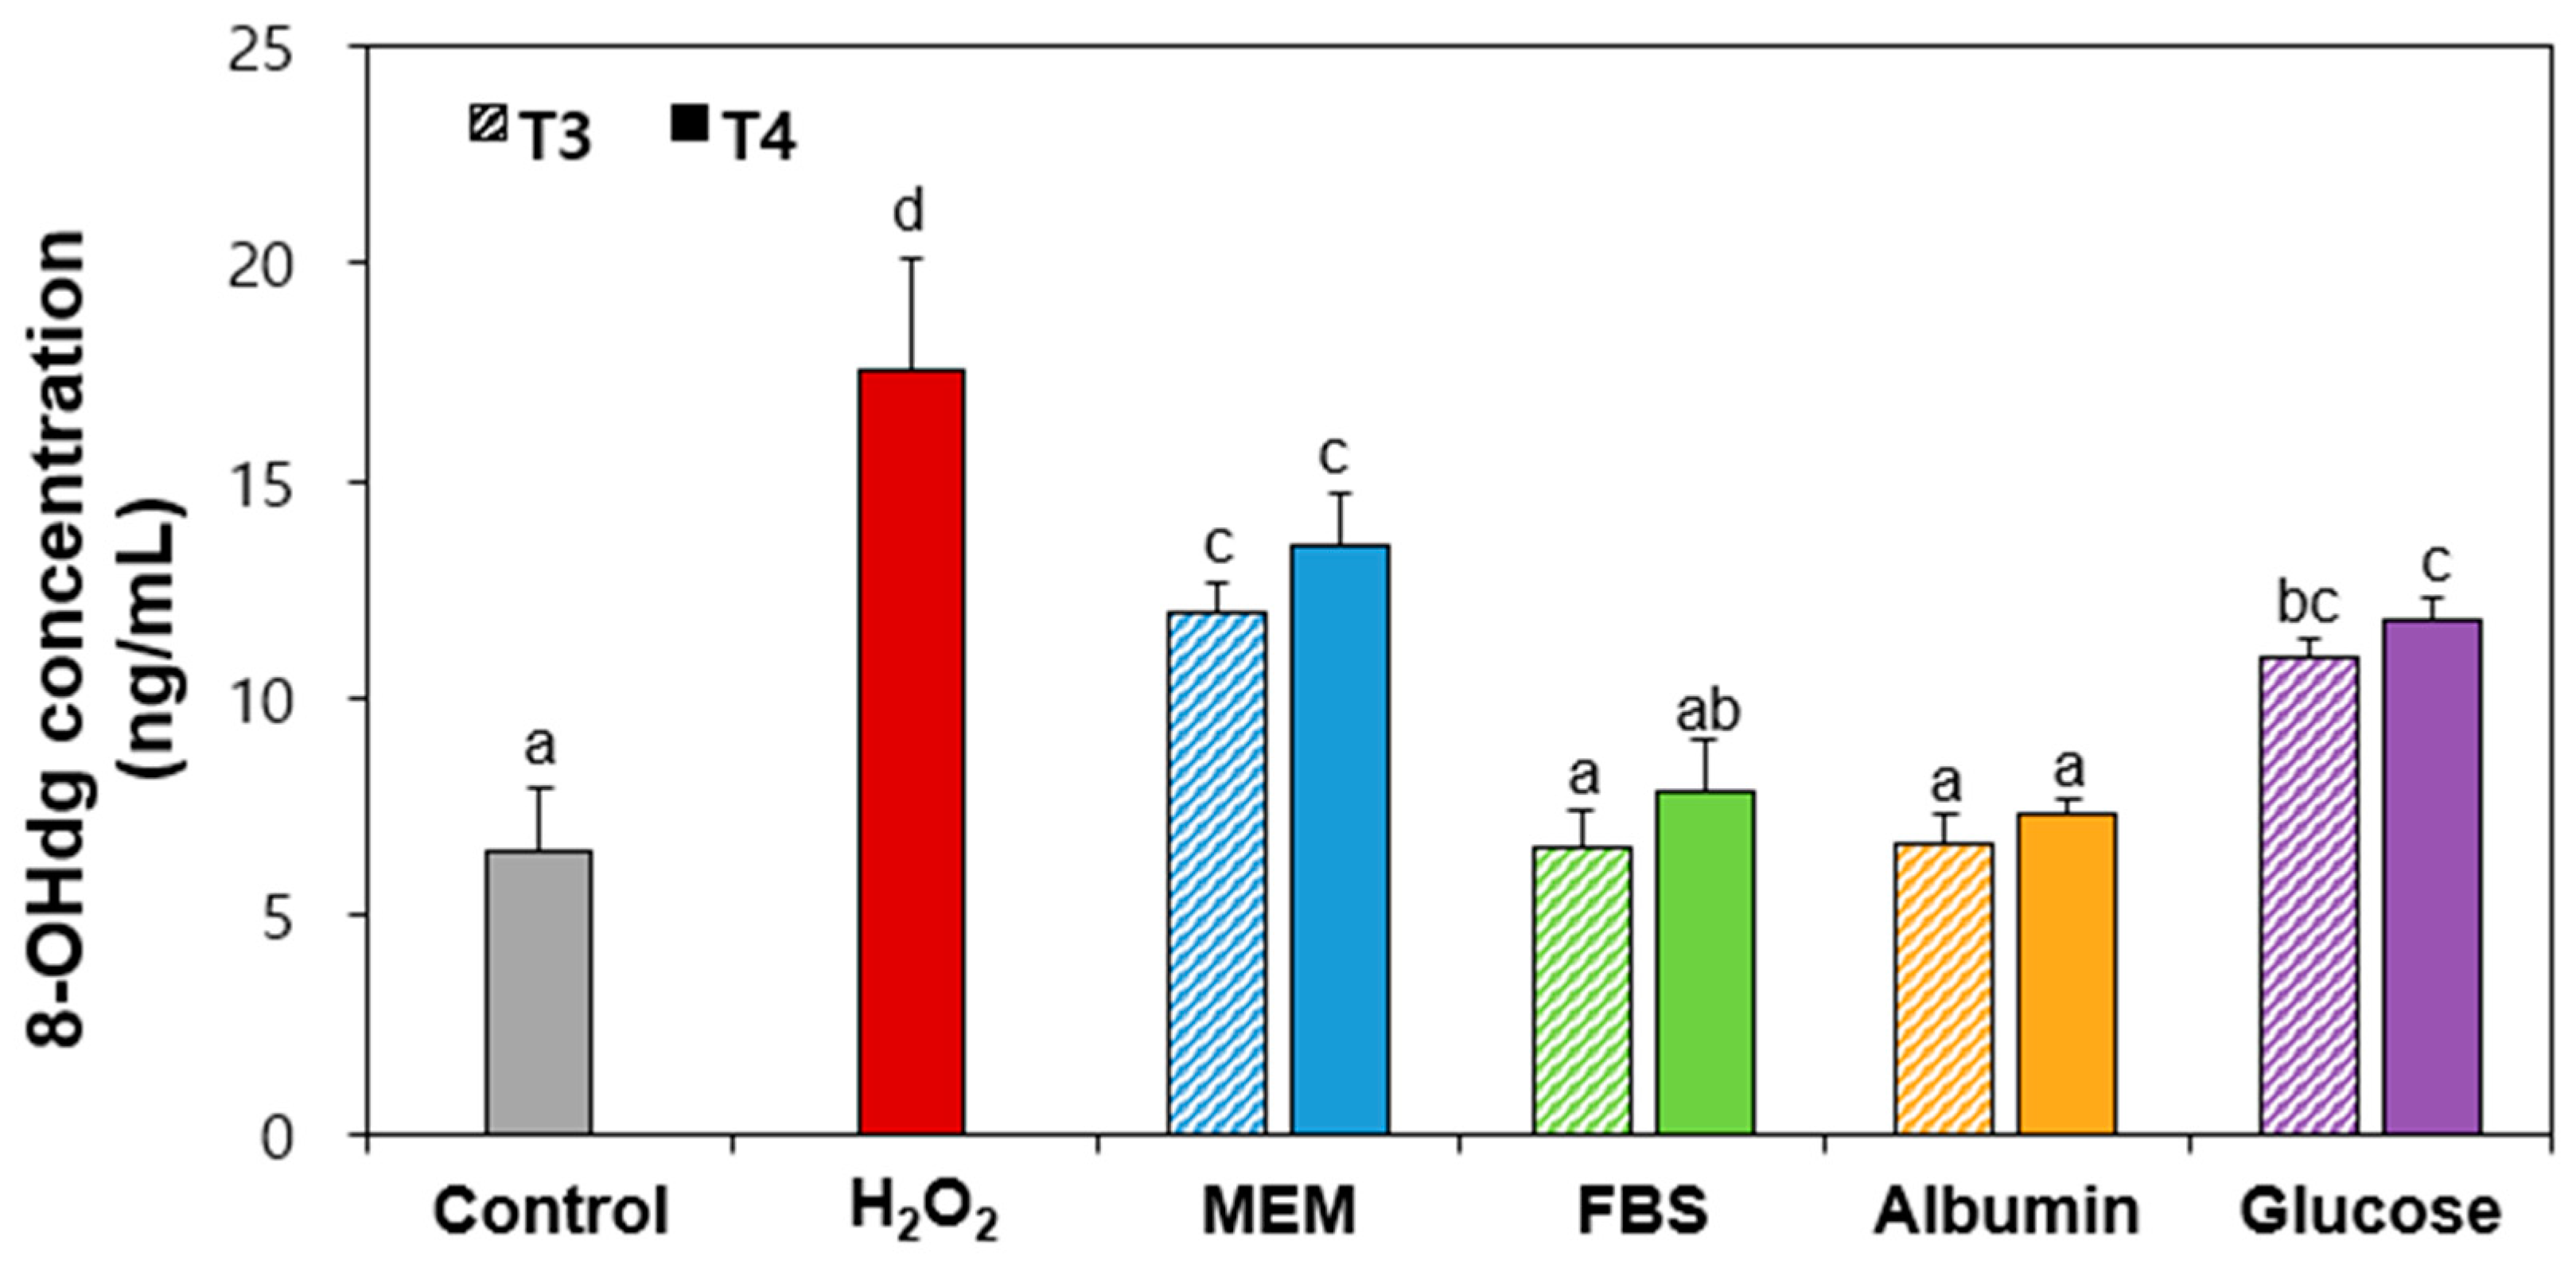
2.8. 8-Hydroxy-2′-Deoxyguanosine (8-OHdg) Production by Food Additive TiO2 Interacted with Matices

8-OHdg is one of the most representative derivatives of DNA formed by ROS or photodynamic action, and is used as a biomarker of oxidative stress-induced DNA damage and cancers [50,51]. Figure 7 shows that both TiO2 particles in MEM or glucose significantly produced 8-OHdg compared to untreated control cells, whereas TiO2 interacted with FBS or albumin did not increase 8-OHdg levels. No effect of particle size was found (p > 0.05). This result clearly suggests that TiO2 particles generate ROS, which can lead to DNA damage associated with oxidative stress.

3. Materials and Methods

3.1. Materials

Two different food additive E171 TiO2 were provided from commercial manufacturers, which were chosen as representative largest and smallest particle based on our previous report [24]. TiO2 dispersions (1 mg/mL) in deionized and distilled water (DDW) were stirred for 30 min and bath-sonicated for 5 min (160 Watts, Bransonic 580, Branson Ultrasonics, Danbury, CT, USA) prior to experiments. FBS was purchased from Welgene Inc. (Gyeongsan, Gyeongsangbuk-do, Republic of Korea). Albumin and glucose were obtained from Sigma-Aldrich Co., Ltd. (St. Louis, MO, USA). For interaction study, the stock solutions (292 μg/mL) were prepared in 1% FBS, 1% albumin, and 1% glucose, respectively, and dispersed as describe above. The three matrices were prepared in DDW and minimum essential medium (MEM), respectively, for comparison.

3.2. Characterization

Constituent particle size and shape were determined by field emission-scanning electron microscopy (SEM, JSM-7100F, JOEL, Tokyo, Japan) as previously reported [52]. Hydrodynamic radii of TiO2 particles were measured with a Zetasizer Nano System (Malvern Instruments, Worcestershire, UK) via light scattering (DLS). X-ray diffraction (XRD) pattern analysis was applied to determine the crystalline phase using Ni-filtered CuKα radiation (D2phaser, Bruker AXS Inc., Madison, WI, USA) [24].

3.3. In Vitro Solubility in Digestive Fluids

The solubility of TiO2 particles in simulated gastrointestinal digestive fluids consisting of simulated salivary fluid (SSF), simulated gastric fluid (SGF), and simulated intestinal fluid (SIF) was investigated according to INFOGEST 2.0 protocol [53]. Briefly, 1 mL of TiO2 particles (2 mg/mL) suspended in the absence or presence of matrices were incubated in 1 mL of SSF at 37 °C for 2 h, followed by incubation in 1 mL of SGF and 1 mL of SIF at 37 °C for 2 h, respectively. After centrifugation (16,000× g) for 15 min, Ti levels in supernatants were analyzed by inductively coupled plasma-atomic emission spectroscopy (ICP-AES) as described in Section 3.9. ICP-AES Analysis.

3.4. Cell Culture

Human intestinal epithelial Caco-2 cells and non-adherent human Burkitt lymphoma Raji B cells were purchased from Korean Cell Line Bank (Seoul, Republic of Korea). Caco-2 cells and Raji B cells were maintained in MEM and RPMI 1640 medium, respectively, supplemented with heat-inactivated FBS (10%), penicillin (100 units/mL), and streptomycin (100 μg/mL) under 5% CO2 atmosphere at 37 °C.

3.5. Cytotoxicity

The effects of TiO2 on cell proliferation and membrane damage were investigated with water-soluble tetrazolium salt-1 (WST-1; Roche, Molecular Biochemicals, Manheim, Germany) and a CytoTox 96 Non-Radioactive Cytotoxicity assay (Promega, Madison, WI, USA), respectively. For WST-1 assay, Caco-2 cells (1 × 10⁴ cells/100 μL) were treated with TiO2 with or without matrices for 24 h. The cells were further incubated for 4 h after addition of WST-1 solution (10 μL), and the absorbance at 440 nm was measured using a microplate reader (Infinite® M Plex, Tecan, Männedorf, Switzerland).
Cell membrane damage was evaluated by incubating Caco-2 cells (4 × 10⁴ cells/mL) with TiO2 in the absence or presence of matrices for 24 h. The cell culture medium (50 μL) was used for reaction with substrate solution (50 μL) for 30 min at room temperature. The absorbance at 492 nm was measured using a microplate reader (Infinite® M Plex, Tecan) after addition of stop solution (50 μL).
The ROS generation inside cells was monitored with a peroxide-sensitive fluorescent probe, 20,70-dichlorofluorescein diacetate (H2DCFDA; Molecular Probes Inc., Eugene, OR, USA). Caco-2 cells (1 × 10⁴ cells/100 μL) were exposed to TiO2 in the absence or presence of matrices. After 24 h, the cells were further incubated with H2DCFDA for 30 min at 37 °C in the dark. Dichlorofluorescein fluorescence (DCF) inside cells was monitored using a microplate reader (Infinite® M Plex, Tecan) after washing with phosphate buffered saline (PBS) at 485 nm and 530 nm for excitation and emission wavelengths, respectively. All experiments were conducted in triplicate on two different days.

3.6. Antioxidatn Enzyme Activity

Cells (1 × 10⁶ cells/2 mL) were exposed to TiO2 (292 μg/mL) in the absence or presence of matrices for 24 h. The antioxidant enzyme activities of CAT and SOD were evaluated [54,55], using a CAT assay kit (Cayman Chemical Co., Ann Arbor, MI, USA) and chemical SOD assay kit (Cayman Chemical Co., Ann Arbor, MI, USA), respectively, according to the manufacturer’s protocols. The experiments were conducted in triplicate on two different days.

3.7. In Vitro Intestinal Transport

A FAE model, mimicking M cells, was prepared as previously described [52,56]. Caco-2 cells (1 × 10⁶ cells/well) were cultured on apical insert slides. After 14 days, Raji B cells (1 × 10⁶ cells/well) cultured in Dulbecco’s modified eagle’s medium (DMEM) were placed in basolateral insert parts, and further cultured for 5 days. The coculture was stopped when the transepithelial electrical resistance (TEER) values were ranged from 150 Ω cm2 to 200 Ω cm2. The medium containing TiO2 (292 μg/mL) with or without matrices was placed on apical inserts and incubation for 24 h was carried out. The TiO2 transported into basolateral solutions was quantified using ICP-AES.
A Caco-2 monoculture model, representing the intestinal epithelial tight junction barrier was prepared as previously described [52,56]. Caco-2 cells (4.5 × 10⁵ cells/well) were cultured on apical inserts for 21 days (TEER values ≥ 300 Ω cm2), and the medium containing TiO2 (292 μg/mL) with or without matrices was placed on apical inserts for 24 h. The TiO2 transported into basolateral medium was quantified using ICP-AES. The experiments were conducted in triplicate on two different days.

3.8. Ex Vivo Intestinal Absorption

Male Sprague Dawley rats (nine weeks old) were provided by Koatech Co. (Pyeongtaek, Gyeonggi-do, Korea). The rats were housed in laboratory cages within a ventilated clean rack maintained at 20 ± 2 °C and 60 ± 10% relative humidity, under a 12 h light–dark cycle. The rats were provided with unrestricted access to a standard laboratory diet and water. The animals were acclimatized for 7 d prior to the experiments. All animal experiments were performed in accordance with guidelines of the Institutional Animal Care and Use Committee (IACUC) of Seoul Women’s University. The protocols used in this study were approved by the IACUC of Seoul Women’s University (SWU IACUC 2024A-1).
Ex vivo everted small intestinal sacs were prepared as previously described by Gu et al. [44,45,46]. In brief, four male rats were euthanized using CO2 following overnight fast with access to water. The small intestines were obtained and washed three times with Tyrode’s solution (0.8 g NaCl, 0.02 g KCl, 0.02 g CaCl2, 0.01 g MgCl2, 0.1 g NaHCO3, 0.005 g NaH2PO4, and 0.1 g glucose in 100 mL DW). The small intestines were then cut into 5 cm sections in length and everted using a puncture needle with a diameter of 0.8 mm. After clamping one end, the everted intestinal sacs were filled with 200 μL of Tyrode’s solution and secured with silk braided sutures. The sacs were then incubated with 3 mL of the samples, with or without matrices, in a 6-well plate under a humidified 5% CO2 atmosphere at 37 °C for 2 h. The solutions inside the sacs were collected, and the amounts of absorbed TiO2 particles were analyzed using ICP-AES as described in Section 3.9. ICP-AES Analysis. The experiments were conducted with five repetitions.

3.9. ICP-AES Analysis

TiO2 amounts was quantified by measuring total Ti levels using ICP AES (Perkin-Elmer, Avio 550, Shelton, CT, USA) as previously reported [57]. Biological samples (0.2 g) were digested in HF-resistant perfluoroalkoxy microwave digestion vessels using a microwave system (ETHOS EASY, Milestone Srl, Sorisole, Italy). The digestion process utilized 70% HNO3 (6 mL) and 40% HF (2 mL). The microwave system was set at 1800 W and programmed to irradiate for 15, 10, and 30 min to reach 120 °C, 160 °C, and 210 °C, respectively. Then, holding at 210 °C for 1 min and cooling at 25 °C followed. Finally, the samples were diluted to appropriate volumes with DDW for ICP-AES analysis: 334.94 nm wavelength, 1500 W radiofrequency power, and 12 L/min plasma gas flow.

3.10. Comet Assay

Cells (1 × 10⁶ cells/2 mL) were incubated with TiO2 (292 μg/mL) in the absence or presence of matrices for 24 h. H2O2 (100 μM) was used as a positive control. The cells were washed with PBS, detached with scraper after treatment with 1 mL of 5 mM ethylene diamine tetraacetic acid (in PBS) for 40 s, centrifuged, and re-suspended (1 × 10⁵ cells/1 mL) in ice-cold PBS. A comet assay was then carried out with a kit purchased from R&D systems (Minneapolis, MN, USA) according to the manufacturer’s protocol. The cell suspensions were mixed with low melting point agarose at a ratio of 1:10 (v/v), and 75 μL of the solution was immediately loaded onto comet slide. The slides were placed in a dark room at 4 °C for 30 min for gelation and immersed in a cold lysis solution 4 °C. After 1 h, the lysis solution was removed, and the slides were immersed in alkaline solution (pH > 13) for 30 min in the dark at room temperature. After removing the alkaline solution, the slides were electrophoresed at 20 V and 300 mÅ at 4 °C for 40 min in the dark. The slides were then washed with DDW, immersed in 70% ethanol for 5 min, air-dried, and stained with 100 μL of Cygreen dye for 30 min in the dark at 4 °C. Finally, the slides were analyzed using Axioskop 2 plus fluorescent microscope and Cometscore 2.0 imaging software (Carl Zeiss, Oberkochen, Germany). The comet tail lengths were digitally analyzed and percent (%) DNA in the tail (the fraction of DNA in the tail divided by the total amount of DNA) was calculated. The experiments were conducted in triplicate on two different days.

3.11. 8-OHdG Assay

Cells (1 × 10⁶ cells/2 mL) were exposed to TiO2 (292 μg/mL) in the absence or presence of matrices for 24 h. H2O2 (100 μM) was used as a positive control. The DNA was then extracted using the AccuPrep® Genomic DNA Extraction kit (Bioneer, Daejeon, Republic of Korea) following the manufacturer’s protocols. The extracted DNA (20 μg) was denatured at 95 °C for 5 min and cooled on ice. Nuclease P1 (0.1 μL) was added to the denatured DNA and incubated for 1 h at 50 °C for nucleoside formation by adjusting pH at 5.3 with 20 mM sodium acetate. The mixture was incubated with alkaline phosphatase at 37 °C for 1 h for phosphate decomposition. The pH of the mixture was then adjusted to range from 7.5 to 8.5 and boiled for 10 min. The prepared samples were stored on ice before analysis. Oxidative stress biomarkers 8-OHdG, an RNA nucleoside which is an oxidative derivative of guanosine, was quantified using 8-OHdG enzyme-linked immunosorbent assay (ELISA) kit (Abcam, Cambridge, UK) according to the manufacturer’s protocol. The experiments were conducted in triplicate on two different days.

3.12. Statistical Analysis

All results were presented as mean ± standard deviation. One-way analysis of variance (ANOVA) with Tukey’s test was carried out using SAS Ver. 9.4 (SAS Institute, Cary, NC, USA) to assess the significant differences between group means tested. Statistical significance was defined as a p-value of <0.05. Normality of distribution and homogeneity of variation were tested using Shapiro–Wilk and Levene’s tests, respectively, prior to ANOVA analysis.

4. Conclusions

Interactions between two differently sized food additive TiO2 and food (albumin and glucose) or biological (FBS) matrices were investigated in terms of hydrodynamic diameters, cytotoxicity, intestinal transport, and genotoxicity. The results show that TiO2 interacted with FBS or albumin, leading to increased hydrodynamic radii, which in turn reduced cytotoxicity, intestinal transport, and DNA damage. The genotoxicity effects of TiO2 were closely associated with oxidative stress. These findings suggest that the interactions between TiO2 and food or biological components can affect biological responses and genotoxicity, potentially contributing to its safety as a food additive. Further studies are required to fully assess the potential genotoxicity of TiO2 in food products.

Supplementary Materials

The following supporting information can be downloaded at: https://www.mdpi.com/article/10.3390/ijms26020617/s1.

Author Contributions

Formal analysis, investigation, validation, S.-M.J.; methodology and validation, H.-N.N.; conceptualization, resources, supervision, funding acquisition, project administration, writing—original draft preparation, and writing—editing and revision, S.-J.C. All authors have read and agreed to the published version of the manuscript.

Funding

This research was supported by a National Research Foundation of Korea (NRF) grant funded by the Korea government (MSIT) (RS-2024-00343763), and partly by a research grant from Seoul Women’s University (2024-0101).

Institutional Review Board Statement

The study was conducted according to the guidelines of the Declaration of Helsinki and approved by the Institutional Animal Care and Use Committee (IACUC) of Seoul Women’s University (SWU IACUC 2024A-1).

Informed Consent Statement

Not applicable.

Data Availability Statement

The data presented in this study are available in the article.

Conflicts of Interest

The authors declare no conflicts of interest.

References

  1. EFSA Panel on Food Additives and Flavourings (FAF); Younes, M.; Aquilina, G.; Castle, L.; Engel, K.H.; Fowler, P.; Frutos Fernandez, M.J.; Fürst, P.; Gundert-Remy, U.; Gürtler, R.; et al. Safety assessment of titanium dioxide (E171) as a food additive. EFSA J. 2021, 19, e06585. [Google Scholar] [PubMed]
  2. European Commission. European Commission Regulation (EU) 2022/63 of 14 January 2022 Amending Annexes II and III to Regulation (EC) No 1333/2008 of the European Parliament and of the Council as Regards the Food Additive Titanium Dioxide (E 171) (Text with EEA Relevance). 2022. Available online: https://eur-lex.europa.eu/eli/reg/2022/63/oj (accessed on 28 November 2024).
  3. U.S. Food and Drug Administration (FDA). CFR-Code of Federal Regulations Title 21 CRF 73.575. Available online: https://www.ecfr.gov/cgi-bin/retrieveECFR?gp=&SID=17723345ba7c363ef25a68e9776aa2cd&r=PART&n=21y1.0.1.1.27#se21.1.73_1575 (accessed on 28 November 2024).
  4. National Toxicology Program Official. Bioassay of Titanium Dioxide for Possible Carcinogenicity; National Cancer Institute: Bethesda, MD, USA, 1979.
  5. Additives, J. Thirteenth Report of the Joint FAO/WHO Expert Committee on Food Additives. Specifications for the Identity and Purity of Food Additives and Their Toxicological Evaluation; World Health Organization: Geneva, Switzerland, 1970. [Google Scholar]
  6. World Health Organization. Compendium of Food Additive Specifications. In Joint FAO/WHO Expert Committee on Food Additives, Proceedings of the 97th Meeting, Rome, Italy, 31 October–9 November 2023; Food & Agriculture Org.: Rome, Italy, 2024. [Google Scholar]
  7. Food Standards Australia New Zealand (FSANZ). Review of Titanium Dioxide as a Food Additive. Available online: https://www.foodstandards.gov.au/sites/default/files/consumer/foodtech/Documents/FSANZ_TiO2_Assessment_report.pdf (accessed on 28 November 2024).
  8. United Kingdom’s Food Standards Authority (FSA). FSA 22-06-19a—Risk Analysis Process Update. 2022. Available online: https://www.food.gov.uk/print/pdf/node/9616 (accessed on 28 November 2024).
  9. Health Canada. State of the Science of Titanium Dioxide (TiO2) as a Food Additive. 2022. Available online: https://publications.gc.ca/collections/collection_2022/sc-hc/H164-341-2022-eng.pdf (accessed on 28 November 2024).
  10. Pinget, G.; Tan, J.; Janac, B.; Kaakoush, N.O.; Angelatos, A.S.; O’Sullivan, J.; Koay, Y.C.; Sierro, F.; Davis, J.; Divakarla, S.K. Impact of the food additive titanium dioxide (E171) on gut microbiota-host interaction. Front. Nutr. 2019, 6, 446992. [Google Scholar] [CrossRef] [PubMed]
  11. Nogueira, C.M.; de Azevedo, W.M.; Dagli, M.L.Z.; Toma, S.H.; de Arruda Leite, A.Z.; Lordello, M.L.; Nishitokukado, I.; Ortiz-Agostinho, C.L.; Duarte, M.I.S.; Ferreira, M.A. Titanium dioxide induced inflammation in the small intestine. World J. Gastroenterol. 2012, 18, 4729. [Google Scholar] [CrossRef]
  12. Urrutia-Ortega, I.M.; Garduño-Balderas, L.G.; Delgado-Buenrostro, N.L.; Freyre-Fonseca, V.; Flores-Flores, J.O.; González-Robles, A.; Pedraza-Chaverri, J.; Hernández-Pando, R.; Rodríguez-Sosa, M.; León-Cabrera, S. Food-grade titanium dioxide exposure exacerbates tumor formation in colitis associated cancer model. Food Chem. Toxicol. 2016, 93, 20–31. [Google Scholar] [CrossRef] [PubMed]
  13. Hong, F.; Zhou, Y.; Zhao, X.; Sheng, L.; Wang, L. Maternal exposure to nanosized titanium dioxide suppresses embryonic development in mice. Int. J. Nanomedicine 2017, 12, 6197–6204. [Google Scholar] [CrossRef]
  14. Cao, Y.; Chen, J.; Bian, Q.; Ning, J.; Yong, L.; Ou, T.; Song, Y.; Wei, S. Genotoxicity Evaluation of Titanium Dioxide Nanoparticles In Vivo and In Vitro: A Meta-Analysis. Toxics 2023, 11, 882. [Google Scholar] [CrossRef]
  15. Warheit, D.; Boatman, R.; Brown, S. Developmental toxicity studies with 6 forms of titanium dioxide test materials (3 pigment-different grade & 3 nanoscale) demonstrate an absence of effects in orally-exposed rats. Regul. Toxicol. Pharmacol. 2015, 73, 887–896. [Google Scholar]
  16. Han, H.Y.; Yang, M.J.; Yoon, C.; Lee, G.H.; Kim, D.W.; Kim, T.W.; Kwak, M.; Heo, M.B.; Lee, T.G.; Kim, S. Toxicity of orally administered food-grade titanium dioxide nanoparticles. J. Appl. Toxicol. 2021, 41, 1127–1147. [Google Scholar] [CrossRef]
  17. Liang, C.; Zhang, X.; Fang, J.; Sun, N.; Liu, H.; Feng, Y.; Wang, H.; Yu, Z.; Jia, X. Genotoxicity evaluation of food additive titanium dioxide using a battery of standard in vivo tests. Regul. Toxicol. Pharmacol. 2024, 148, 105586. [Google Scholar] [CrossRef]
  18. Jo, M.R.; Yu, J.; Kim, H.J.; Song, J.H.; Kim, K.M.; Oh, J.M.; Choi, S.J. Titanium dioxide nanoparticle-biomolecule interactions influence oral absorption. Nanomaterials 2016, 6, 225. [Google Scholar] [CrossRef]
  19. Mesgari, M.; Aalami, A.H.; Sahebkar, A. Antimicrobial activities of chitosan/titanium dioxide composites as a biological nanolayer for food preservation: A review. Int. J. Biol. Macromol. 2021, 176, 530–539. [Google Scholar] [CrossRef] [PubMed]
  20. Fenoglio, I.; Greco, G.; Livraghi, S.; Fubini, B. Non-UV-induced radical reactions at the surface of TiO2 nanoparticles that may trigger toxic responses. Chem.-Eur. J. 2009, 15, 4614–4621. [Google Scholar] [CrossRef] [PubMed]
  21. Kim, I.Y.; Lee, T.G.; Reipa, V.; Heo, M.B. Titanium dioxide induces apoptosis under UVA irradiation via the generation of lysosomal membrane permeabilization-dependent reactive oxygen species in HaCaT cells. Nanomaterials 2021, 11, 1943. [Google Scholar] [CrossRef]
  22. Xiao, Z.; Zheng, M.; Deng, J.; Shi, Y.; Jia, M.; Li, W. Nano-TiO2 regulates the MAPK (ERK, P38) pathway to promote apoptosis and inhibit proliferation of human colon cells. Ecotoxicol. Environ. Saf. 2024, 283, 116973. [Google Scholar] [CrossRef]
  23. Dorier, M.; Béal, D.; Marie-Desvergne, C.; Dubosson, M.; Barreau, F.; Houdeau, E.; Herlin-Boime, N.; Carriere, M. Continuous in vitro exposure of intestinal epithelial cells to E171 food additive causes oxidative stress, inducing oxidation of DNA bases but no endoplasmic reticulum stress. Nanotoxicology 2017, 11, 751–761. [Google Scholar]
  24. Hwang, J.S.; Yu, J.; Kim, H.M.; Oh, J.M.; Choi, S.J. Food additive titanium dioxide and its fate in commercial foods. Nanomaterials 2019, 9, 1175. [Google Scholar] [CrossRef]
  25. Duan, S.; Wang, H.; Gao, Y.; Wang, X.; Lyu, L.; Wang, Y. Oral intake of titanium dioxide nanoparticles affect the course and prognosis of ulcerative colitis in mice: Involvement of the ROS-TXNIP-NLRP3 inflammasome pathway. Part. Fibre Toxicol. 2023, 20, 24. [Google Scholar] [CrossRef]
  26. Bischoff, N.S.; Undas, A.K.; van Bemmel, G.; Briedé, J.J.; van Breda, S.G.; Verhoeven, J.; Verbruggen, S.; Venema, K.; Sijm, D.T.H.M.; de Kok, T.M.; et al. Investigating the ROS Formation and Particle Behavior of Food-Grade Titanium Dioxide (E171) in the TIM-1 Dynamic Gastrointestinal Digestion Model. Nanomaterials 2024, 15, 8. [Google Scholar] [CrossRef]
  27. Qiaorun, Z.; Honghong, S.; Yao, L.; Bing, J.; Xiao, X.; McClements, D.J.; Chongjiang, C.; Biao, Y. Investigation of the interactions between food plant carbohydrates and titanium dioxide nanoparticles. Food Res. Int. 2022, 159, 111574. [Google Scholar] [CrossRef]
  28. Gräfe, C.; Weidner, A.; vd Lühe, M.; Bergemann, C.; Schacher, F.H.; Clement, J.H.; Dutz, S. Intentional formation of a protein corona on nanoparticles: Serum concentration affects protein corona mass, surface charge, and nanoparticle–cell interaction. Int. J. Biochem. Cell Biol. 2016, 75, 196–202. [Google Scholar] [CrossRef]
  29. Peng, Q.; Wei, X.Q.; Yang, Q.; Zhang, S.; Zhang, T.; Shao, X.R.; Cai, X.X.; Zhang, Z.R.; Lin, Y.F. Enhanced biostability of nanoparticle-based drug delivery systems by albumin corona. Nanomedicine 2015, 10, 205–214. [Google Scholar] [CrossRef] [PubMed]
  30. Lee, J.A.; Kim, M.K.; Song, J.H.; Jo, M.R.; Yu, J.; Kim, K.M.; Kim, Y.R.; Oh, J.M.; Choi, S.J. Biokinetics of food additive silica nanoparticles and their interactions with food components. Colloids Surf. B Biointerfaces 2017, 150, 384–392. [Google Scholar] [CrossRef] [PubMed]
  31. Yang, Z.; Miao, Y.; Li, W.; Song, G.; Xiao, M.; Liang, X.; Yang, Y. Synthesis of uniform platinum nanoparticles using glucose as dispersant. Nanosci. Nanotechnol. Lett. 2014, 6, 592–595. [Google Scholar] [CrossRef]
  32. Ferraris, F.; Raggi, A.; Ponti, J.; Mehn, D.; Gilliland, D.; Savini, S.; Iacoponi, F.; Aureli, F.; Calzolai, L.; Cubadda, F. Agglomeration Behavior and Fate of Food-Grade Titanium Dioxide in Human Gastrointestinal Digestion and in the Lysosomal Environment. Nanomaterials 2023, 13, 1908. [Google Scholar] [CrossRef]
  33. Mbanga, O.; Cukrowska, E.; Gulumian, M. Dissolution of titanium dioxide nanoparticles in synthetic biological and environmental media to predict their biodurability and persistence. In Vitro Toxicol. 2022, 84, 105457. [Google Scholar] [CrossRef]
  34. Warheit, D.B.; Brown, S.C. What is the impact of surface modifications and particle size on commercial titanium dioxide particle samples?–A review of in vivo pulmonary and oral toxicity studies–Revised 11-6-2018. Toxicol. Lett. 2019, 302, 42–59. [Google Scholar] [CrossRef]
  35. Winkler, H.C.; Notter, T.; Meyer, U.; Naegeli, H. Critical review of the safety assessment of titanium dioxide additives in food. J. Nanobiotechnology 2018, 16, 51. [Google Scholar] [CrossRef]
  36. Korea Health Industry Development Institute (KHIDI). National Food & Nutrition Statistics. 2017. Available online: https://www.khidi.or.kr/kps/dhraStat/result2?menuId=MENU01653&gubun=&year=2017 (accessed on 29 January 2020).
  37. Yu, J.; Kim, Y.H.; Choi, S.J. Usage-and daily intake-based cytotoxicity study of frequently used natural food additives in South Korea. Korean J. Food Sci. Technol. 2020, 52, 546–554. [Google Scholar]
  38. Bhatti, R.; Shakeel, H.; Malik, K.; Qasim, M.; Khan, M.A.; Ahmed, N.; Jabeen, S. Inorganic nanoparticles: Toxic effects, mechanisms of cytotoxicity and phytochemical interactions. Adv. Pharm. Bull. 2021, 12, 757. [Google Scholar] [CrossRef]
  39. Ma, Y.; Guo, Y.; Wu, S.; Lv, Z.; Zhang, Q.; Ke, Y. Titanium dioxide nanoparticles induce size-dependent cytotoxicity and genomic DNA hypomethylation in human respiratory cells. RSC Adv. 2017, 7, 23560–23572. [Google Scholar] [CrossRef]
  40. Gandamalla, D.; Lingabathula, H.; Yellu, N. Nano titanium exposure induces dose-and size-dependent cytotoxicity on human epithelial lung and colon cells. Drug Chem. Toxicol. 2019, 42, 24–34. [Google Scholar] [CrossRef] [PubMed]
  41. Zhu, M.; Nie, G.; Meng, H.; Xia, T.; Nel, A.; Zhao, Y. Physicochemical properties determine nanomaterial cellular uptake, transport, and fate. Acc. Chem. Res. 2013, 46, 622–631. [Google Scholar] [CrossRef] [PubMed]
  42. Yu, J.; Baek, M.; Chung, H.E.; Choi, S.J. Effects of physicochemical properties of zinc oxide nanoparticles on cellular uptake. J. Phys. Conf. Ser. 2011, 304, 012007. [Google Scholar] [CrossRef]
  43. Allouni, Z.E.; Høl, P.J.; Cauqui, M.A.; Gjerdet, N.R.; Cimpan, M.R. Role of physicochemical characteristics in the uptake of TiO2 nanoparticles by fibroblasts. Vitr. Toxicol. 2012, 26, 469–479. [Google Scholar] [CrossRef]
  44. Gu, T.; Yao, C.; Zhang, K.; Li, C.; Ding, L.; Huang, Y.; Wu, M.; Wang, Y. Toxic effects of zinc oxide nanoparticles combined with vitamin C and casein phosphopeptides on gastric epithelium cells and the intestinal absorption of mice. RSC Adv. 2018, 8, 26078–26088. [Google Scholar] [CrossRef]
  45. Kim, S.B.; Yoo, N.K.; Choi, S.J. Interactions between ZnO nanoparticles and polyphenols affect biological responses. Nanomaterials 2022, 12, 3337. [Google Scholar] [CrossRef]
  46. Jin, H.R.; Yu, J.; Choi, S.J. Hydrothermal treatment enhances antioxidant activity and intestinal absorption of rutin in tartary buckwheat flour extracts. Foods 2019, 9, 8. [Google Scholar] [CrossRef]
  47. Murugadoss, S.; Brassinne, F.; Sebaihi, N.; Petry, J.; Cokic, S.M.; Van Landuyt, K.L.; Godderis, L.; Mast, J.; Lison, D.; Hoet, P.H.; et al. Agglomeration of titanium dioxide nanoparticles increases toxicological responses in vitro and in vivo. Part. Fibre Toxicol. 2020, 17, 10. [Google Scholar] [CrossRef]
  48. Proquin, H.; Rodriguez-Ibarra, C.; Moonen, C.G.; Urrutia Ortega, I.M.; Briede, J.J.; de Kok, T.M.; van Loveren, H.; Chirino, Y.I. Titanium dioxide food additive (E171) induces ROS formation and genotoxicity: Contribution of micro and nano-sized fractions. Mutagenesis 2017, 32, 139–149. [Google Scholar] [CrossRef]
  49. Vieira, A.; Vital, N.; Rolo, D.; Roque, R.; Goncalves, L.M.; Bettencourt, A.; Silva, M.J.; Louro, H. Investigation of the genotoxicity of digested titanium dioxide nanomaterials in human intestinal cells. Food Chem. Toxicol. 2022, 161, 112841. [Google Scholar] [CrossRef]
  50. Valavanidis, A.; Vlachogianni, T.; Fiotakis, C. 8-hydroxy-2′-deoxyguanosine (8-OHdG): A critical biomarker of oxidative stress and carcinogenesis. J. Environ. Sci. Health C Environ. Carcinog. Ecotoxicol. Rev. 2009, 27, 120–139. [Google Scholar] [CrossRef] [PubMed]
  51. Honda, M.; Yamada, Y.; Tomonaga, M.; Ichinose, H.; Kamihira, S. Correlation of urinary 8-hydroxy-2′-deoxyguanosine (8-OHdG), a biomarker of oxidative DNA damage, and clinical features of hematological disorders: A pilot study. Leuk. Res. 2000, 24, 461–468. [Google Scholar] [CrossRef] [PubMed]
  52. Yoo, N.K.; Jeon, Y.R.; Choi, S.J. Determination of Two Differently Manufactured Silicon Dioxide Nanoparticles by Cloud Point Extraction Approach in Intestinal Cells, Intestinal Barriers and Tissues. Int. J. Mol. Sci. 2021, 22, 7035. [Google Scholar] [CrossRef] [PubMed]
  53. Brodkorb, A.; Egger, L.; Alminger, M.; Alvito, P.; Assuncao, R.; Ballance, S.; Bohn, T.; Bourlieu-Lacanal, C.; Boutrou, R.; Carriere, F.; et al. INFOGEST static in vitro simulation of gastrointestinal food digestion. Nat. Protoc. 2019, 14, 991–1014. [Google Scholar] [CrossRef] [PubMed]
  54. Aebi, H. Catalase in vitro. In Methods in Enzymology; Academic Press: San Diego, CA, USA, 1984; Volume 105, pp. 121–126. [Google Scholar]
  55. Peskin, A.V.; Winterbourn, C.C. A microtiter plate assay for superoxide dismutase using a water-soluble tetrazolium salt (WST-1). Clin. Chim. Acta 2000, 293, 157–166. [Google Scholar] [CrossRef]
  56. Lee, H.I.; Kwon, R.Y.; Choi, S.J. Food Additive Solvents Increase the Dispersion, Solubility, and Cytotoxicity of ZnO Nanoparticles. Nanomaterials 2023, 13, 2573. [Google Scholar] [CrossRef]
  57. Kwon, R.Y.; Kim, S.B.; Youn, S.M.; Choi, S.-J. Fate Determination and Characterization of Food Additive Silicon Dioxide and Titanium Dioxide in Commercial Foods. Front. Biosci. (Landmark Ed.) 2023, 28, 36. [Google Scholar] [CrossRef]
Figure 1. (A) Scanning electron microscopy (SEM) images and (B) size distribution of two differently sized TiO2 particles (T3 and T4). Particle size distribution was determined by randomly selecting 100 particles from SEM images.
Ijms 26 00617 g001
Figure 2. (A) Cell proliferation inhibition, (B) lactate dehydrogenase (LDH) release, and (C) reactive oxygen species (ROS) production caused in Caco-2 cells exposed to TiO2 particles (T3 and T4) interacted with food or biological matrices. Different lowercase letters (a, b) above bars denote significant differences among different matrices interacted (untreated control, MEM, FBS, albumin, and glucose) (p < 0.05). * denotes significant difference compared to untreated control cells (p < 0.05). Abbreviation: DCF, dichlorofluorescein fluorescence.
Ijms 26 00617 g002
Figure 3. (A) Catalase (CAT) and (B) superoxide dismutase (SOD) activities in Caco-2 cells exposed to TiO2 particles (T3 and T4) interacted with food or biological matrices. Control represents the basal antioxidant enzyme activities in Caco-2 cells without particles. Different lowercase letters (a, b, c) above bars denote significant differences among different matrices interacted (untreated control, MEM, FBS, albumin, and glucose) (p < 0.05).
Ijms 26 00617 g003
Figure 4. In vitro intestinal transports of TiO2 particles (T3 and T4) interacted with food or biological matrices through (A) Caco-2 monolayers and (B) follicle-associated epithelial (FAE) models. Control represents the basal Ti levels in the two models without particles. Different lowercase letters (a, b) above bars denote significant differences among different matrices interacted (untreated control, MEM, FBS, albumin, and glucose) (p < 0.05).
Ijms 26 00617 g004
Figure 5. Ex vivo intestinal absorption of TiO2 particles ((A) T3; (B) T4) interacted with food or biological matrices at two different doses using an everted gut sac model. Control represents basal Ti levels in everted gut sac without particles. Different lowercase letters (a, b) above bars denote significant differences among different matrices interacted (untreated control, MEM, FBS, albumin, and glucose) (p < 0.05).
Ijms 26 00617 g005
Figure 6. DNA damage caused by TiO2 particles (T3 and T4) interacted with food or biological matrices assessed with comet assay in Caco-2 cells. (A) Representative images of Caco-2 cells treated with TiO2. Images were magnified at 20×. Percentage DNA values in tails exposed to (B) T3 and (C) T4. Control represents DNA (%) in tails of untreated cells without particles. Different lowercase letters (a, b, c) above bars denote significant differences among different matrices interacted (untreated control, MEM, FBS, albumin, and glucose) (p < 0.05).
Ijms 26 00617 g006
Figure 7. 8-hydroxyl-2′-deoxyguanosine (8-OHdg) generated by TiO2 particles (T3 and T4) interacted with food or biological matrices in Caco-2 cells. Control represent basal 8-OHdg levels of untreated cells without particles. Different lowercase letters (a, b, c, d) above bars denote significant differences among different matrices interacted (untreated control, MEM, FBS, albumin, and glucose) (p < 0.05).
Ijms 26 00617 g007
Table 1. Hydrodynamic diameters of TiO2 particles (T3 and T4) interacted with food or biological matrices.
SamplesHydrodynamic Diameter (nm)
DDWDDWMEMMEM
FBSAlbuminGlucoseFBSAlbuminGlucose
T3304.7
± 0.9 A,a
404.8
± 6.6 A,b
397.5
± 6.6 A,b
317.9
± 6.1 A,a
440.9
± 4.3 B,a
505.6
± 6.5 B,b
495.3
± 6.1 B,b
456.3
± 7.6 B,a
T4295.7
± 2.9 A,a
348.2
± 1.4 A,b
342.6
± 14.8 A,b
308.1
± 5.9 A,a
377.3
± 2.8 B,a
437.0
± 9.2 B,b
431.9
± 2.6 B,b
388.9
± 1.0 B,a
Different uppercase letters (A, B) next to values denote significant differences in hydrodynamic diameters interacting with FBS, albumin, or glucose in DDW compared to those in MEM (p < 0.05). Different lowercase letters (a, b) next to values denote significant differences among different matrices prepared in DDW or MEM (p < 0.05). Abbreviations: DDW, distilled deionized water; MEM, minimum essential medium; FBS, fetal bovine serum.
Disclaimer/Publisher’s Note: The statements, opinions and data contained in all publications are solely those of the individual author(s) and contributor(s) and not of MDPI and/or the editor(s). MDPI and/or the editor(s) disclaim responsibility for any injury to people or property resulting from any ideas, methods, instructions or products referred to in the content.

