Abstract
RNA N6-methyladenosine (m6A) is one of the most common and widespread reversible epigenetic modifications of mRNAs, and m6A has been shown to play a positive role in regulating follicular development. However, the role of RNA m6A methylation in chicken ovaries and egg production has not been fully studied. In this study, we comprehensively analyzed the m6A transcriptome profiles of high- and low-yield Gushi chickens at 43 weeks of age (43 w). We found that m6A modification differed between the two groups. The m6A peak was positively correlated with the gene expression level, indicating that m6A may play an important role in regulating chicken egg production. In total, 9008 and 15,415 m6A peaks were separately identified in the two groups, including 2241 differential m6A peaks. In addition, seven candidate genes related to egg laying that were significantly enriched in the KEGG pathway related to ovary development and egg laying were identified. In summary, we constructed the first m6A modification map of ovarian tissue of Gushi chickens, and the differences in egg laying in 43 w Gushi chickens may originate from the effect of RNA methylation on the expression of egg-related genes. These findings provide new insights into the regulatory mechanisms of m6A methylation during egg production in Gushi chickens.
1. Introduction
With the development of animal husbandry and improvements in living standards, the demand for meat, eggs, and dairy products has increased. Owing to their excellent protein content and low prices, poultry eggs have become indispensable sources of protein in people’s lives. The Gushi chicken is an indigenous Chinese dual-purpose chicken used for both eggs and meat and has the characteristics of producing more eggs, having a large egg volume, having a thick eggshell, and being resistant to storage and transportation. However, as a local chicken breed, Gushi chickens have a relatively low egg production rate. Therefore, improving the egg production performance of Gushi chickens has become an important goal.
The ovary is the main reproductive organ of female animals and plays an important role in follicular development and hormone secretion. Previous studies have shown that the egg production performance of laying chickens is closely related to ovary and follicular development and that the development status of the follicles has a direct effect on the egg numbers of chickens [1]. Successive follicle selection is important for egg production and reproductive performance in chickens [2]. In addition, some epigenetic studies have shown that RNA N6-methyladenosine (m6A) methylation and DNA methylation regulate follicular development in chickens [3,4].
m6A is one of the most abundant and highly conserved forms of posttranscriptional modification in eukaryotes and is widely found in mRNAs, tRNAs, rRNAs, miRNAs, and lncRNAs [5]. m6A reportedly plays an active role in posttranscriptional regulation, including the regulation of mRNA stability, splicing, translation, and gene expression [6]. The m6A modification process is dynamically reversible and relies on the regulation of multiple proteins, including m6A methyltransferases (writers), demethylation enzymes (erasers), and methylation recognition proteins (readers) [7]. In addition, m6A is involved in various physiological processes in mammals. In the female reproductive system, m6A modifications regulate multiple stages of oogenesis and pathogenesis in a variety of female reproductive diseases [8]. In avian animals, such as chickens, m6A modification has a significant effect on follicle selection [4]. m6A has been identified as a key factor in the sexual maturation process of male yak testes [9] and the follicular development process of female yaks [10]. In addition, m6A modification plays a regulatory role in the development of pig testes [11]. Notably, numerous m6A-related proteins participate in the development of mouse oocytes and early embryos by regulating the conversion of material mRNAs [12]. The m6A methyltransferase METTL3 is involved in mammalian spermatogenesis and plays key roles in the m6A content of sperm RNA [13].
Previous studies on m6A have focused mostly on humans, plants, and mammals, with few reports on m6A in laying chickens. The mechanism of action of m6A remains poorly understood. With the development of high-throughput sequencing technology and the deepening of epigenetics research, researchers have constructed various animal and plant maps using methylated RNA immunoprecipitation sequencing (MeRIP-seq) technology. Therefore, to explore the dynamic changes exhibited by m6A modifications during chicken egg production and their effects on ovary development, we constructed an m6A transcriptome profile of the ovaries of 43 w high- and low-yield Gushi chickens. This study provides a theoretical reference for revealing the regulatory mechanism of m6A modification in the egg production process of Gushi chickens, which may be highly important for improving egg production performance.
2. Results
2.1. Egg Production, Ovarian Weight, and Colorimetric Results
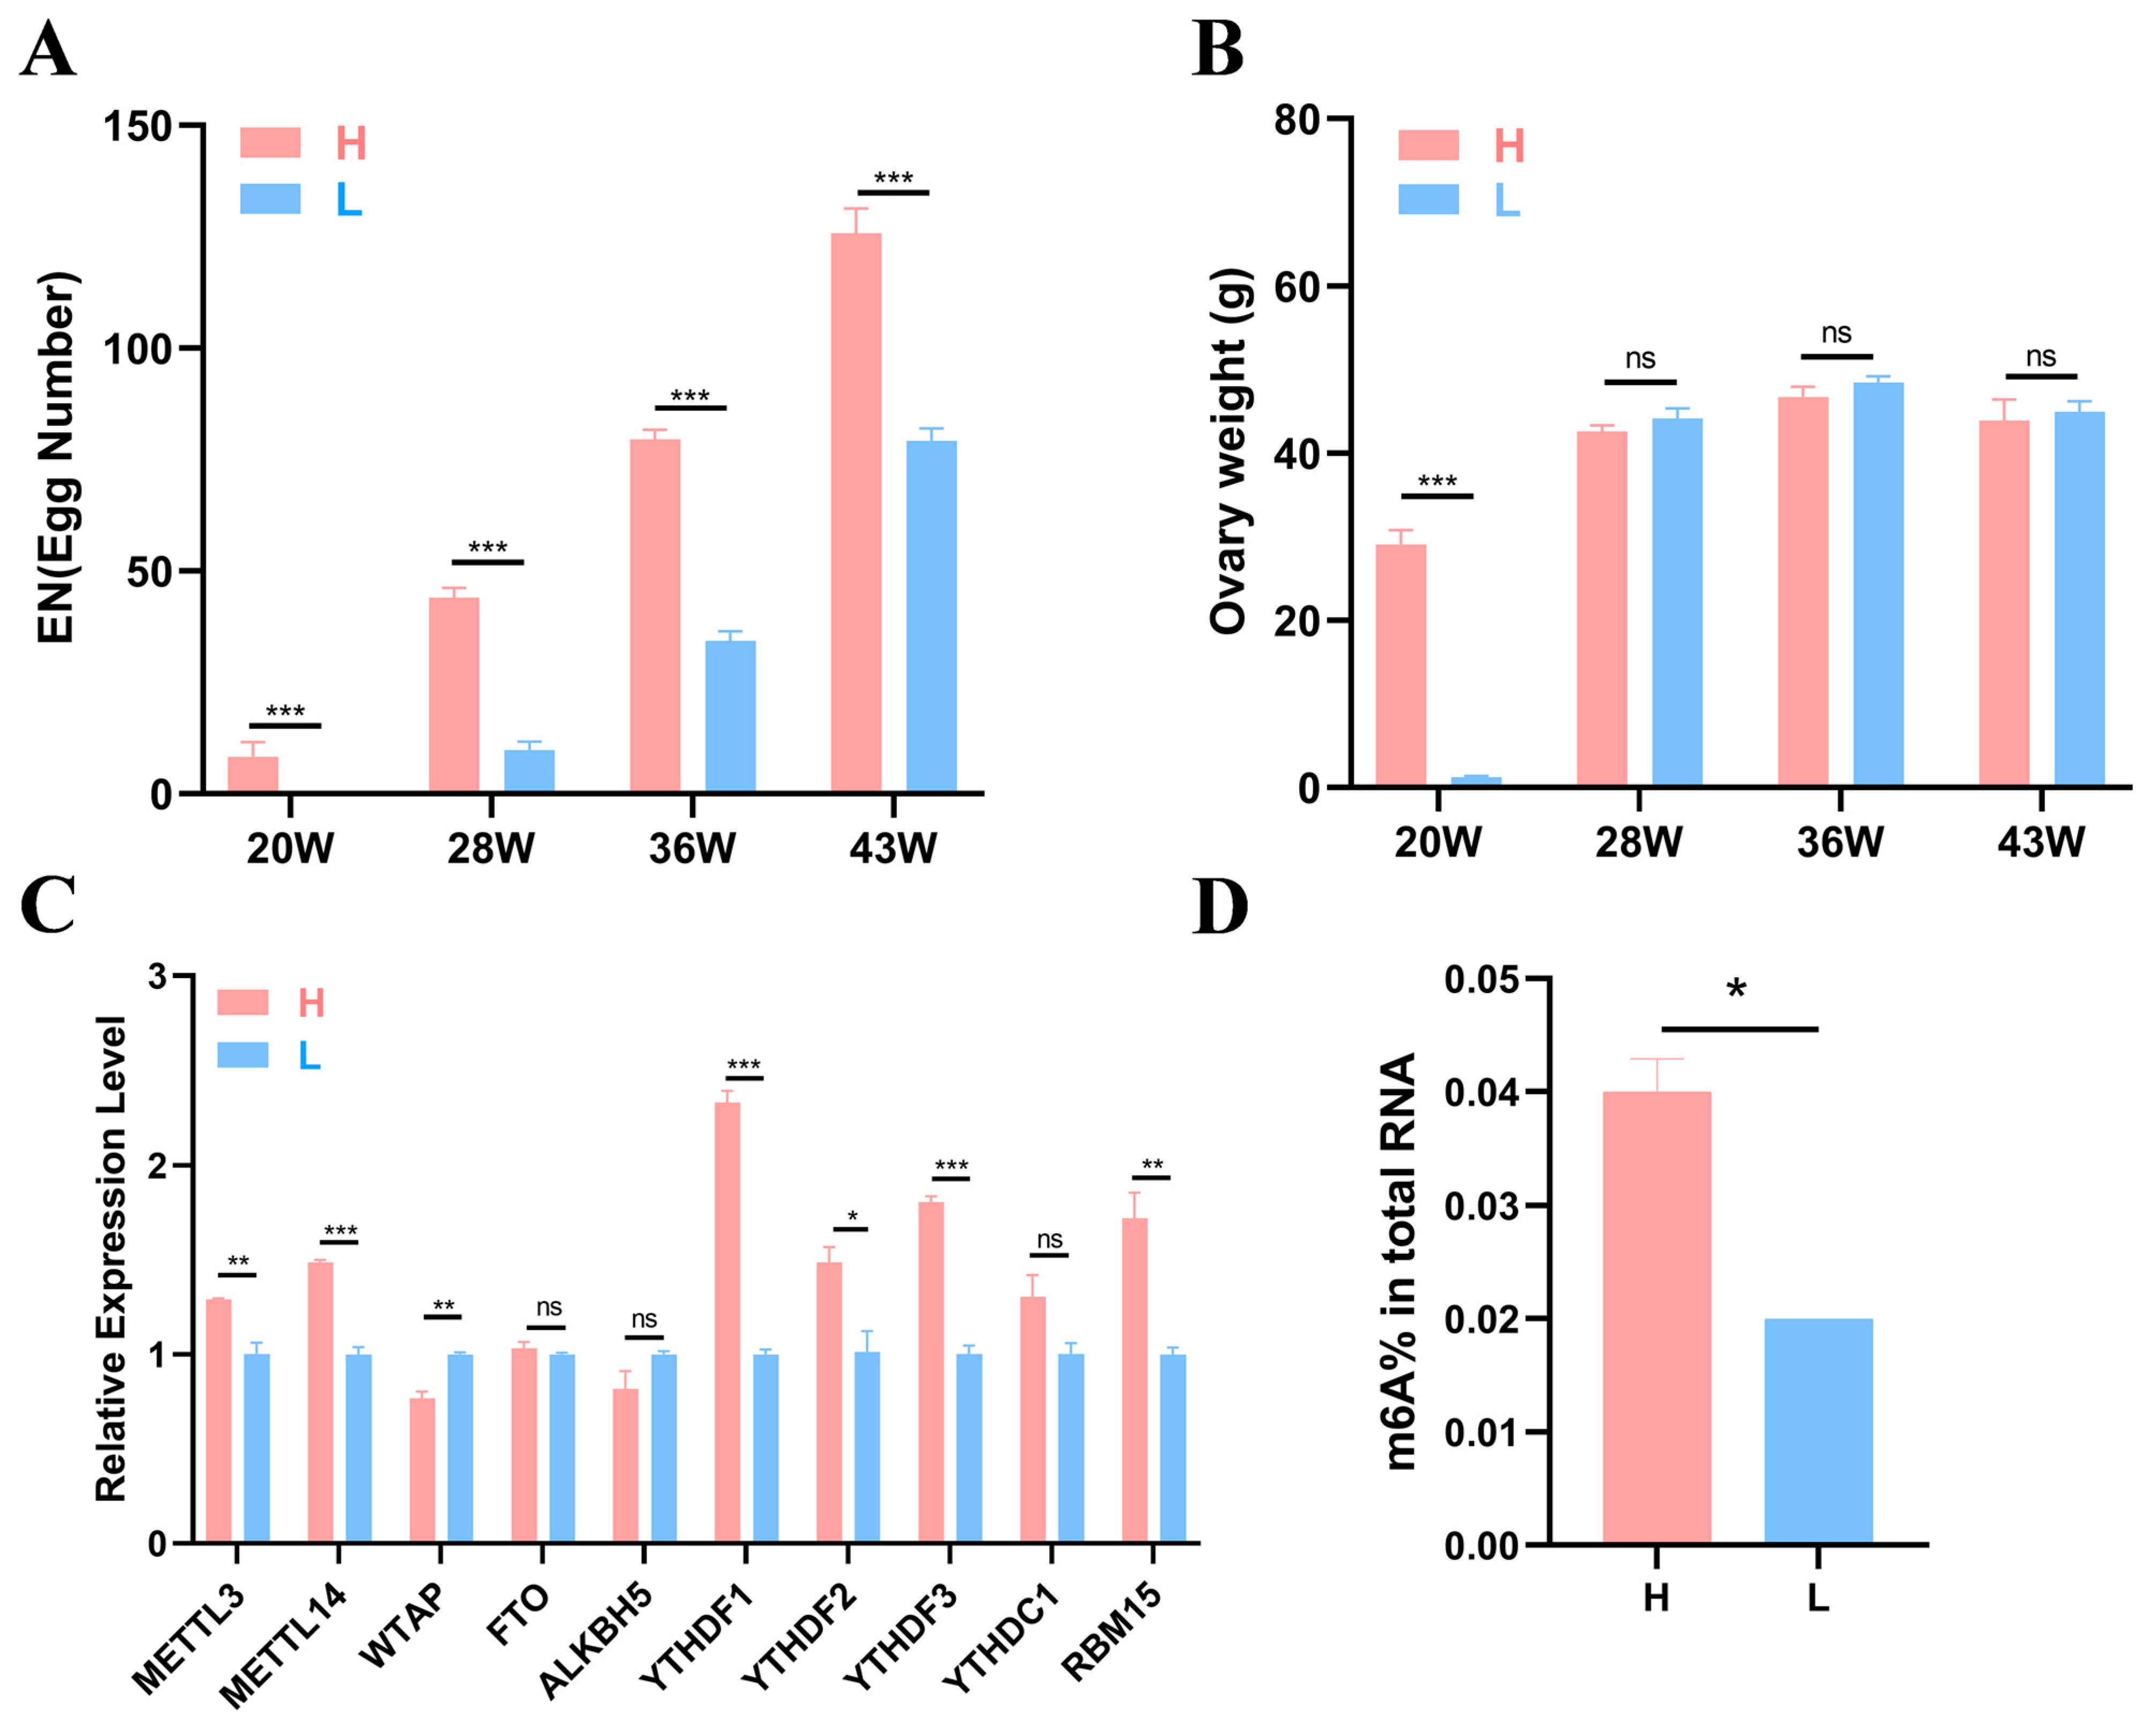
Six healthy individuals from the high-yield (H) and the low-yield (L) groups were randomly selected at each time point (20, 28, 36, and 43 weeks) for ovarian weight measurement and sample collection. Details for the egg production and ovarian weight are shown in Figure 1A,B. The results revealed that at 20, 28, 36, and 43 weeks of age, the egg number (EN) of the H group was significantly greater than that of the L group at each stage (p < 0.001), and the EN of both groups tended to increase (Figure 1A). At 20 weeks, a significant difference in ovary weight was noted between the two groups (p < 0.001), whereas no differences were observed at other stages (Figure 1B).

Figure 1.
Production data and experimental results. (A,B) Statistical results of egg number and ovary weight of high- and low-yield Gushi chickens at 20, 28, 36, and 43 weeks of age (n = 6). (C) Gene expression levels of 10 common m6A methylases in the H and L groups of 43-week-old Gushi hens. (D) The significance of the differences between the egg numbers and ovary weights of the H group and L group was determined using Student’s t test (* p < 0.05; ** p < 0.01; *** p < 0.001, ns p > 0.05).
To further investigate whether m6A modification can affect egg production in Gushi chickens, we detected the expression levels of 10 m6A enzymes corresponding genes (METTL3, METTL14, WTAP, FTO, ALKBH5, YTHDF1-3, YTHDC1, and RBM15) in the ovarian tissues of two groups of Gushi chickens at 43 w using quantitative real-time PCR (qRT–PCR). The results revealed that the YTHDF2 expression level in group H was significantly greater than that in group L (p < 0.05). WTAP expression levels in group L were significantly greater than those in group H (p < 0.01, Figure 1C), and METTL3 and RBM15 expression levels in group H were also significantly greater than those in group L (p < 0.01). Differences in METTL14, YTHDF1, and YTHDF3 expression levels were noted between the H and L groups (p < 0.001). The test results revealed significant differences in the expression of these methylases between the different groups. To verify whether there was a m6A modification difference between the two groups, we conducted colorimetric experiments. The results revealed a significant difference between groups L and H, with group H having a greater degree of methylation compared with group L (p < 0.05, Figure 1D).
2.2. Sequencing Quality Control and Reference Genome Alignment
We selected three chickens from each of the 43-week-old Gushi chickens in the H and L groups and performed MeRIP sequencing on the ovarian tissues. The unqualified sequences in the raw data were screened using Fastp to obtain clean data. Clean data were analyzed using MeRIP-seq and RNA sequencing (RNA-seq) to obtain the m6A transcriptome profile of the ovary tissue of the 43-week-old Gushi chickens. The MeRIP-seq process is shown in Figure 2A. The percentages of valid data in each group of samples based on mass ≥ 20 (sequencing error rate less than 0.01), mass ≥ 30 (sequencing error rate less than 0.001), and GC content are shown in Supplementary Table S1. The immunoprecipitation (IP) samples from the ovaries of the chickens in the L and H groups were recorded as L_IP and H_IP, respectively. In the RNA-seq library, these samples are recorded as L_input and H_input. Supplementary Table S2 shows the unique mapped reads. MeRIP-seq of the L and H groups generated averages of 57,339,748 and 60,948,454 raw reads and 56,399,912 and 59,904,270 pure reads, respectively. The percentage of effective reads exceeded 98%. We calculated the distribution of reads in the reference genome and categorized the reads into exon, intron, and intergenic regions, as shown in Supplementary Figure S1. Most of the reads were mapped to exon regions.
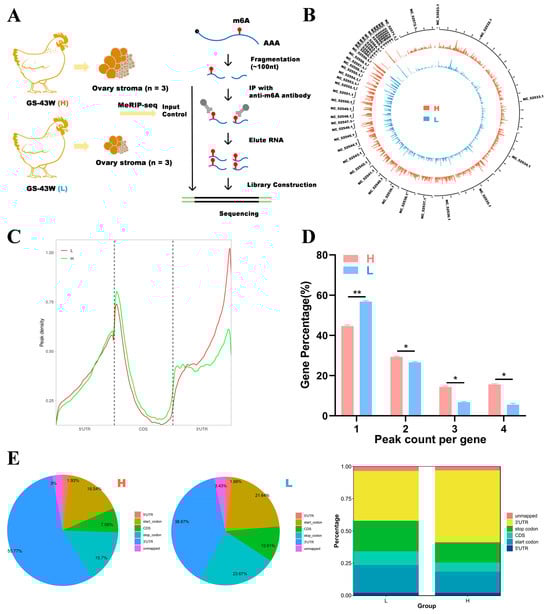
Figure 2.
Research on m6A modification profiles in the ovaries of Gushi chickens. (A) Ovary tissue was collected from 43-week-old Gushi chickens in group H (n = 3) and group L (n = 3) for MeRIP-seq. (B) The distribution of m6A peak sites in the Gallus gallus (chicken) genome was obtained from two different samples. The outermost circles represent the distribution of chromosomes in the genome, with red circles representing group H and blue circles representing group L. (C) Density distribution of the m6A peaks in H and L transcripts in the different gene structures. (D) Statistical graph of the peak numbers of genes in the L and H groups. The difference between the peak numbers of genes in the L and H groups was detected using Student’s t test (* p < 0.05; ** p < 0.01;). (E) Distribution of m6A peaks in the L and H groups.
2.3. Analysis of m6A Modifications in the Transcriptome
As shown in Figure 2B, the distributions of m6A modification sites in the chicken genome were generally consistent between the two groups. As shown in Figure 2C, the density distributions of the m6A peaks were similar across all the groups, but the specific distributions were not the same. To understand the extent of m6A modification in differentially methylated genes (DMGs), we analyzed the distribution of m6A peaks in each gene and found that almost half of the genes in the two groups presented only one m6A modification peak and that most genes presented 1–3 m6A peaks (Figure 2D). To investigate the importance of m6A in transcripts, the distribution of m6A peaks in mRNAs was explored in conjunction with the chicken reference genome. The transcripts were categorized into 5′ untranslated regions (5′ UTRs) near the start codon, 3′ untranslated regions (3′ UTRs) near the stop codon, and coding DNA sequence (CDS) regions. As shown in Figure 2E, the m6A peaks in the H group were enriched mainly in 3′ UTRs, followed by start codons, stop codons, CDS regions and 5′ UTRs. In the L group, the m6A peaks were enriched in 3′ UTRs, followed by stop codons, start codons, CDS regions and 5′ UTRs. In addition, more m6A peaks were found in 3′ UTRs in the H group compared with the L group. The L group presented more m6A peaks enriched at start and stop codons compared with the H group.
2.4. Analysis of Differentially Methylated Genes
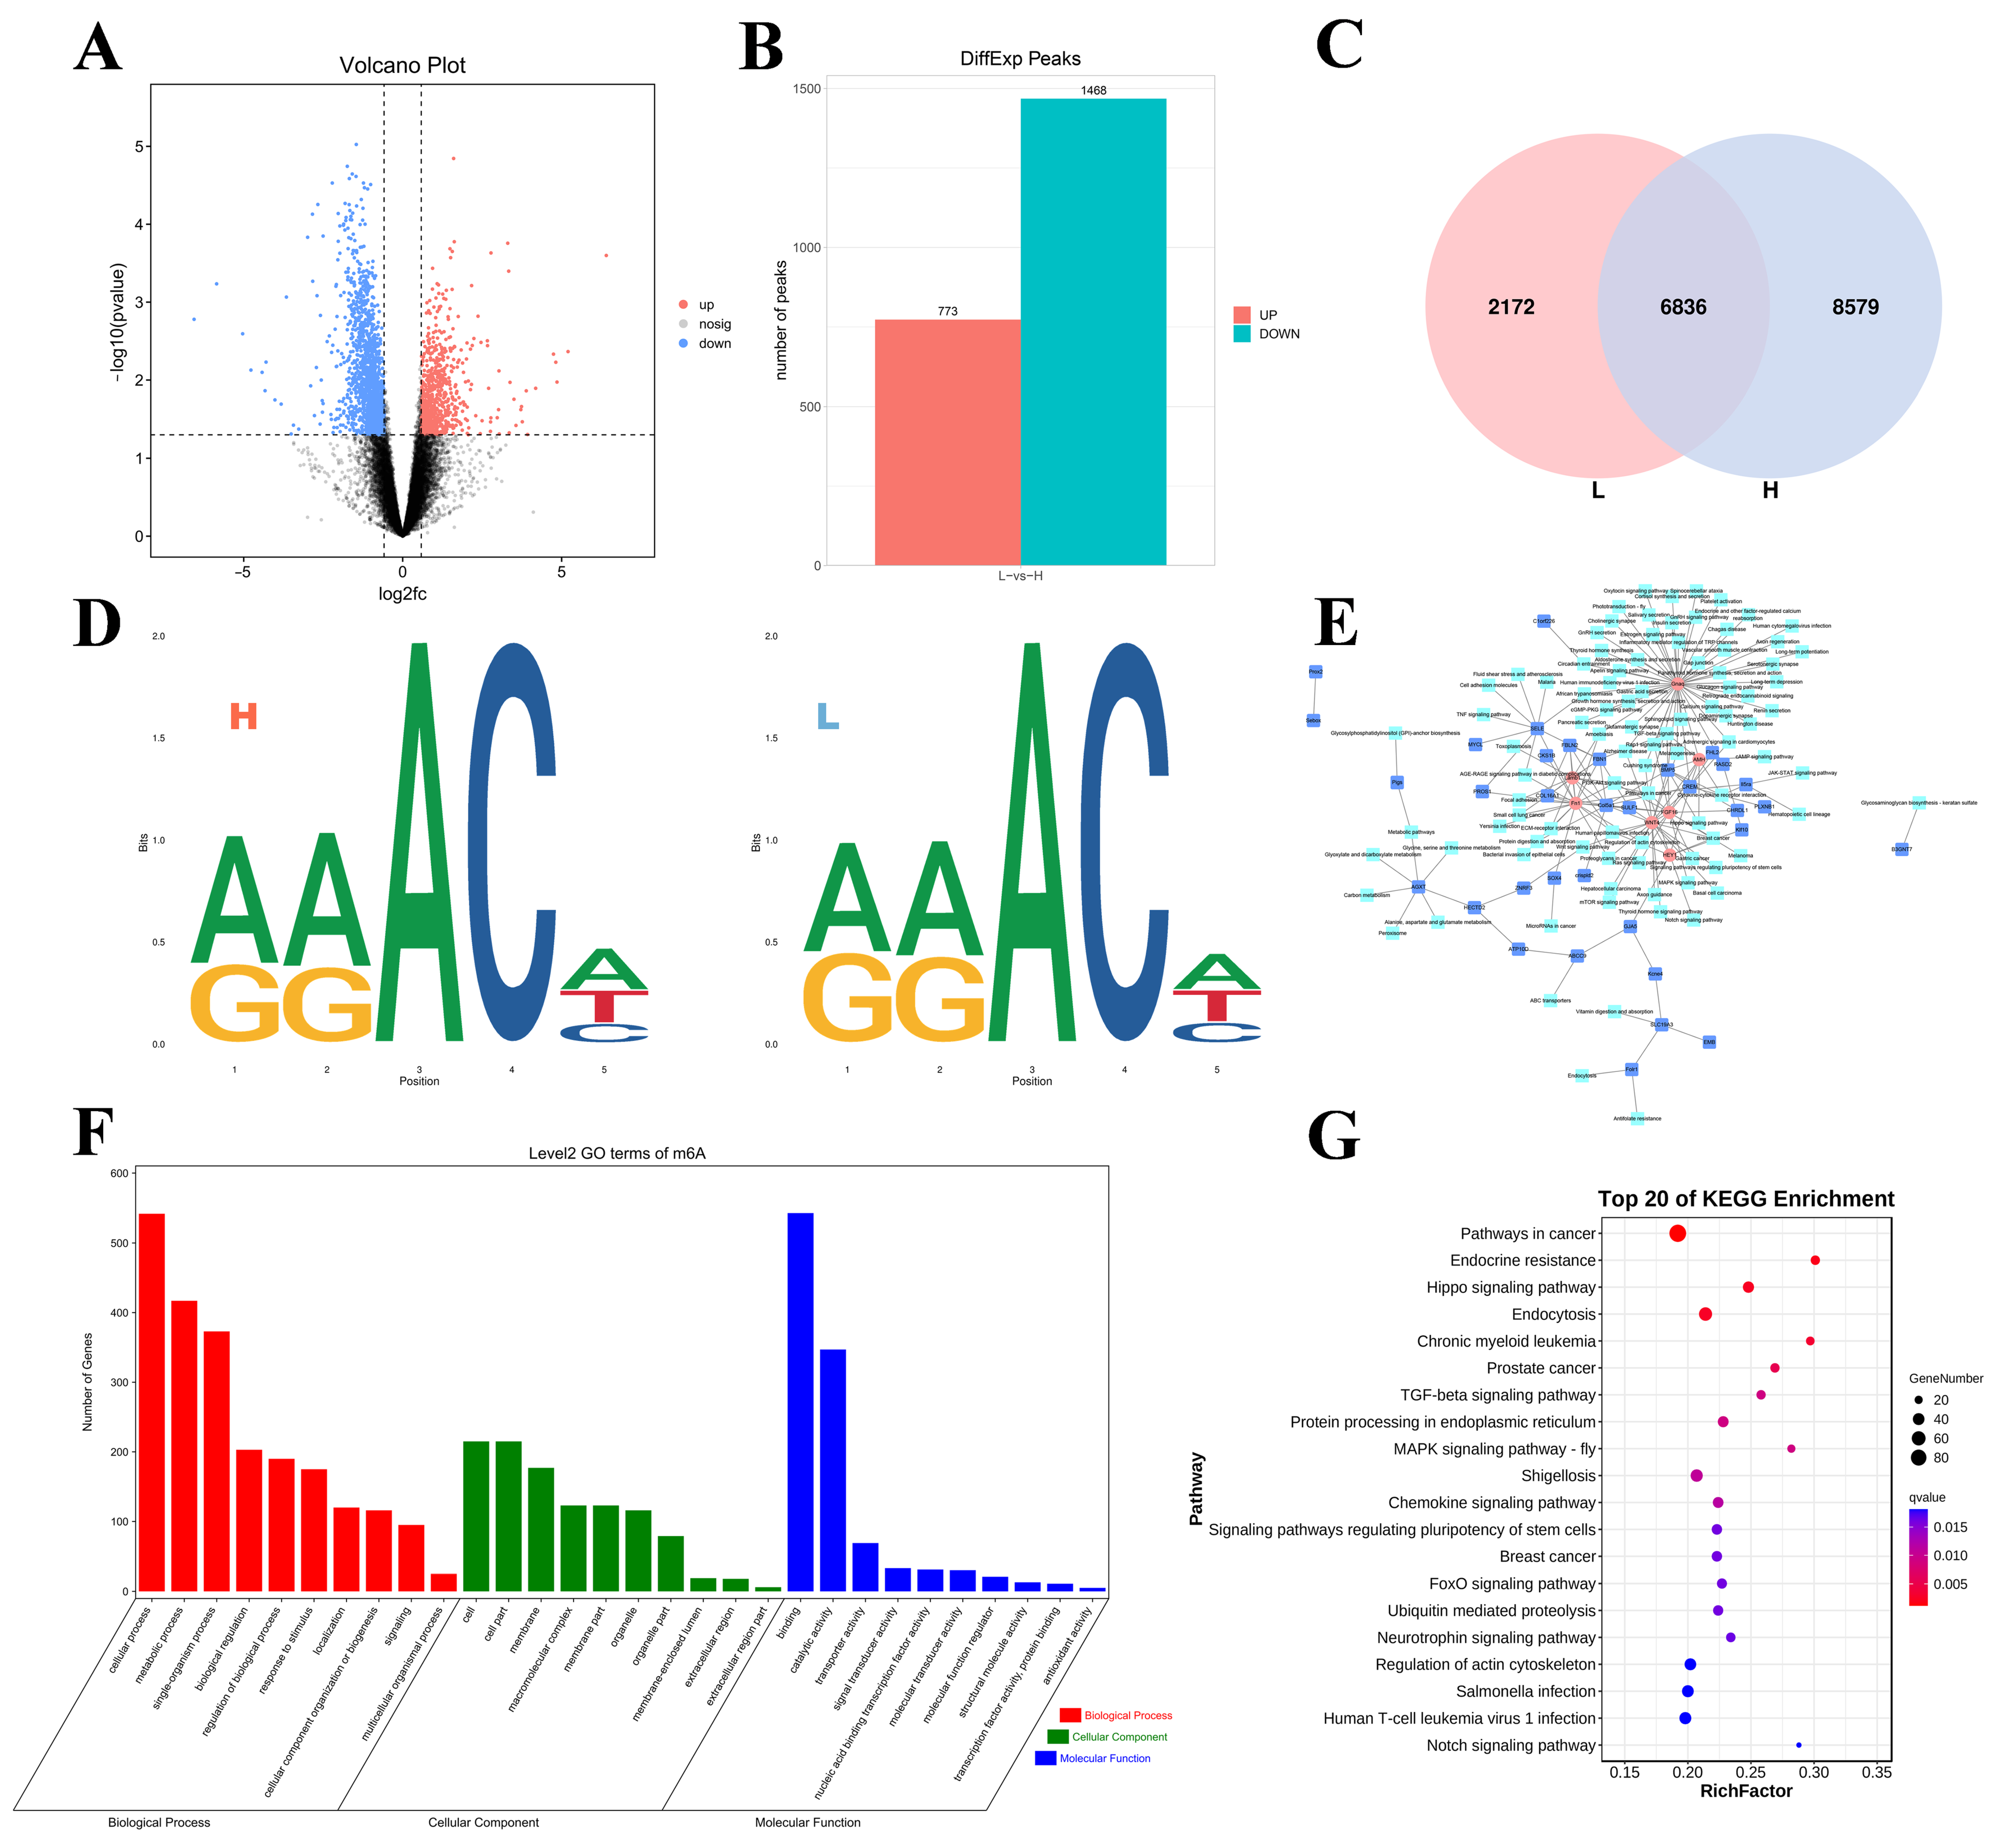
The volcano diagram shows the overall distribution of differentially methylated peaks (DMPs; Figure 3A). Specifically, 2241 DMPs in 2068 DMGs were identified in the H group relative to the L group. A total of 773 peaks presented increased expression levels (corresponding to 786 genes with upregulated m6A levels), and 1468 peaks presented decreased expression levels (corresponding to 1372 genes with downregulated m6A levels), as shown in Figure 3B. In addition, we detected 8579 specific m6A peaks in the H group and 2172 specific peaks in the L group (Figure 3C), reflecting the significant differences in m6A modifications between the groups. We performed motif prediction using samples from both groups, as shown in Figure 3D. Seven genes were screened using gene network mapping. These genes included WNT4, FN1, FGF16, CRISPLD2, AMH, HEY1, and GNAQ (Figure 3E).
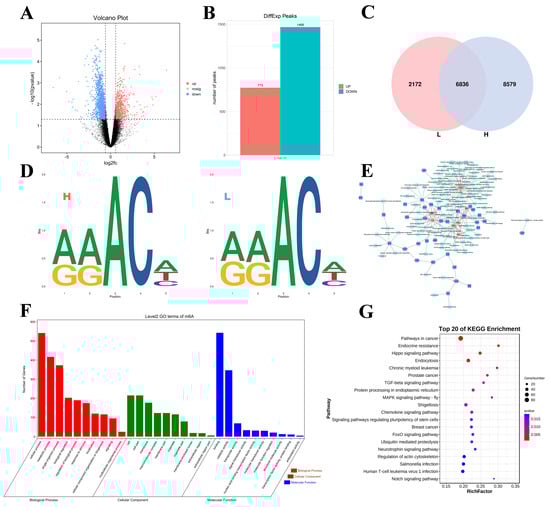
Figure 3.
Overview of the differential methylation peaks in the L vs. H comparison groups. (A) Volcano plot of the DMG expression results (the dotted line signifies the threshold for statistical significance). (B) Number of up- and downregulated DMPs. (C) The number of common and specific m6A peaks in the L and H groups. (D) The motif sequence “RRACH” was identified in the L and H. (E) Pathways and co-differential genes network diagram. (F,G) GO enrichment terms and KEGG analysis of DMGs.
In addition, GO and KEGG enrichment analyses of all the DMGs were performed to explore the important roles of m6A modifications in egg production. The GO analysis revealed that all the DMGs were involved in cellular processes, metabolic processes, and single organism processes (ontology: biological processes); cell, cell part, and cell mem-brane processes (ontology: cellular components); and binding, catalytic activity, and transporter activity (ontology: molecular function) (Figure 3F). KEGG enrichment analysis revealed that the DMGs were associated with pathways associated with cancer, the MAPK signaling pathway-fly, the FoxO signaling pathway, and the Notch signaling pathway (Figure 3G).
2.5. RNA-Seq Identification of Differentially Expressed Genes
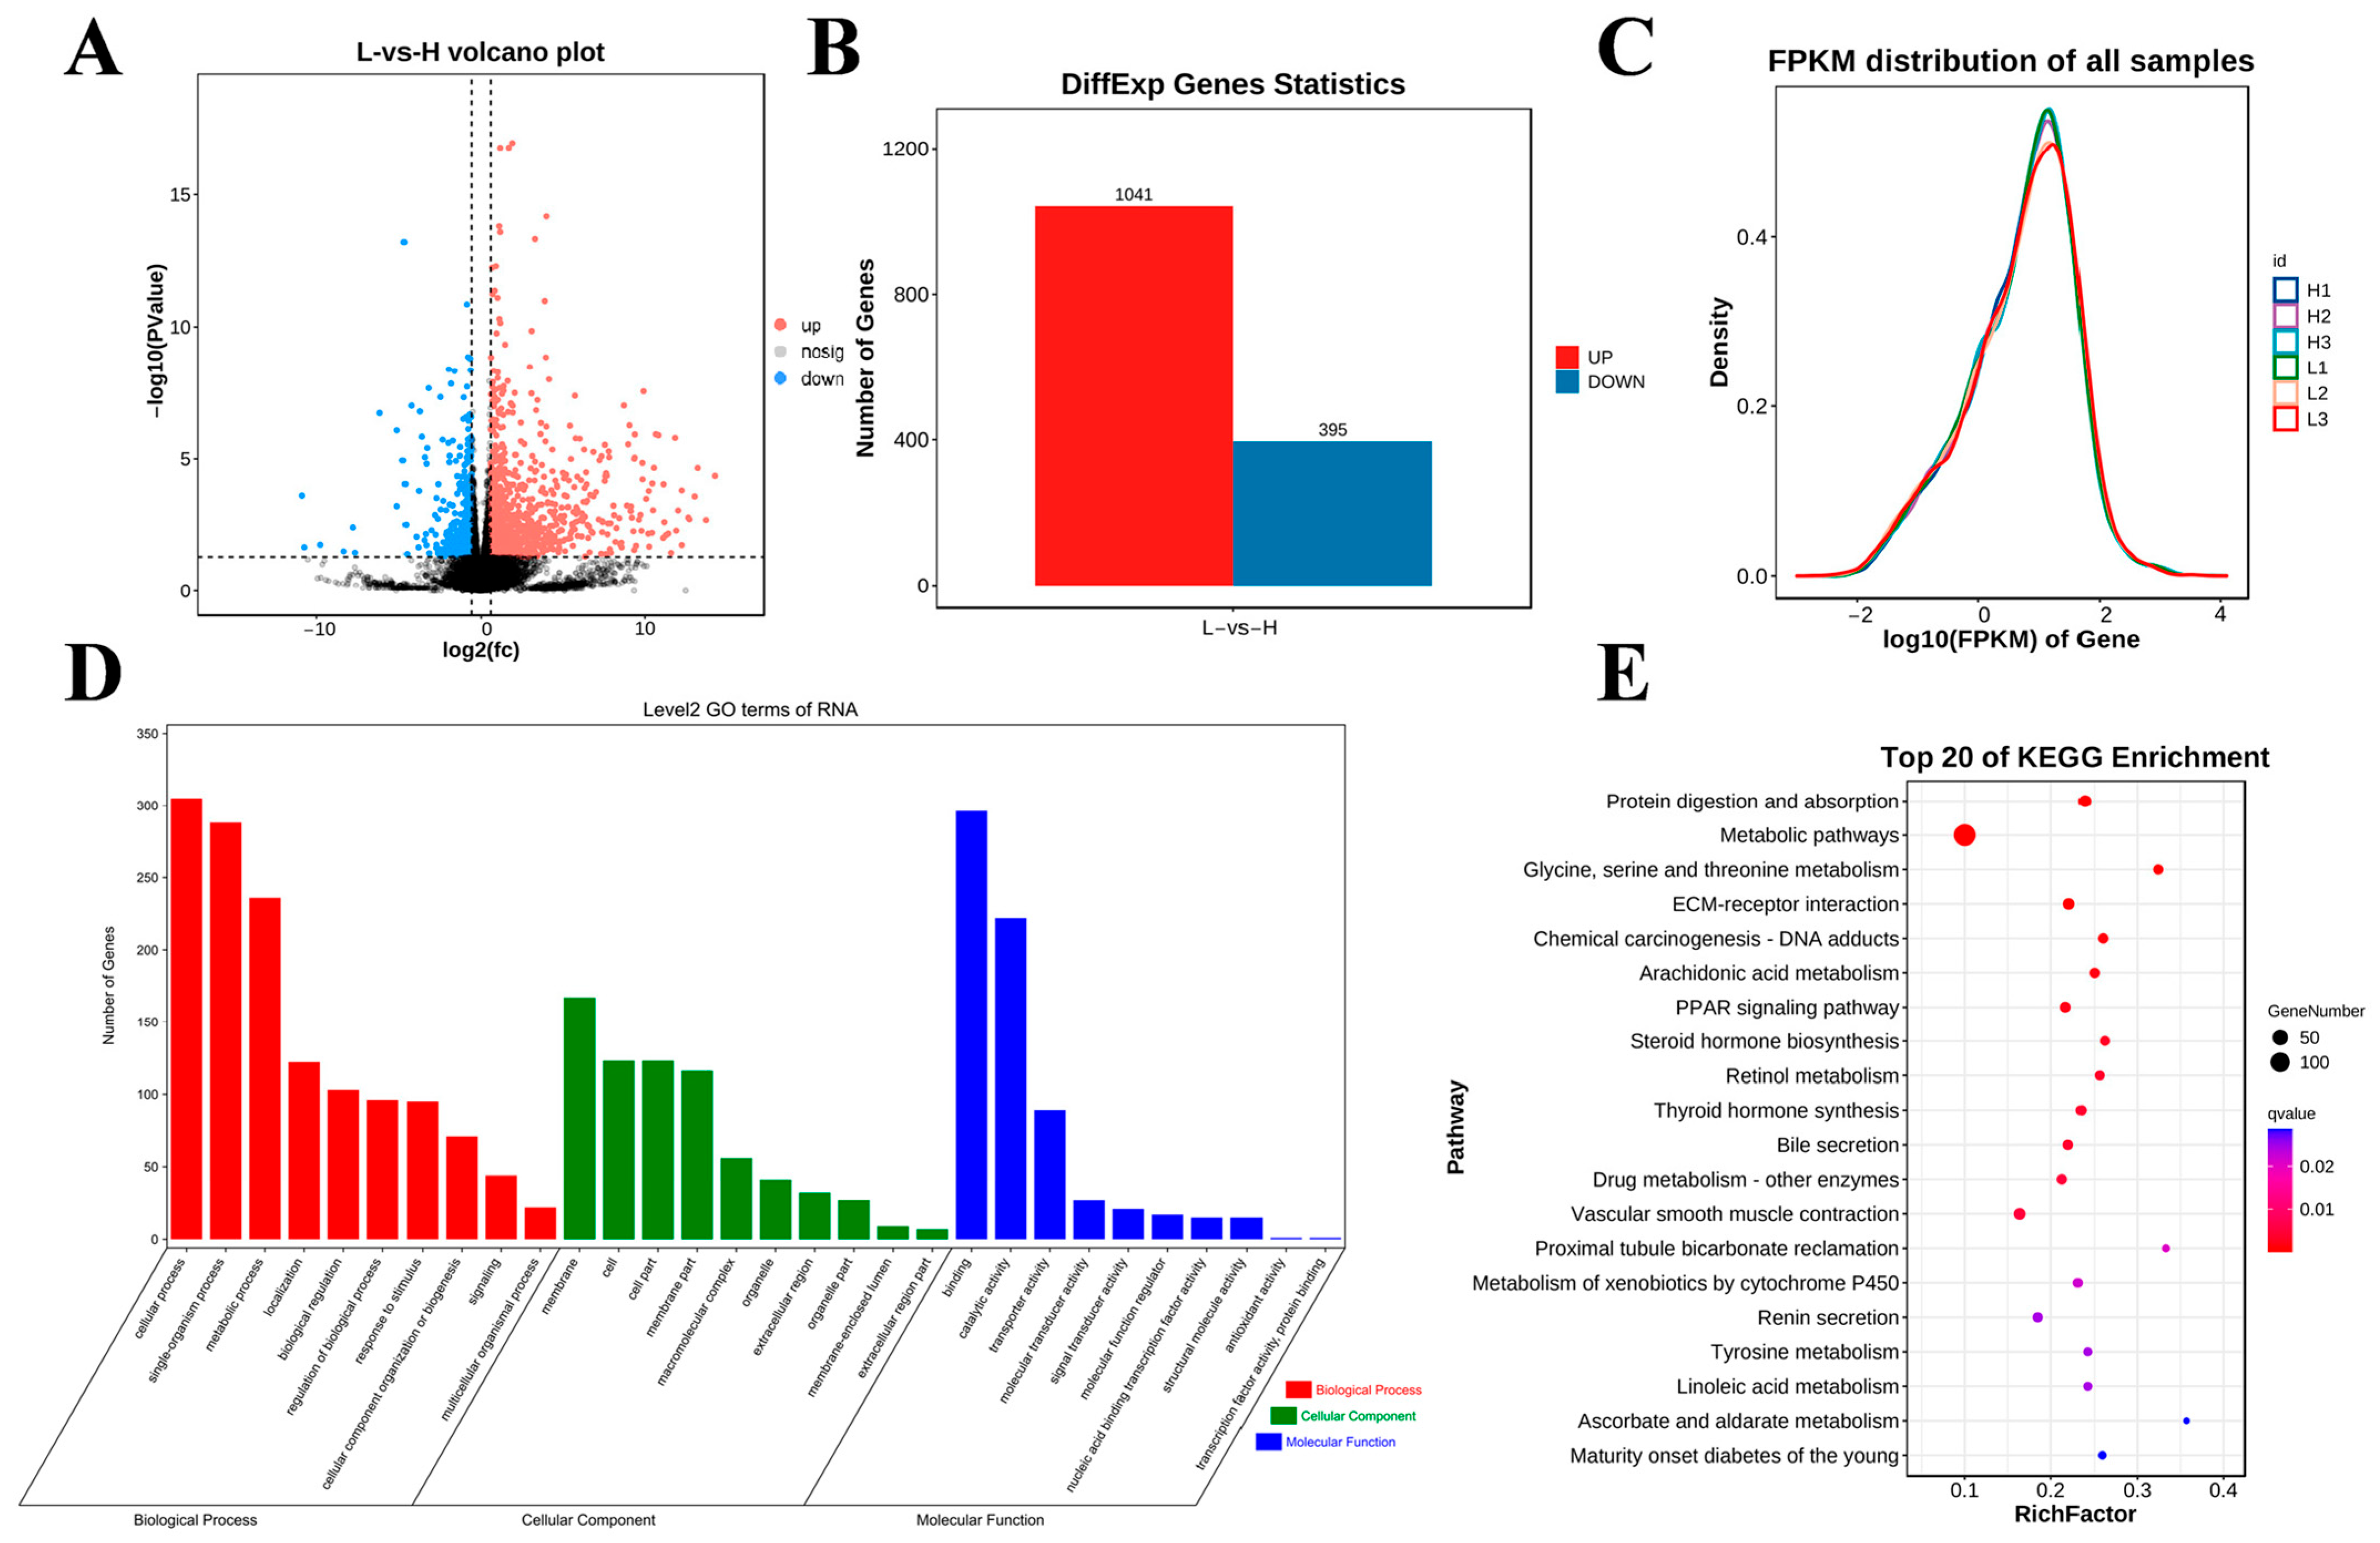
These samples were also analyzed using RNA-seq, and the generated volcano dia-gram shows the general distribution of the differentially expressed genes (DEGs; Figure 4A). In this study, a total of 19,902 genes were identified in the two groups, and 1436 genes were differentially expressed in the H group compared with the L group (1041 upregulated genes and 395 downregulated genes; p < 0.05 and |fold change (FC)| > 1.5; Figure 4B). The gene expression abundance and density data are shown in Figure 4C. To further reveal the functions of the DEGs, we conducted GO and KEGG enrichment analyses. The results from the GO enrichment analysis of the DEGs are shown in Figure 4D. Among the biological processes, the DEGs were enriched mainly in cellular processes, single organism processes, metabolic processes, biological regulation, and regulation of biological processes. In the cellular component category, the DEGs were significantly correlated mainly with membrane, cell, cell part, and membrane part. In the molecular function category, the DEGs were involved mainly in binding activity, catalytic activity, and transporter activity. The KEGG enrichment analysis revealed that the DEGs were significantly enriched in protein digestion and absorption, the PPAR signaling pathway, thyroid hormone synthesis, and steroid hormone biosynthesis (Figure 4E).
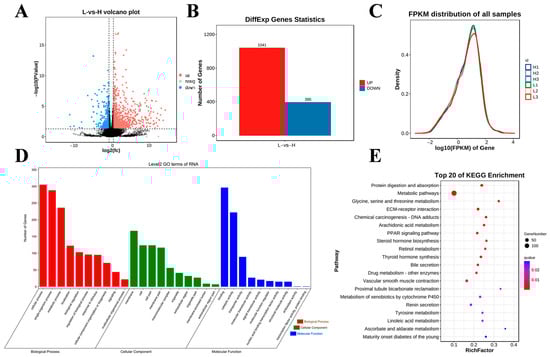
Figure 4.
Differential expression analysis of RNA-seq data among the studied groups. (A) Volcano diagram of DEG expression data (the dotted line signifies the threshold for statistical significance). (B) Number of up- and downregulated DEGs. (C) Gene expression abundance distribution map. (D,E) GO enrichment terms and KEGG analysis of DEGs.
2.6. Joint Analysis of MeRIP-Seq and RNA-Seq Data
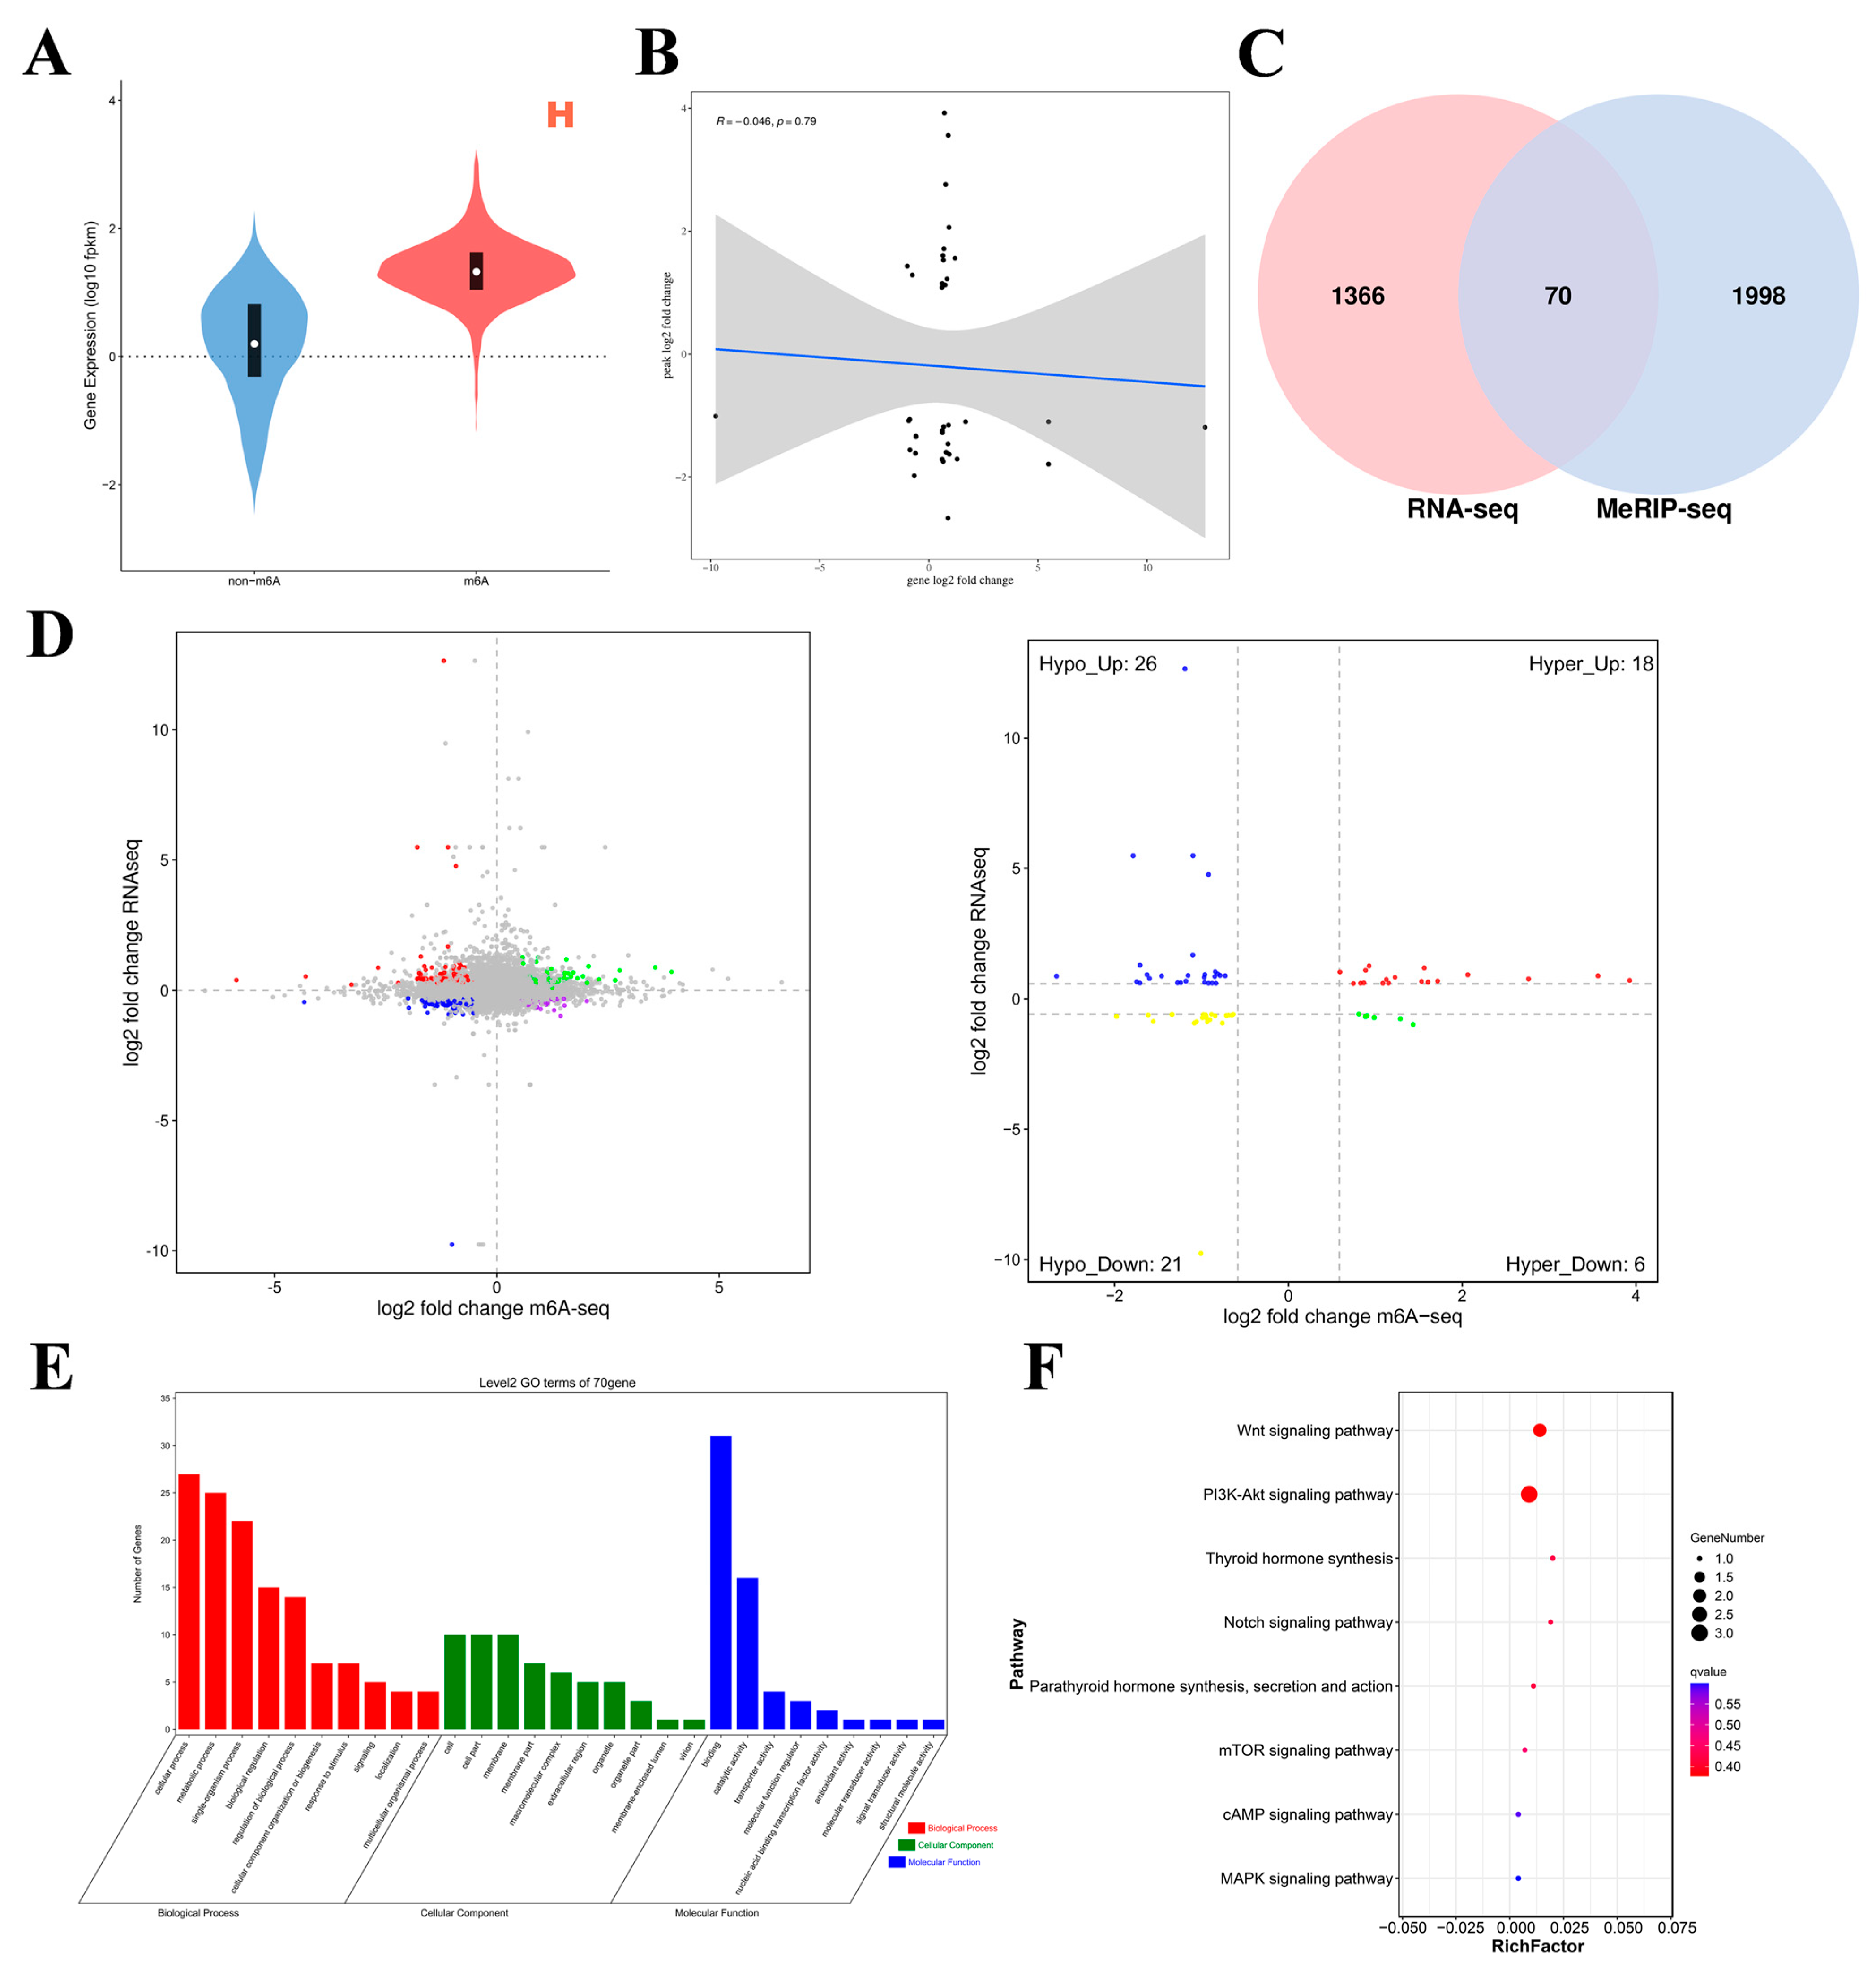
To investigate the relationship between m6A modification and gene expression, we conducted MeRIP-seq and RNA-seq association analyses. For each group of samples, genes were categorized according to the presence or absence of m6A modifications, and the corresponding gene expression trend within the group was observed to analyze the effect of m6A modifications on gene expression. Figure 5A shows that the overall expression level of mRNAs with m6A modifications in Group H was greater than that of mRNAs without m6A modifications, and the same finding was true for Group L (Supplementary Figure S2). Therefore, m6A potentially positively regulates mRNA expression. To analyze the relationship between expression levels and peak enrichment, we generated a scatter plot of gene expression levels and peak enrichment. As shown in Figure 5B, genes with relatively high expression levels presented relatively low peak enrichment. Therefore, we preliminarily concluded that a negative correlation exists between m6A methylation levels and gene expression levels. The generated four-quadrant diagram and Venn diagram (Figure 5C,D) revealed a total of 70 DMGs in the L group relative to the H group, including 24 hypermethylated DMGs (18 upregulated mRNAs and 6 downregulated mRNAs) and 47 hypomethylated DMGs (26 upregulated mRNAs and 21 downregulated mRNAs). In the left panel of Figure 5D, each point represents a gene. Green points indicate genes where both m6A peak and mRNA expression are consistently upregulated. Red points represent genes where mRNA expression is upregulated while the m6A peak expression is downregulated. Blue points indicate genes where both m6A peak and mRNA expression are consistently downregulated. Purple points represent genes where mRNA expression is downregulated while the m6A peak expression is upregulated. Gray points indicate genes with no significant difference between groups (transcriptome FDR > 0.05 and m6A p-value > 0.05). The right panel of Figure 5D is similar to the left panel but with different coloring, as explained for the left panel.
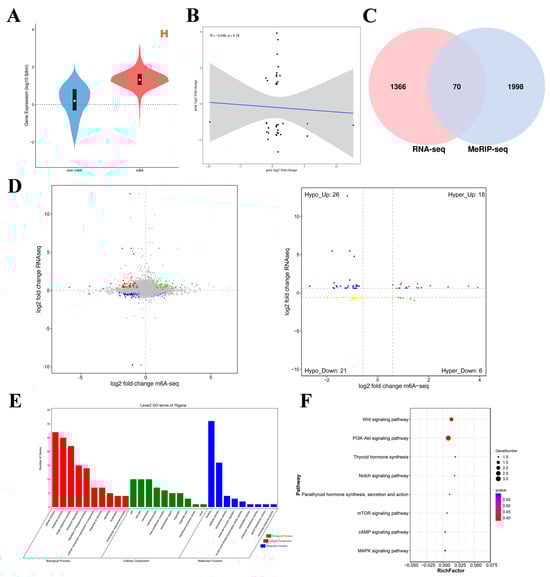
Figure 5.
Joint analyses of m6A-seq and RNA-seq data. (A) Violin plot of expression with/without m6A-modified genes. (B) Scatter plot of gene expression levels and peak enrichment multiples (the gray area represents the confidence interval. Specifically, it represents the uncertainty range of regression line estimation). (C) Wayne map of shared differentially expressed genes. (D) L vs. H quadrant diagram (the dotted line signifies the threshold for statistical significance; the four colors signify four distinct scenarios: mRNA exhibiting concurrent upregulation or downregulation with the m6A group, or alternatively, one group demonstrating upregulation while the other shows downregulation). (E,F) GO enrichment terms and KEGG analysis of co-differentially expressed genes (intersecting genes of DMGs and DEGs).
GO analysis of the co-differentially expressed genes was performed (Figure 5E). In terms of molecular function, these genes were significantly correlated with binding activity, catalytic activity, and transporter activity. In terms of biological processes, these genes significantly participated in cellular processes, metabolic processes, single organism processes, biological regulation, and regulation of biological processes. In the cell component category, these genes were related mainly to cell parts, modules, and cells. KEGG enrichment analysis results (Figure 5F) revealed that these genes were significantly enriched in the PI3K–Akt signaling pathway; thyroid hormone synthesis; the Notch signaling pathway; parathyroid hormone synthesis, secretion, and action; the mTOR signaling pathway; the cAMP signaling pathway; and the MAPK signaling pathway. These significantly enriched pathways are related to ovary hormone secretion and follicular development. These results indicate that m6A modification is involved in various physiological activities of the ovaries during egg production in Gushi chickens.
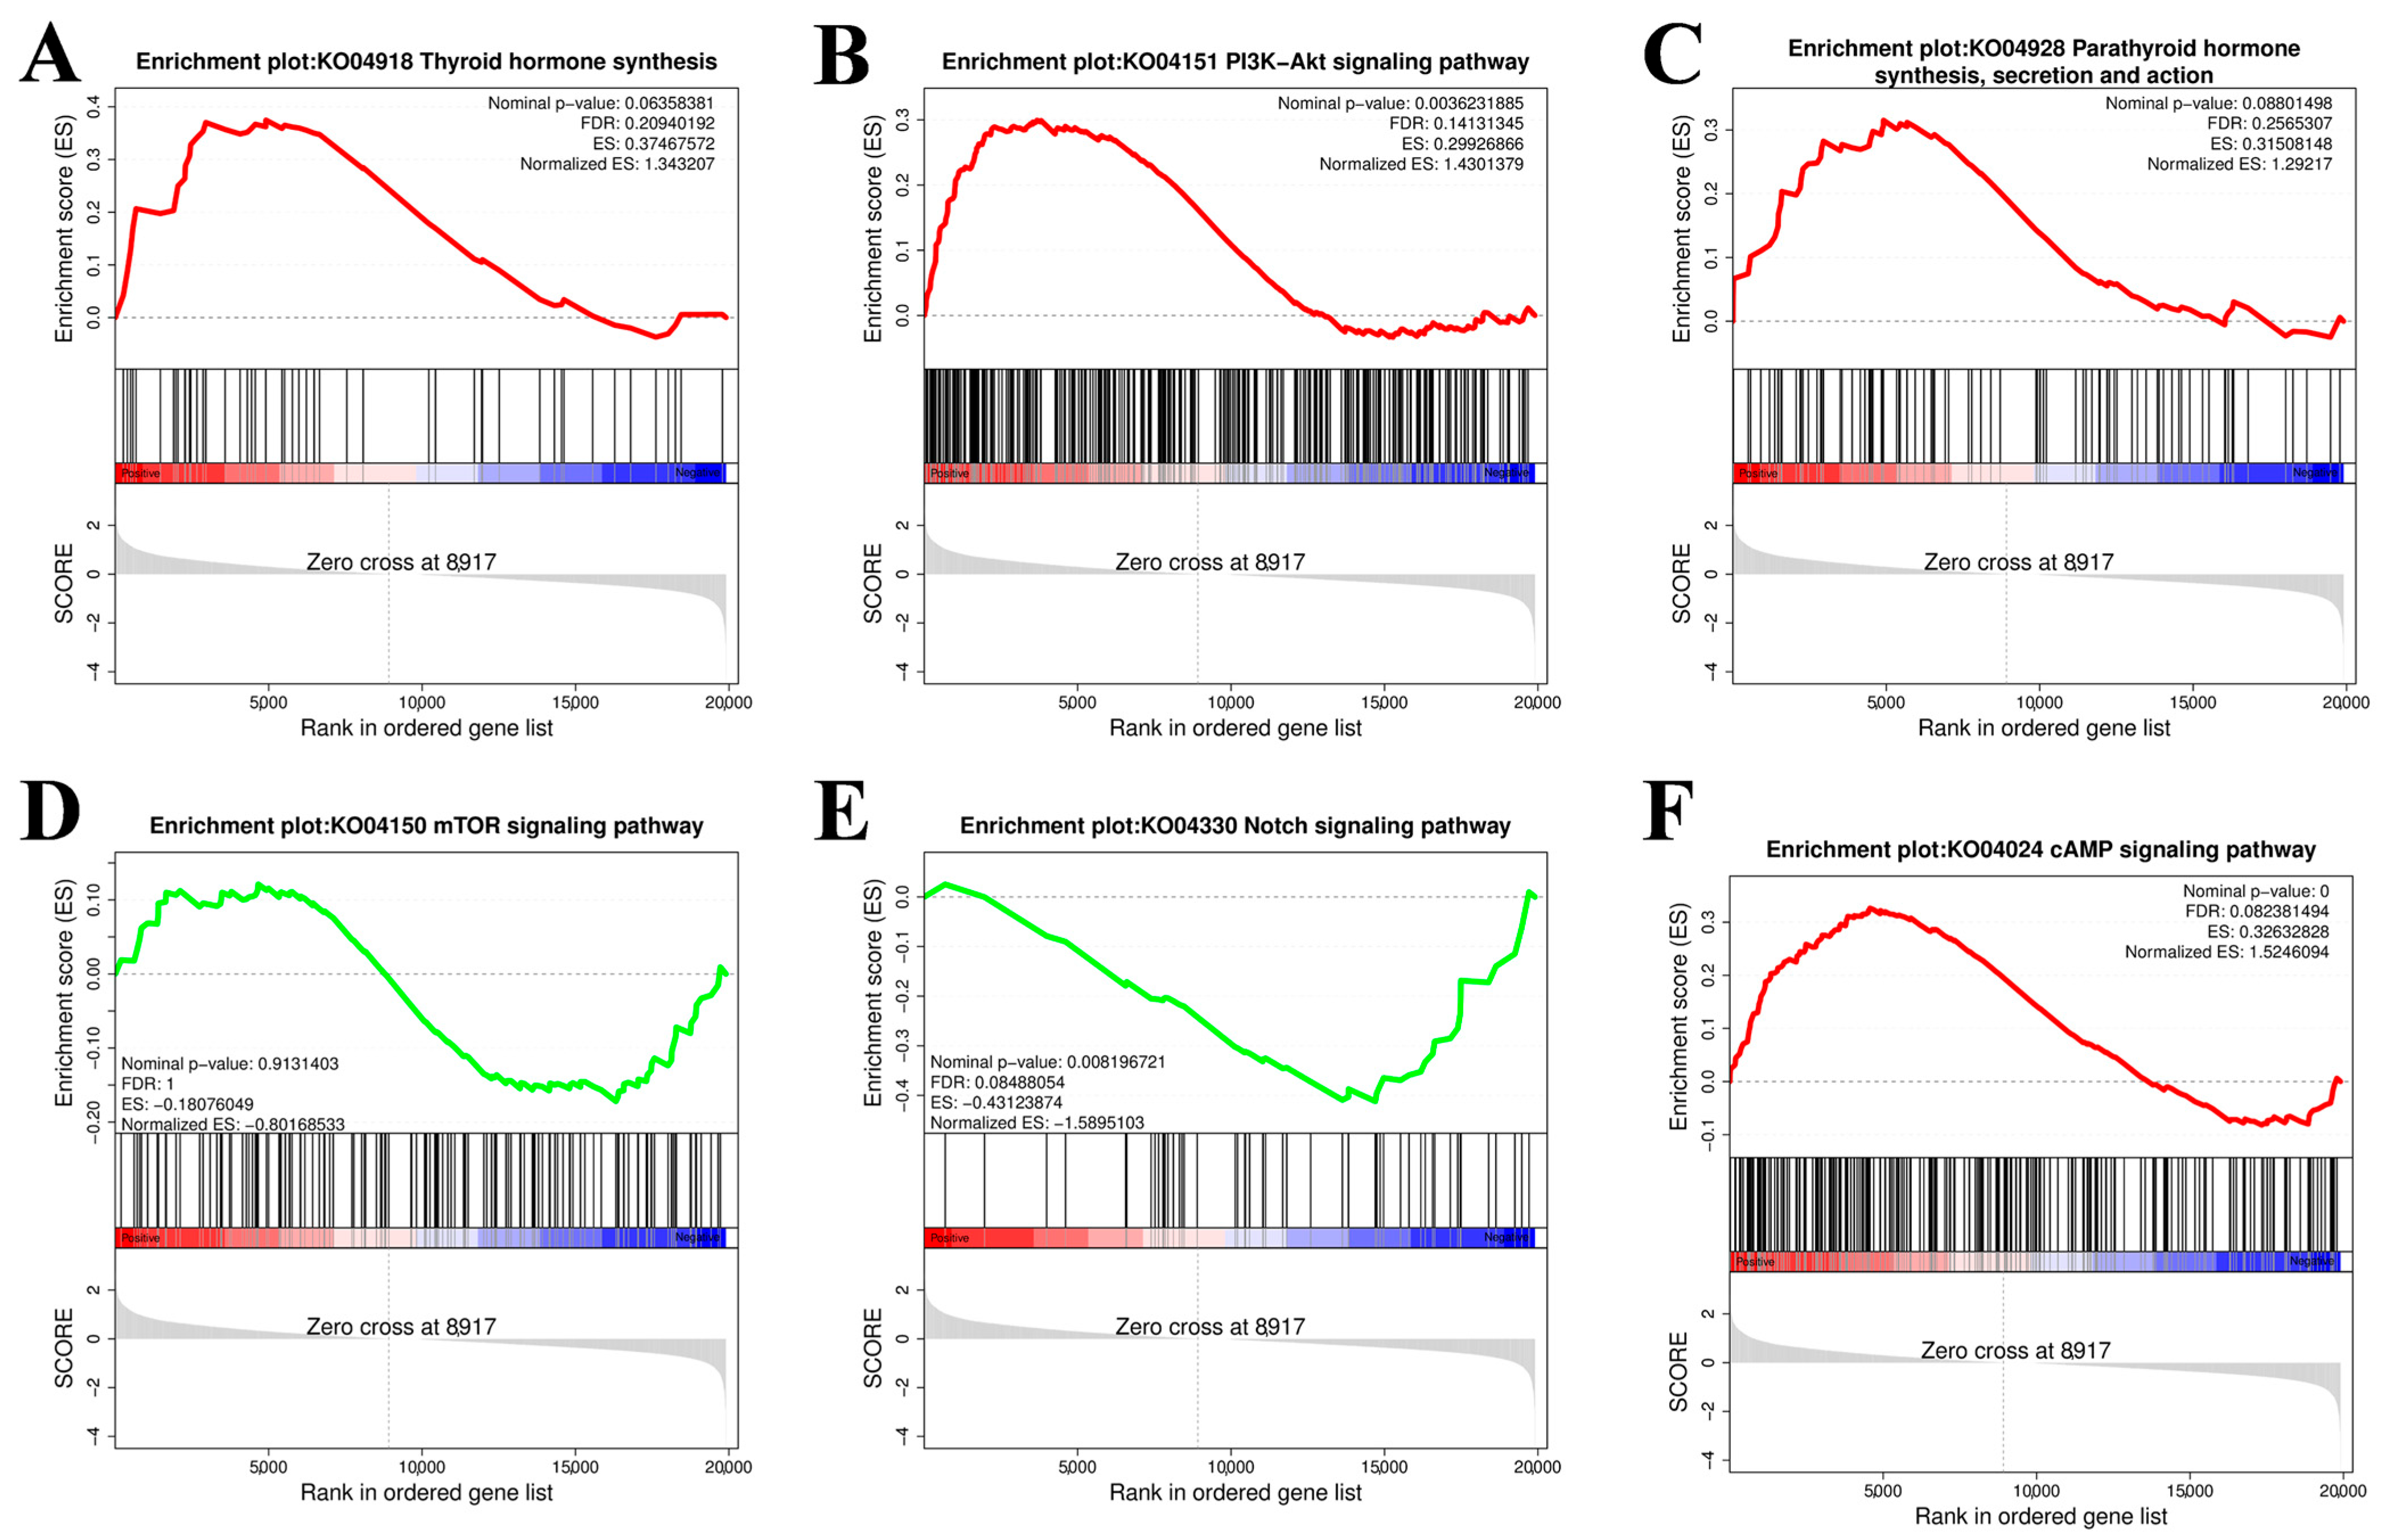
The gene set enrichment analysis (GSEA) results were consistent with the abovementioned KEGG enrichment results for the PI3K–Akt signaling pathway, thyroid hormone synthesis pathway, Notch signaling pathway, parathyroid hormone synthesis, secretion and action, mTOR signaling pathway, cAMP signaling pathway, and MAPK signaling pathway (Figure 6).

Figure 6.
Gene set enrichment analysis (GSEA). (A) Thyroid hormone synthesis. (B) PI3K-Akt signaling pathway. (C) Parathyroid hormone synthesis. (D) mTOR signaling pathway. (E) Notch signaling pathway. (F) cAMP signaling pathway. The gray area in the figure represents a point in the gene list where the Enrichment Score (ES) crosses a zero value. The dashed line usually represents the Zero cross point of the enrichment score.
2.7. Results of MeRIP-qPCR and qRT–PCR Experiments
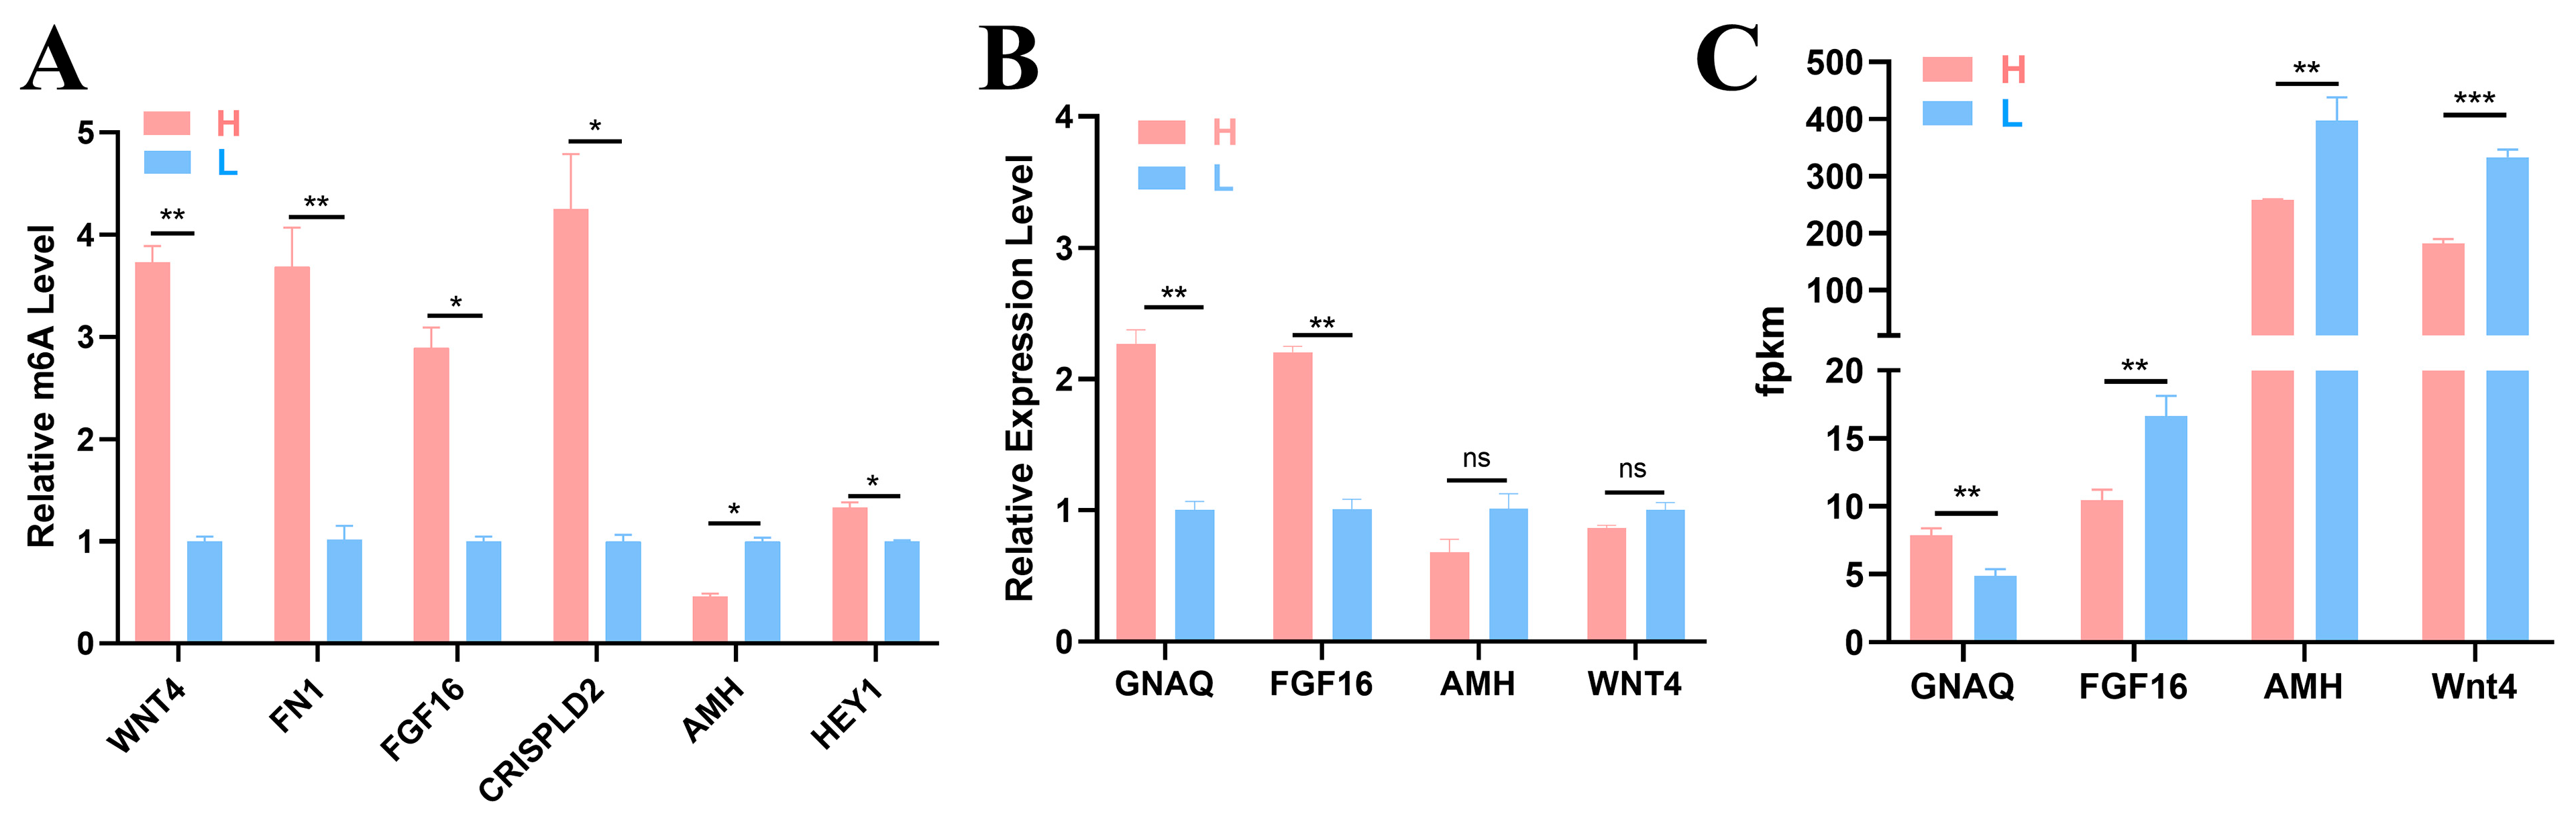
The following seven key node genes were identified by conducting a network diagram analysis of the candidate genes: WNT4, FN1, FGF16, CRISPLD2, AMH, HEY1, and GNAQ (Figure 3E). To verify the accuracy of the sequencing results, six DMGs (WNT4, FN1, FGF16, CRISPLD2, AMH, and HEY1) and four DEGs (GNAQ, FGF16, AMH, and WNT4) were selected for detection via MeRIP–qPCR and qRT–PCR. The methylation levels of the six genes shown in Figure 7A differed between the two groups, indicating the presence of m6A methylation in the ovary tissues of the two groups of 43 w Gushi chickens. The gene methylation level results were consistent with the sequencing results, confirming the authenticity and reliability of the sequencing results (Figure 7B,C).
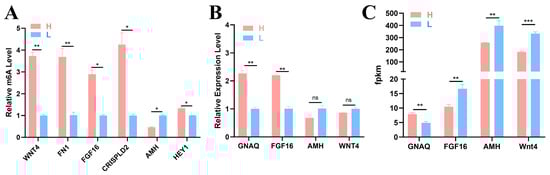
Figure 7.
Experimental results. (A) Methylase gene levels were detected using MeRIP-qPCR. (B) The relative mRNA expression level was detected using qRT–PCR. (C) Gene change levels based on RNA-Seq data. The significance of the difference between the gene expression levels of the H group and L group was determined by Student’s t test (* p < 0.05; ** p < 0.01; *** p < 0.001, ns p > 0.05).
3. Discussion
In the modern poultry industry, egg production is essential and has a certain economic and reproductive value, and egg production performance is also an important factor affecting the poultry industry. The ovary is the main reproductive organ of female animals and plays an important role in ovum laying and hormone secretion. Ovary development in chickens is a dynamic process regulated by multiple factors, and the laying performance of chickens strongly depends on ovary function. The development of ovary follicles is a key factor affecting the egg production traits of poultry. Follicles are the basic functional unit of ovaries. In female poultry, primordial follicles gradually form after birth, and the number of primordial follicles increases continuously with ovarian development. However, a large part of this regulatory process has not been fully elucidated. The molecular mechanisms of chicken ovary development or follicle selection are relatively complex, and m6A modification plays an important role in follicle selection [4].
With the continuous development of science and technology, RNA methylation has become a hot topic in the study of epigenetics. m6A regulates RNA stability, variable splicing, out-of-nucleus translocation, degradation, selective translation, and translation rates, and is also related to RNA stability [14]. It affects RNA stability, which subsequently determines whether RNA is degraded [15]. Currently, m6A-related research has involved multiple animals. In 2019, [4] constructed a transcriptome-wide m6A methylation profile of chicken ovaries during follicle selection, and the results revealed that pre-hierarchical and hierarchical follicles presented greater m6A enrichment near the start and stop codon regions. Most of the methylation peaks in yaks are concentrated in the stop codon as well as the 3′ UTR and 5′ UTR regions [9]. The results of the present study are consistent with the findings of the abovementioned studies, demonstrating that m6A methylation is highly enriched near the 3′ UTR, start codon, and stop codon regions. Thus, these results suggest that the overall distributions of m6A methylation peaks are highly similar among species. In addition, our data revealed that the high-yield group presented high levels of m6A methylation and that the m6A levels of the mRNAs in the two groups significantly differed, suggesting that m6A may affect egg production ability. For example, [10] reported that m6A-modified genes play key regulatory roles in female yaks’ follicular growth and development. According to MeRIP sequencing results from oocytes, m6A modifications play a coordinating role in RNA stabilization during mouse follicular development and oocyte growth [12].
In this study, we investigated the dynamic changes in m6A methylation in the ovary transcriptomes of high- and low-yield Gushi chickens during sexual maturity. Many methylation peaks were detected in the transcriptome of Gushi chicken ovary tissue, and 2241 m6A peaks, and 2068 DMGs were identified. GO and KEGG enrichment analyses and GSEA of 70 DMGs identified using both omics methods revealed that the DMGs have potential regulatory functions in ovary development. These genes are involved in various important pathways, such as the PI3K–Akt signaling pathway, the Wnt signaling pathway, the mTOR signaling pathway, the cAMP signaling pathway, the insulin secretion pathway, the MAPK signaling pathway, and the Notch signaling pathway. Among them, the pathway with the most enriched genes was the PI3K–Akt signaling pathway.
Phosphatidylinositol 3-kinase (PI3K) signaling is a fundamental pathway for the regulation of cell proliferation, survival, migration, and metabolism in a variety of physiological and pathological processes. Recent studies in humans and mice confirmed that PI3K–Akt signaling plays a crucial role in the regulation of GC growth and apoptosis during follicular development [16]. Research has shown that the PI3K–Akt signaling pathway can regulate the cell cycle and survival of bovine granulosa cells [17]. During mouse follicular development, the PI3K signaling pathway can control the activation of primordial follicles through FOXO3 in the FOXO family [18]. FOXO3 can regulate insulin signaling [19,20], and [21] reported that insulin signaling affects the proliferation and differentiation of ovary granulosa cells in mice through FOXO3 phosphorylation. Insulin exerts a gonadotropin effect in the ovaries, and this effect is mediated by interactions between the respective signaling pathways at key nodes, such as the MAPK and AKT pathways [22]. The PI3K–AKT–FOXO signaling pathway is a central pathway that controls the growth and metabolism of all cells [23]. An increasing number of studies demonstrate that the PI3K–AKT–FOXO3 signaling pathway and insulin secretion pathway are closely related to ovarian function and that the PI3K–Akt signaling pathway plays crucial roles in follicular development.
WNT2 is expressed in rat ovary granulosa cells at all stages of follicular development [24]. In addition, WNT2 regulates gap junction signaling in mouse folliculogenesis [25]. In this study, WNT4 was identified as a DMG. Throughout the entire follicular development process, WNT4 is also expressed in mouse granulosa cells [26]. WNT4 deletion in granulosa cells in mice results in sub-fertile females with healthy fetal follicles and small ovaries [27]. In addition, WNT4 plays a regulatory role in embryonic gonadal function and male gonadal development in mice [28]. Studies indicate that WNT4 plays an important role in follicular maturation and that the WNT2- and WNT4-induced activation of the Wnt signaling pathway promote granulosa cell proliferation [27]. The Wnt signaling pathway is an important pathway that regulates follicular development.
It has been shown that the Notch1 receptor in the Notch signaling pathway promotes follicular maturation in mice [29]. In mice, Notch2, Notch3, and Jagged 2 are expressed in developing follicular granulosa cells [30]. Notch2 is a key member of the Notch signaling pathway and potentially plays a role in ovine follicle development by regulating the growth of granulosa cells [31]. Studies have shown that granulosa cell proliferation depends on the Notch signaling pathway [32] and that Notch signaling plays a crucial role in early follicular formation in chickens [33]. The Notch signaling pathway has been shown to be essential for follicular development and fertility [34]. Therefore, the KEGG enrichment results suggest that the identified DMGs are associated with the process of ovarian follicular development.
The association analysis between MeRIP-seq and RNA-seq resulted in 70 differentially expressed and methylated genes. Six DMGs (WNT4, FN1, FGF16, CRISPLD2, AMH, and HEY1) and four DEGs (GNAQ, FGF16, AMH, and WNT4) were selected for validation based on network analysis of candidate genes. However, differences were found between the validation results of the DEGs and the transcriptome data (Figure 7B,C). Owing to the ability of m6A to regulate mRNA stability, we hypothesize that this result may be due to the influence of m6A modification on mRNA expression levels. We investigated the relationships between these seven genes and follicular development. According to reports, FN1 is a member of the FN family and is vital to follicular development [35]. In addition, FN1 is enriched in the PI3K–Akt signaling pathway, which is closely related to follicular development. WNT4 plays an important role in the maturation of follicles. The authors of [36] reported that the FGF16 gene may play a key regulatory role in ovary development, especially in oocyte growth as well as in Nile tilapia Oreochromis niloticus. AMH is secreted by the granulosa cells of secondary follicles and plays an important role in the recruitment of ovary primordial follicles and the selection of dominant follicles in mouse and rat ovaries [37]. DMG HEY1 is enriched in the Notch signaling pathway and is a downstream effector of Notch [38]. These findings indicate that the Notch signaling pathway plays a crucial role in follicular development. In summary, we found that key DEGs play important roles in follicular-related reproductive processes.
Some studies have shown that egg production is determined by ovary function [38]. The egg production performance of laying hens is closely related to ovary and follicular development, and the development status of the follicles has a direct effect on the egg numbers of chickens [1]. Successive follicle selection is important for egg production and reproductive performance in chickens [2]. The authors of [38] identified WNT4 and AMH as candidate genes associated with egg production in chickens. WNT4 and AMH are also key genes we identified. Seven key genes with m6A modifications were enriched in pathways related to ovary and follicle development, which affects the egg production process. The results of the present study revealed that chickens with higher levels of m6A methylation have significantly greater egg production than those with lower levels of modification. This genetic information will help elucidate the molecular mechanisms of egg production. Overall, we revealed the importance of these key genes in controlling relay, and demonstrated that these genes have a significant effect on egg production. Our study demonstrated that m6A modification is involved in the egg production process in Gushi chickens; however, this study is based on omics and has only been validated at the m6A and mRNA levels. The functions of the key genes and the specific molecular mechanisms of m6A in ovary development and egg production need to be further explored.
4. Materials and Methods
4.1. Experimental Animals and Sample Collection
The Gushi chicken is a domestically produced dual-purpose chicken cultivated by Henan Sangao Agriculture and Animal Husbandry Co., Ltd. (Xinyang, China) in the core breeding group of the Gushi chicken farm. After 12 weeks of age, the chickens were raised in separate cages and allowed to drink water freely. Chickens were raised, managed, and vaccinated according to the normal management standards for Gushi chickens. A closed chicken coop had a temperature of 25–28 °C, 40–70% humidity, good ventilation, and breathability, providing a suitable breeding environment.
First, individual egg production statistics were assessed using 764 Gushi chickens from the same batch until they reached 43 weeks of age. In the process of counting individual eggs, the numbers of eggs produced at different stages were classified and analyzed, and the eggs produced were grouped and used to determine the high-yield egg group and the low-yield egg group. According to the grouping criteria of [39], we defined individuals with a total egg number of the top 5% of the population at 20 weeks of age as the H group, and individuals whose EN was 0 as the 20-week-old L group. At 28, 36, and 43 weeks of age, the top 10% of chickens with the highest egg production were selected as the H group, and the bottom 20% of chickens with the lowest egg production were selected as the L group.
According to the statistical results, 85–95% of Gushi chickens were in the H group at 43 weeks, and 45–55% were in the L group. The average egg production rate was 60–65%. The average total EN of H group Gushi chickens was 125.83 ± 5.53, which was significantly greater than the average EN of this population (94.36). The average total EN of the L group was 79.00 ± 2.53, which was significantly lower than the average EN of this group (94.36). At weeks 20, 28, 36, and 43, the chickens were anesthetized using intraperitoneal injection of 40 mg/kg body weight pentobarbital. Ovarian tissue samples were taken from the high-yield and low-yield groups and weighed. After performing sample collection, the samples were immediately immersed in liquid nitrogen for freezing and stored in a −80 °C freezer. Ovarian samples were collected from each chicken within ten minutes after euthanasia, and all sample collection was completed within an hour.
4.2. RNA Isolation, Library Construction and Sequencing
Total RNA was isolated and purified from each ovary sample using Trizol reagent according to the manufacturer’s instructions. The quality and quantity of total RNA were determined with an Agilent Bioanalyzer 2100 and an RNA 6000 Nano LabChip Kit (Agilent, Santa Clara, CA, USA) with a RIN > 7.0. Poly(A) RNA was isolated from total RNA via an Arraystar Seq-Star™ Poly(A) RNA Isolation Kit (Arraystar, Rockville, MD, USA). The RNA was fragmented using RNA Cleavage Reagent (Sigma, St. Louis, MO, USA), and the average length of the fragments was 100 nt. The RNA was split into two portions. One set of RNA was used as an input control (no immunoprecipitation experiments were performed). Subsequently, the resulting transcriptome was sequenced directly to generate a library, which was used to eliminate the background during the process of collecting fragments with methylation. The other set of RNA was enriched with an m6A-specific antibody. After the capture of m6A-modified RNA, the antibody was eluted with magnetic beads to reduce the background noise of nonspecific binding. Strand-specific libraries were constructed for each of the two RNAs. After library construction was completed, the quality of the libraries was tested. The quality of all the libraries was measured using an Agilent Bioanalyzer 2100 system (Agilent Technologies, Inc., Santa Clara, CA, USA). The quality-checked libraries (Gene Denovo Biotechnology Co., Ltd., Guangzhou, China) were subsequently sequenced on an Illumina NovaSeq 6000 platform (San Diego, CA, USA).
4.3. Bioinformatics Analysis Process
Reads containing splices, duplicate sequences, adapter contaminants, low-quality sequences, and unidentified bases were removed using FASTP software (v0.19.3) [40], and clean reads were obtained. Clean reads were compared to the ribosomal database of the species using bowtie2 [41], and the unmapped reads were retained for subsequent transcriptome analysis. Clean reads were mapped to the Gallus gallus (chicken) reference genome using HISAT2 (v2.1.0) [42]. Peak calling and differential peak analysis were performed on a genome-wide scale via the R package exomePeak2 (v1.5.0) [43] on a grouped basis. IGV software (v2.16.0) [44] was used for integrated visualization of various types of genomic data. MEME (v5.3.3) [45] and HOMER (v4.10) [46] software were used to detect the significant sequence motif in the transcript sequence associated with peaks and perform motif analysis. We performed RNA methylation rate difference analysis on all the peaks in the comparison group using exomePeak2 and screened for different peaks under the conditions of p value < 0.05 and |FC| > 1.5. On the basis of the HISAT2 results comparison, we reconstructed the transcripts using Stringtie (v2.1.2) [47] and calculated the expression levels of all of the genes in each sample using RSEM (v1.3.1) [48]. Intergroup RNA differential expression analysis was performed using DESeq2 software (v1.22.2), and the adjusted screening conditions for differentially expressed genes or transcripts were FDR < 0.05 and |FC| > 1.5. GO and KEGG pathway enrichment analyses were performed using KOBAS 3.0, with p < 0.05 considered statistically significant. Interaction relationships in the STRING [49] protein interaction database (http://string-db.org, accessed on 21 January 2023) were applied for the analysis of differential gene protein interaction networks. The set of DEGs was extracted from the database, and an interaction network diagram was constructed using Cytoscape (v.3.9.1) [50].
4.4. Colorimetric Method
Total m6A was detected using EpiQuikTM m6A RNA Methylation Quantification Kit (Colorimetric; Amyjet Scientific, Wuhan, China) using total RNA extracted from the ovary tissues of Gushi chickens in the 43 w L and H groups according to the test protocol given by the manufacturer. Briefly, Binding Solution (BS) was added to the assay wells, and then 200 ng of extracted total RNA was added to bind RNA to the assay wells, incubated at 37 °C for 90 min, washed and Capture Antibody (CA) was added, incubated at room temperature for 60 min, washed, and Detection Antibody (DA) was added, incubated at room temperature for 30 min. After removing DA, Enhancer Solution was added and incubated for 30 min at room temperature. After washing, the absorbance (OD450) of each well was read at 450 nm using an enzyme marker. The absolute amount of m6A in each sample was calculated using the standard curve generated from the absorbance plots of Positive Control and Negative Control.
4.5. Quantitative Real-Time PCR
Six DMGs and four DEGs were selected for verification of their enrichment of m6A and relative mRNA expression in the ovarian tissues of 43-week-old Gushi chickens. Total RNA was extracted using an RNA simple total RNA extraction kit (TianGen Biotech, Beijing, China) according to the manufacturer’s instructions, and the RNA concentration and purity were subsequently detected using a NanoDrop 2000 spectrophotometer (Thermo, Waltham, MA, USA). The mRNA was reverse transcribed to cDNA using HiScript III-RT Super Mix (with gDNA wiper) (Vazyme, Nanjing, China). Quantitative real-time PCR was performed using ChamQ Universal SYBR qPCR Master Mix (Vazyme, Nanjing, China) and a Light Cycler 96 q-PCR system (Roche, Basel, Switzerland). The total reaction volume was 10 μL, containing 5 μL of 2 × Taq PCR Master Mix, 3.2 μL ddH2O, 0.4 L of each primer (1 M), and 1 μL cDNA. All reactions were performed in duplicate and repeated at least three times independently with the following procedure: an initial cycle at 95 °C for 5 min, followed by 35 cycles of 10 s at 95 °C, 10 s at 60 °C and 30 s at 72 °C, and a final cycle at 72 °C for 1 min. The mRNA expression was calculated by the 2−ΔΔCt method [51]. The expression of the proteins was normalized to that of GAPDH. Detailed primers are shown in Supplementary Table S3.
4.6. Methylated RNA Immunoprecipitation (MeRIP)-qPCR
A Total RNA Extraction Kit (TianGen Biotech, Beijing, China) was used to extract total RNA from the ovary tissue of 43 w Gushi chickens using the Ribo MeRIP™ m6A Transcriptome Analysis Kit (10 assay) (RN: R11096.6, RiboBio, Guangzhou, China) to perform MeRIP analysis of RNA according to the manufacturer’s instructions. First, RNA was fragmented to approximately 200 nt, followed by the preparation of anti-m6A magnetic beads. Subsequently, 1/10 of the total amount was taken as the input group, and the remaining RNA fragments were immunoprecipitated. A Magen Hipure Serum/plasma miRNA kit (R4317-03, Magen, Guangzhou, China) was used for elution and RNA recovery. The obtained RNA was reverse transcribed, and qRT–PCR was performed to determine the enrichment level of m6A in the mRNA.
4.7. Statistical Analysis
Statistical analysis was conducted using SPSS 24.0 (IBM, Armonk, NY, USA), and the data are presented as the means ± SEMs (n = 3). Student’s t test was used to determine the significance of the difference between two samples. GraphPad Prism 8 software (GraphPad Software, San Diego, CA, USA) was used to calculate the mean values, with error bars indicating the standard error of the mean; * p < 0.05, ** p < 0.01, *** p < 0.001, and ns p > 0.05 indicate statistical significance. The differences between the egg production levels, ovary weights, peak numbers of genes, and expression levels of the key genes in the H and L groups were detected using Student’s t test (Figure 1, Figure 2D and Figure 7).
5. Conclusions
In this study, 2241 DMPs, 2068 DMGs, and 1436 DEGs were screened using RNA-seq and MeRIP-seq analyses. A total of 70 genes exhibited simultaneous changes in m6A modification and mRNA expression. Six DMGs (WNT4, FN1, FGF16, CRISPLD2, AMH, and HEY1) and four DEGs (GNAQ, FGF16, AMH, and WNT4) were enriched in pathways related to ovary and follicular development and are most likely to play key roles in regulating the egg production process. m6A methylation may affect egg production in Gushi chickens by altering the expression of genes related to egg production. This study is the first to construct an m6A modification map of ovarian tissue in Gushi chickens, laying the foundation for revealing the molecular mechanism of m6A mRNA modification in the egg production process of Gushi chickens and providing a theoretical reference for further research on the regulatory mechanism of ovarian development and egg production in Gushi chickens.
Supplementary Materials
The following supporting information can be downloaded at: https://www.mdpi.com/article/10.3390/ijms26041677/s1.
Author Contributions
Conceptualization, H.C. and Z.L.; methodology, Y.Z.; software, Y.Z. and Y.C.; validation, Y.Z., Y.C., H.J., Y.N., L.H. and W.W.; formal analysis, Y.Z. and Y.C.; investigation, Y.Z. and Y.C.; resources, H.C. and Z.L; data curation, Y.Z. and Z.L.; writing—original draft preparation, Y.Z. and Y.C.; writing—review and editing, T.Y., R.H., Y.T., X.L., X.K., H.C. and Z.L.; visualization, Y.Z. and Z.L.; supervision, X.K., H.C. and Z.L.; project administration, Z.L.; funding acquisition, X.L. and Z.L. All authors have read and agreed to the published version of the manuscript.
Funding
This work was supported by grants from the China Agriculture Research System of MOF and MARA (CARS-40) and the National Key R&D Project (2024YFF1001400).
Institutional Review Board Statement
The experiments and animal care were performed according to the Regulations for the Administration of Affairs Concerning Experimental Animals (Ministry of Science and Technology, China, 2004). The protocols were approved by the Institutional Animal Care and Use Committee of Henan Agricultural University, China (Approval Code: HNND2023103003; Approval Date: 15 October 2023). In this study, written informed consent was obtained from Henan Agricultural University to use these animals. All experiments were conducted in accordance with relevant guidelines and regulations.
Informed Consent Statement
Not applicable.
Data Availability Statement
The data provided in this study can be requested from the corresponding author upon reasonable request.
Acknowledgments
Thanks to Henan San Gao Agriculture and Animal Husbandry Co., Ltd. Gushi Chicken Breeding Farm for providing experimental animals. We are grateful to Guangzhou Genedenovo Biotechnology Co., Ltd. for assisting in sequencing and bioinformatics analysis.
Conflicts of Interest
The authors declare no conflicts of interest.
Abbreviations
| m6A | RNA N6-methyladenosine |
| 43 w | 43 weeks of age |
| MeRIP-seq | Methylated RNA Immunoprecipitation Sequencing |
| EN | Egg Number |
| H | High yield |
| L | Low yield |
| qRT-PCR | Quantitative real-time PCR |
| RNA-seq | RNA Sequencing |
| IP | Immunoprecipitation |
| DMG | Differentially Methylated Genes |
| 5′ UTR | 5′ Untranslated Regions |
| 3′ UTR | 3′ Untranslated Regions |
| CDS | Coding DNA Sequence |
| DMPs | Differentially Methylated Peaks |
| DEG | Differentially Expressed Genes |
| GSEA | Gene Set Enrichment Analysis |
| MeRIP | Methylated RNA Immunoprecipitation |
| BS | Binding Solution |
| CA | Capture Antibody |
| DA | Detection Antibody |
References
- Jia, C.; Zhang, M.; Liu, X.; Xu, W.; Xiong, Y.; Huang, R.; Li, M.; Li, M. Transcriptome-wide m6A methylation profiling of Wuhua yellow-feathered chicken ovary revealed regulatory pathways underlying sexual maturation and low egg-laying performance. Front. Genet. 2023, 14, 1284554. [Google Scholar] [CrossRef]
- Nie, R.; Zheng, X.; Zhang, W.; Zhang, B.; Ling, Y.; Zhang, H.; Wu, C. Morphological Characteristics and Transcriptome Landscapes of Chicken Follicles during Selective Development. Animals 2022, 12, 713. [Google Scholar] [CrossRef]
- Johnson, P.A. Follicle Selection in the Avian Ovary. Reprod. Domest. Anim. 2012, 47, 283–287. [Google Scholar] [CrossRef] [PubMed]
- Fan, Y.; Zhang, C.; Zhu, G. Profiling of RNA N6-methyladenosine methylation during follicle selection in chicken ovary. Poult. Sci. 2019, 98, 6117–6124. [Google Scholar] [CrossRef] [PubMed]
- Jiang, X.; Liu, B.; Nie, Z.; Duan, L.; Xiong, Q.; Jin, Z.; Yang, C.; Chen, Y. The role of m6A modification in the biological functions and diseases. Signal Transduct. Target. Ther. 2021, 6, 74. [Google Scholar] [CrossRef]
- Roignant, J.-Y.; Soller, M. m6A in mRNA: An Ancient Mechanism for Fine-Tuning Gene Expression. Trends Genet. 2017, 33, 380–390. [Google Scholar] [CrossRef]
- Jia, G.; Fu, Y.; Zhao, X.; Dai, Q.; Zheng, G.; Yang, Y.; Yi, C.; Lindahl, T.; Pan, T.; Yang, Y.-G.; et al. N6-Methyladenosine in nuclear RNA is a major substrate of the obesity-associated FTO. Nat. Chem. Biol. 2011, 7, 885–887. [Google Scholar] [CrossRef] [PubMed]
- Mu, H.; Li, H.; Liu, Y.; Wang, X.; Mei, Q.; Xiang, W. N6-Methyladenosine Modifications in the Female Reproductive System: Roles in Gonad Development and Diseases. Int. J. Biol. Sci. 2022, 18, 771–782. [Google Scholar] [CrossRef]
- Wang, X.; Pei, J.; Guo, S.; Cao, M.; Bao, P.; Xiong, L.; Wu, X.; Chu, M.; Liang, C.; Yan, P.; et al. Characterization of N6-Methyladenosine in Domesticated Yak Testes Before and After Sexual Maturity. Front. Cell Dev. Biol. 2021, 9, 755670. [Google Scholar] [CrossRef] [PubMed]
- Guo, S.; Wang, X.; Cao, M.; Wu, X.; Xiong, L.; Bao, P.; Chu, M.; Liang, C.; Yan, P.; Pei, J.; et al. The transcriptome-wide N6-methyladenosine (m6A) map profiling reveals the regulatory role of m6A in the yak ovary. BMC Genom. 2022, 23, 358. [Google Scholar] [CrossRef] [PubMed]
- Chen, C.; Tang, X.; Yan, S.; Yang, A.; Xiang, J.; Deng, Y.; Yin, Y.; Chen, B.; Gu, J. Comprehensive Analysis of the Transcriptome-Wide m6A Methylome in Shaziling Pig Testicular Development. Int. J. Mol. Sci. 2023, 24, 14475. [Google Scholar] [CrossRef]
- Mu, H.; Zhang, T.; Yang, Y.; Zhang, D.; Gao, J.; Li, J.; Yue, L.; Gao, D.; Shi, B.; Han, Y.; et al. METTL3-mediated mRNA N6-methyladenosine is required for oocyte and follicle development in mice. Cell Death Dis. 2021, 12, 989. [Google Scholar] [CrossRef]
- Fang, F.; Wang, X.; Li, Z.; Ni, K.; Xiong, C. Epigenetic regulation of mRNA N6-methyladenosine modifications in mammalian gametogenesis. Mol. Hum. Reprod. 2021, 27, gaab025. [Google Scholar] [CrossRef] [PubMed]
- Fu, Y.; Dominissini, D.; Rechavi, G.; He, C. Gene expression regulation mediated through reversible m6A RNA methylation. Nat. Rev. Genet. 2014, 15, 293–306. [Google Scholar] [CrossRef]
- Dominissini, D.; Moshitch-Moshkovitz, S.; Schwartz, S.; Salmon-Divon, M.; Ungar, L.; Osenberg, S.; Cesarkas, K.; Jacob-Hirsch, J.; Amariglio, N.; Kupiec, M.; et al. Topology of the human and mouse m6A RNA methylomes revealed by m6A-seq. Nature 2012, 485, 201–206. [Google Scholar] [CrossRef] [PubMed]
- Gong, Y.; Luo, S.; Fan, P.; Zhu, H.; Li, Y.; Huang, W. Growth hormone activates PI3K/Akt signaling and inhibits ROS accumulation and apoptosis in granulosa cells of patients with polycystic ovary syndrome. Reprod. Biol. Endocrinol. 2020, 18, 121. [Google Scholar] [CrossRef] [PubMed]
- Hu, C.-L.; Cowan, R.G.; Harman, R.M.; Quirk, S.M. Cell Cycle Progression and Activation of Akt Kinase Are Required for Insulin-Like Growth Factor I-Mediated Suppression of Apoptosis in Granulosa Cells. Mol. Endocrinol. 2004, 18, 326–338. [Google Scholar] [CrossRef]
- John, G.B.; Gallardo, T.D.; Shirley, L.J.; Castrillon, D.H. Foxo3 is a PI3K-dependent molecular switch controlling the initiation of oocyte growth. Dev. Biol. 2008, 321, 197–204. [Google Scholar] [CrossRef]
- Menon, V.; Ghaffari, S. Transcription factors FOXO in the regulation of homeostatic hematopoiesis. Curr. Opin. Hematol. 2018, 25, 290–298. [Google Scholar] [CrossRef] [PubMed]
- Link, W.; Fernandez-Marcos, P.J. FOXO transcription factors at the interface of metabolism and cancer. Int. J. Cancer 2017, 141, 2379–2391. [Google Scholar] [CrossRef]
- Tan, M.; Cheng, Y.; Zhong, X.; Yang, D.; Jiang, S.; Ye, Y.; Ding, M.; Guan, G.; Yang, D.; Zhao, X. LNK promotes granulosa cell apoptosis in PCOS via negatively regulating insulin-stimulated AKT-FOXO3 pathway. Aging 2021, 13, 4617. [Google Scholar] [CrossRef] [PubMed]
- Taniguchi, C.M.; Emanuelli, B.; Kahn, C.R. Critical nodes in signalling pathways: Insights into insulin action. Nat. Rev. Mol. Cell Biol. 2006, 7, 85–96. [Google Scholar] [CrossRef] [PubMed]
- Goldbraikh, D.; Neufeld, D.; Eid-Mutlak, Y.; Lasry, I.; Gilda, J.E.; Parnis, A.; Cohen, S. USP 1 deubiquitinates Akt to inhibit PI 3K-Akt-FoxO signaling in muscle during prolonged starvation. EMBO Rep. 2020, 21, e48791. [Google Scholar] [CrossRef] [PubMed]
- Ricken*, A.; Lochhead, P.; Kontogiannea, M.; Farookhi, R. Wnt signaling in the ovary: Identification and compartmentalized expression of wnt-2, wnt-2b, and frizzled-4 mRNAs. Endocrinology 2002, 143, 2741–2749. [Google Scholar] [CrossRef] [PubMed]
- Wang, H.-X.; Gillio-Meina, C.; Chen, S.; Gong, X.-Q.; Li, T.Y.; Bai, D.; Kidder, G.M. The Canonical WNT2 Pathway and FSH Interact to Regulate Gap Junction Assembly in Mouse Granulosa Cells1. Biol. Reprod. 2013, 89, 39. [Google Scholar] [CrossRef] [PubMed]
- Hsieh, M.; Johnson, M.A.; Greenberg, N.M.; Richards, J.S. Regulated expression of Wnts and Frizzleds at specific stages of follicular development in the rodent ovary. Endocrinology 2002, 143, 898–908. [Google Scholar] [CrossRef] [PubMed]
- Boyer, A.; Lapointe, É.; Zheng, X.; Cowan, R.G.; Li, H.; Quirk, S.M.; Demayo, F.J.; Richards, J.S.; Boerboom, D. WNT4 is required for normal ovarian follicle development and female fertility. FASEB J. 2010, 24, 3010–3025. [Google Scholar] [CrossRef]
- Yao, H.H.C.; Matzuk, M.M.; Jorgez, C.J.; Menke, D.B.; Page, D.C.; Swain, A.; Capel, B. Follistatin operates downstream of Wnt4 in mammalian ovary organogenesis. Dev. Dyn. 2004, 230, 210–215. [Google Scholar] [CrossRef] [PubMed]
- Guo, S.; Quan, S.; Zou, S. Roles of the Notch Signaling Pathway in Ovarian Functioning. Reprod. Sci. 2021, 28, 2770–2778. [Google Scholar] [CrossRef]
- Xie, Q.; Cheng, Z.; Chen, X.; Lobe, C.G.; Liu, J. The role of Notch signalling in ovarian angiogenesis. J. Ovarian Res. 2017, 10, 13. [Google Scholar] [CrossRef]
- Jing, J.; Jiang, X.; Chen, J.; Yao, X.; Zhao, M.; Li, P.; Pan, Y.; Ren, Y.; Liu, W.; Lyu, L. Notch signaling pathway promotes the development of ovine ovarian follicular granulosa cells. Anim. Reprod. Sci. 2017, 181, 69–78. [Google Scholar] [CrossRef] [PubMed]
- Liu, Y.-X.; Zhang, Y.; Li, Y.-Y.; Liu, X.-M.; Wang, X.-X.; Zhang, C.-L.; Hao, C.-F.; Deng, S.-L. Regulation of follicular development and differentiation by intra-ovarian factors and endocrine hormones. Front. Biosci.-Landmark 2019, 24, 983–993. [Google Scholar] [CrossRef]
- Li, J.; Zhao, D.; Guo, C.; Li, J.; Mi, Y.; Zhang, C. Involvement of Notch signaling in early chick ovarian follicle development. Cell Biol. Int. 2015, 40, 65–73. [Google Scholar] [CrossRef]
- George, R.M.; Hahn, K.L.; Rawls, A.; Viger, R.S.; Wilson-Rawls, J. Notch signaling represses GATA4-induced expression of genes involved in steroid biosynthesis. Reproduction 2015, 150, 383. [Google Scholar] [CrossRef]
- Monniaux, D.; Huet-Calderwood, C.; Bellego, F.; Fabre, S.; Monget, P.; Calderwood, D. Integrins in the Ovary. Semin. Reprod. Med. 2006, 24, 251–261. [Google Scholar] [CrossRef]
- Sun, Y.-L.; Zeng, S.; Ye, K.; Yang, C.; Li, M.-H.; Huang, B.-F.; Sun, L.-N.; Zhou, L.-Y.; Wang, D.-S. Involvement of FGF9/16/20 subfamily in female germ cell development of the Nile tilapia, Oreochromis niloticus. Fish Physiol. Biochem. 2012, 38, 1427–1439. [Google Scholar] [CrossRef]
- Weenen, C. Anti-Mullerian hormone expression pattern in the human ovary: Potential implications for initial and cyclic follicle recruitment. Mol. Hum. Reprod. 2004, 10, 77–83. [Google Scholar] [CrossRef] [PubMed]
- Zhang, T.; Chen, L.; Han, K.; Zhang, X.; Zhang, G.; Dai, G.; Wang, J.; Xie, K. Transcriptome analysis of ovary in relatively greater and lesser egg producing Jinghai Yellow Chicken. Anim. Reprod. Sci. 2019, 208, 106114. [Google Scholar] [CrossRef] [PubMed]
- Wang, D.; Tan, L.; Zhi, Y.; Bu, L.; Wang, Y.; Wang, Z.; Guo, Y.; Tian, W.; Xu, C.; Li, D.; et al. Genome-wide variation study and inter-tissue communication analysis unveil regulatory mechanisms of egg-laying performance in chickens. Nat. Commun. 2024, 15, 7069. [Google Scholar] [CrossRef] [PubMed]
- Chen, S.; Zhou, Y.; Chen, Y.; Gu, J. fastp: An ultra-fast all-in-one FASTQ preprocessor. Bioinformatics 2018, 34, i884–i890. [Google Scholar] [CrossRef]
- Langmead, B.; Salzberg, S.L. Fast gapped-read alignment with Bowtie 2. Nat. Methods 2012, 9, 357–359. [Google Scholar] [CrossRef] [PubMed]
- Lachmann, A.; Clarke, D.J.B.; Torre, D.; Xie, Z.; Ma’ayan, A. Interoperable RNA-Seq analysis in the cloud. Biochim. Biophys. Acta (BBA)-Gene Regul. Mech. 2020, 1863, 194521. [Google Scholar] [CrossRef]
- Meng, J.; Lu, Z.; Liu, H.; Zhang, L.; Zhang, S.; Chen, Y.; Rao, M.K.; Huang, Y. A protocol for RNA methylation differential analysis with MeRIP-Seq data and exomePeak R/Bioconductor package. Methods 2014, 69, 274–281. [Google Scholar] [CrossRef]
- Thorvaldsdottir, H.; Robinson, J.T.; Mesirov, J.P. Integrative Genomics Viewer (IGV): High-performance genomics data visualization and exploration. Brief. Bioinform. 2012, 14, 178–192. [Google Scholar] [CrossRef] [PubMed]
- Bailey, T.L.; Johnson, J.; Grant, C.E.; Noble, W.S. The MEME Suite. Nucleic Acids Res. 2015, 43, W39–W49. [Google Scholar] [CrossRef]
- Heinz, S.; Benner, C.; Spann, N.; Bertolino, E.; Lin, Y.C.; Laslo, P.; Cheng, J.X.; Murre, C.; Singh, H.; Glass, C.K. Simple Combinations of Lineage-Determining Transcription Factors Prime cis-Regulatory Elements Required for Macrophage and B Cell Identities. Mol. Cell 2010, 38, 576–589. [Google Scholar] [CrossRef] [PubMed]
- Pertea, M.; Pertea, G.M.; Antonescu, C.M.; Chang, T.-C.; Mendell, J.T.; Salzberg, S.L. StringTie enables improved reconstruction of a transcriptome from RNA-seq reads. Nat. Biotechnol. 2015, 33, 290–295. [Google Scholar] [CrossRef] [PubMed]
- Li, B.; Dewey, C.N. RSEM: Accurate transcript quantification from RNA-Seq data with or without a reference genome. BMC Bioinform. 2011, 12, 323. [Google Scholar] [CrossRef] [PubMed]
- Szklarczyk, D.; Franceschini, A.; Wyder, S.; Forslund, K.; Heller, D.; Huerta-Cepas, J.; Simonovic, M.; Roth, A.; Santos, A.; Tsafou, K.P.; et al. STRING v10: Protein–protein interaction networks, integrated over the tree of life. Nucleic Acids Res. 2015, 43, D447–D452. [Google Scholar] [CrossRef] [PubMed]
- Shannon, P.; Markiel, A.; Ozier, O.; Baliga, N.S.; Wang, J.T.; Ramage, D.; Amin, N.; Schwikowski, B.; Ideker, T. Cytoscape: A Software Environment for Integrated Models of Biomolecular Interaction Networks. Genome Res. 2003, 13, 2498–2504. [Google Scholar] [CrossRef]
- Bubner, B.; Baldwin, I.T. Use of real-time PCR for determining copy number and zygosity in transgenic plants. Plant Cell Rep. 2004, 23, 263–271. [Google Scholar] [CrossRef] [PubMed]

Disclaimer/Publisher’s Note: The statements, opinions and data contained in all publications are solely those of the individual author(s) and contributor(s) and not of MDPI and/or the editor(s). MDPI and/or the editor(s) disclaim responsibility for any injury to people or property resulting from any ideas, methods, instructions or products referred to in the content. |
© 2025 by the authors. Licensee MDPI, Basel, Switzerland. This article is an open access article distributed under the terms and conditions of the Creative Commons Attribution (CC BY) license (https://creativecommons.org/licenses/by/4.0/).