Article

Decoding PHR-Orchestrated Stress Adaptation: A Genome-Wide Integrative Analysis of Transcriptional Regulation Under Abiotic Stress in Eucalyptus grandis

1
Research Institute of Tropical Forestry, Chinese Academy of Forestry, Guangzhou 510520, China
2
Center for Genomics, Fujian Provincial Key Laboratory of Haixia Applied Plant Systems Biology, School of Future Technology, College of Forestry, Fujian Agriculture and Forestry University, Fuzhou 350002, China
*
Authors to whom correspondence should be addressed.
Int. J. Mol. Sci. 2025, 26(7), 2958; https://doi.org/10.3390/ijms26072958
Submission received: 14 February 2025 / Revised: 16 March 2025 / Accepted: 20 March 2025 / Published: 25 March 2025
(This article belongs to the Special Issue Plant Responses to Abiotic and Biotic Stresses)

Abstract

:
The phosphate starvation response (PHR) transcription factor family play central regulatory roles in nutrient signaling, but its relationship with other abiotic stress remains elusive. In the woody plant Eucalyptus grandis, we characterized 12 EgPHRs, which were phylogenetically divided into three groups, with group I exhibiting conserved structural features (e.g., unique motif composition and exon number). Notably, a protein–protein interaction network analysis revealed that EgPHR had a species-specific protein–protein interaction network: EgPHR6 interacted with SPX proteins of multiple species, while Eucalyptus and poplar PHR uniquely bound to TRARAC-kinesin ATPase, suggesting functional differences between woody and herbaceous plants. A promoter sequence analysis revealed a regulatory network of 59 transcription factors (TFs, e.g., BPC, MYBs, ERFs and WUS), mainly associated with tissue differentiation, abiotic stress, and hormonal responses that regulated EgPHRs’ expression. Transcriptomics and RT-qPCR gene expression analyses showed that all EgPHRs dynamically responded to phosphate (Pi) starvation, with the expression of EgPHR2 and EgPHR6 exhibiting sustained induction, and were also regulated by salt, cold, jasmonic acid, and boron deficiency. Strikingly, nitrogen starvation suppressed most EgPHRs, highlighting crosstalk between nutrient signaling pathways. These findings revealed the multifaceted regulatory role of EgPHRs in adaptation to abiotic stresses and provided insights into their unique evolutionary and functional characteristics in woody plants.

1. Introduction

Phosphorus (P) is one of the main mineral nutrients required for plant growth and development [1,2]. Phosphorus is an important component of macromolecules such as adenosine triphosphate (ATP), phospholipids, DNA, and RNA and is required for phosphorylation [3,4]. Therefore, phosphorus is essential for many plant life processes such as energy metabolism, photosynthesis, respiration, cell membrane stabilization, and genetic information transmission [5,6]. The phosphorus that can be absorbed and utilized by plants is soluble inorganic phosphate (Pi), but Pi is easily fixed by cation such as iron and aluminum in the soil [7,8]. As a result, P has become the second largest environmental factor limiting plant growth and development after nitrogen in many ecosystems.
Plants have evolved complex low-Pi signaling systems that adapt to soil phosphate limitations through molecular and physiological regulatory mechanisms [6]. These processes include Root system architecture (RSA) remodeling and activation of phosphate transporter (PHT) expression to improve phosphate uptake efficiency, as well as the modulation of growth and development processes in response to phosphate availability [9]. Studies in model plants have shown that phosphate starvation responses (PHRs) are the core regulatory transcription factors of the plant systematic low-Pi signaling network [10]. Under low Pi conditions, cellular Pi and ATP levels are reduced in Arabidopsis and rice, inducing PPIP5K-mediated conversion of inositol polyphosphates (InsPs) from InsP7 to InsP6 instead of InsP8 [11]. As InsP8 can stabilize the SPXs–PHRs interaction and inhibit the release of PHR from its negative regulators, SPXs, the decrease in InsP8 levels at low Pi further destabilizes the PHRs–SPXs interaction, so PHRs can be freely released from the SPXs–PHRs interaction [12,13]. PHR then shuttles from the cytoplasm into the nucleus and activates the transcription of downstream phosphate starvation-inducing genes (PSIs) [12,13]. PHR binds to the conserved cis-elements P1BS (GNATATNC) in the promoter of the PSI gene and activates or inhibits gene transcription of ~3800 PSI genes in Arabidopsis [14]. These PHR-dependent PSI genes include phosphate transporters PHT1;1 and PHT1;4, microRNAs microRNA399 and microRNA827, and transcription factors such as NIGT1 [15,16]. Conversely, PPIPK5 converts InsP7 to InsP8 and then stabilizes the SPXs–PHRs interaction under conditions of sufficient Pi [12,13]. As a result, the function of PHR is inhibited, and low-Pi signaling is disrupted [12,13]. Therefore, PHRs play an important role in regulating low-Pi signaling in plants. After the discovery of AtPHR1 in low-Pi signaling in 2001, a total of 15, 12, 20, 14, 18, 22, 23, 41, and 42 PHRs were characterized in Arabidopsis, rice, brachypodium, sorghum, Zea mays, G. arboreum, G. raimondii, G. hirsutum and G. barbadense [17,18,19]. Currently, 21 PHRs have been characterized in tea plants, and 2 PHRs from apple (MdPHR1) or 1 from poplar (PtoPHR1) have been functionally validated in response to low-Pi stress in woody plants [20,21,22]. However, research on PHR in many woody plants lags behind to a large extent compared to model plants and crops. In addition, research on PHR has focused on low-Pi signaling, and the function of PHR in other abiotic stresses remains largely unexplored.
Eucalyptus are perennial tall trees (rarely shrubs) from three genera: Eucalyptus, Angophora, and Corymbia in the family Myrtaceae of dicot plants, with a total of 1239 species (869 species and 370 subspecies), which are naturally distributed in Australia, Papua New Guinea, Indonesia, and the Philippines [23]. Eucalyptus is known for its rapid growth, with a maximum growth rate of ~10 m per year, superior wood performance, and strong environmental adaptability, resulting in Eucalyptus having been planted in more than 100 countries and regions, accounting for ~23% of the world’s forest plantations [24]. In China, Eucalyptus provides more than one-third of commercial wood production and is well adapted to the acidic soils of southern China, where effective free-Pi levels are known to be low due to the immobilization of free phosphorus by abundant cations such as aluminum and iron [7,8]. Therefore, understanding how Eucalyptus adapts and responds to low-Pi deficiency will be an interesting scientific question. However, to date, PHRs have not been characterized in Eucalyptus, and the expression patterns of PHRs under environmental stresses remain unexplored.
In this study, we performed a gene family analysis and characterized all 12 EgPHRs from Eucalyptus grandis, a model species in Eucalyptus spp. More importantly, we performed a systematic gene expression analysis of EgPHRs with different tissues, developmental stages, or environmental stresses. Our results provide useful preliminary results for further mechanistic studies of EgPHRs. It also unveils how PHR responds to different environmental stresses in woody plants and provides genetic information for the future design of high-phosphorus use efficiency (PUE) woody plants.

2. Results

2.1. Genome-Wide Characterization of PHRs in Eucalyptus grandis

A total of 12 PHR transcription factors in Eucalyptus grandis (E. grandis) were named from EgPHR1 to EgPHR12. The amino acid and CDS sequences of EgPHRs are listed in Table S1. Twenty-two PHR transcription factors were also characterized from Populus trichocarpa for the subsequent phylogenetic analysis (Table S1). To understand the biochemical properties of EgPHRs, we calculated the physicochemical properties of EgPHRs using Expasy (Table 1). In short, the amino acid length (<424.34 AAs) of all EgPHRs except EgPHR1 and EgPHR2 was shorter than the average length of plant proteins [25]. With the exception of EgPHR6, all EgPHRs showed higher isoelectric points (PI > 5.62) than the average PI of plant proteins [25]. As the instability index of all EgPHRs is above 40, the results suggested that EgPHRs might be unstable proteins [26]. All EgPHRs had a negative grand average of hydropathicity indicating that EgPHRs might be hydrophilic proteins [27]. Consistent with the results of many other plants, subcellular localization prediction showed that EgPHRs might be expressed in the nucleus.

2.2. Phylogenetic Analysis of Eucalyptus PHR Proteins

To understand the evolutionary characteristics of EgPHRs, phylogenetic analyses were performed on protein sequences of 61 PHRs from Arabidopsis thaliana (15), rice (12), Populus trichocarpa (Poplar, 22), and Eucalyptus (12). The results showed that the PHR proteins were divided into three groups (groups I-III, Figure 1, Table S1). Group I was the most dominant clade (29 PHRs), and the most well-studied PHRs for Pi signaling regulation including AtPHR1, AtPHL1, OsPHR2, OsPHR3, and OsPHR4 belonged to that group [28,29,30]. Half of the Eucalyptus PHR proteins (EgPHR1, EgPHR2, EgPHR4, EgPHR6, EgPHR9, and EgPHR10) were clustered with six Arabidopsis, six rice, and ten poplar PHR proteins in group I (Figure 1). The number of group I PHRs was almost the same in all four species, suggesting that group I PHRs had a potentially conserved function in different species (Figure 1). Group II had the lowest number of PHR proteins (12 PHRs), with three EgPHRs (EgPHR3, EgPHR5, and EgPHR7), two Arabidopsis, two rice, and four poplar PHRs (Figure 1). Group III was the second largest clade (20 PHRs), but only three Eucalyptus PHRs (EgPHR8, EgPHR11, EgPHR12) were characterized, which was significantly lower than the PHR proteins of the other three species: five Arabidopsis, four rice, eight poplar PHR proteins (Figure 1).

2.3. Distinct Motifs Were Present or Absent Among Different Groups of PHRs

To further understand the function and conserved nature of EgPHR, a multi-sequence alignment was performed for the amino acid sequences of all 12 EgPHRs (Figure S1). Similar to PHRs from other plants, all EgPHRs contained two conserved domains: a Myb-like DNA-binding domain (Pfam ID: PF00249) and a Myb_CC_LHEQLE motif (Pfam ID: PF14379) (Figure S1). The results showed that EgPHR had a highly conserved PHR domain.
To explore the function of EgPHR, the top ten enrichment motifs were characterized by MEMEs with all EgPHR amino acid sequences (Figure 2). Notably, all EgPHR genes had three conserved motifs: motif1, motif2, and motif3 (Figure 2A, Table S2). Two of them were the conserved Myb_DNA-binding domains (motif1) and Myb_CC_LHEQLE domains (motif3, Table S2). However, an additional motif (motif2, VQRHLQLRIEAQGKYLQKILEKAQKTL) was also ubiquitous in all EgPHR proteins. Interestingly, motif 4 (GDSGLVLTTDPKPRL) was absent in group I EgPHRs, but motif 5 (LAKYMPDSSE) was only present in group I EgPHRs. Motif 7 (MYNHSQYLGKNISPSSRMSIPSERH) occurred only in EgPHR3 and EgPHR5. As shown in Figure 2C, the gene structure analysis revealed that each group I EgPHRs had eight exons, while each group II or III EgPHRs contained only six exons (Table S3). Overall, the results suggested that group I EgPHRs might differ from the other two groups of EgPHRs in terms of conserved motifs and gene structure.

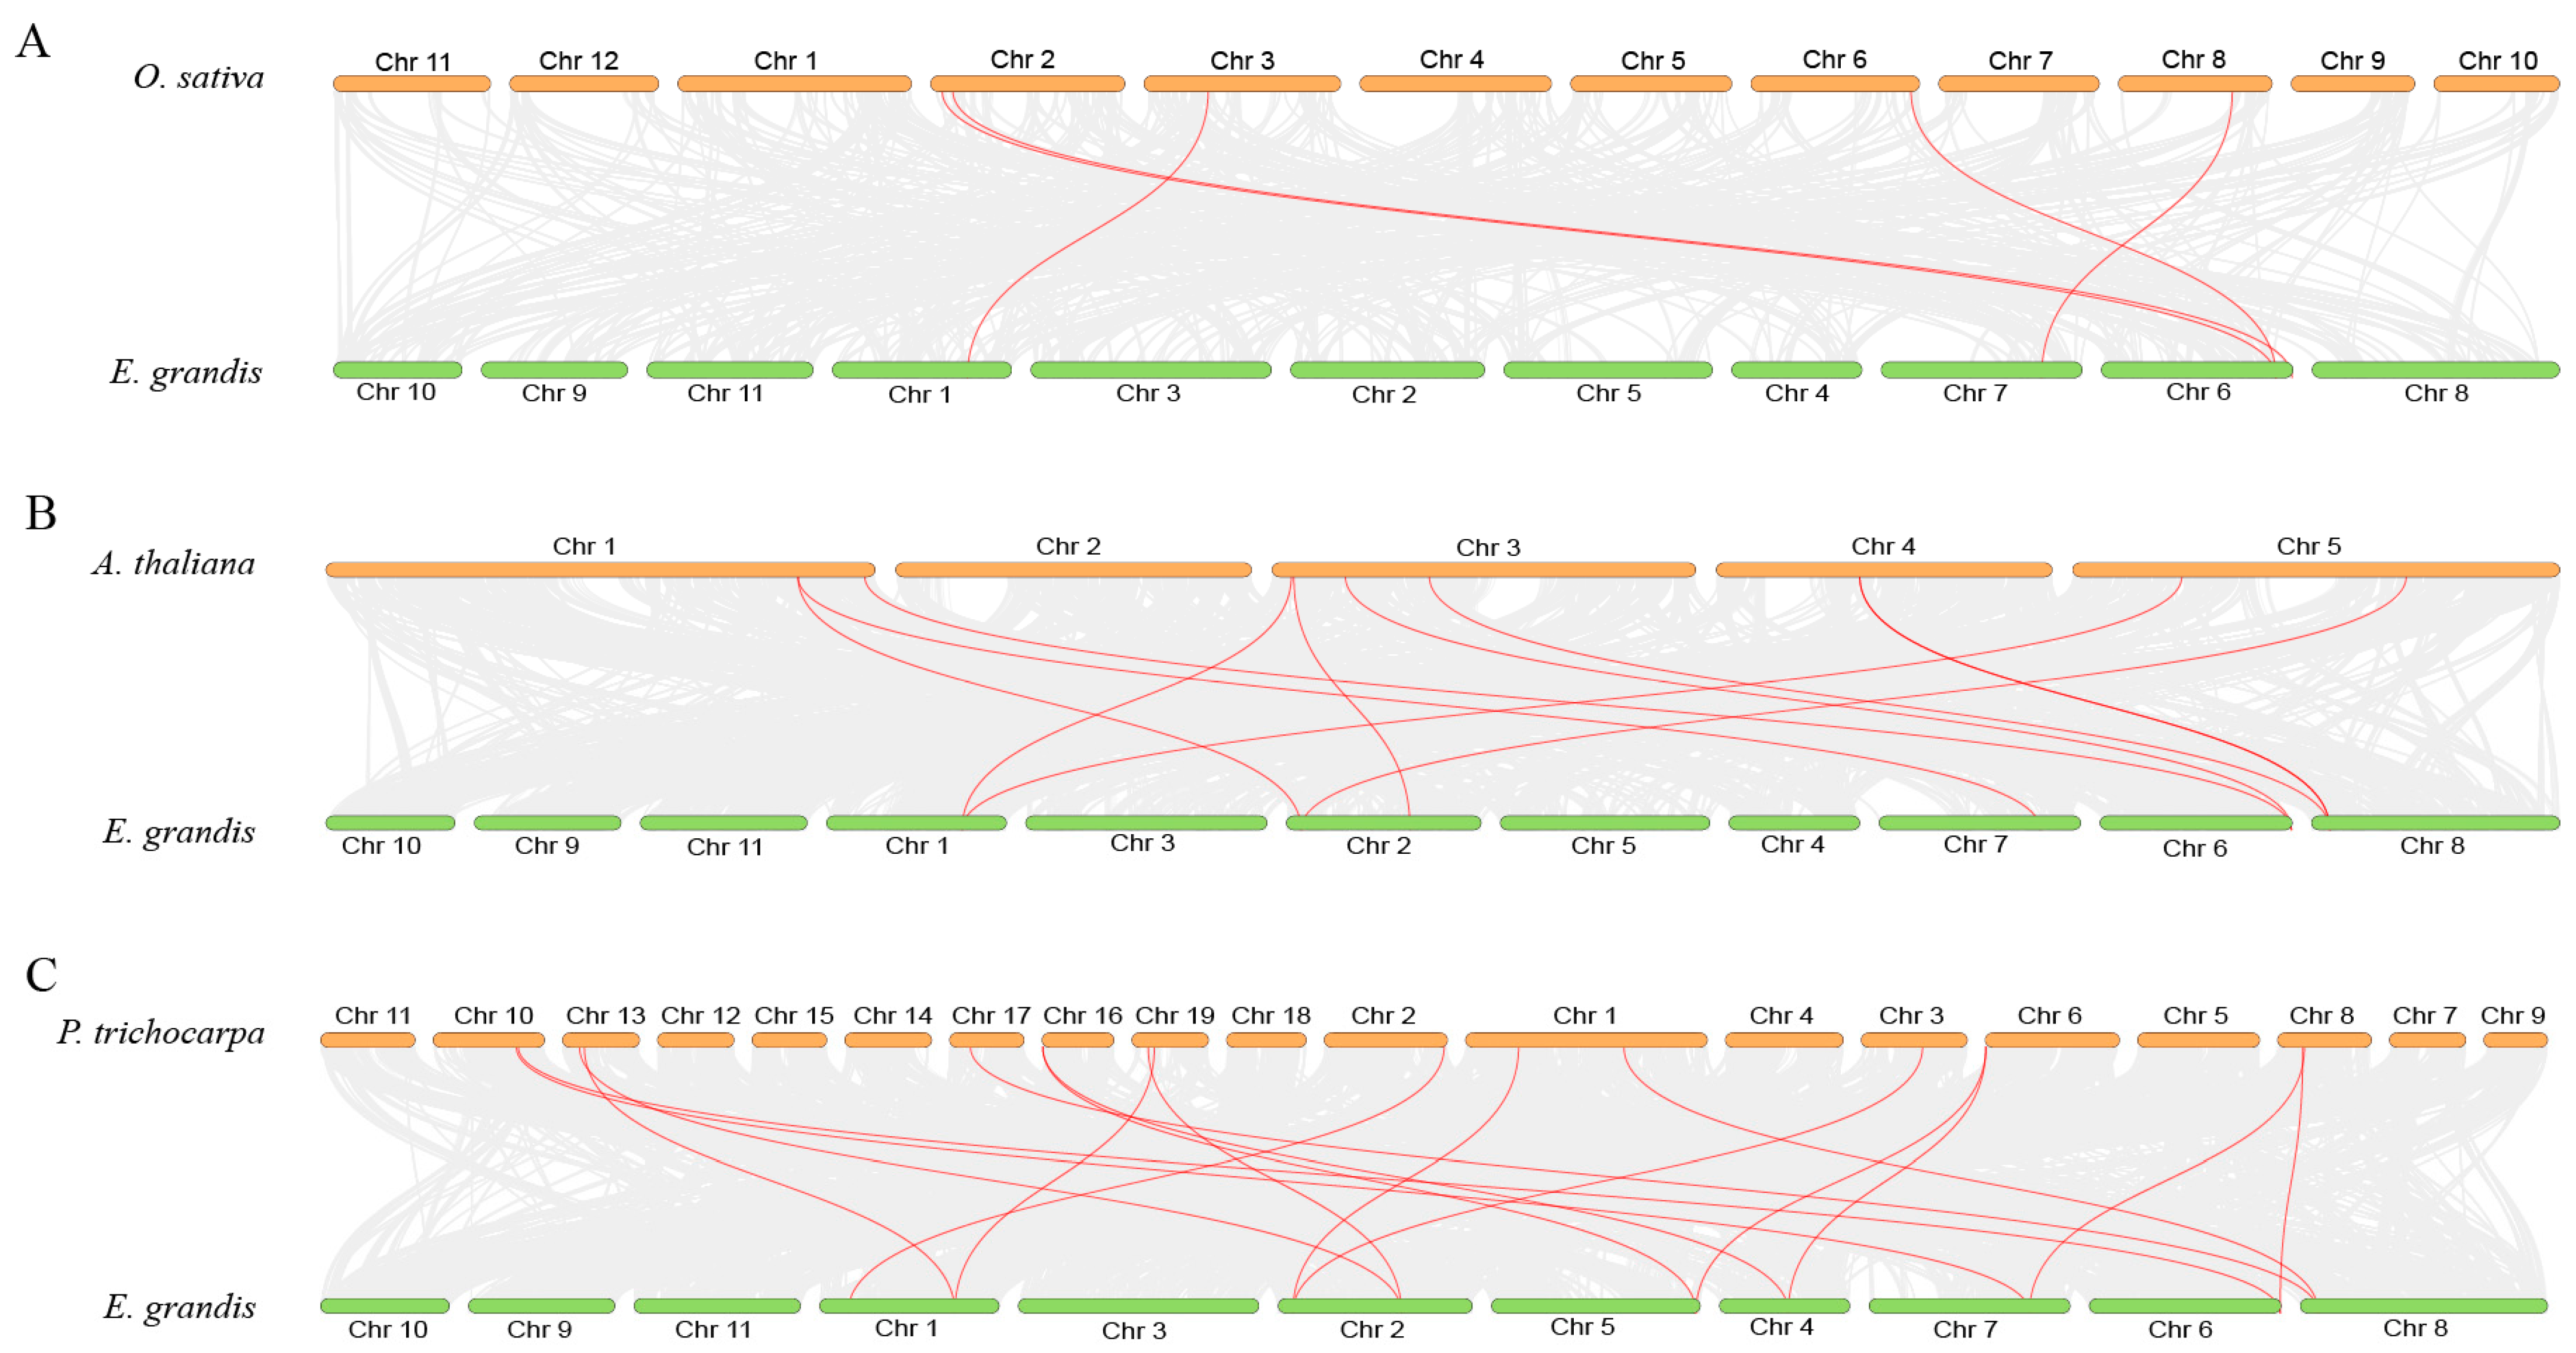
2.4. Gene Duplication and Syntenic Analyses of EgPHRs

To understand the origin of the EgPHR gene family, chromosomal distribution, gene duplication, and syntenic analyses of the EgPHRs were performed (Figure S2 and Figure 3). Gene duplication and syntenic analyses of EgPHRs showed that there were no tandem duplications within EgPHRs, while EgPHR3 and EgPHR5 were identified as a pair of segmental duplications (Figure S2). The syntenic analysis showed that EgPHRs formed orthologous gene pairs with ten Arabidopsis, five rice, and seventeen poplar PHRs (Figure 3, Table S4). The results suggested that EgPHRs were a highly conserved gene family, with the EgPHRs evolutionarily closer to poplar and Arabidopsis than rice PHRs.

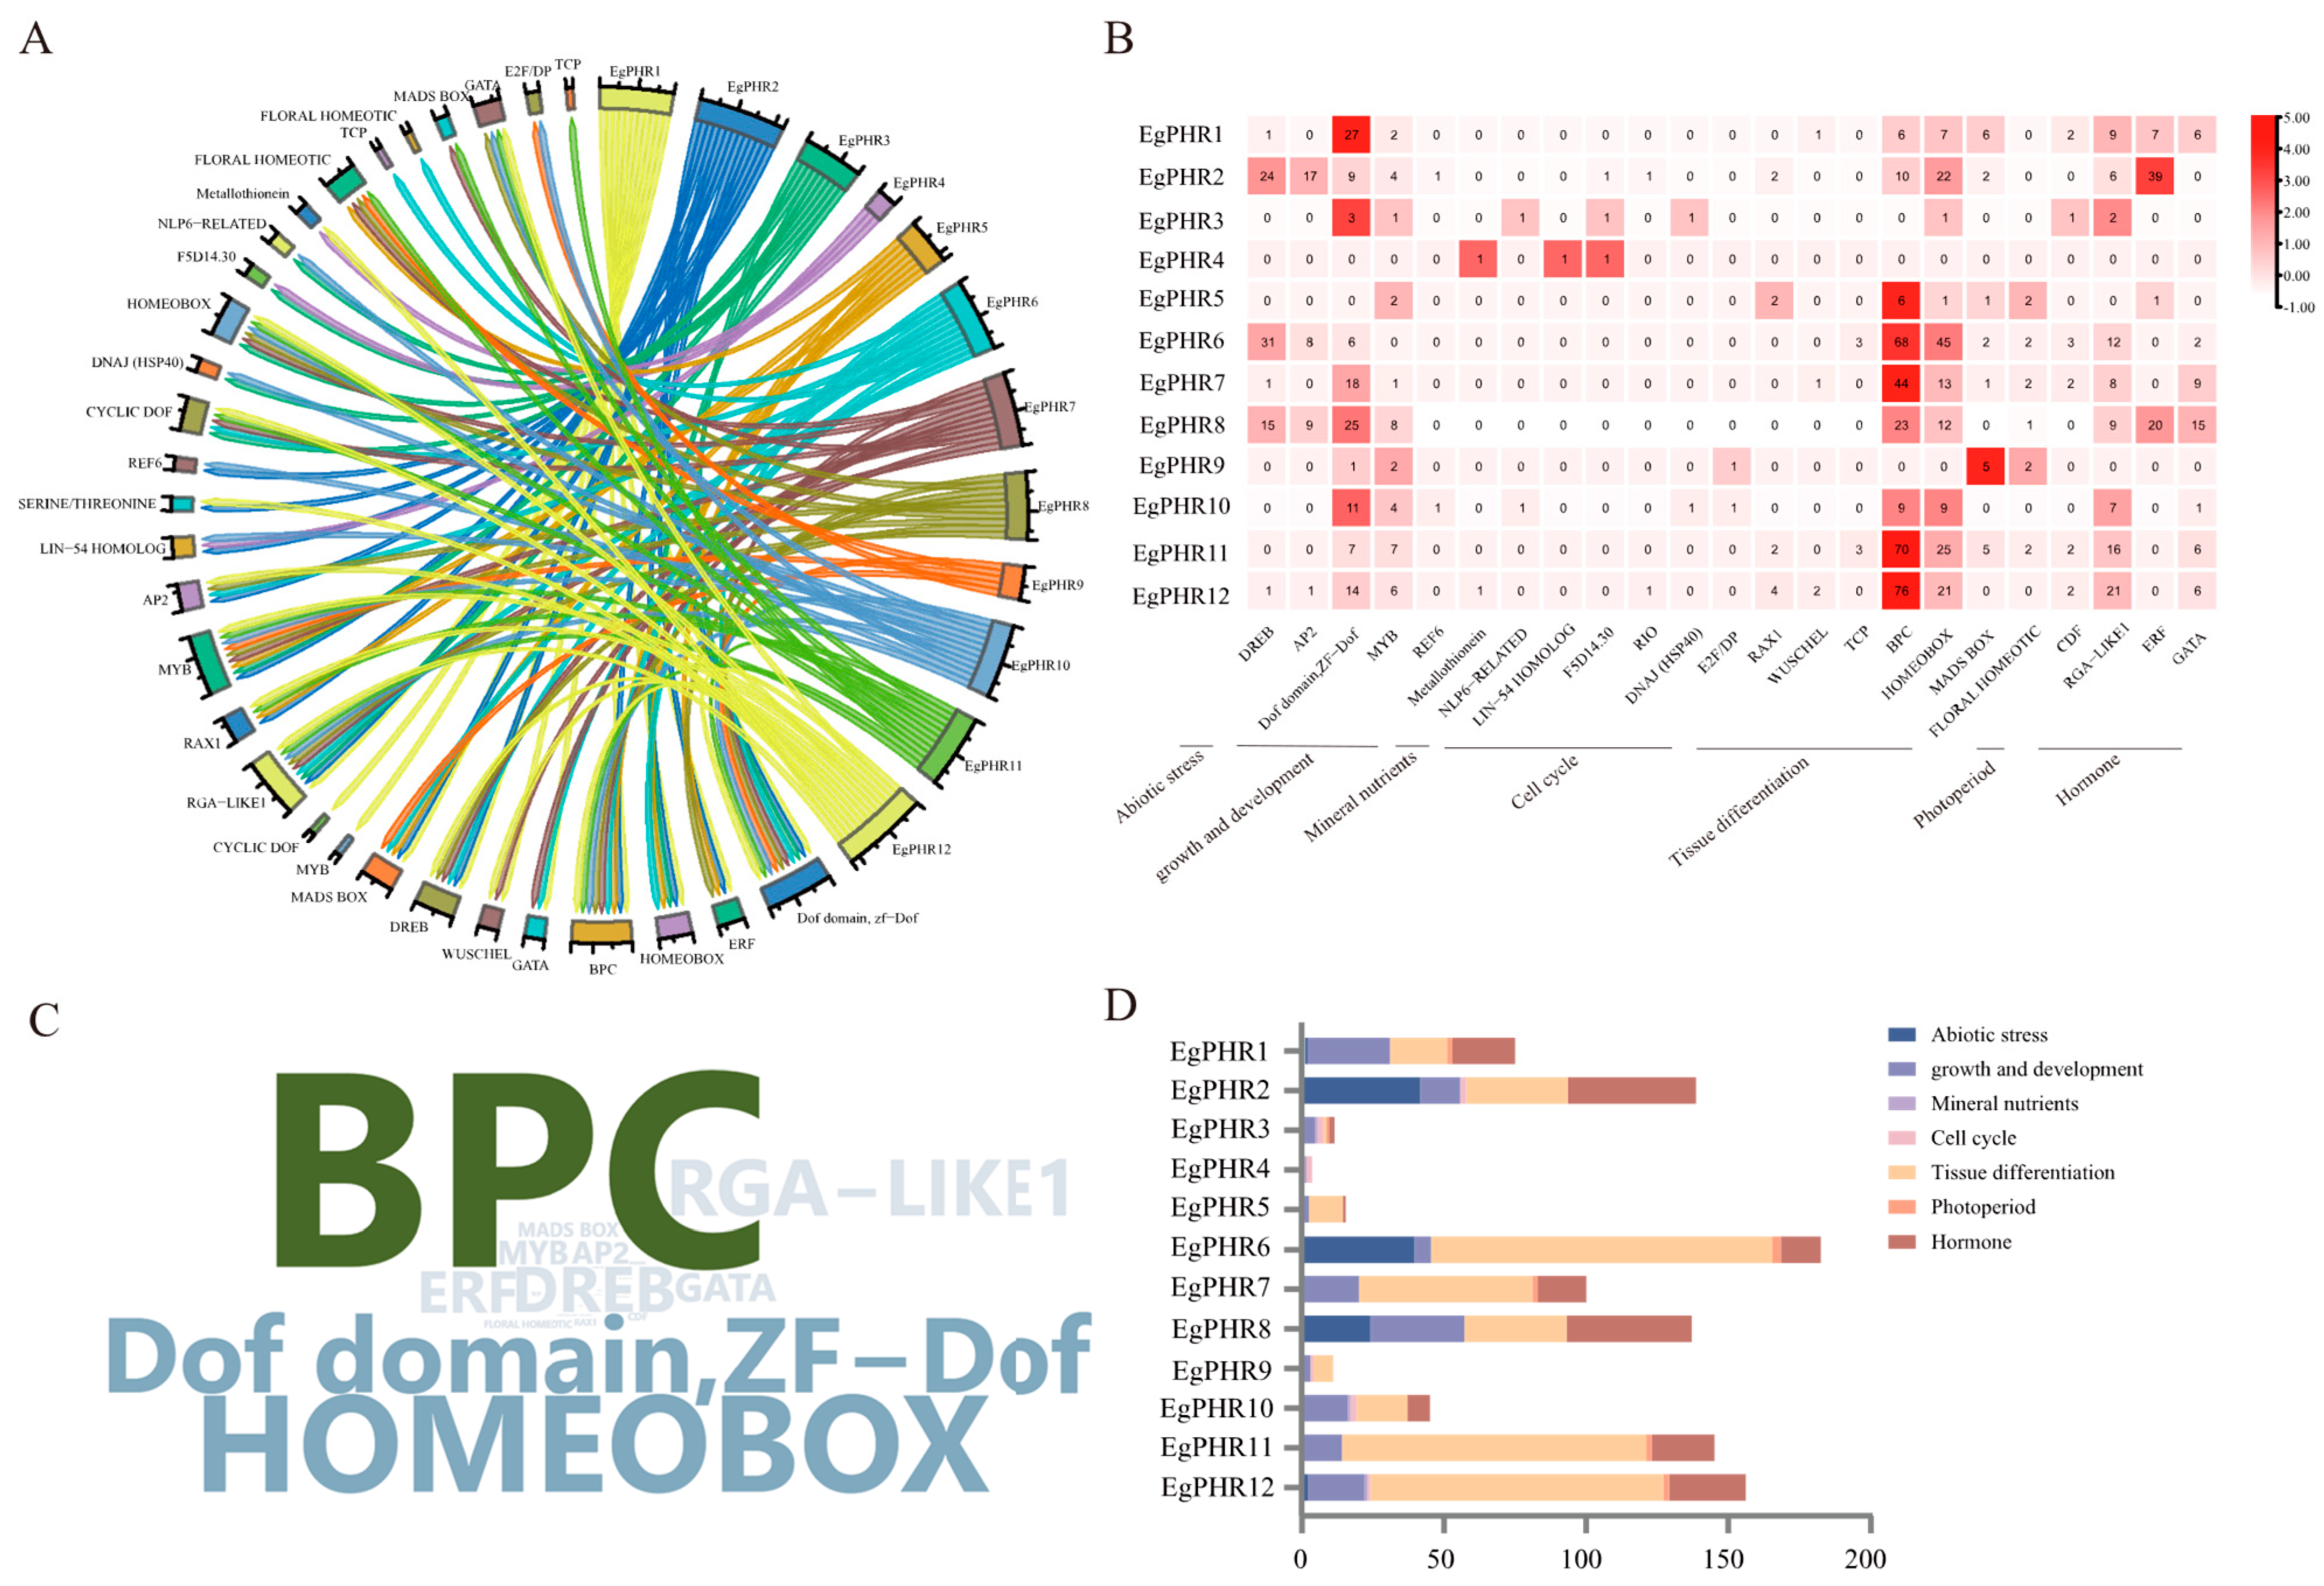
2.5. The Potential Upstream Regulatory Transcription Factors of EgPHRs

To further identify the potential transcription factors (TFs) that regulated gene expression in EgPHRs, the PlantRegMap database was introduced to characterize the regulatory transcription factors of EgPHRs (Figure 4, Table S5). A total of 59 transcription factors might regulate the gene expression of EgPHRs, and the potential transcription factors and EgPHRs formed a regulatory network chord (Figure 4A), and the binding sites of these TFs were located in the promoter region of EgPHRs. These 59 TFs were mainly composed of 9 MYBs, 4 ERFs (ERF035, LEP, ERF021, ERF003), 9 ZF-DoF (DOF2.4, DOF3.4, CDF2), 5 MADs-Box (SVP, AGL13), 5 homology boxes (SIP1, KNOX1, WUS, WOX13), 3 GATA (GATA1, GATA15, GATA24), 2 RAX1, 2 AP2, 3 DREB (DREB1A, DREB2A, DREB2F), 2 TCP (TCP18), 2 PBP (PBP6, PBP1), 1 REF (REF6), and 1 NLP (NLP6) (Figure 4B). Among all the TFs that regulated EgPHRs, BPC was the most abundant (312), followed by HOMEOBOX (156) and the Dof domain, ZF-Dof (121) (Figure 4B,C). EgPHR6 was found to be the most transcriptionally regulated gene (182), followed by EgPHR12 (156) and EgPHR11 (145) (Figure 4B). Notably, EgPHR12 and EgPHR11 were predominantly regulated by BPC. Most of the BPC-binding motifs in the promoter region of the EgPHR genes had significant bias.
These 59 TFs could also be divided into seven categories, with tissue differentiation, abiotic stress, growth and development, and hormones being the top-four-abundance functional categories (Figure 4B,D). These results suggest that the expression of EgPHRs is highly regulated by transcription factors associated with tissue differentiation, abiotic stress, growth and development, and hormonal response.

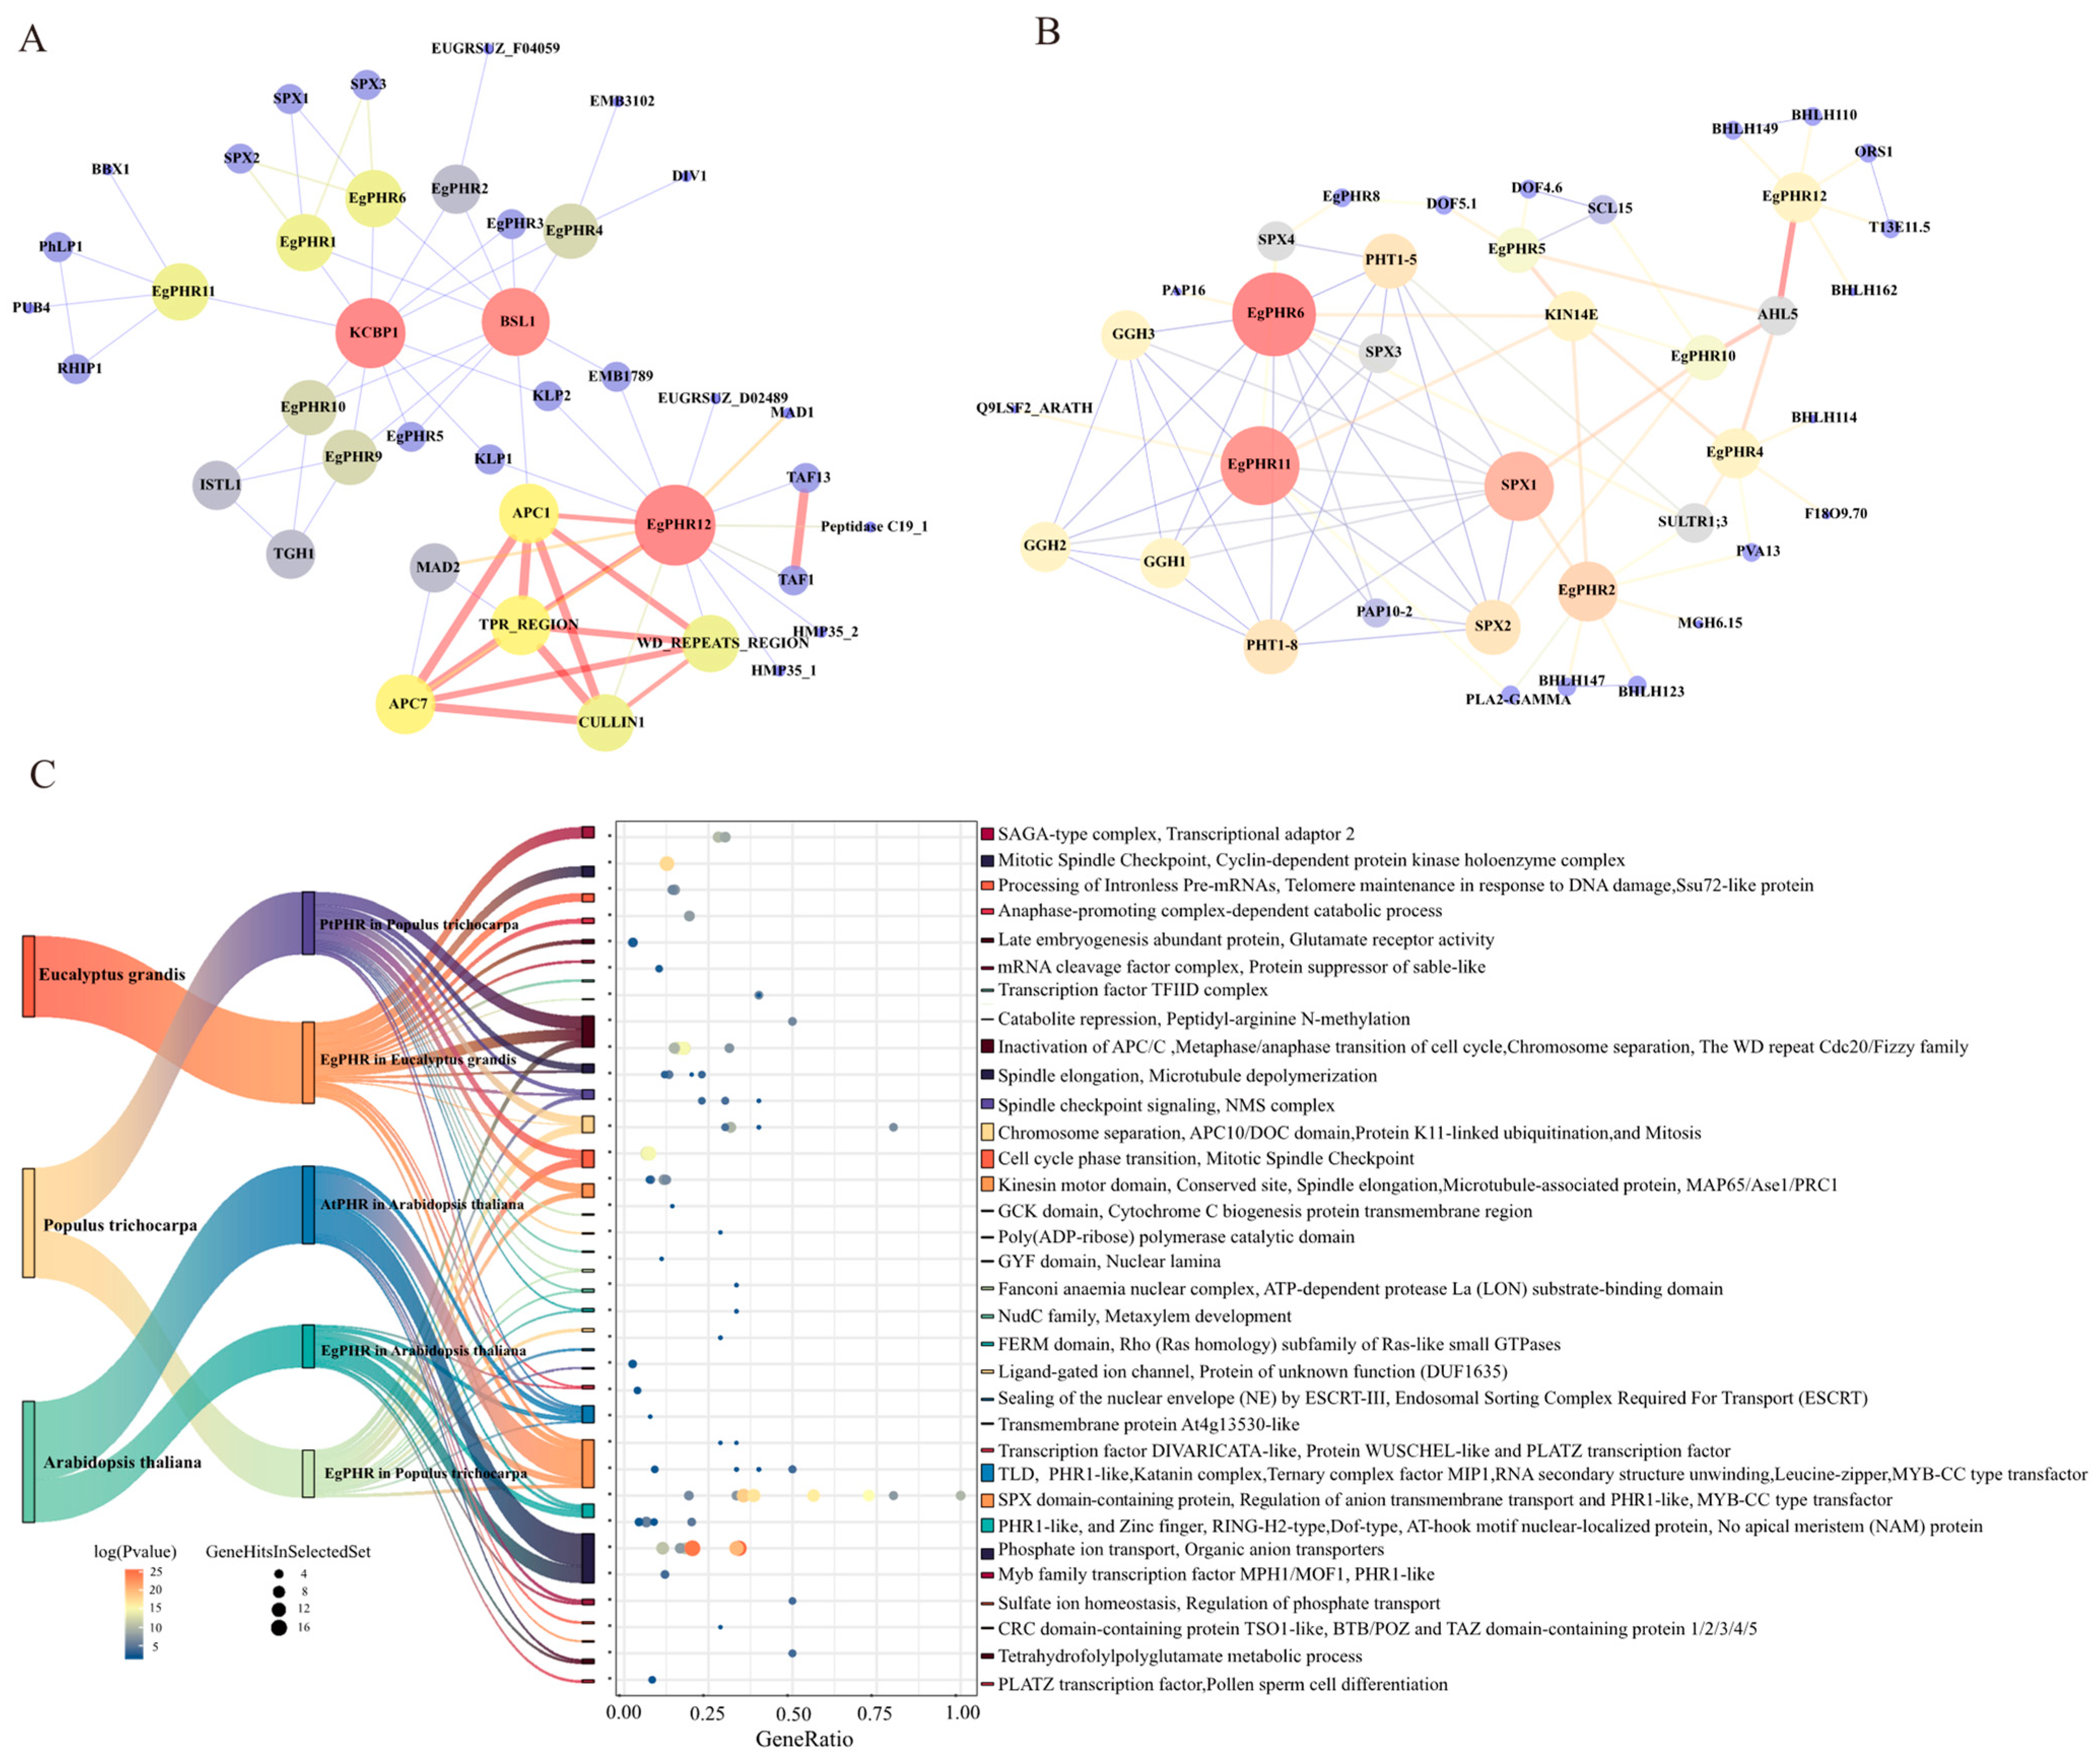
2.6. Protein–Protein Interaction Network of EgPHRs

To further elucidate the function of EgPHR, a protein–protein interaction (PPI) analysis of EgPHRs was performed with STRING (screening threshold: minimum required interaction score: medium confidence 0.4, maximum interaction shown: 30) (Figure 5A and Figure S3, Table S6). With the exception of EgPHR7 and EgPHR8, all EgPHRs had interacting proteins in Eucalyptus. SPXs were negative regulators of PHR and inhibited the Pi starvation response by interacting with and inhibiting the release of PHR [1]. EgPHR1 and EgPHR6 were the only two EgPHRs that interacted with EgSPXs in Eucalyptus. In addition to EgPHR1 and EgPHR6, EgPHR10 also interacted with PtrSPXs in poplars (Figure S3A, Table S6). However, only two EgPHRs, EgPHR11 and EgPHR6, interacted with AtSPXs in Arabidopsis (Figure 5B, Table S6). As a result, only EgPHR6 interacted with SPX proteins from all three species, and the protein–protein interaction network prediction showed that there were differences in the interaction between SPX and EgPHR in different species. PHT1 is a Pi transporter, and purple acid phosphatase (PAP) releases Pi from immobilized forms of P such as Al-P or Fe-P oxides [1]. Although no PHTs or PAPs interacted with EgPHRs in Eucalyptus from current data, EgPHR11 and EgPHR6 indeed interacted with PHT1 and PAP10-2 in Arabidopsis. The cluster enrichment analysis further supported the hypothesis that Pi signaling-related terms were enriched in EgPHR-interacting proteins from Eucalyptus, poplar, and Arabidopsis, and therefore, EgPHRs might play a role in the Pi starvation response.
Ten EgPHRs (EgPHR1, EgPHR2, EgPHR3, EgPHR4, EgPHR5, EgPHR6, EgPHR9, EgPHR10, EgPHR11, and EgPHR12) interacted with at least one of the TRAFAC myosin-kinesin ATPase superfamily proteins represented by BSL1, KCBP1, KLP1, and KLP2 in Eucalyptus (Figure 5A). The protein–protein interaction cluster enrichment analysis of Eucalyptus and poplar was enriched for mitotic spindle checkpoint signaling, positive regulation of chromosome segregation, spindle elongation, and microtubule depolymerization (Figure 5C, Table S7). Notably, PtrPHRs also interacted with the TRARAC-kinesin ATPase superfamily proteins in poplar (Figure 5C, Table S7), whereas EgPHR and AtPHRs did not interact with these proteins in Arabidopsis (Figure 5B and Figure S3C, Table S6). Therefore, PHR from two woody plants and PHR from Arabidopsis might have different functions.

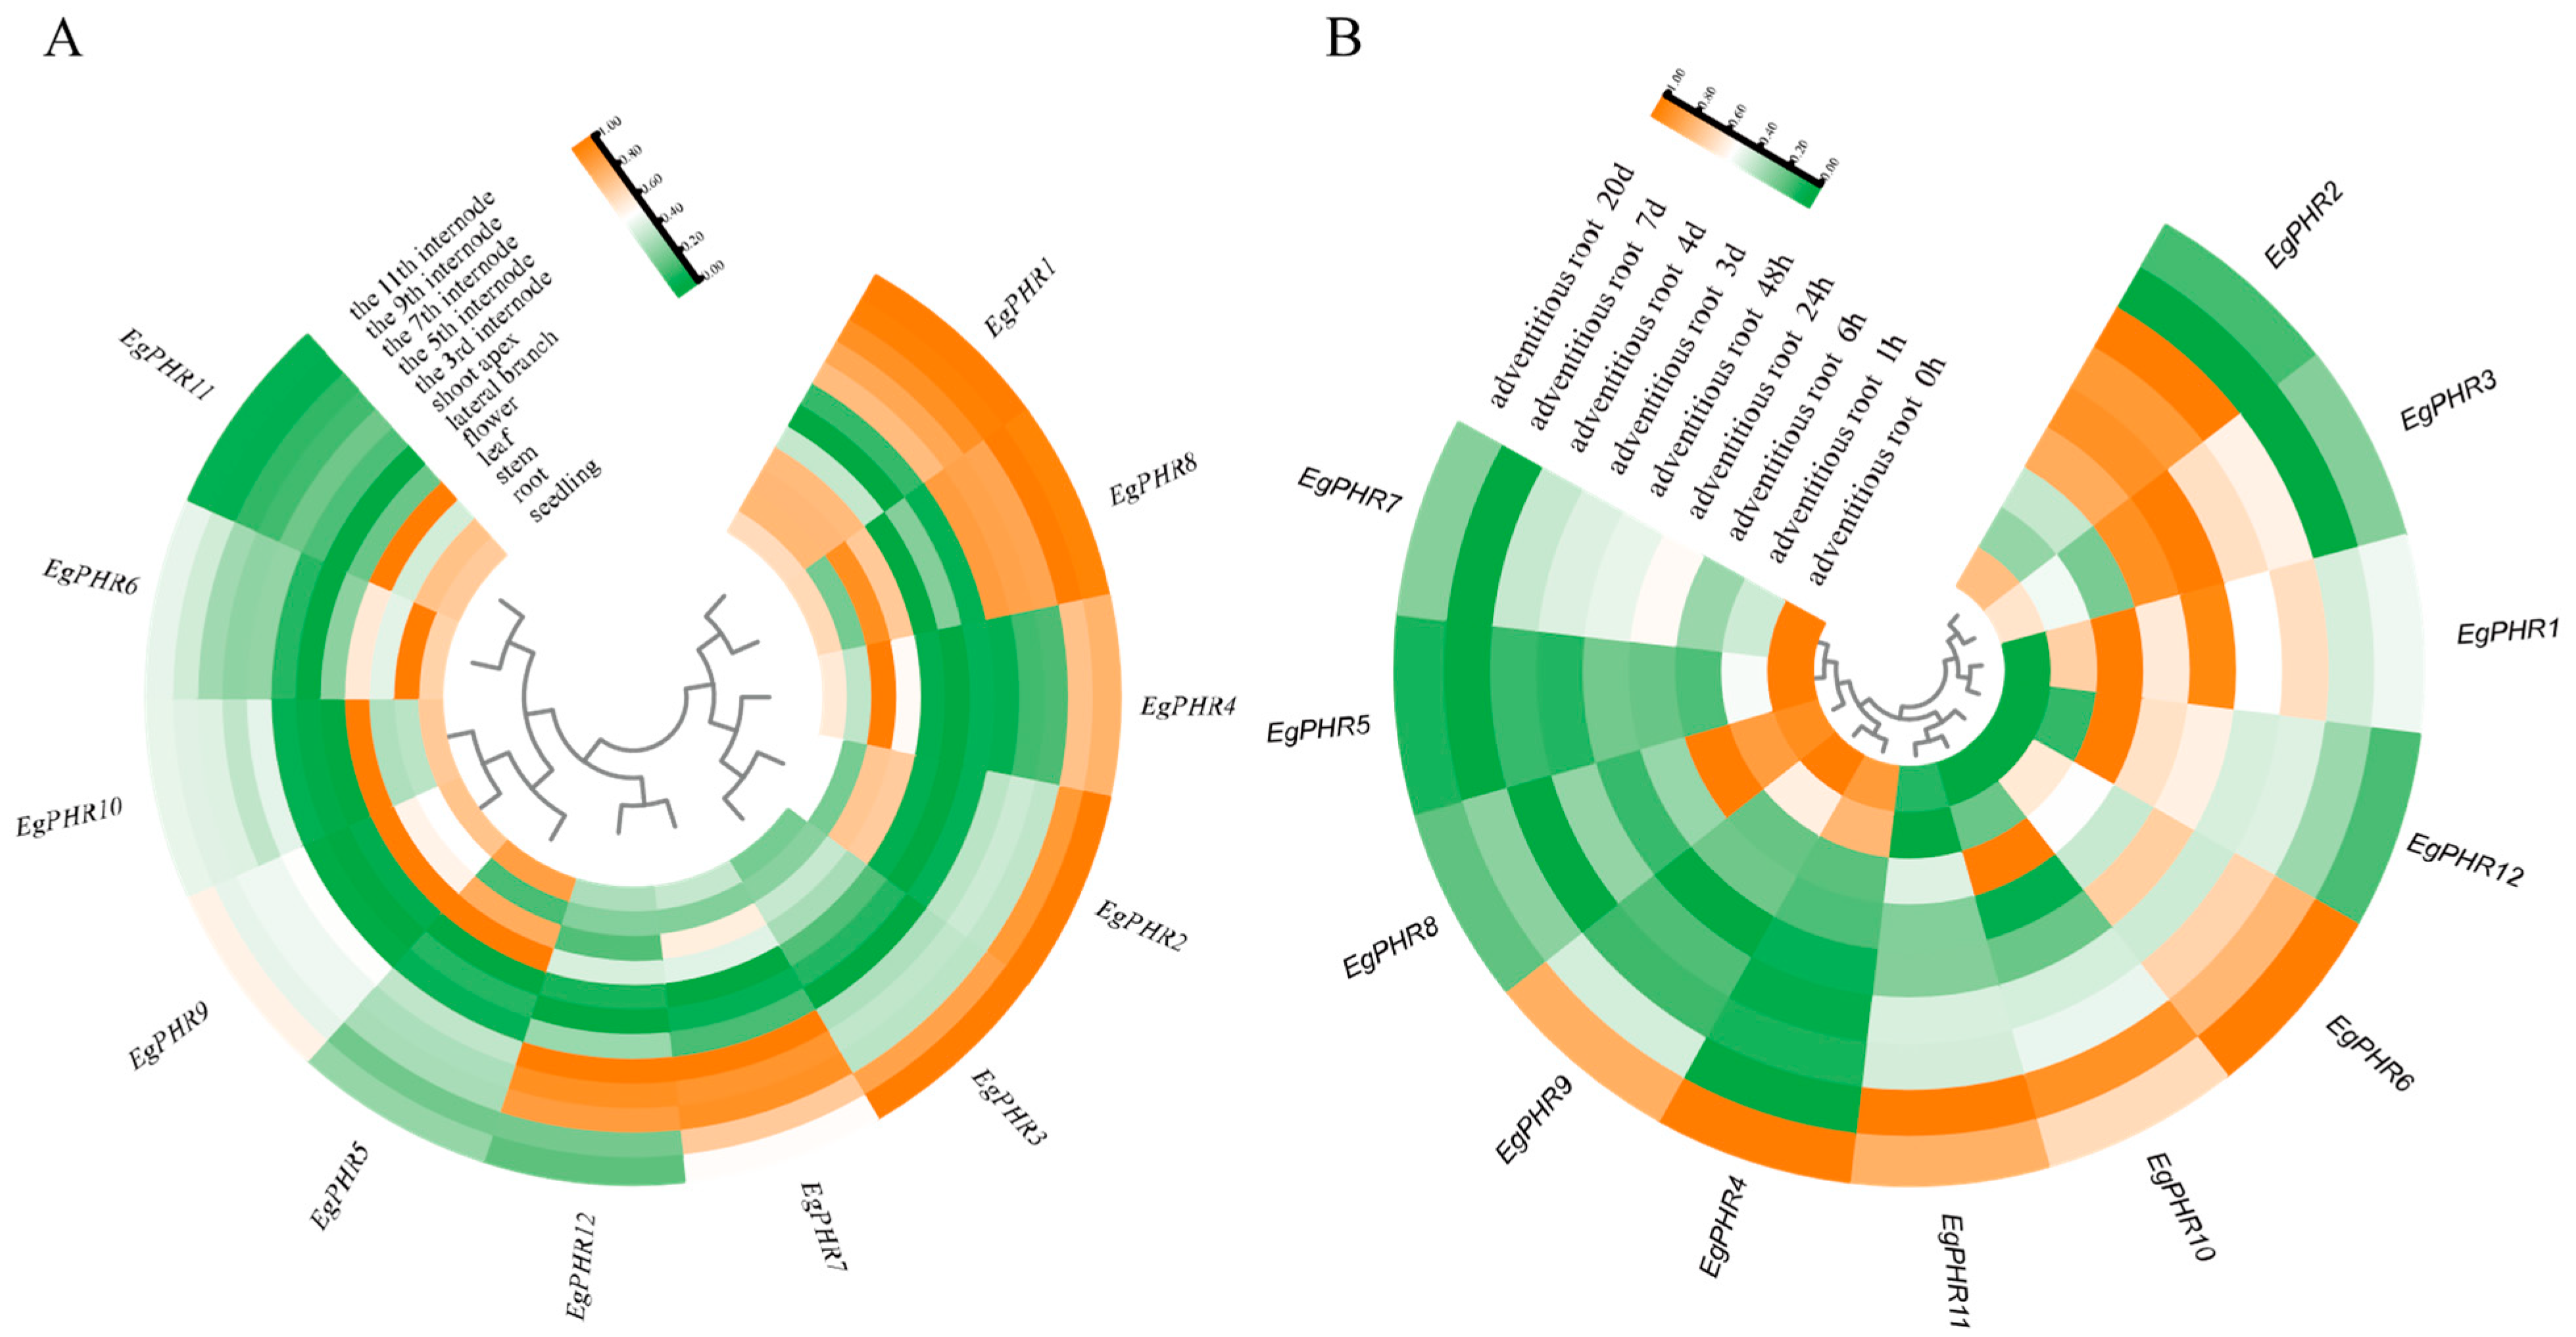
2.7. Gene Expression Patterns of EgPHRs in the Development of Different Tissues

To explore the potential role of EgPHRs, we analyzed the gene expression of EgPHRs in various tissues using transcriptome data from Eucalyptus grandis (Figure 6A, Table S8). The gene expression analysis showed that the expression of EgPHRs in different tissues such as seedlings, roots, stems, leaves, flowers, lateral branches, shoot apex, 3rd, 5th, 7th, 9th, and 11th internodes showed dynamic changes.
Generally, EgPHR1 and EgPHR8 clustered with each other and had a higher expression in nearly all tissues except for the flower, lateral branch, and shoot apex (Figure 6A). Notably, they were the only two EgPHRs that exhibited higher expression in all tested internodes. The slight difference between EgPHR1 and EgPHR8 was that EgPHR8 showed a lower expression in the root but expressed higher in the stem (Figure 6A). The EgPHR2, EgPHR3 and EgPHR4 all showed a higher expression in the 9th and 11th internodes (Figure 6A). The difference among these three EgPHRs was that EgPHR4 had the highest expression in the stem. EgPHR7 and EgPHR12 exhibited a higher expression in the 7th, 5th, and 3rd internodes. EgPHR5, EgPHR9 and EgPHR10 exhibited a relatively higher expression in the seedling and leaf. The slight difference was that EgPHR5 also showed a relatively higher expression in the stem. EgPHR6 and EgPHR11 showed a relatively higher expression in the seedling, root and leaf.
From each tissue aspect, EgPHR5 showed the highest expression, while EgPHR3 had the lowest expression in seedlings (Figure 6A). In roots, EgPHR6 had the highest expression level, and the other two EgPHRs (EgPHR1 and EgPHR11) also showed a relatively higher expression level (Figure 6A). Taken together with the fact that EgPHR6 and EgPHR1 were predicted to interact with EgSPXs, we speculate that EgPHR6 and EgPHR1 might play central roles in the Pi deficiency signaling. Three EgPHRs (EgPHR4, EgPHR5, and EgPHR8) increased their expression in stem, suggesting that these EgPHRs might be involved in regulating stem development (Figure 6A). Many EgPHRs such as EgPHR5, EgPHR9, EgPHR10, and EgPHR11 showed a higher expression in the leaf, indicating that EgPHRs might have important function in regulating leaf development (Figure 6A). All EgPHRs had a relatively lower expression in the lateral root and shoot apex, suggesting the EgPHRs might have limited roles in regulating the lateral root and shoot apex under normal conditions (Figure 6A). Seven EgPHRs (EgPHR1, EgPHR2, EgPHR3, EgPHR4, EgPHR7, EgPHR8, and EgPHR12) showed a higher expression in the development of different internodes. Overall, these results suggest that EgPHRs might play important roles in regulating the development of many Eucalyptus tissues.

2.8. Gene Expression Patterns of EgPHRs During the Adventitious Root Development

The proliferation of Eucalyptus depends on tissue culture, and the development of adventitious roots is one of the important characteristics of Eucalyptus production. To explore the potential function of EgPHRs in adventitious root (AR) development, we performed a gene expression analysis of EgPHRs using time-course (0 h, 1 h, 6 h, 24 h, 48 h, 3 days, 4 days, 7 days, and 20 days) transcriptome data during adventitious root development (Figure 6B, Table S9).
EgPHRs could be classified into three groups according to their gene expression pattern. The first group had five EgPHRs (EgPHR4, EgPHR5, EgPHR7, EgPHR8, and EgPHR9) (Figure 6B). They all had a higher expression in the control group, while showing a lower expression in many AR developmental stages (Figure 6B). There were several exceptions for these five EgPHRs. The first exception was EgPHR8, which had a higher expression at the 1 h and 6 h AR developmental stages (Figure 6B). The second exception was EgPHR9, which showed an increased expression at the 20-day AR developmental stage. The third exception was EgPHR4, which exhibited a higher expression at the 1 h and 20 days of AR developmental stage. The second group of EgPHR had three members (EgPHR6, EgPHR10, and EgPHR11) (Figure 6B). These three EgPHRs all had a higher expression at the 7-day and 20-day AR developmental stages, and with EgPHR10 also having an increased expression at the 6 h AR developmental stage (Figure 6B). The last group of EgPHRs were EgPHR1, EgPHR2, EgPHR3, and EgPHR12. These four EgPHRs showed a higher expression at the 6 h (EgPHR12), 24 h (EgPHR2 and EgPHR3), 48 h (EgPHR1, EgPHR2, and EgPHR3), 3-day (EgPHR2) and 4-day (EgPHR2) AR developmental stages (Figure 6B). Overall, these results suggest that EgPHRs might play an important role in AR development in Eucalyptus grandis.

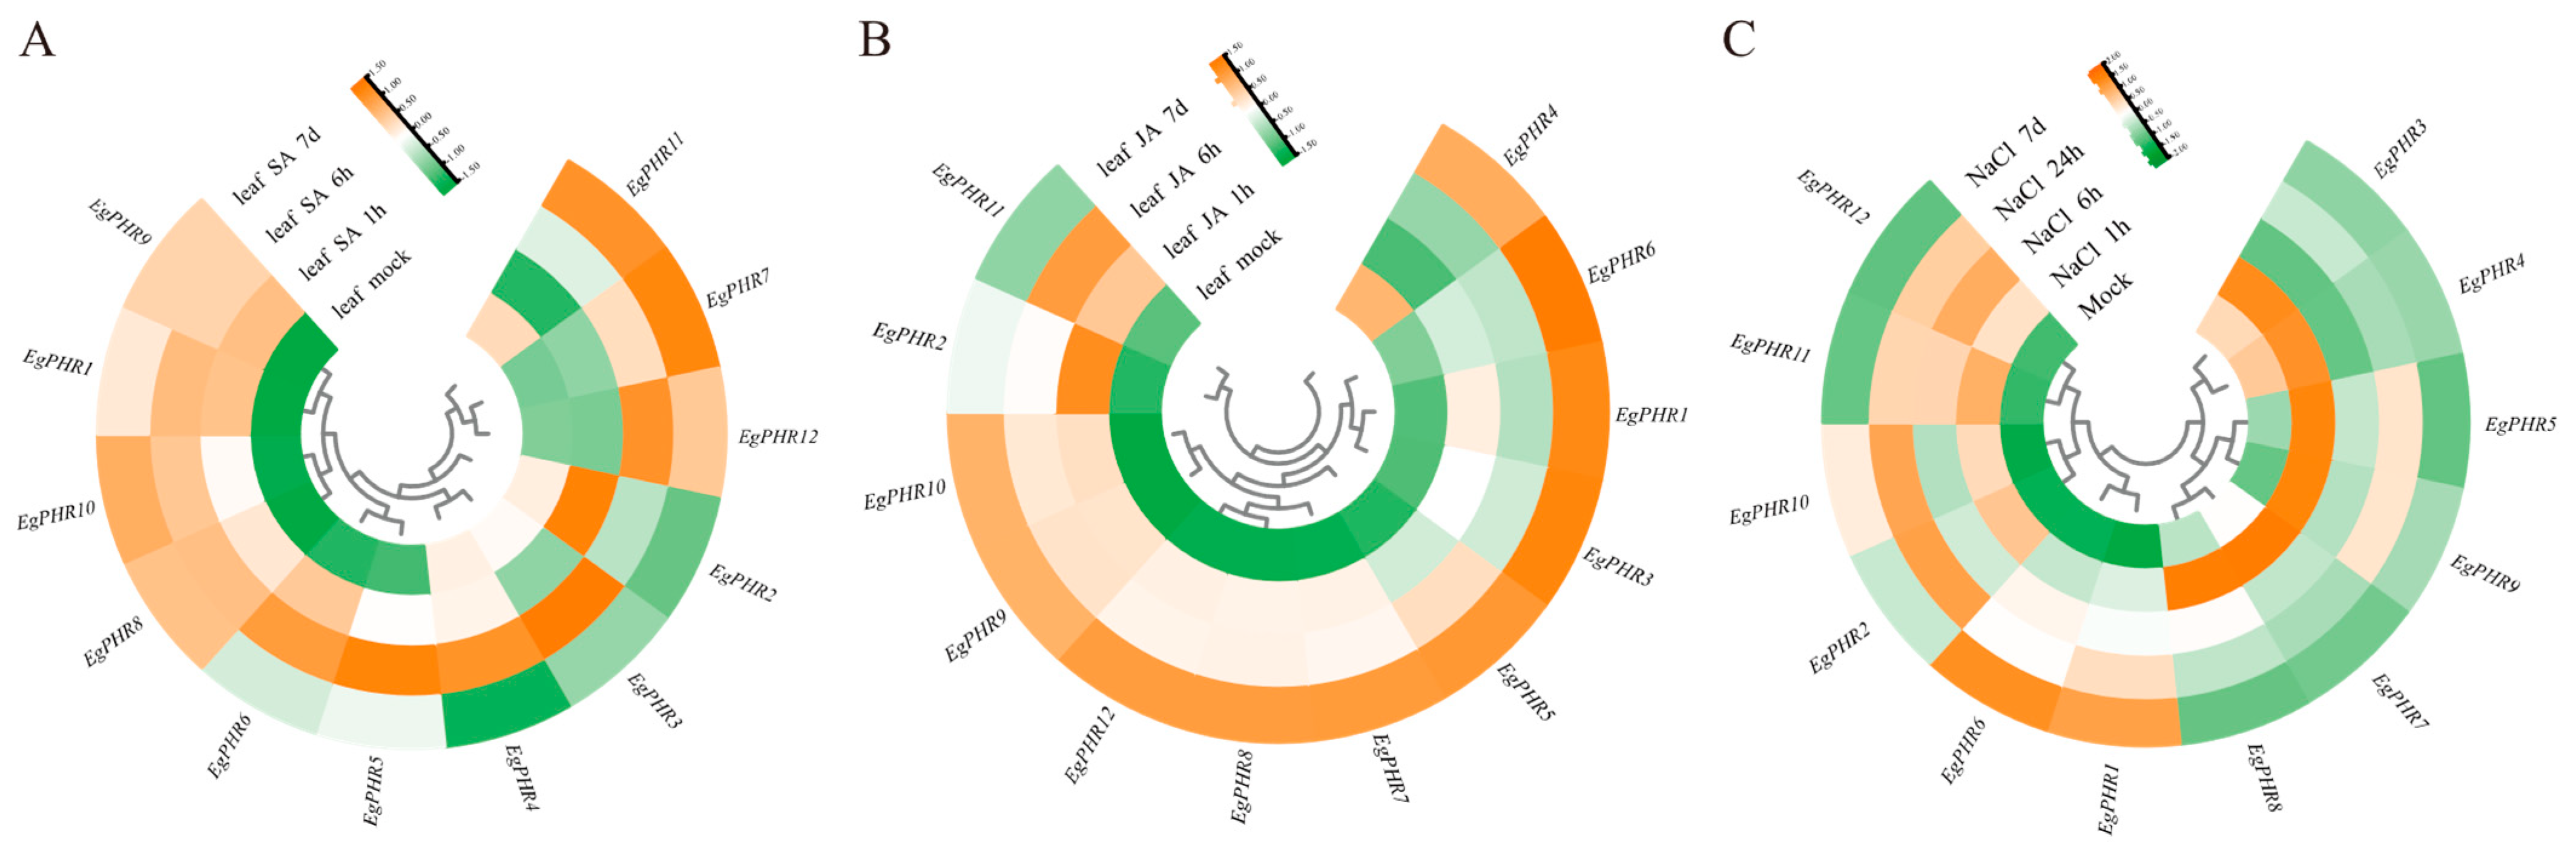
2.9. Gene Expression Pattern of EgPHRs Under SA and JA Treatment

Pathogens threaten Eucalyptus growth and reduce the productivity of Eucalyptus plantations [31]. Two plant hormones, salicylic acid (SA) and jasmonic acid (JA), trigger plant immunity to defend against pathogen infection [31]. To understand whether EgPHRs were also involved in the regulation of Eucalyptus immunity, a gene expression analysis of EgPHRs in response to SA (leaf mock, 1 h, 6 h, and 7 d) and JA (leaf mock, 1 h, 6 h, and 7 d) was conducted with transcriptome data, respectively (Figure 7A, Table S10, Figure 7B, Table S11).
EgPHRs could be classified into eight groups according to their expression pattern under the SA treatment (Figure 7A). The first group contained four EgPHRs (EgPHR1, EgPHR8, EgPHR9, and EgPHR10), and they showed a higher expression under all SA treatment conditions (Figure 7A). The second group had EgPHR5 and EgPHR6, and their expression was highly induced after 6 h of SA treatment (Figure 7A). The EgPHR3 and EgPHR4 constituted the fourth group, and they also had a higher expression after 6 h of SA treatment, while having a lower expression after 7 days of SA treatment (Figure 7A). EgPHR2 was the only member in the fifth group, and it showed the highest expression after 1 h of SA treatment (Figure 7A). The sixth group only had EgPHR12, and its expression was induced after 6 h and 7 days of SA treatment. EgPHR7 and EgPHR11 were the only members in the seventh and eighth group, respectively (Figure 7A). They all showed a high expression after 7 days of SA treatment, while EgPHR11 also showed a decreased expression after 1 day of SA treatment. Overall, these results suggest that all EgPHRs might be involved in response to SA in Eucalyptus.
Similarly, EgPHRs could be classified into four groups according to their expression pattern under the JA treatment (Figure 7B). The first group only had one member, EgPHR11, which showed the highest expression after 6 h of JA treatment. EgPHR2 was the only member of the second group, and it showed the highest expression after 1 h of JA treatment (Figure 7B). The third group presented nine EgPHRs (EgPHR1, EgPHR3, EgPHR5, EgPHR6, EgPHR7, EgPHR8, EgPHR9, EgPHR10, and EgPHR12), and their expression was significantly induced after 7 days of JA treatment (Figure 7B). EgPHR4 was the only member of the last group, and it showed a higher expression under control and EgPHR4 (Figure 7B). Overall, these results suggest that all EgPHRs might be involved in response to JA, especially under long-term JA treatment in Eucalyptus.

2.10. Gene Expression Pattern of EgPHRs Under Salt Stress

Salt stress is one of the major environmental stresses that limit plant growth and productivity [32,33]. To understand how EgPHRs respond to salt stress, the gene expression of EgPHRs was analyzed using transcriptome data in time-course salt-stress experiments (mock, 200 mM NaCl treatment for 1 h, 6 h, 24 h, and 7 days) (Figure 7C).
EgPHRs could be classified into four groups according to their expression pattern under salt stress. Four EgPHRs (EgPHR2, EgPHR10, EgPHR11 and EgPHR12) showed a relatively higher expression after 1 h (EgPHR2, EgPHR10, EgPHR11 and EgPHR12), 6 h (EgPHR11 and EgPHR12), or 24 h (EgPHR2, EgPHR10, EgPHR11 and EgPHR12) of salt stress (Figure 7C). The EgPHR1 and EgPHR6 together formed the second group; their expression was highly induced under 7 days of salt stress (Figure 7C). The third group comprised four EgPHRs (EgPHR5, EgPHR7, EgPHR8 and EgPHR9), and they were highly induced under 1 h of salt stress (Figure 7C). The last group only contained EgPHR3 and EgPHR4, and they were highly expressed under control and 1 h of salt stress (Figure 7C). Overall, these results suggest that all of EgPHRs might respond to salt stress at the transcriptional level in Eucalyptus.

2.11. Gene Expression Pattern of EgPHRs Under Cold Stress

Eucalyptus plants are sensitive to cold damage, and cold stress is one of the main environmental stresses that permanently reduce the development and productivity of Eucalyptus plantations [34]. To test whether EgPHRs are involved in cold tolerance in Eucalyptus, gene expression analyses of EgPHRs were performed using RT-qPCR experiments with the leaves from seedlings under 24 h at 4 °C (cold stress) or 25 °C (control) conditions in Eucalyptus grandis (Figure 8A–L). Briefly, eight EgPHRs (EgPHR1, EgPHR2, EgPHR3, EgPHR4, EgPHR5, EgPHR6, EgPHR9, and EgPHR11) showed significant (p < 0.05) gene expression changes under cold stress (Figure 8A–F,I–K). Notably, cold stress significantly (p < 0.05) induced mRNA accumulation level of six EgPHRs (EgPHR1, EgPHR2, EgPHR3, EgPHR4, EgPHR5, and EgPHR6) (Figure 8A–F). Conversely, two EgPHRs, EgPHR9 and EgPHR11, significantly (p < 0.05) reduced the mRNA accumulation level under salt stress (Figure 8I,K). Therefore, cold stress indeed affected the gene expression of many EgPHRs at the transcriptional level.

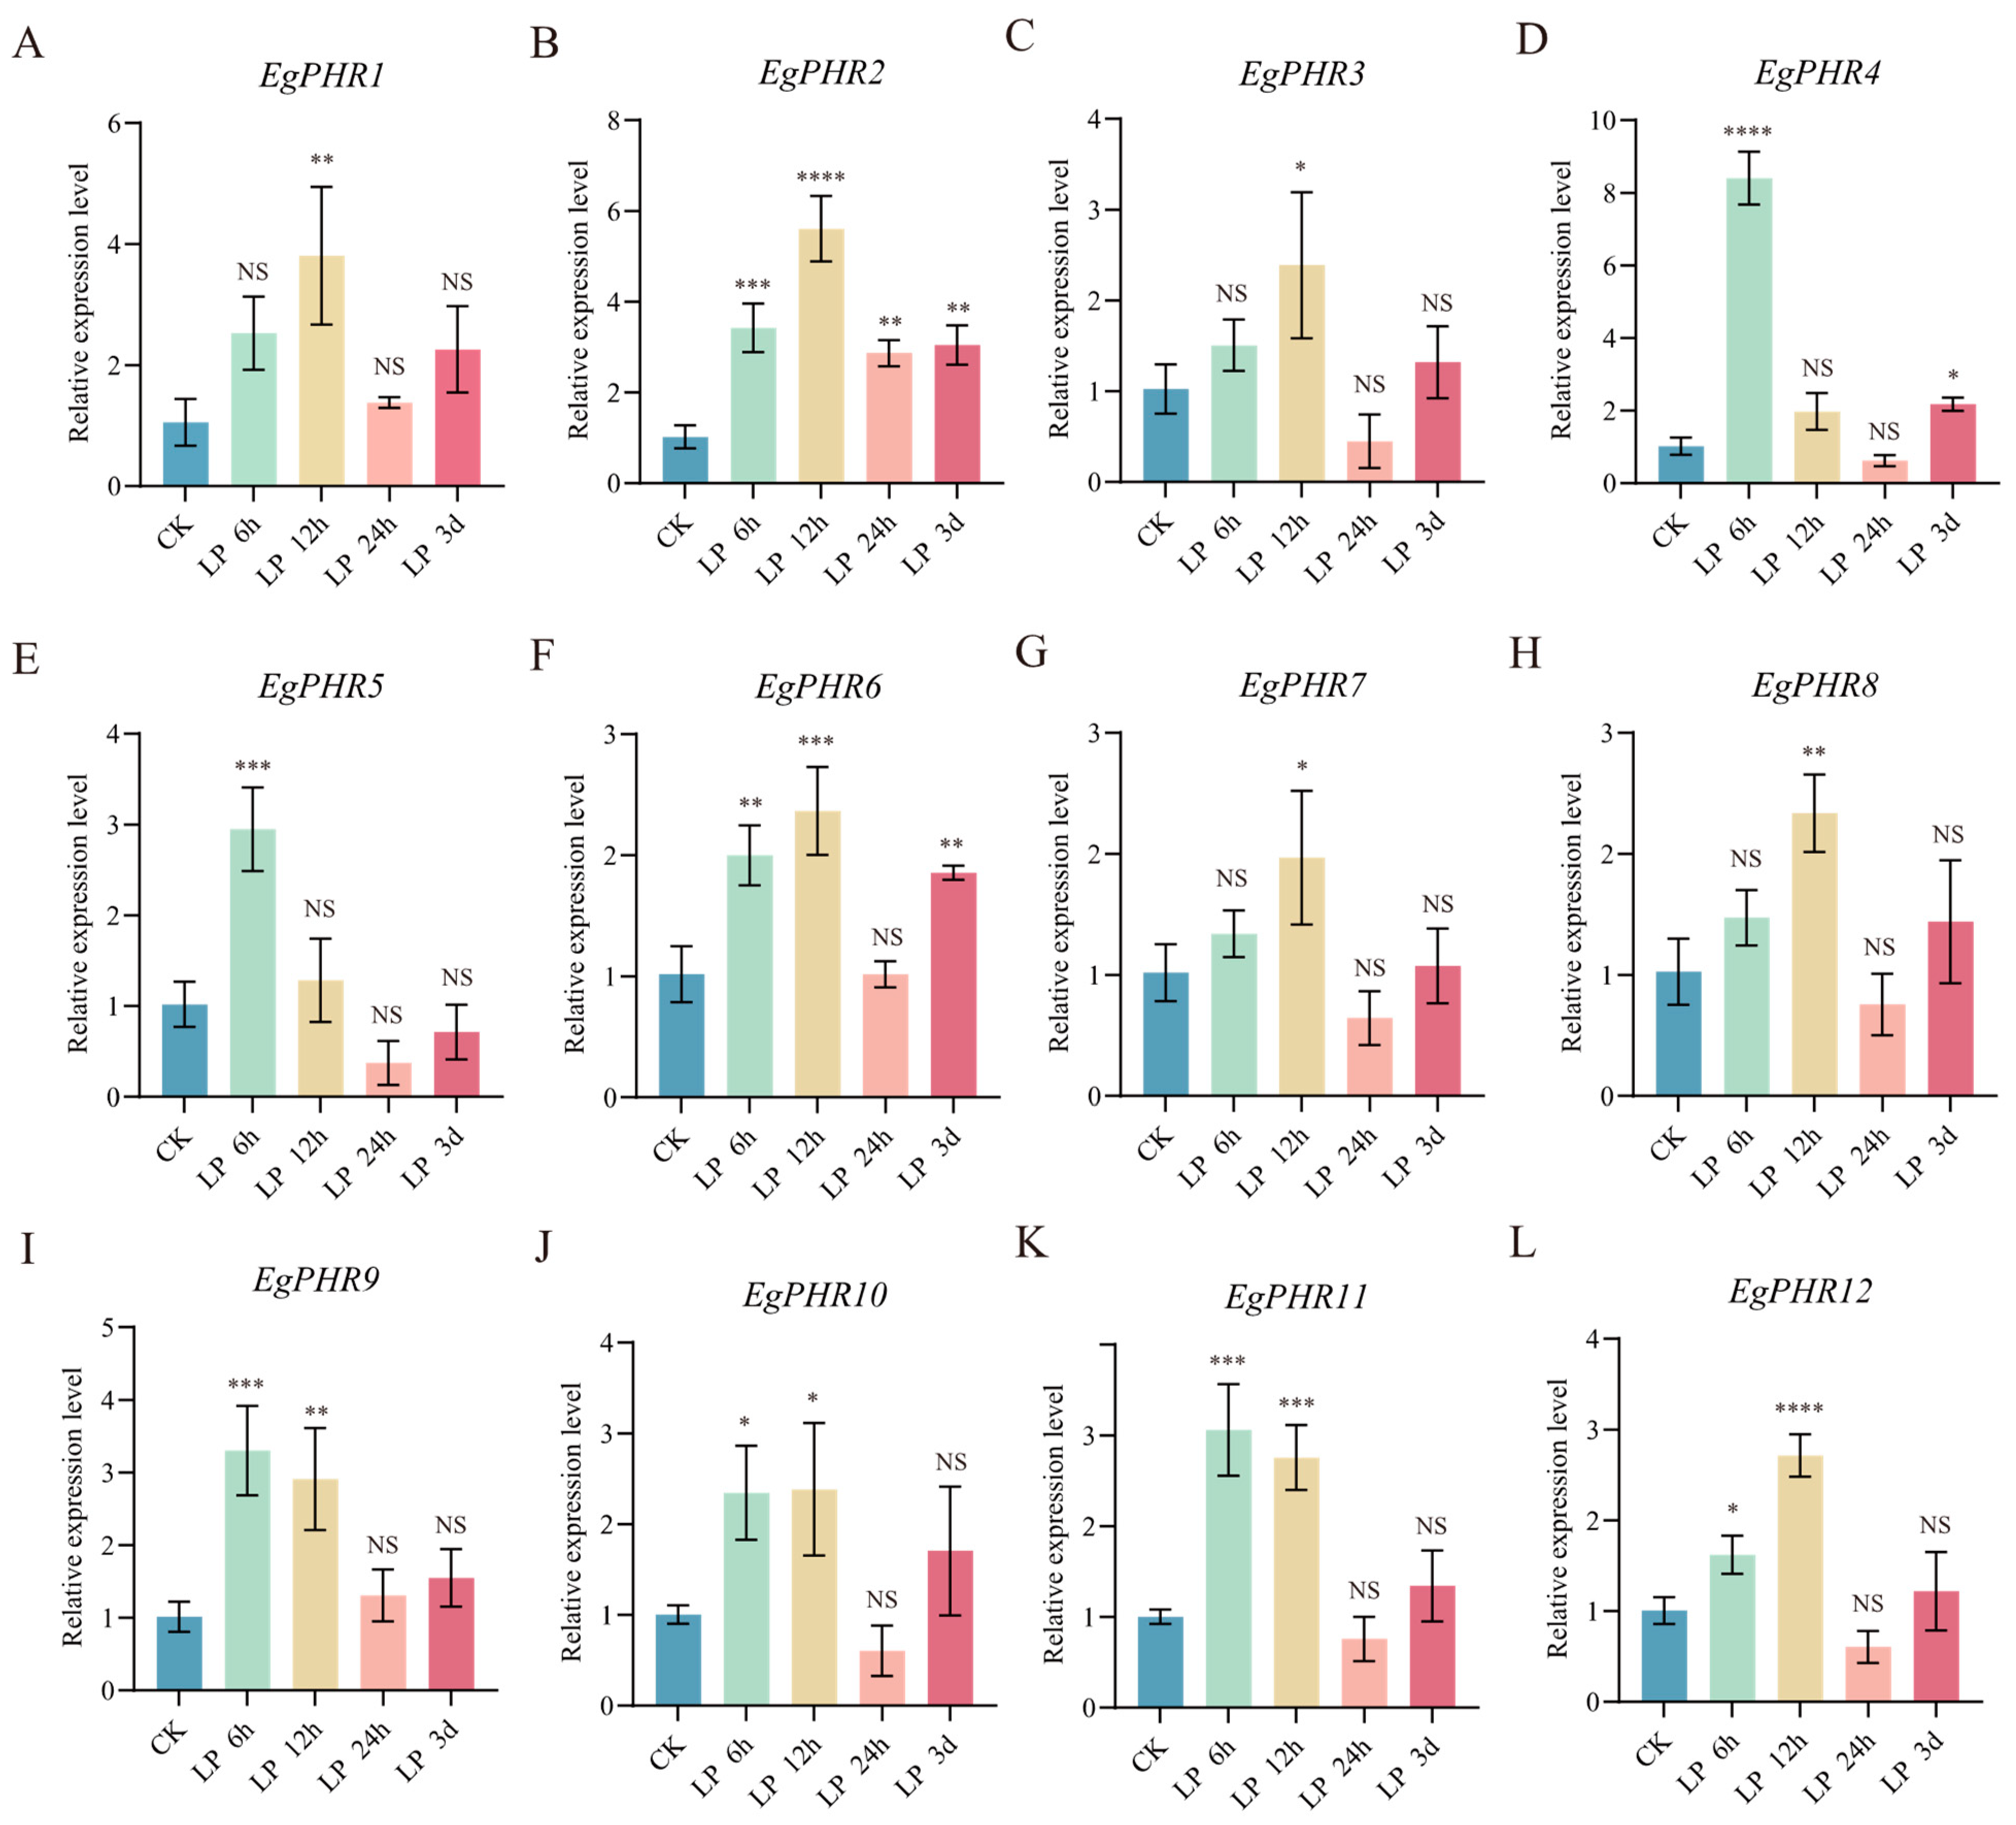
2.12. Gene Expression Pattern of EgPHRs Under Low-Phosphate Starvation

To investigate the role of EgPHRs in response to Pi starvation, a gene expression analysis of EgPHRs was performed using RT-qPCR experiments using the roots under different time-courses of Pi starvation (control: 0.5 mM KH2PO4; Pi starvation, LP: 0.005 mM KH2PO4 treatment for 6 h, 12 h, 24 h, and 3 days).
Generally, Pi starvation induced the expression of all EgPHRs in at least one LP condition (Figure 9A–L). After 6 h of LP condition, Pi starvation significantly (p < 0.05) induced the expression of eight EgPHRs (EgPHR2, EgPHR4, EgPHR5, EgPHR6, EgPHR9, EgPHR10, EgPHR11, EgPHR12) (Figure 9B,D,E,F,I–L), and five EgPHRs (EgPHR2, EgPHR4, EgPHR5, EgPHR9, and EgPHR11) dramatically increased their expression (p < 0.001) (Figure 9B,D,E,J,L). Similarly, LP induced most EgPHRs’ (nine EgPHRs: EgPHR1, EgPHR2, EgPHR6, EgPHR7, EgPHR8, EgPHR9, EgPHR10, EgPHR11, and EgPHR12) expression under a 12 h LP treatment conditions (Figure 9A,B,F–L). Among them, four EgPHRs (EgPHR2, EgPHR6, EgPHR11, and EgPHR12) had dramatically (p < 0.001) increased gene expression after 12 h of LP treatment (Figure 9B,F,K,L). Interestingly, EgPHR2 was the only EgPHR that increased its expression under a 24 h LP treatment. Similarly, LP induced the expression of only three EgPHRs (EgPHR2, EgPHR4 and EgPHR6) after 3 days of LP treatment (Figure 9B,D,F). Notably, EgPHR2 was the only EgPHR that was induced by LP under all treatment conditions, and EgPHR6 was the next EgPHR that was regulated by LP under three of the four LP treatment conditions (Figure 9). Overall, these results suggest EgPHRs indeed play a vital role in coping with Pi starvation.

2.13. Gene Expression Pattern of EgPHRs Under Nitrogen Starvation

Nitrogen and phosphate interact with each other, and the addition of nitrate can partially rescue the Pi starvation phenotype [1,35]. To understand whether nitrogen starvation also affects the Pi starvation response, the gene expression of EgPHRs was analyzed by RT-qPCR using the root tissues under nitrogen starvation conditions (control: 10 mM KNO3, nitrogen starvation, −N: 0 mM KNO3 for 2 h and 24 h). Generally, nitrogen starvation significantly affected the gene expression of all EgPHRs except EgPHR2 and EgPHR9 (Figure 10). Nitrogen starvation only significantly (p < 0.05) induced the gene expression of EgPHR5 but not other EgPHRs after 2 h of nitrogen starvation (Figure 10E). Conversely, nitrogen starvation significantly (p < 0.05) repressed the expression of all EgPHRs except EgPHR2 and EgPHR9 after 24 h of nitrogen starvation (Figure 10). Overall, nitrogen starvation might negatively regulate the gene expression of EgPHRs at the transcriptional level.

2.14. Gene Expression Pattern of EgPHRs Under Boron Deficiency

Boron deficiency greatly reduces the forest productivity by repressing the development of the shoot apex, leading to the top dieback and leaf chlorosis [36]. Boron (B) and P might interact with each other. To test whether B could affect the Pi signaling, the gene expression of EgPHRs was assessed via time series experiments in Eucalyptus (leaves: mock, 6 h, 24 h, 2 days, 4 days, and 21 days; roots: mock, 6 h, 24 h, 2 days, 4 days, and 21 days) (Figure S4, Table S12).
Generally, EgPHRs could be classified into six groups according to their expression pattern under B deficiency. The first group only contained EgPHR10, which showed the highest expression in leaves under a 6 h B deficiency treatment (Figure S4). EgPHR6 was the only member of the second group and showed the lowest expression in roots after 24 h, 2 days, and 4 days) (Figure S4). The third group had seven EgPHRs (EgPHR1, EgPHR2, EgPHR3, EgPHR4, EgPHR5, EgPHR7, and EgPHR9), and they showed a relative higher expression in leaves after 6 h, 24 h, 2 days, 4 days, or 21 days of B deficiency treatment (Figure S4). EgPHR12 was the only member in the fourth group and increased its expression in roots under the B deficiency treatment (Figure S4). The fifth group only contained EgPHR11, which showed the highest expression in roots under control and decreased expression in roots under B deficiency treatment (Figure S4). EgPHR8 was the only member of the last group. Its expression was suppressed in leaves after 6 h, 24 h, and 2 days of B deficiency treatment, which increased its expression in roots after 2 days and 21 days of B deficiency treatment (Figure S4). Overall, these results suggest that boron deficiency might also regulate the gene expression of EgPHRs at the transcriptional level.

3. Discussion

Sessile plants are subject to many environmental stresses throughout their life cycle, including nutrient deficiencies [37,38]. As a result, plants must coordinate their complex growth with nutrient availability. Phosphorus is an essential macronutrient for all eukaryotes, but how woody plants adapt to phosphorus deficiency remains largely unclear [1]. Eucalyptus is one group of the important hardwoods, and is an important source of wood, furniture, and pulp worldwide due to its fast growth rate, short rotation period (Eucalyptus plantations are typically managed under short rotation cycles of 5–7 years to maximize biomass yield through rapid growth and frequent harvesting in intensive silvicultural systems), and good wood properties [39]. Therefore, characterization of PHR transcription factors will provide important genetic information for engineered high-phosphate use efficiency (PUE) Eucalyptus plants.
A total of twelve EgPHRs were characterized in Eucalyptus grandis. The number of EgPHRs were dramatically reduced compared to PHRs from the grass species (14~42 PHRs in Arabidopsis, brachypodium, sorghum, Zea mays, G. arboreum, G. raimondii, G. hirsutum, and G. barbadense) and the woody plant species (21~22 in tea plants and poplar) (Table 1 and Table S1) [17,18,19,20]. The only exception was rice PHRs (12 PHRs) [17]. It would be very interesting to analyze further in the future why fast-growing species have few PHRs, and the implication of that on high-PUE efficiency.
Phylogenetic analyses from Eucalyptus, Arabidopsis, rice, and poplar revealed that PHR proteins could be classified into three groups. The group I PHRs had the most well-studied PHRs that respond to Pi deficiency from model plants, including AtPHR1, AtPHL1, and OsPHR2 (Figure 1) [1,28]. Six Eucalyptus PHRs including EgPHR1, EgPHR2, EgPHR4, EgPHR6, EgPHR9, and EgPHR10 belonged to group I PHRs (Figure 1). Taken together with the fact that EgPHR1 and EgPHR6 interacted with SPXs in the protein–protein interaction analysis and the expression of EgPHR1, EgPHR2, EgPHR6, and EgPHR10 were induced under Pi deficiency (Figure 6A), we then speculated that group I PHRs might also be involved in regulating Pi signaling in Eucalyptus. Notably, all group I EgPHRs had a unique motif (LAKYMPDSSE) (Figure 2B, Table S2), and it will be interesting to test in the future whether this motif play an important function on the regulation of EgPHR-mediated Pi signaling.
Group II PHRs comprised the smallest subset, with three EgPHR members (EgPHR3, EgPHR5, and EgPHR7) belonging to this category (Figure 1). Functional characterization has been reported for two genes within that group. The GARP-type transcription factor MYR2 (At3G04030) negatively regulates nitrogen reutilization in Arabidopsis by suppressing asparagine synthetase 1 (ASN1) expression, thereby delaying nutrient starvation- and dark-induced leaf senescence under light–dark cycles in vascular tissues [40]. MYR1 (At5G18240) and MYR2 are associated with light intensity responses, repressing flowering and organ elongation under low-light conditions through the inhibition of GA20ox2 expression, which modulates bioactive gibberellin levels [41]. These findings suggest that group II EgPHRs may also play important roles in light-regulated nitrogen reutilization and organ elongation processes.
The Arabidopsis PHR1 family members form two distinct regulatory modules: PHR1/PHL1 primarily drives core phosphate starvation responses (PSR) by activating phosphate uptake genes and maintaining phosphorus homeostasis under Pi deficiency, while PHL2/PHL3 modulates growth regulation under normal conditions and fine-tunes stress adaptation through synergistic or antagonistic interactions with PHR1/PHL1 [19]. Structural divergence underpins their functional specialization—PHR1/PHL1 dimerizes via N-terminal extensions to activate P1BS-dependent PSR pathways, whereas PHL2/PHL3’s unique C-terminal domains restrict interactions to their own cluster, enabling the coordinated regulation of secondary metabolism and chromatin remodeling [19]. Given that Eucalyptus grandis’s Group III PHRs (EgPHR8, EgPHR11, and EgPHR12) share phylogenetic clustering with Arabidopsis PHL1/PHL3 (Figure 1), these EgPHRs may balance growth–stress trade-offs through structural adaptations in N-/C-terminal domains, potentially mediating species-specific PSR strategies in woody plants.
Phosphate and nitrate are two of the most important mineral nutrients for plant development and productivity [1]. More importantly, a proper N:P ratio is critical for plant growth [42]. Previous studies from Arabidopsis and rice have suggested that plants adopt a NRT1.1-SPX module to simultaneously regulate the nitrate and phosphate deficiency signaling [43]. Briefly, OsNRT1.1B interacts with OsSPX4, and OsSPX4 is the negative regulator for OsPHR2 and OsNLP3 [43]. Similarly, a study in Arabidopsis proved that ~85% of phosphate starvation response genes had their expression dependent on nitrate [35]. Therefore, nitrate regulates the expression of phosphate starvation responses genes. In this study, low nitrogen availability significantly suppressed the expression of nine EgPHRs (including EgPHR6 and EgPHR10) in roots (Figure 10), demonstrating that nitrogen promotes phosphorus-related responses in Eucalyptus, and the repression of PHR expression under nitrogen deficiency aligns with observations in other species such as Arabidopsis. Notably, EgPHR6 and EgPHR10 were also induced by Pi deficiency (Figure 9). Therefore, nitrogen might interact with phosphate starvation responses in Eucalyptus. The hypothesis were further supported by an observation that nitrate-associated transcription factor NLP6’s binding sites were characterized in the promoter of EgPHR10 (Figure 4, Table S5). This result further proves that N and P might interact with each other in Eucalyptus. A future functional analysis might be performed to further prove whether the EgNLP6-EgPHRs module might regulate the Eucalyptus N–P balance.
The interaction between boron (B) and phosphate (P) exhibits both antagonistic and synergistic relationships depending on plant species and environmental conditions [44,45,46,47]. Notably, in this study, B deficiency suppressed the expression of EgPHRs in roots, potentially due to disrupted P transport systems or competitive absorption dynamics (Figure S4). However, B paradoxically upregulated certain EgPHRs homologs in leaves, suggesting a compensatory adaptation to maintain P homeostasis under B deficiency (Figure S4). This dual regulation aligns with prior findings: B and P interactions involve shared transport pathways (e.g., competitive inhibition in tomato and maize), while moderate P availability enhances B uptake by improving rhizosphere conditions and transpiration-driven absorption (e.g., in Brassica napus) [45,46,47]. Extreme B deficiency or toxicity exacerbates P imbalance, as seen in Vicia faba and groundnuts, whereas excessive P fertilization reduces B accumulation [44], highlighting their tightly coupled yet antagonistic roles in nutrient dynamics. The observed tissue-specific EgPHR expression in Eucalyptus grandis under B deficiency may reflect evolutionary strategies to optimize P utilization under fluctuating nutrient stresses, consistent with the conserved PHR-mediated crosstalk between environmental cues and nutrient signaling.
The interplay between jasmonate (JA) and phosphate signaling converges on phosphate starvation response’s (PHR) transcription factors as evolutionary conserved regulatory hubs. In this study, prolonged exogenous JA treatment induced the upregulation of 11 EgPHRs in Eucalyptus grandis (Figure 7B), likely reflecting an adaptive strategy to enhance P acquisition/utilization efficiency under JA-mediated stress responses. This aligns with mechanistic insights from other species: Arabidopsis PHR1 coordinates JA signaling by interacting with JAZ repressors and MYC2 to activate JA-responsive genes (e.g., anthocyanin biosynthesis), while tea plant’s CsPHRs integrate P signaling with JA pathways through JAZ degradation-triggered activation of the secondary metabolism [48,49]. However, functional specialization among the 11 EgPHRs in Eucalyptus requires further investigation to clarify their roles in balancing JA-mediated defense and P homeostasis.
Phosphate represses plant height in grass including Arabidopsis and rice as well as woody plants such as poplar and Chinese fir [1,50,51,52]. However, the molecular mechanism of how Pi regulates cell cycle and shoot apex remain unclear. In particular, it is still not known whether the functions between woody and grass PHRs are different from each other. In this study, the promoter analysis and protein–protein analysis both showed that Eucalyptus PHRs might have different functions compared to grass PHRs (Figure 4 and Figure 5). The promoter analysis revealed that tissue differentiation and cell-cycle-related transcription factors such as WUS, KNOX1, WOX13, and WUS had binding sites in the promoters of EgPHRs (Figure 5C). WUS is the critical regulator that modulates the cell fate determination in plants [53,54]. KNOX1 is an important transcription factor in tissue differentiation and cell cycle, and the loss of KNOX1 leads to failure of the Shoot Apical Meristem (SAM) establishment [55]. KNOX1 also functions on the generation of diploid plants [55]. WOX13 negatively regulates the SAM formation of WUS [56]. SIP1 has been reported to be upregulated in spindle cell carcinoma of the head and neck in human [57]. RAX1 is required for the diploid bipolar budding pattern in budding yeast [58]. Therefore, tissue differentiation and cell-cycle-related transcription factors might regulate the gene expression of EgPHRs. BSL1 regulates cell fate asymmetry and leads the mother cell to produce daughter cells with different fate during mitosis [59]. KCBPs play important roles in the spindle microtubule convergence in anaphase to ensure that each sister chromosome group has coherence kinetochore-fibers [60]. In this study, the protein–protein interaction analysis unveiled that all EgPHRs except EgPHR7 and EgPHR8 could interact with TRAFAC class myosin-kinesin ATPase superfamily proteins such as BSL1, KCBP1, KLP1, and KLP2 in Eucalyptus (Figure 5A). Similar observation was also identified in the protein–protein interaction analysis of poplar PHRs (Figure S3B). In addition, EgPHRs also interacted with DIVARICATA-like and WUSCHEL-like proteins (Figure 5C). Therefore, we speculated that PHRs might also be involved in tissue differentiation and cell-cycle regulation in woody plants. However, these results originated from either cis-elements’ screening or interacting based on the protein’s amino acid sequences. Functional analyses will be required to further prove the hypothesis that woody plant PHRs might differ from grass PHRs and modulate the cell cycle and tissue differentiation. Overall, our results suggest that EgPHRs may play an important role in development, abiotic stress tolerance, and mineral nutrient starvation adaptation.

4. Materials and Methods

4.1. Characterization of EgPHRs in Eucalyptus grandis

The Eucalyptus grandis genomic dataset utilized in this investigation was acquired from the NCBI Sequence Read Archive under the whole-genome sequencing (WGS) project JABKBJ01. For the systematic identification of PHR family proteins in Eucalyptus grandis, two specialized Hidden Markov Model (HMM) profiles—Myb_CC_LHEQLE (PF14379.9) and Myb_DNA-binding (PF00249.34)—were retrieved from the Pfam protein family database (http://pfam-legacy.xfam.org/) (accessed on 21 August 2024). These conserved domain profiles were subsequently employed in HMMER software (v3.0) to perform comprehensive a genome-wide screening and characterization of potential EgPHR candidates through sequence alignment and domain architecture analysis [61].
The candidate EgPHR proteins were then submitted to three different databases: NCBI-Batch CD-search (https://www.ncbi.nlm.nih.gov/Structure/bwrpsb/bwrpsb.cgi) (accessed on 21 August 2024), Pfam (http://pfam-legacy.xfam.org/) (accessed on 21 August 2024), and SMART (https://smart.embl.de/) (accessed on 21 August 2024) to verify its conserved domain. Proteins with all two conserved domains (Myb_CC_LHEQLE and Myb_DNA binding) were considered as EgPHR proteins. Subsequently, comprehensive physicochemical characterization was performed via ExPASy ProtParam (https://web.expasy.org/protparam/) (accessed on 21 August 2024), quantifying critical biochemical parameters including amino acid composition, molecular mass (kDa), theoretical isoelectric point (pI), grand average of hydropathicity (GRAVY), and instability index to assess structural stability [61]. Subcellular localization was predicted by Plant-mPLoc (http://www.csbio.sjtu.edu.cn/bioinf/plant-multi/#) (accessed on 21 August 2024).

4.2. Phylogenetic Analysis

The PHR amino acid sequences of Arabidopsis were downloaded from TAIR (https://www.arabidopsis.org/) (accessed on 22 August 2024) and the amino acid sequences of Populus trichocarpa and Oryza sativa were downloaded from the Phytozome database (https://phytozome-next.jgi.doe.gov/) (accessed on 22 August 2024), respectively. Pairwise sequence comparison of these three species with Eucalyptus grandis PHR protein was performed using MEGA7.0. After a comparison using Quick Run TrimAL tool from TBtools (v2.154) [62], the sequence was pruned to achieve maximum likelihood evolutionary tree construction (1000 replicates of a bootstrap analysis) and the evolutionary tree was beautified on the ITOL website (https://itol.embl.de/) (accessed on 23 August 2024).

4.3. Conserved Domains, Motifs, and Gene Structure Analysis

A multi-sequence comparison of EgPHR proteins was performed using DNAman8 software [63]. We uploaded the EgPHR protein sequences to the MEME webpage—MEME Suite (https://meme-suite.org/meme/) (accessed on 24 August 2024), set the number of patterns we wanted to discover to 10, and clicked the MAST XML output to download the results. We then extracted the annotation information of EgPHRs and visualized the gene structure using the GSDS website (https://gsds.gao-lab.org/index.php) (accessed on 24 August 2024).

4.4. Duplication Event Analysis and Multi-Species Analysis of Covariance

A self-comparison of protein sequences from Eucalyptus grandis were conducted using the Blast Compare Two Seqs module from TBtools [62]. We used Quick run MCScanX Wrapper (a built-in tool for TBtools) to obtain a link file of the relationships between genes and visualized them with the Circle Gene View. A multi-species analysis of the covariance between rice, Arabidopsis, Populus trichoria, and Eucalyptus was conducted and visualized using one-step MCScanX-Ultrafast and Dual System Diagram for McscanX tool from TBtools [62].

4.5. Prediction and Analysis of Potential Upstream Regulatory Transcription Factors for EgPHRs

The promoter sequence 2 kb upstream of the EgPHR genes was extracted and submitted to the PlantRegMap database (https://plantregmap.gao-lab.org/regulation_prediction.php) (accessed on 3 December 2024) to predict the upstream regulatory transcription factors. We used Origin2024 to draw chord diagrams and TBtools Heatmap tools for classification and heatmap drawing. We plotted word clouds and bar stacks using the ggplot2 package in R [64].

4.6. Protein–Protein Interaction Analysis

Eucalyptus grandis PHR protein sequences were submitted to the STRING website (https://cn.string-db.org/) (accessed on 13 September 2024), and Eucalyptus grandis, Populus trichocarpa, and Arabidopsis thaliana were selected as the reference species to predict the interaction network between EgPHR, PtrPHR, and AtPHR proteins. The detailed parameters included the full STRING network, evidence in meaning of edges, medium confidence (0.400) in minimum required interaction score, and no more than 30 interactors in the max number of interactors to show. TSV result files in string_interactions_short format were downloaded to organize and beautify protein interaction networks using Cytospace (version 3.6.1). All enriched terms through the Analysis module were downloaded, the bubble diagram was plotted using the ggplot2 package in R, and the sankey diagram was plotted using Origin2024.

4.7. Abiotic Stress Treatments and RT-qPCR Analysis

Eucalyptus grandis seeds were harvested in May 2024 from 15-year-old Eucalyptus grandis trees at the Baisha State-owned Forest Farm in Minhou, Fujian Province, and stored in a −20 °C freezer. Eucalyptus grandis seeds were sown on vermiculite and germinated and grown in a greenhouse with an ambient temperature of 25 °C, 16 h of light/8 h of darkness, with a light intensity of 50 μmol, and a humidity of 60%. Eucalyptus seedlings that were 1.5 months old and growing consistently were selected and grown in 1/2 Hoagland nutrient solution (2.5 mM KNO3, 0.5 mM KH2PO4, 1 mM MgSO4, 2.5 mM Ca(NO3)2·4H2O, pH 5.0) for three weeks. Eucalyptus seedlings were divided into three groups: control group (0.5 mM KH2PO4, 10 mM KNO3, hereinafter referred to as CK), nitrogen starvation group (0 mM KNO3, hereinafter referred to as -N) and LP group (0.005 mM KH2PO4, hereinafter referred to as LP) for hydroponic treatment. Root sampling was performed at 2 h and 24 h for the -N treatment, and root sampling was performed at 6 h, 12 h, 24 h, and 3 days for the LP treatment.
The 1.5-month-old seedlings of Eucalyptus grandis (watered once a week with 2 L 1/2 Hoagland nutrient solution, pH 5.0) were grown in a 4 °C low-temperature incubator or at 25 °C with identical light and humidity condition, and the leaves were sampled after 24 h. Total RNA extraction from roots and leaves of Eucalyptus grandis were performed using the RNAprep Pure Plant Plus Kit (Polysaccharides & Polyphenolics-rich) (TIANGEN, Beijing, China). Total RNAs were reverse-transcribed using the Evo M-MLV Reverse Transcription Premixed Kit with gDNA removal (Accurate Biotechnology, Changsha, China). RT-qPCR reactions of 12 EgPHR genes were performed on a QuantStudio 1 Plus Real-Time PCR System (Thermo Fisher Scientfic, Waltham, MA, USA) using the SYBR Green Pro Taq HS Premixed qPCR Kit (with Rox) (Accurate Biotechnology, Changsha, China). Primers used in this study are listed in Table S13. The RT-qPCR procedure was as follows: 95 °C for 30 s, followed by 40 cycles of 95 °C for 5 s and 58 °C for 30 s, followed by a final step of 72 °C for 30 s. The ACTIN1 gene (LOC104425496) was used as an internal control, and for each analysis, 3 technical replicates and 3 biological replicates were performed.

4.8. Data Analysis

Gene expression levels were calculated using the 2−ΔΔCT method [38,65]. The ΔCt value was the difference between the Ct value of the target gene and the Ct value of the reference gene. The ΔΔCt value was the ΔCt value of the experimental group minus the ΔCt value of the control group. The relative expression level was calculated using the 2−ΔΔCt formula. The statistical analysis was conducted using t-tests along with both one-way ANOVA and two-way ANOVA approaches. “NS” represented no significance, “*” represented p < 0.05, “**” represented p < 0.01, “***” represented p < 0.001, “****” p < 0.0001. Bar charts were plotted using the ggplot2 (v3.5.1) package in R (v4.3.1).
The Eucalyptus grandis-related transcriptome data used in this study were downloaded from the National Genomics Data Center database of the China National Center for Bioinformation, with accession number PRJCA002468 [39]. Quality control was performed using FastQC (version 0.11.9) and MultiQC (version 1.12) [66]. Following raw data preprocessing with Trim Galore (a Cutadapt wrapper, v0.6.10) and Cutadapt (v4.0), genome alignment was performed against the Eucalyptus grandis reference genome using STAR aligner (v2.7.10a) with pre-built genomic indices [67]. The resulting SAM files were converted to BAM format using samtools (v1.16.1), followed by gene-level quantification through FeatureCounts (v1.6.4) with species-specific annotation files [68,69]. Finally, we normalized all samples using R software DEseq2 (v1.42.1) to obtain the final gene expression matrix [70]. Heatmaps were plotted using TBtools Heatmap tools (v2.154).

5. Conclusions

Phosphorus is an essential macronutrient for plant development and productivity, and PHRs are major regulators of Pi-starvation signaling. The identification and functional analysis of PHRs in Eucalyptus will provide important information for the future design of high-PUE woody plants. In this study, twelve PHRs were characterized in Eucalyptus grandis. The gene expression analysis revealed that EgPHRs might be involved in the regulation of plant development, JA response, SA response, cold stress, salt stress, and nutrient availability. Notably, the protein–protein interactions and promoter-binding transcription factor analysis suggest that EgPHRs might be involved in mitotic chromosome segregation and tissue differentiation in Eucalyptus. Overall, our results suggest that EgPHRs may play an important role in coordinating plant development, abiotic stresses, and nutrient availability.

Supplementary Materials

The supporting information can be downloaded at: https://www.mdpi.com/article/10.3390/ijms26072958/s1.

Author Contributions

Conceptualization, D.Y. and L.M.; methodology, H.X.; software, H.X.; formal analysis, H.X., Y.X., G.L., X.W., X.Z. and D.Y.; data curation, H.X.; writing original draft preparation, H.X.; writing review and editing, D.Y., L.M. and Z.L.; visualization, H.X.; supervision, D.Y. and L.M. All authors have read and agreed to the published version of the manuscript.

Funding

This work was supported by the Fundamental Research Funds for the Central Non-profit Research Institution of CAF, grant number CAFYBB2022SY017, the National Key Research and Development Program of China during the 14th Five-year Plan Period, grant number 2022YFD2200203, the Forestry Peak Discipline Construction Project of Fujian Agriculture and Forestry University, grant number 72202200205.

Institutional Review Board Statement

Not applicable.

Informed Consent Statement

Not applicable.

Data Availability Statement

The transcriptome data used in this study were downloaded and reanalyzed from the National Genomics Data Center database (PRJCA002468 for tissue expression, JA response, SA response, salt stress, and boron deficiency).

Acknowledgments

The authors would like to thank Yu Lin and Hui Yang of Baisha State-owned Forest Farm in Minhou County, Fujian Province, for their assistance in collecting Eucalyptus grandis seeds. The authors would like to thank Ping Zheng of Fujian A&F University for her suggestion on cloud mapping, and thank our laboratory members Yi Han, Lichuan Deng, and Shasha Zhang for their assistance and suggestions in the preparation of plant materials and some experiments.

Conflicts of Interest

The authors declare no conflicts of interest.

Abbreviations

The following abbreviations are used in this manuscript:
EgPHRsEucalyptus grandis phosphate starvation responses
EgEucalyptus grandis
AtArabidopsis thaliana
PotriPopulus trichocarpa
OsOryza sativa
ChrChromosome
FPKMFragments per kilobase of transcript per million mapped reads
HMMHidden Markov Model
RT-qPCR Quantitative reverse transcription PCR
WGSWhole-genome sequencing
PUEPhosphorus use efficiency
PPIProtein–protein interaction
SPXSYG1, Pho81, XPR1
PAPPurple acid phosphatase
WUSWUSCHEL
KNOX1Knotted1-like homeobox 1
WOX13WUSCHEL-related homeobox 13
SIP1Smad-interacting protein 1
BSL1BSU1-like family of Ser/Thr protein phosphatases 1
KCBP1Kinesin-like calmodulin binding protein 1

References

  1. Fang, X.; Yang, D.; Deng, L.; Zhang, Y.; Lin, Z.; Zhou, J.; Chen, Z.; Ma, X.; Guo, M.; Lu, Z.; et al. Phosphorus uptake, transport, and signaling in woody and model plants. For. Res. 2024, 4, e017. [Google Scholar] [CrossRef]
  2. Hong, L.; Wang, Q.; Zhang, J.; Chen, X.; Liu, Y.; Asiegbu, F.O.; Wu, P.; Ma, X.; Wang, K. Advances in the beneficial endophytic fungi for the growth and health of woody plants. For. Res. 2024, 4, e028. [Google Scholar] [CrossRef]
  3. Paz-Ares, J.; Puga, M.I.; Rojas-Triana, M.; Martinez-Hevia, I.; Diaz, S.; Poza-Carrion, C.; Minambres, M.; Leyva, A. Plant adaptation to low phosphorus availability: Core signaling, crosstalks, and applied implications. Mol. Plant 2022, 15, 104–124. [Google Scholar] [CrossRef] [PubMed]
  4. Wang, Y.; Chen, Y.F.; Wu, W.H. Potassium and phosphorus transport and signaling in plants. J. Integr. Plant Biol. 2021, 63, 34–52. [Google Scholar] [CrossRef]
  5. Meharg, A.A. Marschner’s Mineral Nutrition of Higher Plants, 3rd ed.; Marschner, P., Ed.; Elsevier: Amsterdam, The Netherlands; Academic Press: Amsterdam, The Netherlands, 2011; p. 684. ISBN 978-0-12-384905-2. [Google Scholar]
  6. Malhotra, H.; Vandana; Sharma, S.; Pandey, R. Phosphorus Nutrition: Plant Growth in Response to Deficiency and Excess. In Plant Nutrients and Abiotic Stress Tolerance; Springer: Singapore, 2018; pp. 171–190. [Google Scholar]
  7. Bayu, D.; Dejene, A.; Alemayehu, R.; Gezahegn, B. Improving available phosphorus in acidic soil using biochar. JSSEM 2017, 8, 87–94. [Google Scholar] [CrossRef]
  8. Lei, J.; Yin, J.; Chen, S.; Fenton, O.; Liu, R.; Chen, Q.; Fan, B.; Zhang, S. Understanding phosphorus mobilization mechanisms in acidic soil amended with calcium-silicon-magnesium-potassium fertilizer. Sci. Total Environ. 2024, 916, 170294. [Google Scholar] [CrossRef] [PubMed]
  9. Liu, D. Root developmental responses to phosphorus nutrition. J. Integr. Plant Biol. 2021, 63, 1065–1090. [Google Scholar] [CrossRef]
  10. Sega, P.; Pacak, A. Plant PHR Transcription Factors: Put on A Map. Genes 2019, 10, 1018. [Google Scholar] [CrossRef]
  11. Zhu, J.; Lau, K.; Puschmann, R.; Harmel, R.K.; Zhang, Y.; Pries, V.; Gaugler, P.; Broger, L.; Dutta, A.K.; Jessen, H.J.; et al. Two bifunctional inositol pyrophosphate kinases/phosphatases control plant phosphate homeostasis. eLife 2019, 8, e43582. [Google Scholar] [CrossRef]
  12. Zhou, J.; Hu, Q.; Xiao, X.; Yao, D.; Ge, S.; Ye, J.; Li, H.; Cai, R.; Liu, R.; Meng, F.; et al. Mechanism of phosphate sensing and signaling revealed by rice SPX1-PHR2 complex structure. Nat. Commun. 2021, 12, 7040. [Google Scholar] [CrossRef]
  13. Guan, Z.; Zhang, Q.; Zhang, Z.; Zuo, J.; Chen, J.; Liu, R.; Savarin, J.; Broger, L.; Cheng, P.; Wang, Q.; et al. Mechanistic insights into the regulation of plant phosphate homeostasis by the rice SPX2–PHR2 complex. Nat. Commun. 2022, 13, 1581. [Google Scholar] [CrossRef]
  14. Bustos, R.; Castrillo, G.; Linhares, F.; Puga, M.I.; Rubio, V.; Perez-Perez, J.; Solano, R.; Leyva, A.; Paz-Ares, J. A central regulatory system largely controls transcriptional activation and repression responses to phosphate starvation in Arabidopsis. PLoS Genet. 2010, 6, e1001102. [Google Scholar] [CrossRef]
  15. Lin, W.Y.; Huang, T.K.; Chiou, T.J. Nitrogen limitation adaptation, a target of microRNA827, mediates degradation of plasma membrane-localized phosphate transporters to maintain phosphate homeostasis in Arabidopsis. Plant Cell 2013, 25, 4061–4074. [Google Scholar] [CrossRef]
  16. Ayadi, A.; David, P.; Arrighi, J.F.; Chiarenza, S.; Thibaud, M.C.; Nussaume, L.; Marin, E. Reducing the genetic redundancy of Arabidopsis PHOSPHATE TRANSPORTER1 transporters to study phosphate uptake and signaling. Physiol. Plant 2015, 167, 1511–1526. [Google Scholar] [CrossRef] [PubMed]
  17. Xu, Y.; Liu, F.; Han, G.; Cheng, B. Genome-wide identification and comparative analysis of phosphate starvation-responsive transcription factors in maize and three other gramineous plants. Plant Cell Rep. 2018, 37, 711–726. [Google Scholar] [CrossRef]
  18. Zhao, Y.; Li, P.; Wang, H.; Feng, J.; Li, Y.; Wang, S.; Li, Y.; Guo, Y.; Li, L.; Su, Y.; et al. Genome-wide investigation and expression pattern of PHR family genes in cotton under low phosphorus stress. PeerJ 2022, 10, e14584. [Google Scholar] [CrossRef] [PubMed]
  19. Wang, Z.; Zheng, Z.; Zhu, Y.; Kong, S.; Liu, D. PHOSPHATE RESPONSE 1 family members act distinctly to regulate transcriptional responses to phosphate starvation. Plant Physiol. 2023, 191, 1324–1343. [Google Scholar] [CrossRef]
  20. Yue, C.; Chen, Q.; Hu, J.; Li, C.; Luo, L.; Zeng, L. Genome-Wide Identification and Characterization of GARP Transcription Factor Gene Family Members Reveal Their Diverse Functions in Tea Plant (Camellia sinensis). Front. Plant Sci. 2022, 13, 947072. [Google Scholar] [CrossRef]
  21. Li, R.; An, J.-P.; You, C.-X.; Wang, X.-F.; Hao, Y.-J. Overexpression of MdPHR1 Enhanced Tolerance to Phosphorus Deficiency by Increasing MdPAP10 Transcription in Apple (Malus ×  Domestica). J. Plant Growth Regul. 2020, 40, 1753–1763. [Google Scholar] [CrossRef]
  22. Chen, N.; Tong, S.; Yang, J.; Qin, J.; Wang, W.; Chen, K.; Shi, W.; Li, J.; Liu, J.; Jiang, Y. PtoWRKY40 interacts with PtoPHR1-LIKE3 while regulating the phosphate starvation response in poplar. Plant Physiol. 2022, 190, 2688–2705. [Google Scholar] [CrossRef]
  23. Liu, T.; Xie, Y. Analysis and Prospects of the Drivers of the Rapid Development of Eucalyptus Plantation Forests in China. Eucalyptus Technol. 2020, 37, 38–47. [Google Scholar] [CrossRef]
  24. Tang, X.; Lei, P.; You, Q.; Liu, Y.; Jiang, S.; Ding, J.; Chen, J.; You, H. Monitoring Seasonal Growth of Eucalyptus Plantation under Different Forest Age and Slopes Based on Multi-Temporal UAV Stereo Images. Forests 2023, 14, 2231. [Google Scholar] [CrossRef]
  25. Mohanta, T.K.; Khan, A.; Hashem, A.; Abd_Allah, E.F.; Al-Harrasi, A. The molecular mass and isoelectric point of plant proteomes. BMC Genom. 2019, 20, 631. [Google Scholar] [CrossRef]
  26. Guruprasad, K.; Reddy, B.V.; Pandit, M.W. Correlation between stability of a protein and its dipeptide composition: A novel approach for predicting in vivo stability of a protein from its primary sequence. Protein Eng. 1990, 4, 155–161. [Google Scholar] [CrossRef] [PubMed]
  27. Ninkuu, V.; Yan, J.; Fu, Z.; Yang, T.; Zhang, L.; Ren, J.; Li, G.; Zeng, H. Genome-wide identification, phylogenomics, and expression analysis of benzoxazinoids gene family in rice (Oryza sativa). Plant Stress 2023, 10, 100214. [Google Scholar] [CrossRef]
  28. Zhou, J.; Jiao, F.; Wu, Z.; Li, Y.; Wang, X.; He, X.; Zhong, W.; Wu, P. OsPHR2 is involved in phosphate-starvation signaling and excessive phosphate accumulation in shoots of plants. Plant Physiol. 2008, 146, 1673–1686. [Google Scholar] [CrossRef]
  29. Guo, M.; Ruan, W.; Li, C.; Huang, F.; Zeng, M.; Liu, Y.; Yu, Y.; Ding, X.; Wu, Y.; Wu, Z.; et al. Integrative Comparison of the Role of the PHOSPHATE RESPONSE1 Subfamily in Phosphate Signaling and Homeostasis in Rice. Plant Physiol. 2015, 168, 1762–1776. [Google Scholar] [CrossRef]
  30. Shi, J.; Zhao, B.; Zheng, S.; Zhang, X.; Wang, X.; Dong, W.; Xie, Q.; Wang, G.; Xiao, Y.; Chen, F.; et al. A phosphate starvation response-centered network regulates mycorrhizal symbiosis. Cell 2021, 184, 5527–5540.e5518. [Google Scholar] [CrossRef]
  31. Naidoo, R.; Ferreira, L.; Berger, D.K.; Myburg, A.A.; Naidoo, S. The identification and differential expression of Eucalyptus grandis pathogenesis-related genes in response to salicylic acid and methyl jasmonate. Front. Plant Sci. 2013, 4, 42592. [Google Scholar]
  32. Ye, W.; Wang, T.; Wei, W.; Lou, S.; Lan, F.; Zhu, S.; Li, Q.; Ji, G.; Lin, C.; Wu, X.; et al. The Full-Length Transcriptome of Spartina alterniflora Reveals the Complexity of High Salt Tolerance in Monocotyledonous Halophyte. Plant Cell Physiol. 2020, 61, 882–896. [Google Scholar] [CrossRef]
  33. Chen, B.; Liu, T.; Yang, Z.; Yang, S.; Chen, J. PacBio Full-Length Transcriptome Sequencing Reveals the Mechanism of Salt Stress Response in Sonneratia apetala. Plants 2023, 12, 3849. [Google Scholar] [CrossRef] [PubMed]
  34. Oberschelp, G.P.J.; Guarnaschelli, A.B.; Teson, N.; Harrand, L.; Podestá, F.E.; Margarit, E. Cold acclimation and freezing tolerance in three Eucalyptus species: A metabolomic and proteomic approach. Plant Physiol. Biochem. 2020, 154, 316–327. [Google Scholar] [CrossRef] [PubMed]
  35. Medici, A.; Szponarski, W.; Dangeville, P.; Safi, A.; Dissanayake, I.M.; Saenchai, C.; Emanuel, A.; Rubio, V.; Lacombe, B.; Ruffel, S.; et al. Identification of Molecular Integrators Shows that Nitrogen Actively Controls the Phosphate Starvation Response in Plants. Plant Cell 2019, 31, 1171–1184. [Google Scholar] [CrossRef]
  36. Luo, J.; Liang, Z.; Wu, M.; Mei, L. Genome-wide identification of BOR genes in poplar and their roles in response to various environmental stimuli. Environ. Exp. Bot. 2019, 164, 101–113. [Google Scholar] [CrossRef]
  37. Wang, T.; Ye, W.; Zhang, J.; Li, H.; Zeng, W.; Zhu, S.; Ji, G.; Wu, X.; Ma, L. Alternative 3′-untranslated regions regulate high-salt tolerance of Spartina alterniflora. Plant Physiol. 2023, 191, 2570–2587. [Google Scholar] [CrossRef]
  38. Lin, Z.; Guo, C.; Lou, S.; Jin, S.; Zeng, W.; Guo, Y.; Fang, J.; Xu, Z.; Zuo, Z.; Ma, L. Functional analyses unveil the involvement of moso bamboo (Phyllostachys edulis) group I and II NIN-LIKE PROTEINS in nitrate signaling regulation. Plant Sci. 2021, 306, 110862. [Google Scholar] [CrossRef]
  39. Fan, C.; Lyu, M.; Zeng, B.; He, Q.; Wang, X.; Lu, M.Z.; Liu, B.; Liu, J.; Esteban, E.; Pasha, A.; et al. Profiling of the gene expression and alternative splicing landscapes of Eucalyptus grandis. Plant Cell Environ. 2024, 47, 1363–1378. [Google Scholar] [CrossRef] [PubMed]
  40. Nakano, Y.; Naito, Y.; Nakano, T.; Ohtsuki, N.; Suzuki, K. NSR1/MYR2 is a negative regulator of ASN1 expression and its possible involvement in regulation of nitrogen reutilization in Arabidopsis. Plant Sci. 2017, 263, 219–225. [Google Scholar] [CrossRef]
  41. Zhao, C.; Hanada, A.; Yamaguchi, S.; Kamiya, Y.; Beers, E.P. The Arabidopsis Myb genes MYR1 and MYR2 are redundant negative regulators of flowering time under decreased light intensity. Plant J. 2011, 66, 502–515. [Google Scholar] [CrossRef]
  42. Hu, B.; Chu, C. Nitrogen–phosphorus interplay: Old story with molecular tale. New Phytol. 2020, 225, 1455–1460. [Google Scholar] [CrossRef]
  43. Hu, B.; Jiang, Z.; Wang, W.; Qiu, Y.; Zhang, Z.; Liu, Y.; Li, A.; Gao, X.; Liu, L.; Qian, Y.; et al. Nitrate–NRT1.1B–SPX4 cascade integrates nitrogen and phosphorus signalling networks in plants. Nat. Plants 2019, 5, 401–413. [Google Scholar] [CrossRef]
  44. Long, Y.; Peng, J. Interaction between Boron and Other Elements in Plants. Genes 2023, 14, 130. [Google Scholar] [CrossRef]
  45. Kaya, C.; Tuna, A.L.; Dikilitas, M.; Ashraf, M.; Koskeroglu, S.; Guneri, M. Supplementary phosphorus can alleviate boron toxicity in tomato. Sci. Hortic. 2009, 121, 284–288. [Google Scholar] [CrossRef]
  46. Gunes, A.; Alpaslan, M. Boron uptake and toxicity in maize genotypes in relation to boron and phosphorus supply. J. Plant Nutr. 2000, 23, 541–550. [Google Scholar] [CrossRef]
  47. Masood, S.; Zhao, X.Q.; Shen, R.F. Bacillus pumilus increases boron uptake and inhibits rapeseed growth under boron supply irrespective of phosphorus fertilization. AoB Plants 2019, 11, plz036. [Google Scholar] [CrossRef]
  48. He, K.; Du, J.; Han, X.; Li, H.; Kui, M.; Zhang, J.; Huang, Z.; Fu, Q.; Jiang, Y.; Hu, Y. PHOSPHATE STARVATION RESPONSE1 (PHR1) interacts with JASMONATE ZIM-DOMAIN (JAZ) and MYC2 to modulate phosphate deficiency-induced jasmonate signaling in Arabidopsis. Plant Cell 2023, 35, 2132–2156. [Google Scholar] [CrossRef]
  49. Li, L.; Zhang, X.; Li, D.; Su, H.; He, Y.; Xu, Z.; Zhao, Y.; Hong, Y.; Li, Q.; Xu, P.; et al. CsPHRs-CsJAZ3 incorporates phosphate signaling and jasmonate pathway to regulate catechin biosynthesis in Camellia sinensis. Hortic. Res. 2024, 11, uhae178. [Google Scholar] [CrossRef] [PubMed]
  50. Xu, H.; Deng, L.; Zhou, X.; Xing, Y.; Li, G.; Chen, Y.; Huang, Y.; Ma, X.; Liu, Z.-J.; Li, M.; et al. Unveiling the PHR-centered regulatory network orchestrating the phosphate starvation signaling in Chinese fir (Cunninghamia lanceolata). bioRxiv 2024. [Google Scholar] [CrossRef]
  51. Wang, T.; Jin, Y.; Deng, L.; Li, F.; Wang, Z.; Zhu, Y.; Wu, Y.; Qu, H.; Zhang, S.; Liu, Y.; et al. The transcription factor MYB110 regulates plant height, lodging resistance, and grain yield in rice. Plant Cell 2024, 36, 298–323. [Google Scholar] [CrossRef] [PubMed]
  52. Kavka, M.; Polle, A. Phosphate uptake kinetics and tissue-specific transporter expression profiles in poplar (Populus × canescens) at different phosphorus availabilities. BMC Plant Biol. 2016, 16, 206. [Google Scholar] [CrossRef]
  53. Yadav, R.K.; Perales, M.; Gruel, J.; Girke, T.; Jönsson, H.; Reddy, G.V. WUSCHEL protein movement mediates stem cell homeostasis in the Arabidopsis shoot apex. Genes Dev. 2011, 25, 2025–2030. [Google Scholar] [PubMed]
  54. Long, X.; Zhang, J.; Wang, D.; Weng, Y.; Liu, S.; Li, M.; Hao, Z.; Cheng, T.; Shi, J.; Chen, J. Expression dynamics of WOX homeodomain transcription factors during somatic embryogenesis in Liriodendron hybrids. For. Res. 2023, 3, 15. [Google Scholar] [CrossRef]
  55. Furumizu, C.; Alvarez, J.P.; Sakakibara, K.; Bowman, J.L. Antagonistic Roles for KNOX1 and KNOX2 Genes in Patterning the Land Plant Body Plan Following an Ancient Gene Duplication. PLoS Genet. 2015, 11, e1004980. [Google Scholar] [CrossRef]
  56. Ogura, N.; Sasagawa, Y.; Ito, T.; Tameshige, T.; Kawai, S.; Sano, M.; Doll, Y.; Iwase, A.; Kawamura, A.; Suzuki, T.; et al. WUSCHEL-RELATED HOMEOBOX 13 suppresses de novo shoot regeneration via cell fate control of pluripotent callus. Sci. Adv. 2023, 9, eadg6983. [Google Scholar] [CrossRef]
  57. Kojc, N.; Zidar, N.; Gale, N.; Poljak, M.; Fujs Komloš, K.; Cardesa, A.; Höfler, H.; Becker, K.-F. Transcription factors Snail, Slug, Twist, and SIP1 in spindle cell carcinoma of the head and neck. Virchows Arch. 2009, 454, 549–555. [Google Scholar] [CrossRef]
  58. Fujita, A.; Lord, M.; Hiroko, T.; Hiroko, F.; Chen, T.; Oka, C.; Misumi, Y.; Chant, J. Rax1, a protein required for the establishment of the bipolar budding pattern in yeast. Gene 2004, 327, 161–169. [Google Scholar] [CrossRef] [PubMed]
  59. Guo, X.; Park, C.H.; Wang, Z.Y.; Nickels, B.E.; Dong, J. A spatiotemporal molecular switch governs plant asymmetric cell division. Nat. Plants 2021, 7, 667–680. [Google Scholar] [CrossRef]
  60. Smirnova, E.A.; Reddy, A.S.; Bowser, J.; Bajer, A.S. Minus end-directed kinesin-like motor protein, Kcbp, localizes to anaphase spindle poles in Haemanthus endosperm. Cell Motil. Cytoskelet. 1998, 41, 271–280. [Google Scholar] [CrossRef]
  61. Wang, T.; Yang, Y.; Lou, S.; Wei, W.; Zhao, Z.; Ren, Y.; Lin, C.; Ma, L. Genome-Wide Characterization and Gene Expression Analyses of GATA Transcription Factors in Moso Bamboo (Phyllostachys edulis). Int. J. Mol. Sci. 2019, 21, 14. [Google Scholar] [CrossRef]
  62. Chen, C.; Wu, Y.; Li, J.; Wang, X.; Zeng, Z.; Xu, J.; Liu, Y.; Feng, J.; Chen, H.; He, Y.; et al. TBtools-II: A “one for all, all for one” bioinformatics platform for biological big-data mining. Mol. Plant 2023, 16, 1733–1742. [Google Scholar] [CrossRef]
  63. Wang, T.; Li, Q.; Lou, S.; Yang, Y.; Peng, L.; Lin, Z.; Hu, Q.; Ma, L. GSK3/shaggy-like kinase 1 ubiquitously regulates cell growth from Arabidopsis to Moso bamboo (Phyllostachys edulis). Plant Sci. 2019, 283, 290–300. [Google Scholar] [CrossRef] [PubMed]
  64. Lin, J.; Wu, J.; Zhang, D.; Cai, X.; Du, L.; Lu, L.; Liu, C.; Chen, S.; Yao, Q.; Xie, S.; et al. The GRAS gene family and its roles in pineapple (Ananas comosus L.) developmental regulation and cold tolerance. BMC Plant Biol. 2024, 24, 1204. [Google Scholar] [CrossRef] [PubMed]
  65. Livak, K.J.; Schmittgen, T.D. Analysis of relative gene expression data using real-time quantitative PCR and the 2−ΔΔCT Method. Methods 2001, 25, 402–408. [Google Scholar] [CrossRef] [PubMed]
  66. Ewels, P.; Magnusson, M.; Lundin, S.; Kaller, M. MultiQC: Summarize analysis results for multiple tools and samples in a single report. Bioinformatics 2016, 32, 3047–3048. [Google Scholar] [CrossRef]
  67. Dobin, A.; Davis, C.A.; Schlesinger, F.; Drenkow, J.; Zaleski, C.; Jha, S.; Batut, P.; Chaisson, M.; Gingeras, T.R. STAR: Ultrafast universal RNA-seq aligner. Bioinformatics 2013, 29, 15–21. [Google Scholar] [CrossRef]
  68. Liao, Y.; Smyth, G.K.; Shi, W. featureCounts: An efficient general purpose program for assigning sequence reads to genomic features. Bioinformatics 2014, 30, 923–930. [Google Scholar] [CrossRef]
  69. Li, H.; Handsaker, B.; Wysoker, A.; Fennell, T.; Ruan, J.; Homer, N.; Marth, G.; Abecasis, G.; Durbin, R.; Genome Project Data Processing, S. The Sequence Alignment/Map format and SAMtools. Bioinformatics 2009, 25, 2078–2079. [Google Scholar] [CrossRef]
  70. Love, M.I.; Huber, W.; Anders, S. Moderated estimation of fold change and dispersion for RNA-seq data with DESeq2. Genome Biol. 2014, 15, 550. [Google Scholar] [CrossRef]
Figure 1. Phylogenetic analysis of the PHR gene family of Eucalyptus grandis with Arabidopsis thaliana, Oryza sativa, and Populus trichocarpa. Red dots indicate bootstrap values/metadata. The size of the circle corresponds to the level of bootstrap support for the branch. Circle diameters scale proportionally with bootstrap support values from 0 to 1, where larger diameters indicate stronger statistical confidence. Values exceeding 0.5 were generally considered reliable. The phylogenetic tree was constructed with MEGA7.0 using the maximum likelihood method with 1000 bootstraps. The tree uses three different colors to indicate the three evolutionary branches (IIII). The names of PHRs in Arabidopsis, Oryza sativa, Populus trichocarpa, and Eucalyptus grandis begin with “At”, “Os”, “Potri”, and “Eg”, respectively, at the beginning. The protein sequences of Arabidopsis, Oryza sativa, Populus trichocarpa, and Eucalyptus grandis PHRs are listed in Table S1.
Ijms 26 02958 g001
Figure 2. Conserved motifs and gene structure of the Eucalyptus grandis PHRs. (A) Conserved motifs of EgPHR; (B) sequence identification of several special EgPHR motifs; (C) genetic structure of EgPHRs, including CDS, UTR, and introns. The position of the sequence motifs, the domains, and the size of the exons or UTRs are estimated by the scale at the bottom.
Ijms 26 02958 g002
Figure 3. Analysis of covariance between Eucalyptus grandis PHRs and Oryza sativa (A), Arabidopsis thaliana (B), and Populus trichocarpa (C). Orange represents the chromosomes of Eucalyptus grandis, green represents the chromosomes of Oryza sativa, Arabidopsis thaliana, and Populus trichocarpa and the red line highlights PHR gene pairs with covariance.
Ijms 26 02958 g003
Figure 4. Prediction of potential regulatory transcription factors in the Eucalyptus grandis PHR promoters. (A) Network chords of predicted transcription factors targeting the EgPHR genes. The direction of the arrow is from EgPHRs to the transcription factors. (B) Statistics on the type of potential regulatory transcription factors in the promoter region of each gene. (C) The word cloud and font size of the transcription factors are positively correlated with the number of corresponding transcription factors. (D) Horizontal bar graph representing the number of transcription factors.
Ijms 26 02958 g004
Figure 5. Protein–protein interaction network analysis and interaction protein enrichment analysis of PHR proteins in Eucalyptus grandis, Populus trichocarpa, and Arabidopsis. (A) Interaction network between EgPHR proteins and other Eucalyptus grandis proteins. (B) Interaction network between EgPHR proteins and Arabidopsis proteins. A network diagram consists of nodes and edges, each representing a protein; node-to-node connections (Edges) represent the interactions between these nodes; the connection’s line color, shading, and thickness indicate the degree of interaction, and the node color shading and node size indicate the thickness of the node (red: large, blue: small; thick: large, thin: small). (C) Cluster enrichment of EgPHR-, PtrPHR-, and AtPHR-interacting proteins in Eucalyptus grandis, Populus trichocarpa, and Arabidopsis.
Ijms 26 02958 g005
Figure 6. Gene expression analysis of EgPHRs in different Eucalyptus tissues and adventitious root development. Expression levels of EgPHRs in 12 different tissues (A) and 8 adventitious root induction states (B) in Eucalyptus. All samples were normalized using R software (v4.3.1) DEseq2 to obtain the final gene expression matrix. Heatmaps were plotted using R’s pheatmap and ggplot2 packages. The clustering is by rows, with orange representing high expression and green representing low expression.
Ijms 26 02958 g006
Figure 7. Gene expression analysis of EgPHRs under JA, SA, and salt stress treatments. The heatmap displays the expression levels of EgPHRs following treatment with SA (A) and JA (B) hormones, in the SA and JA treatment within 1 h, 6 h, and 7 h. (C) Expression levels of EgPHRs under salt stress, in the 200 mM NaCl treatment within 0 h, 1 h, 6 h, 24 h and 7d. All samples were normalized using R software DEseq2 to obtain the final gene expression matrix. Heatmaps were plotted using R’s pheatmap and ggplot2 packages. Clustering is by rows, orange represents high expression, and green represents low expression.
Ijms 26 02958 g007
Figure 8. Gene expression analysis of EgPHRs in response to cold stress. (AL) Expression of the EgPHRs in mock and cold treatment in the leaf. Seedlings were growth at 4 °C (cold stress) or 25 °C (control) for 24 h. t-test: “NS” represents no significance, “*” represents p < 0.05, “**” represents p < 0.01.
Ijms 26 02958 g008
Figure 9. Gene expression analysis of EgPHRs in response to phosphate deficiency. (AL) General overview of the expression of the EgPHRs in phosphate deficiency treatment in CK, 6 h, 12 h, 24 h and 3 d in roots. Two-way ANOVA test: “NS” represents no significance, “*” represents p < 0.05, “**” represents p < 0.01, “***” represents p < 0.001, “****” p < 0.0001.
Ijms 26 02958 g009
Figure 10. Gene expression analysis of EgPHRs in response to nitrogen starvation. (AL) General overview of the expression of the EgPHRs in CK, 2 h, and 24 h low nitrogen treatment in roots. CK: 10 mM KNO3 treatment, −N: 0 mM KNO3 treatment. One-way ANOVA test: “NS” represents no significance, “*” represents p < 0.05, “**” represents p < 0.01, “***” represents p < 0.001.
Ijms 26 02958 g010
Table 1. PHR proteins in Eucalyptus grandis.
NameSequence IDSize
(AA)
MW
(KDa)
PIInstability
Index
GRAVYSubcellular LocalizationGroup
EgPHR1LOC10443696058163.215.9867.24−0.80NucleusI
EgPHR2LOC10445071849855.005.6871.40−0.72NucleusI
EgPHR3LOC10442524741445.416.7942.30−0.63NucleusII
EgPHR4LOC10444578038443.147.6271.83−0.76NucleusI
EgPHR5LOC10444271637841.886.8246.29−0.73NucleusII
EgPHR6LOC10443255037140.935.2053.12−0.76NucleusI
EgPHR7LOC10445394235339.247.1459.45−0.75NucleusII
EgPHR8LOC10445104234437.977.9046.69−0.75NucleusIII
EgPHR9LOC10444769633036.095.6953.79−0.78NucleusI
EgPHR10LOC10444119433035.676.3944.07−0.70NucleusI
EgPHR11LOC10445602931634.126.0845.25−0.34NucleusIII
EgPHR12LOC10444236929432.139.0450.46−0.69NucleusIII
AA: amino acids, MW: molecular weight, KDa: kilodalton, PI: isoelectric point, GRAVY: grand average of hydropathicity, Group I–III: classification according to the phylogenetic analysis.
Disclaimer/Publisher’s Note: The statements, opinions and data contained in all publications are solely those of the individual author(s) and contributor(s) and not of MDPI and/or the editor(s). MDPI and/or the editor(s) disclaim responsibility for any injury to people or property resulting from any ideas, methods, instructions or products referred to in the content.

