
Exploration of Genomic Regions Associated with Fusarium Head Blight Resistance in Wheat and Development and Validation of Kompetitive Allele-Specific Polymerase Chain Reaction Markers


Abstract
1. Introduction
2. Results
2.1. Phenotypic Analysis for FHB Resistance in the RIL Population
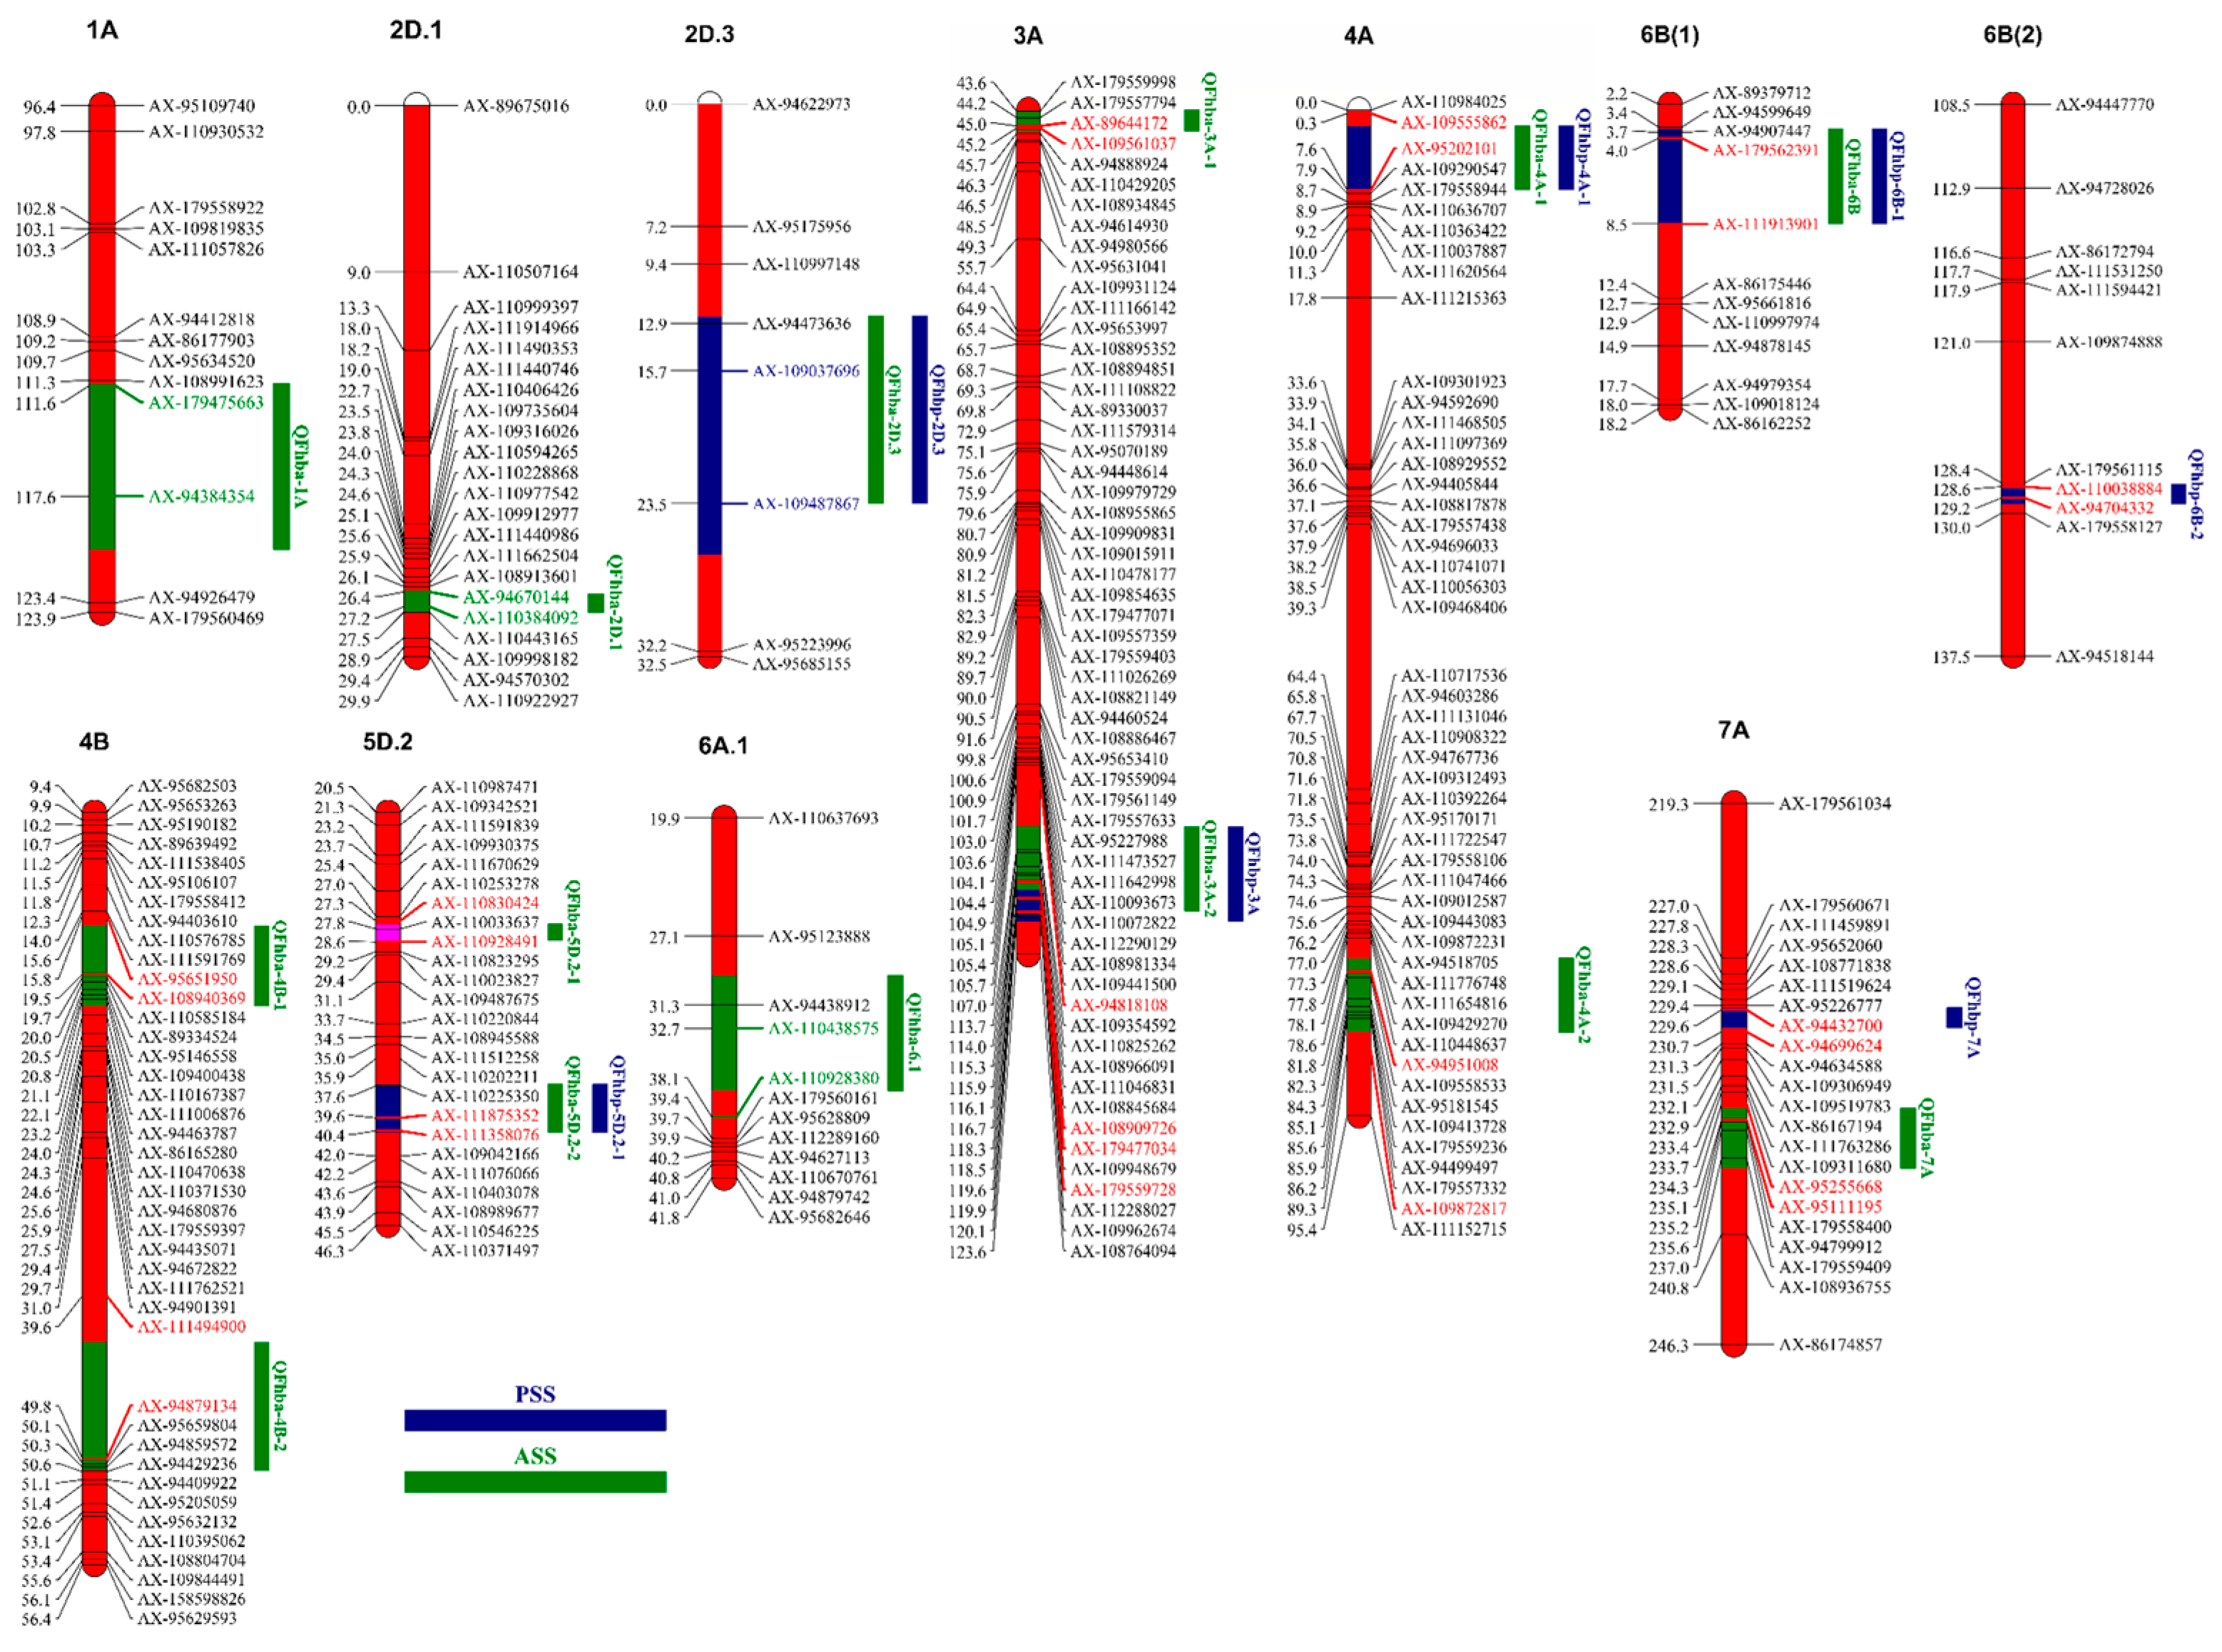
2.2. QTL Analysis
2.3. Effect Analysis of QFhba-5D.2-1 with QFhba-7A and QFhbp-7A
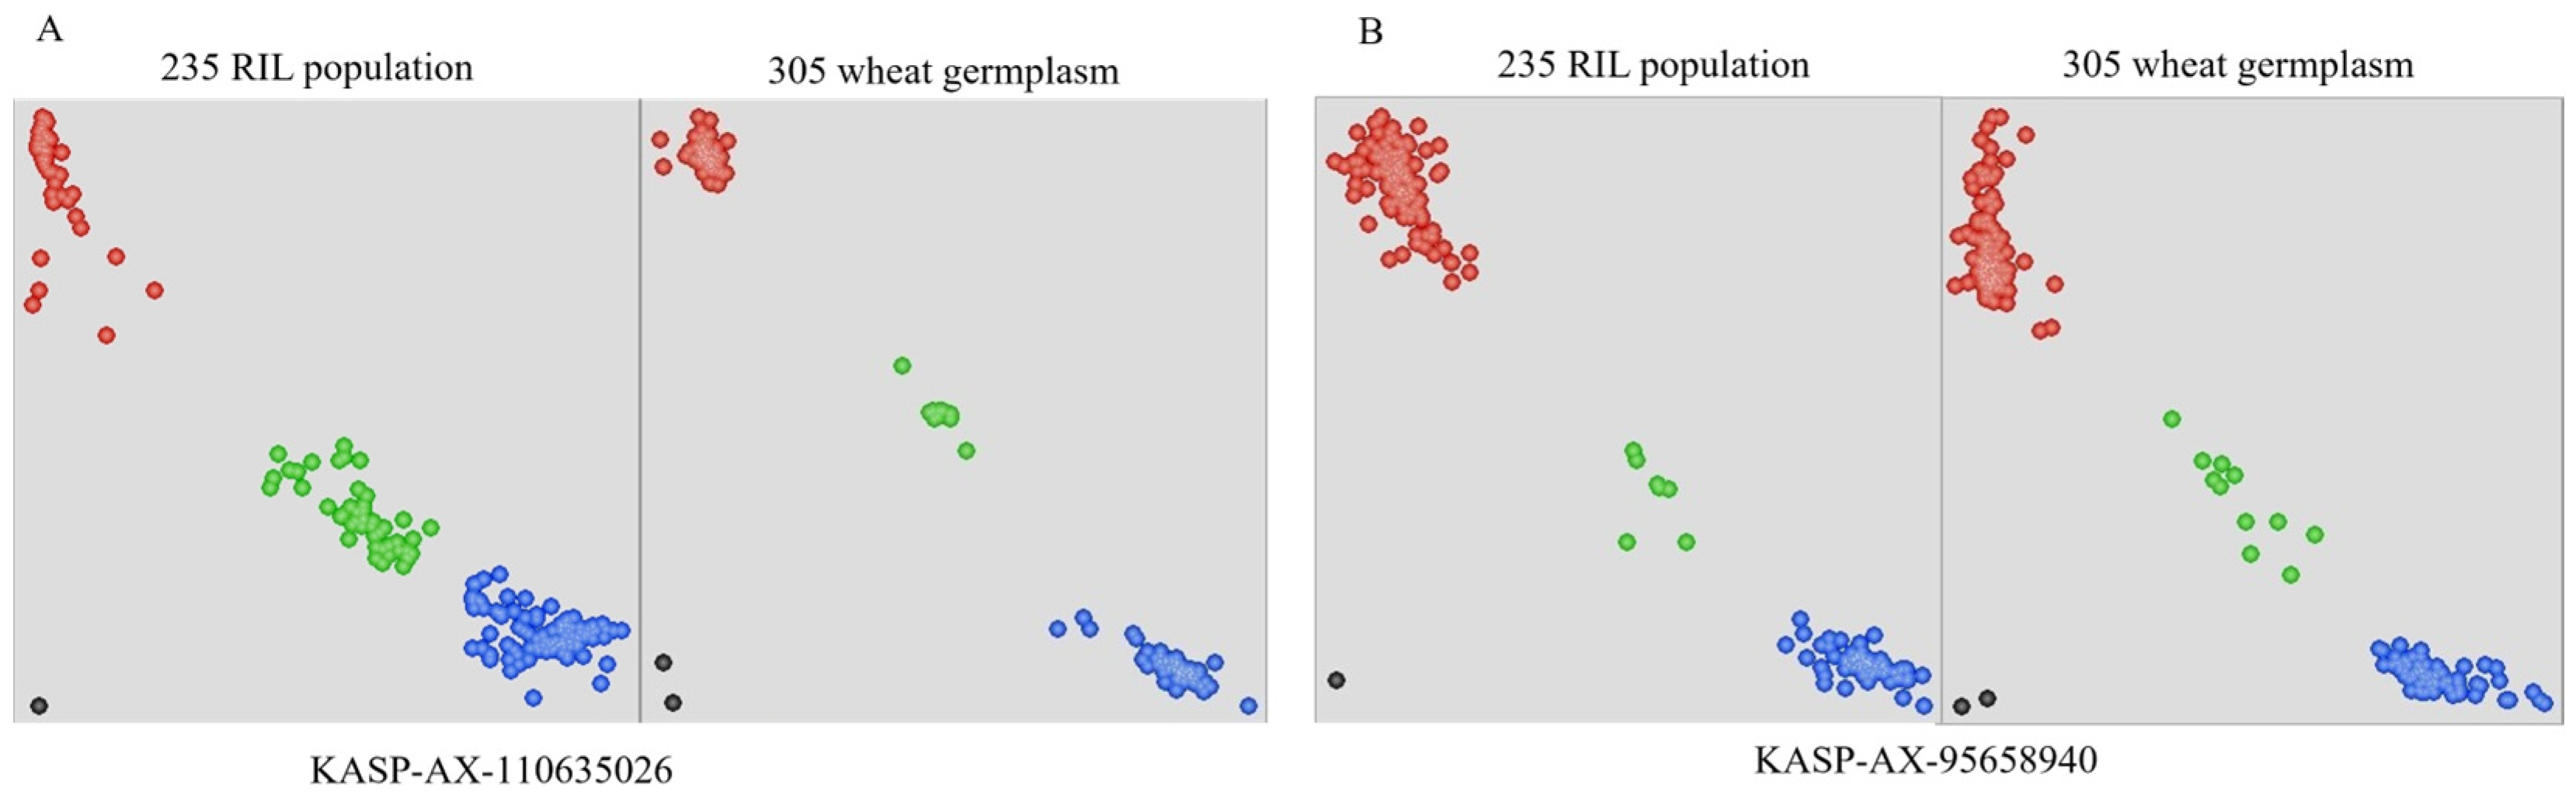
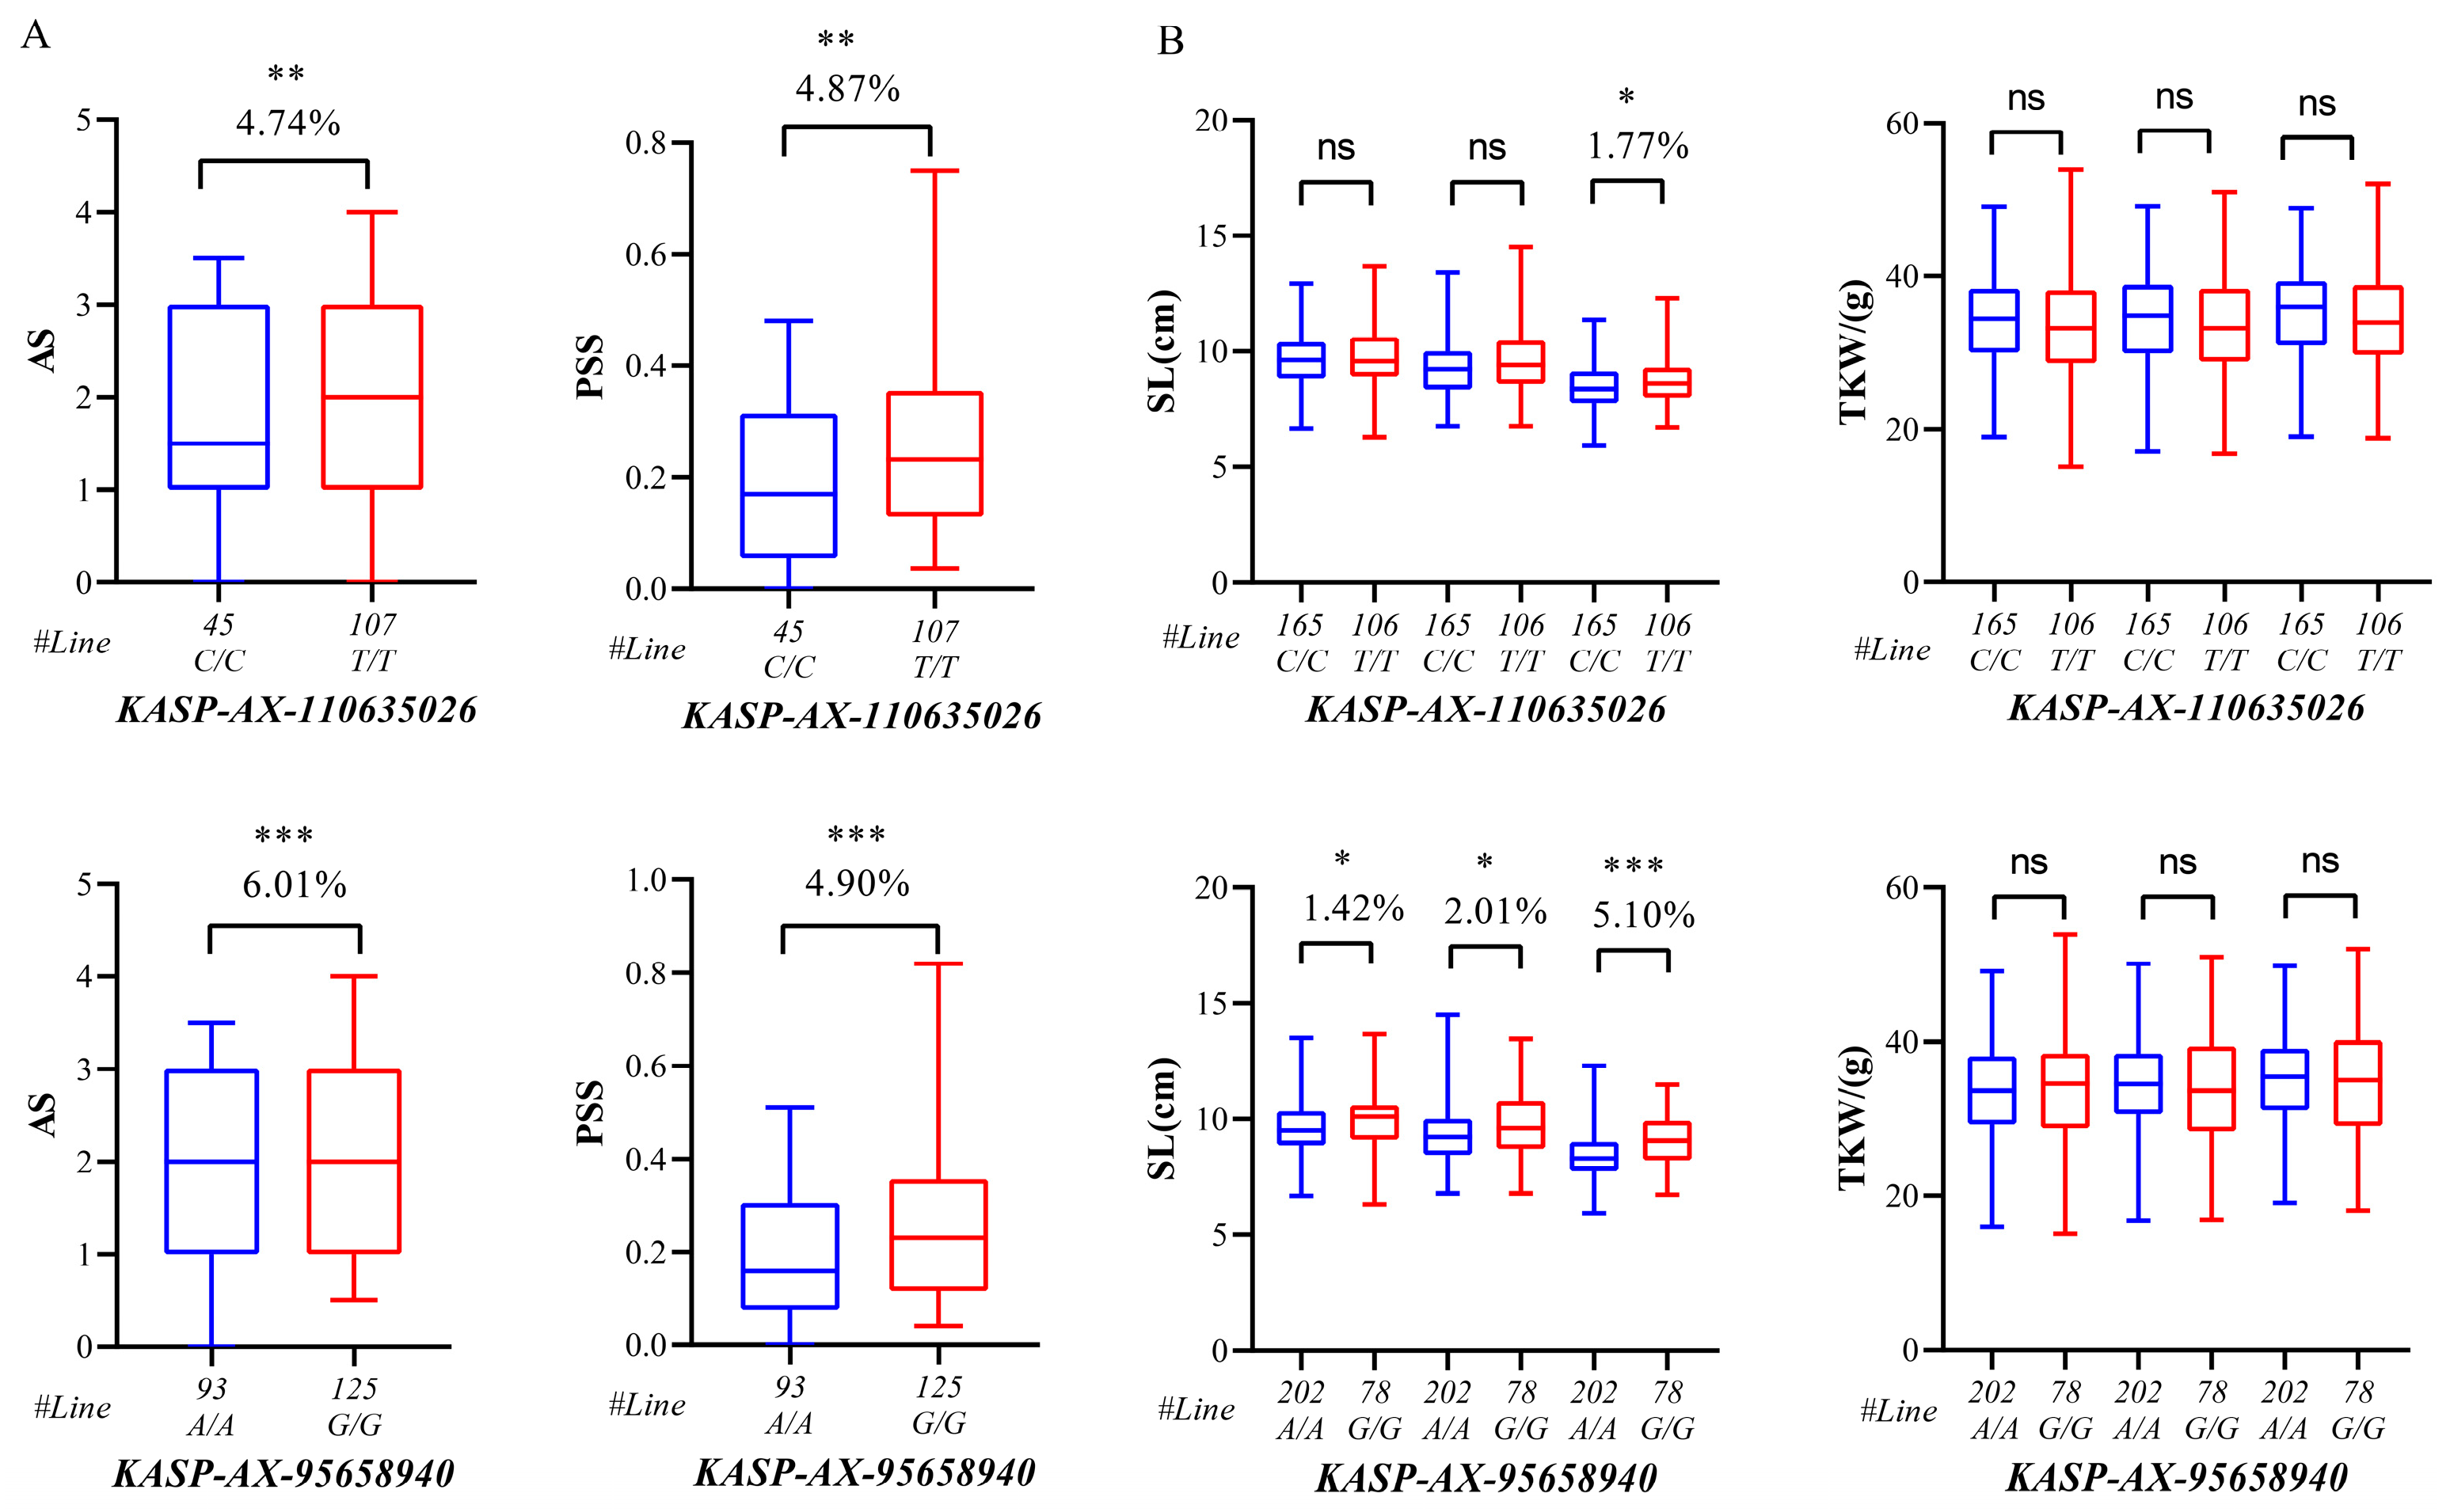
2.4. Development and Validation of KASP Marker
2.5. Analysis of Genes Within the Genomic Regions of 4A, 5D, 6B, and 7A QTL Regions
3. Discussion
3.1. Comparison with Previous Studies
3.2. Candidate Genes Involved in Plant Defense Responses to Pathogens
4. Materials and Methods
4.1. Plant Materials and Trial Environments
4.2. Field Inoculation
4.3. Phenotypic Data Collection
4.4. Phenotypic Analysis and QTL Analysis
4.5. Candidate Gene Prediction
4.6. KASP Marker Development
5. Conclusions
Supplementary Materials
Author Contributions
Funding
Institutional Review Board Statement
Informed Consent Statement
Data Availability Statement
Acknowledgments
Conflicts of Interest
Abbreviations
| AS | average severity |
| BLUP | Best Linear Unbiased Prediction |
| CV | coefficients of variation |
| FD | flowering date |
| FHB | Fusarium head blight |
| ICIM-ADD | inclusive composite interval mapping with the additive |
| KASP | Kompetitive Allele-Specific PCR |
| MAS | marker-assisted selection |
| MET | multi-environment trial |
| PH | plant height |
| PSS | percentage of symptomatic spikelets |
| QTL | quantitative trait loci |
| RIL | recombinant inbred line |
| SC | spikelet compactness |
| SL | spike length |
| TKW | thousand kernel weight |
| XN 1376 | Xinong 1376 |
| XY 81 | Xiaoyan 81 |
| AS | average severity |
References
- Hu, W.; Fu, L.; Gao, D.; Li, D.; Liao, S.; Lu, C. Marker-Assisted Selection to Pyramid Fusarium Head Blight Resistance Loci Fhb1 and Fhb2 in the High-Quality Soft Wheat Cultivar Yangmai 15. J. Integr. Agric. 2023, 22, 360–370. [Google Scholar] [CrossRef]
- Berraies, S.; Cuthbert, R.; Knox, R.; Singh, A.; DePauw, R.; Ruan, Y.; Bokore, F.; Henriquez, M.A.; Kumar, S.; Burt, A.; et al. High-Density Genetic Mapping of Fusarium Head Blight Resistance and Agronomic Traits in Spring Wheat. Front. Plant Sci. 2023, 14, 1134132. [Google Scholar] [CrossRef]
- Bai, G.; Shaner, G. Management and Resistance in Wheat and Barley to Fusarium Head Blight. Annu. Rev. Phytopathol. 2004, 42, 135–161. [Google Scholar] [CrossRef] [PubMed]
- Eskola, M.; Kos, G.; Elliott, C.T.; Hajšlová, J.; Mayar, S.; Krska, R. Worldwide Contamination of Food-Crops with Mycotoxins: Validity of the Widely Cited “FAO Estimate” of 25. Crit. Rev. Food Sci. Nutr. 2020, 60, 2773–2789. [Google Scholar] [CrossRef]
- Mesterhazy, A. What Is Fusarium Head Blight (FHB) Resistance and What Are Its Food Safety Risks in Wheat? Problems and Solutions-A Review. Toxins 2024, 16, 31. [Google Scholar] [CrossRef]
- Maričević, M.; Španić, V.; Bukan, M.; Rajković, B.; Šarčević, H. Diallel Analysis of Wheat Resistance to Fusarium Head Blight and Mycotoxin Accumulation under Conditions of Artificial Inoculation and Natural Infection. Plants 2024, 13, 1022. [Google Scholar] [CrossRef]
- Mousavi Khaneghah, A.; Kamani, M.H.; Fakhri, Y.; Coppa, C.F.S.C.; de Oliveira, C.A.F.; Sant’Ana, A.S. Changes in Masked Forms of Deoxynivalenol and Their Co-Occurrence with Culmorin in Cereal-Based Products: A Systematic Review and Meta-Analysis. Food Chem. 2019, 294, 587–596. [Google Scholar] [CrossRef] [PubMed]
- Li, G.; Yuan, Y.; Zhou, J.; Cheng, R.; Chen, R.; Luo, X.; Shi, J.; Wang, H.; Xu, B.; Duan, Y.; et al. FHB resistance conferred by Fhb1 is under inhibitory regulation of two genetic loci in wheat (Triticum aestivum L.). Theor. Appl. Genet. 2023, 136, 134. [Google Scholar] [CrossRef]
- Zheng, N.; Li, G.; Zhang, K.; Zheng, H.; Yang, J.; Yan, K.; Shi, C.; Su, Z.; Chen, F.; Wang, D.; et al. Analysis of Fhb1 Gene and Resistance to Fusarium Head Blight in 3,177 Diverse Wheat Accessions. J. Cereal Sci. 2022, 104, 103387. [Google Scholar] [CrossRef]
- Steiner, B.; Buerstmayr, M.; Michel, S.; Schweiger, W.; Lemmens, M.; Buerstmayr, H. Breeding Strategies and Advances in Line Selection for Fusarium Head Blight Resistance in Wheat. Trop. Plant Pathol. 2017, 42, 165–174. [Google Scholar] [CrossRef]
- Zhao, M.; Leng, Y.; Chao, S.; Xu, S.S.; Zhong, S. Molecular Mapping of QTL for Fusarium Head Blight Resistance Introgressed into Durum Wheat. Theor. Appl. Genet. 2018, 131, 1939–1951. [Google Scholar] [CrossRef]
- Zhang, G.; Hu, R.; Chen, X.; Zhang, F.; Li, Y.; Xu, H.; Yu, S.; Wang, S.; Gao, Y.; Li, Q.; et al. Molecular and Phenotypic Characterization of Chinese Wheat (Triticum aestivum) Cultivars for Resistance to Fusarium head blight. Plant Breed. 2023, 142, 30–40. [Google Scholar] [CrossRef]
- Zhang, M.; Jiang, P.; Wu, Q.; Han, X.; Man, J.; Sun, J.; Liang, J.; Chen, J.; Zhao, Q.; Guo, Y.; et al. Identification of Candidate Genes for Fusarium Head Blight Resistance from QTLs Using RIL Population in Wheat. Plant Mol. Biol. 2024, 114, 62. [Google Scholar] [CrossRef]
- Liu, Y.; Salsman, E.; Fiedler, J.D.; Hegstad, J.B.; Green, A.; Mergoum, M.; Zhong, S.; Li, X. Genetic Mapping and Prediction Analysis of FHB Resistance in a Hard Red Spring Wheat Breeding Population. Front. Plant Sci. 2019, 10, 1007. [Google Scholar] [CrossRef]
- ElDoliefy, A.E.A.; Anderson, J.A.; Glover, K.D.; Elias, E.M.; Ashry, H.A.; ElZahaby, I.M.; Mergoum, M. Mapping of Main and Hidden Epistatic QTL Effects in Spring Wheat Population Using Medium Parental FHB Resistance. Discov. Plants 2024, 1, 1–26. [Google Scholar] [CrossRef]
- Hu, W.; Gao, D.; Liao, S.; Cheng, S.; Jia, J.; Xu, W. Identification of a Pleiotropic QTL Cluster for Fusarium Head Blight Resistance, Spikelet Compactness, Grain Number per Spike and Thousand-Grain Weight in Common Wheat. Crop J. 2023, 11, 672–677. [Google Scholar] [CrossRef]
- Lu, Q.; Lillemo, M.; Skinnes, H.; He, X.; Shi, J.; Ji, F.; Dong, Y.; Bjørnstad, Å. Anther Extrusion and Plant Height Are Associated with Type I Resistance to Fusarium Head Blight in Bread Wheat Line ‘Shanghai-3/Catbird’. Theor. Appl. Genet. 2013, 126, 317–334. [Google Scholar] [CrossRef]
- Doohan, F.M.; Brennan, J.; Cooke, B.M. Influence of Climatic Factors on Fusarium Species Pathogenic to Cereals. In Epidemiology of Mycotoxin Producing Fungi; Xu, X., Bailey, J.A., Cooke, B.M., Eds.; Springer: Dordrecht, The Netherlands, 2003; pp. 755–768. ISBN 978-90-481-6387-8. [Google Scholar]
- Juroszek, P.; Von Tiedemann, A. Linking Plant Disease Models to Climate Change Scenarios to Project Future Risks of Crop Diseases: A Review. J. Plant Dis. Prot. 2015, 122, 3–15. [Google Scholar] [CrossRef]
- Vaughan, M.; Backhouse, D.; Ponte, E.M.D. Climate Change Impacts on the Ecology of Fusarium Graminearum Species Complex and Susceptibility of Wheat to Fusarium Head Blight: A Review. WMJ 2016, 9, 685–700. [Google Scholar] [CrossRef]
- Moretti, A.; Pascale, M.; Logrieco, A.F. Mycotoxin Risks under a Climate Change Scenario in Europe. Trends Food Sci. Technol. 2019, 84, 38–40. [Google Scholar] [CrossRef]
- Ma, Z.; Xie, Q.; Li, G.; Jia, H.; Zhou, J.; Kong, Z.; Li, N.; Yuan, Y. Germplasms, Genetics and Genomics for Better Control of Disastrous Wheat Fusarium Head Blight. Theor. Appl. Genet. 2020, 133, 1541–1568. [Google Scholar] [CrossRef] [PubMed]
- Buerstmayr, M.; Steiner, B.; Buerstmayr, H. Breeding for Fusarium Head Blight Resistance in Wheat—Progress and Challenges. Plant Breed. 2020, 139, 429–454. [Google Scholar] [CrossRef]
- Pandurangan, S.; Nilsen, K.T.; Kumar, S. Validation of a SNP-KASP Marker for the Fusarium Head Blight Resistance Quantitative Trait Loci on Chromosome 5AS. Can. J. Plant Sci. 2021, 101, 135–139. [Google Scholar] [CrossRef]
- Zhang, F.; Zhang, H.; Liu, J.; Ren, X.; Ding, Y.; Sun, F.; Zhu, Z.; He, X.; Zhou, Y.; Bai, G.; et al. Fhb9, a Major QTL for Fusarium Head Blight Resistance Improvement in Wheat. J. Integr. Agric. 2024. [Google Scholar] [CrossRef]
- Buerstmayr, H.; Stierschneider, M.; Steiner, B.; Lemmens, M.; Griesser, M.; Nevo, E.; Fahima, T. Variation for Resistance to Head Blight Caused by Fusarium Graminearum in Wild Emmer (Triticum Dicoccoides) Originating from Israel. Euphytica 2003, 130, 17–23. [Google Scholar] [CrossRef]
- Xue, S.; Li, G.; Jia, H.; Xu, F.; Lin, F.; Tang, M.; Wang, Y.; An, X.; Xu, H.; Zhang, L.; et al. Fine Mapping Fhb4, a Major QTL Conditioning Resistance to Fusarium Infection in Bread Wheat (Triticum aestivum L.). Theor. Appl. Genet. 2010, 121, 147–156. [Google Scholar] [CrossRef]
- Xue, S.; Xu, F.; Tang, M.; Zhou, Y.; Li, G.; An, X.; Lin, F.; Xu, H.; Jia, H.; Zhang, L.; et al. Precise Mapping Fhb5, a Major QTL Conditioning Resistance to Fusarium Infection in Bread Wheat (Triticum aestivum L.). Theor. Appl. Genet. 2011, 123, 1055–1063. [Google Scholar] [CrossRef]
- Zhang, Y.; Yang, Z.; Ma, H.; Huang, L.; Ding, F.; Du, Y.; Jia, H.; Li, G.; Kong, Z.; Ran, C.; et al. Pyramiding of Fusarium Head Blight Resistance Quantitative Trait Loci, Fhb1, Fhb4, and Fhb5, in Modern Chinese Wheat Cultivars. Front. Plant Sci. 2021, 12, 694023. [Google Scholar] [CrossRef]
- Qi, L.L.; Pumphrey, M.O.; Friebe, B.; Chen, P.D.; Gill, B.S. Molecular Cytogenetic Characterization of Alien Introgressions with Gene Fhb3 for Resistance to Fusarium Head Blight Disease of Wheat. Theor. Appl. Genet. 2008, 117, 1155–1166. [Google Scholar] [CrossRef]
- Bai, G.; Su, Z.; Cai, J. Wheat Resistance to Fusarium Head Blight. Can. J. Plant Pathol. 2018, 40, 336–346. [Google Scholar] [CrossRef]
- Cainong, J.C.; Bockus, W.W.; Feng, Y.; Chen, P.; Qi, L.; Sehgal, S.K.; Danilova, T.V.; Koo, D.-H.; Friebe, B.; Gill, B.S. Chromosome Engineering, Mapping, and Transferring of Resistance to Fusarium Head Blight Disease from Elymus Tsukushiensis into Wheat. Theor. Appl. Genet. 2015, 128, 1019–1027. [Google Scholar] [CrossRef] [PubMed]
- Guo, J.; Zhang, X.; Hou, Y.; Cai, J.; Shen, X.; Zhou, T.; Xu, H.; Ohm, H.W.; Wang, H.; Li, A.; et al. High-Density Mapping of the Major FHB Resistance Gene Fhb7 Derived from Thinopyrum Ponticum and Its Pyramiding with Fhb1 by Marker-Assisted Selection. Theor. Appl. Genet. 2015, 128, 2301–2316. [Google Scholar] [CrossRef]
- Wang, H.; Sun, S.; Ge, W.; Zhao, L.; Hou, B.; Wang, K.; Lyu, Z.; Chen, L.; Xu, S.; Guo, J.; et al. Horizontal Gene Transfer of Fhb7 from Fungus Underlies Fusarium Head Blight Resistance in Wheat. Science 2020, 368, eaba5435. [Google Scholar] [CrossRef] [PubMed]
- Wang, X.; Li, G.; Jia, H.; Cheng, R.; Zhong, J.; Shi, J.; Chen, R.; Wen, Y.; Ma, Z. Breeding Evaluation and Precise Mapping of Fhb8 for Fusarium Head Blight Resistance in Wheat (Triticum aestivum). Plant Breed. 2023, 143, 26–33. [Google Scholar] [CrossRef]
- Xu, Y.; Li, Y.; Bian, R.; Zhang, G.; Fritz, A.K.; Dong, Y.; Zhao, L.; Xu, Y.; Ghori, N.; Bernardo, A.; et al. Genetic Architecture of Quantitative Trait Loci (QTL) for FHB Resistance and Agronomic Traits in a Hard Winter Wheat Population. Crop J. 2023, 11, 1836–1845. [Google Scholar] [CrossRef]
- Steiner, B.; Buerstmayr, M.; Wagner, C.; Danler, A.; Eshonkulov, B.; Ehn, M.; Buerstmayr, H. Fine-mapping of the Fusarium Head Blight Resistance QTL Qfhs.ifa-5A Identifies Two Resistance QTL Associated with Anther Extrusion. Theor. Appl. Genet. 2019, 132, 2039–2053. [Google Scholar] [CrossRef]
- Poudel, B.; Mullins, J.; Puri, K.D.; Leng, Y.; Karmacharya, A.; Liu, Y.; Hegstad, J.; Li, X.; Zhong, S. Molecular Mapping of Quantitative Trait Loci for Fusarium Head Blight Resistance in the Brazilian Spring Wheat Cultivar “Surpresa”. Front. Plant Sci. 2022, 12, 778472. [Google Scholar] [CrossRef]
- Ruan, Y.; Zhang, W.; Knox, R.E.; Berraies, S.; Campbell, H.L.; Ragupathy, R.; Boyle, K.; Polley, B.; Henriquez, M.A.; Burt, A.; et al. Characterization of the Genetic Architecture for Fusarium Head Blight Resistance in Durum Wheat: The Complex Association of Resistance, Flowering Time, and Height Genes. Front. Plant Sci. 2020, 11, 592064. [Google Scholar] [CrossRef]
- Semagn, K.; Henriquez, M.A.; Iqbal, M.; Brûlé-Babel, A.L.; Strenzke, K.; Ciechanowska, I.; Navabi, A.; N’Diaye, A.; Pozniak, C.; Spaner, D. Identification of Fusarium Head Blight Sources of Resistance and Associated QTLs in Historical and Modern Canadian Spring Wheat. Front. Plant Sci. 2023, 14, 1190358. [Google Scholar] [CrossRef]
- Yang, Z.; Gilbert, J.; Fedak, G.; Somers, D.J. Genetic Characterization of QTL Associated with Resistance to Fusarium Head Blight in a Doubled-Haploid Spring Wheat Population. Genome 2005, 48, 187–196. [Google Scholar] [CrossRef]
- Hu, X.; Rocheleau, H.; McCartney, C.; Biselli, C.; Bagnaresi, P.; Balcerzak, M.; Fedak, G.; Yan, Z.; Valè, G.; Khanizadeh, S.; et al. Identification and Mapping of Expressed Genes Associated with the 2DL QTL for Fusarium Head Blight Resistance in the Wheat Line Wuhan 1. BMC Genet. 2019, 20, 47. [Google Scholar] [CrossRef]
- Yi, X.; Cheng, J.; Jiang, Z.; Hu, W.; Bie, T.; Gao, D.; Li, D.; Wu, R.; Li, Y.; Chen, S.; et al. Genetic Analysis of Fusarium Head Blight Resistance in CIMMYT Bread Wheat Line C615 Using Traditional and Conditional QTL Mapping. Front. Plant Sci. 2018, 9, 573. [Google Scholar] [CrossRef]
- Gervais, L.; Dedryver, F.; Morlais, J.-Y.; Bodusseau, V.; Negre, S.; Bilous, M.; Groos, C.; Trottet, M. Mapping of Quantitative Trait Loci for Field Resistance to Fusarium Head Blight in an European Winter Wheat. Theor. Appl. Genet. 2003, 106, 961–970. [Google Scholar] [CrossRef]
- Srinivasachary; Gosman, N.; Steed, A.; Simmonds, J.; Leverington-Waite, M.; Wang, Y.; Snape, J.; Nicholson, P. Susceptibility to Fusarium Head Blight Is Associated with the Rht-D1b Semi-Dwarfing Allele in Wheat. Theor. Appl. Genet. 2008, 116, 1145–1153. [Google Scholar] [CrossRef] [PubMed]
- Ágnes, S.-H.; Szabolcs, L.-K.; Mónika, V.; László, P.; János, P.; Csaba, L.; Ákos, M. Differential Influence of QTL Linked to Fusarium Head Blight, Fusarium-Damaged Kernel, Deoxynivalenol Contents and Associated Morphological Traits in a Frontana-Derived Wheat Population. Euphytica 2014, 200, 9–26. [Google Scholar] [CrossRef]
- Jiang, P.; Zhang, X.; Wu, L.; He, Y.; Zhuang, W.; Cheng, X.; Ge, W.; Ma, H.; Kong, L. A Novel QTL on Chromosome 5AL of Yangmai 158 Increases Resistance to Fusarium Head Blight in Wheat. Plant Pathol. 2020, 69, 249–258. [Google Scholar] [CrossRef]
- Zheng, T.; Hua, C.; Li, L.; Sun, Z.; Yuan, M.; Bai, G.; Humphreys, G.; Li, T. Integration of Meta-QTL Discovery with Omics: Towards a Molecular Breeding Platform for Improving Wheat Resistance to Fusarium Head Blight. Crop J. 2021, 9, 739–749. [Google Scholar] [CrossRef]
- Ghimire, B.; Mergoum, M.; Martinez-Espinoza, A.D.; Sapkota, S.; Pradhan, S.; Babar, M.A.; Bai, G.; Dong, Y.; Buck, J.W. Genetics of Fusarium Head Blight Resistance in Soft Red Winter Wheat Using a Genome-wide Association Study. Plant Genome 2022, 15, e20222. [Google Scholar] [CrossRef] [PubMed]
- Holzapfel, J.; Voss, H.-H.; Miedaner, T.; Korzun, V.; Häberle, J.; Schweizer, G.; Mohler, V.; Zimmermann, G.; Hartl, L. Inheritance of Resistance to Fusarium Head Blight in Three European Winter Wheat Populations. Theor. Appl. Genet. 2008, 117, 1119–1128. [Google Scholar] [CrossRef]
- Song, J.; Pang, Y.; Wang, C.; Zhang, X.; Zeng, Z.; Zhao, D.; Zhang, L.; Zhang, Y. QTL Mapping and Genomic Prediction of Resistance to Wheat Head Blight Caused by Fusarium Verticillioides. Front. Genet. 2022, 13, 1039841. [Google Scholar] [CrossRef]
- Serajazari, M.; Torkamaneh, D.; Gordon, E.; Lee, E.; Booker, H.; Pauls, K.P.; Navabi, A. Identification of Fusarium Head Blight Resistance Markers in a Genome-Wide Association Study of CIMMYT Spring Synthetic Hexaploid Derived Wheat Lines. BMC Plant Biol. 2023, 23, 290. [Google Scholar] [CrossRef]
- Eckard, J.T.; Gonzalez-Hernandez, J.L.; Caffe, M.; Berzonsky, W.; Bockus, W.W.; Marais, G.F.; Baenziger, P.S. Native Fusarium Head Blight Resistance from Winter Wheat Cultivars ‘Lyman,’ ‘Overland,’ ‘Ernie,’ and ‘Freedom’ Mapped and Pyramided onto ‘Wesley’-Fhb1 Backgrounds. Mol. Breed. 2015, 35, 6. [Google Scholar] [CrossRef]
- McCartney, C.A.; Brûlé-Babel, A.L.; Fedak, G.; Martin, R.A.; McCallum, B.D.; Gilbert, J.; Hiebert, C.W.; Pozniak, C.J. Fusarium Head Blight Resistance QTL in the Spring Wheat Cross Kenyon/86ISMN 2137. Front. Microbiol. 2016, 7, 1512. [Google Scholar] [CrossRef]
- Larkin, D.L.; Holder, A.L.; Mason, R.E.; Moon, D.E.; Brown-Guedira, G.; Price, P.P.; Harrison, S.A.; Dong, Y. Genome-wide Analysis and Prediction of Fusarium Head Blight Resistance in Soft Red Winter Wheat. Crop Sci. 2020, 60, 2882–2900. [Google Scholar] [CrossRef]
- Franco, M.F.; Lori, G.A.; Cendoya, M.G.; Panelo, J.; Alonso, M.P.; Malbrán, I.; Pontaroli, A.C. QTL Mapping for Type II Resistance to Fusarium Head Blight and Spike Architecture Traits in Bread Wheat. Crop Breed. Appl. Biotechnol. 2022, 22, e38242229. [Google Scholar] [CrossRef]
- Nannuru, V.K.R.; Windju, S.S.; Belova, T.; Dieseth, J.A.; Alsheikh, M.; Dong, Y.; McCartney, C.A.; Henriques, M.A.; Buerstmayr, H.; Michel, S.; et al. Genetic Architecture of Fusarium Head Blight Disease Resistance and Associated Traits in Nordic Spring Wheat. Theor. Appl. Genet. 2022, 135, 2247–2263. [Google Scholar] [CrossRef] [PubMed]
- Cabral, A.L.; Ruan, Y.; Cuthbert, R.D.; Li, L.; Zhang, W.; Boyle, K.; Berraies, S.; Henriquez, M.A.; Burt, A.; Kumar, S.; et al. Multi-Locus Genome-Wide Association Study of Fusarium Head Blight in Relation to Days to Anthesis and Plant Height in a Spring Wheat Association Panel. Front. Plant Sci. 2023, 14, 1166282. [Google Scholar] [CrossRef]
- Haile, J.K.; Sertse, D.; N’Diaye, A.; Klymiuk, V.; Wiebe, K.; Ruan, Y.; Chawla, H.S.; Henriquez, M.-A.; Wang, L.; Kutcher, H.R.; et al. Multi-Locus Genome-Wide Association Studies Reveal the Genetic Architecture of Fusarium Head Blight Resistance in Durum Wheat. Front. Plant Sci. 2023, 14, 1182548. [Google Scholar] [CrossRef]
- Zhang, W.; Boyle, K.; Brûlé-Babel, A.L.; Fedak, G.; Gao, P.; Robleh Djama, Z.; Polley, B.; Cuthbert, R.D.; Randhawa, H.S.; Jiang, F.; et al. Genetic Characterization of Multiple Components Contributing to Fusarium Head Blight Resistance of FL62R1, a Canadian Bread Wheat Developed Using Systemic Breeding. Front. Plant Sci. 2020, 11, 580833. [Google Scholar] [CrossRef]
- Yang, J.; Bai, G.; Shaner, G.E. Novel Quantitative Trait Loci (QTL) for Fusarium Head Blight Resistance in Wheat Cultivar Chokwang. Theor. Appl. Genet. 2005, 111, 1571–1579. [Google Scholar] [CrossRef]
- Jia, G.; Chen, P.; Qin, G.; Bai, G.; Wang, X.; Wang, S.; Zhou, B.; Zhang, S.; Liu, D. QTLs for Fusarium Head Blight Response in a Wheat DH Population of Wangshuibai/Alondra‘s’. Euphytica 2005, 146, 183–191. [Google Scholar] [CrossRef]
- Lv, C.; Song, Y.; Gao, L.; Yao, Q.; Zhou, R.; Xu, R.; Jia, J. Integration of QTL Detection and Marker Assisted Selection for Improving Resistance to Fusarium Head Blight and Important Agronomic Traits in Wheat. Crop J. 2014, 2, 70–78. [Google Scholar] [CrossRef]
- Prat, N.; Guilbert, C.; Prah, U.; Wachter, E.; Steiner, B.; Langin, T.; Robert, O.; Buerstmayr, H. QTL Mapping of Fusarium Head Blight Resistance in Three Related Durum Wheat Populations. Theor. Appl. Genet. 2017, 130, 13–27. [Google Scholar] [CrossRef]
- Tamburic-Ilincic, L.; Barcellos Rosa, S. Alleles on the Two Dwarfing Loci on 4B and 4D Are Main Drivers of FHB -related Traits in the Canadian Winter Wheat Population “Vienna” × “25R47”. Plant Breed. 2017, 136, 799–808. [Google Scholar] [CrossRef]
- Lemes Da Silva, C.; Fritz, A.; Clinesmith, M.; Poland, J.; Dowell, F.; Peiris, K. QTL Mapping of Fusarium Head Blight Resistance and Deoxynivalenol Accumulation in the Kansas Wheat Variety ‘Everest. ’ Mol. Breed. 2019, 39, 35. [Google Scholar] [CrossRef]
- He, X.; Dreisigacker, S.; Singh, R.P.; Singh, P.K. Genetics for Low Correlation between Fusarium Head Blight Disease and Deoxynivalenol (DON) Content in a Bread Wheat Mapping Population. Theor. Appl. Genet. 2019, 132, 2401–2411. [Google Scholar] [CrossRef]
- Dhariwal, R.; Henriquez, M.A.; Hiebert, C.; McCartney, C.A.; Randhawa, H.S. Mapping of Major Fusarium Head Blight Resistance from Canadian Wheat Cv. AAC Tenacious. Int. J. Mol. Sci. 2020, 21, 4497. [Google Scholar] [CrossRef]
- Zhu, Z.; Xu, X.; Fu, L.; Wang, F.; Dong, Y.; Fang, Z.; Wang, W.; Chen, Y.; Gao, C.; He, Z.; et al. Molecular Mapping of Quantitative Trait Loci for Fusarium Head Blight Resistance in a Doubled Haploid Population of Chinese Bread Wheat. Plant Dis. 2021, 105, 1339–1345. [Google Scholar] [CrossRef]
- Zhang, J.; Gill, H.S.; Halder, J.; Brar, N.K.; Ali, S.; Bernardo, A.; Amand, P.S.; Bai, G.; Turnipseed, B.; Sehgal, S.K. Multi-Locus Genome-Wide Association Studies to Characterize Fusarium Head Blight (FHB) Resistance in Hard Winter Wheat. Front. Plant Sci. 2022, 13, 946700. [Google Scholar] [CrossRef]
- Yu, J.-B.; Bai, G.-H.; Zhou, W.-C.; Dong, Y.-H.; Kolb, F.L. Quantitative Trait Loci for Fusarium Head Blight Resistance in a Recombinant Inbred Population of Wangshuibai/Wheaton. Phytopathology 2008, 98, 87–94. [Google Scholar] [CrossRef]
- Pariyar, S.R.; Erginbas-Orakci, G.; Dadshani, S.; Chijioke, O.B.; Léon, J.; Dababat, A.A.; Grundler, F.M.W. Dissecting the Genetic Complexity of Fusarium Crown Rot Resistance in Wheat. Sci. Rep. 2020, 10, 3200. [Google Scholar] [CrossRef]
- Hu, W.; Gao, D.; Wu, H.; Liu, J.; Zhang, C.; Wang, J.; Jiang, Z.; Liu, Y.; Li, D.; Zhang, Y.; et al. Genome-Wide Association Mapping Revealed Syntenic Loci QFhb-4AL and QFhb-5DL for Fusarium Head Blight Resistance in Common Wheat (Triticum aestivum L.). BMC Plant Biol. 2020, 20, 29. [Google Scholar] [CrossRef]
- Yan, H.; Li, G.; Shi, J.; Tian, S.; Zhang, X.; Cheng, R.; Wang, X.; Yuan, Y.; Cao, S.; Zhou, J.; et al. Genetic Control of Fusarium Head Blight Resistance in Two Yangmai 158-Derived Recombinant Inbred Line Populations. Theor. Appl. Genet. 2021, 134, 3037–3049. [Google Scholar] [CrossRef] [PubMed]
- Sgarbi, C.; Malbrán, I.; Saldúa, L.; Lori, G.A.; Lohwasser, U.; Arif, M.A.R.; Börner, A.; Yanniccari, M.; Castro, A.M. Mapping Resistance to Argentinean Fusarium (Graminearum) Head Blight Isolates in Wheat. IJMS 2021, 22, 13653. [Google Scholar] [CrossRef]
- Shi, C.; Chao, H.; Sun, X.; Suo, Y.; Chen, Z.; Li, Z.; Ma, L.; Li, J.; Ren, Y.; Hua, W.; et al. Genome-Wide Association Study for Fusarium Head Blight Resistance in Common Wheat from China. Agronomy 2023, 13, 1712. [Google Scholar] [CrossRef]
- Sun, Z.; Ye, H.; Chen, X.; Cheng, J.; Zhu, F.; Yang, D.; Hu, S.; Li, L.; Li, T. Qfhb.Yzu.3B.1 and Qfhb.Yzu.6B.3 Are Stable Quantitative Trait Loci for Wheat Resistance to Fusarium Head Blight with Diverse Genetic Backgrounds. Agronomy 2024, 14, 1230. [Google Scholar] [CrossRef]
- Cativelli, M.; Lewis, S.; Appendino, M.L. A Fusarium Head Blight Resistance Quantitative Trait Locus on Chromosome 7D of the Spring Wheat Cultivar Catbird. Crop Sci. 2013, 53, 1464–1471. [Google Scholar] [CrossRef]
- Xu, Q.; Xu, F.; Qin, D.; Li, M.; Fedak, G.; Cao, W.; Yang, L.; Dong, J. Molecular Mapping of QTLs Conferring Fusarium Head Blight Resistance in Chinese Wheat Cultivar Jingzhou 66. Plants 2020, 9, 1021. [Google Scholar] [CrossRef]
- Sri, S.; Gosman, N.; Steed, A.; Faure, S.; Bayles, R.; JenninGS, P.; Nicholson, P. Mapping of QTL Associated with Fusarium Head Blight in Spring Wheat RL4137. Czech J. Genet. Plant Breed. 2008, 44, 147–159. [Google Scholar] [CrossRef]
- Petersen, S.; Lyerly, J.H.; McKendry, A.L.; Islam, M.S.; Brown-Guedira, G.; Cowger, C.; Dong, Y.; Murphy, J.P. Validation of Fusarium Head Blight Resistance QTL in US Winter Wheat. Crop Sci. 2017, 57, 1–12. [Google Scholar] [CrossRef]
- Zakieh, M.; Gaikpa, D.S.; Leiva Sandoval, F.; Alamrani, M.; Henriksson, T.; Odilbekov, F.; Chawade, A. Characterizing Winter Wheat Germplasm for Fusarium Head Blight Resistance Under Accelerated Growth Conditions. Front. Plant Sci. 2021, 12, 705006. [Google Scholar] [CrossRef]
- Gaire, R.; Brown-Guedira, G.; Dong, Y.; Ohm, H.; Mohammadi, M. Genome-Wide Association Studies for Fusarium Head Blight Resistance and Its Trade-Off With Grain Yield in Soft Red Winter Wheat. Plant Dis. 2021, 105, 2435–2444. [Google Scholar] [CrossRef] [PubMed]
- Hu, W.; Gao, D.; Zhang, Y.; Zheng, X.; Lu, C.; Wu, H.; Xu, W.; Cheng, S.; Jia, J. Mapping Quantitative Trait Loci for Type II Fusarium Head Blight Resistance in Two Wheat Recombinant Inbred Line Populations Derived from Yangmai 4 and Yangmai 5. Plant Dis. 2023, 107, 422–430. [Google Scholar] [CrossRef] [PubMed]
- Kugler, K.G.; Siegwart, G.; Nussbaumer, T.; Ametz, C.; Spannagl, M.; Steiner, B.; Lemmens, M.; Mayer, K.F.; Buerstmayr, H.; Schweiger, W. Quantitative Trait Loci-Dependent Analysis of a Gene Co-Expression Network Associated with Fusarium Head Blight Resistance in Bread Wheat (Triticum aestivum L.). BMC Genom. 2013, 14, 728. [Google Scholar] [CrossRef]
- Cong, R.; Xu, M.; Wang, X.; Zhang, W.; Yang, X.; Huang, S.; Wang, B. An Analysis of Soil Carbon Dynamics in Long-Term Soil Fertility Trials in China. Nutr. Cycl. Agroecosyst. 2012, 93, 201–213. [Google Scholar] [CrossRef]
- Song, P.; Li, Y.; Li, H.; Zhang, A.; Zhao, W.; Zhang, H.; Zhang, Z.; Wang, X.; Sun, D. QTL for Plant Structure Type and Their Influence on Seed-Related Traits in Wheat. Euphytica 2024, 220, 74. [Google Scholar] [CrossRef]
- Sari, E.; Berraies, S.; Knox, R.E.; Singh, A.K.; Ruan, Y.; Cuthbert, R.D.; Pozniak, C.J.; Henriquez, M.A.; Kumar, S.; Burt, A.J.; et al. High Density Genetic Mapping of Fusarium Head Blight Resistance QTL in Tetraploid Wheat. PLoS ONE 2018, 13, e0204362. [Google Scholar] [CrossRef]
- Song, P.; Wang, X.; Wang, X.; Zhou, F.; Xu, X.; Wu, B.; Yao, J.; Lv, D.; Yang, M.; Song, X.; et al. Application of 50K Chip-Based Genetic Map to QTL Mapping of Stem-Related Traits in Wheat. Crop Pasture Sci. 2021, 72, 105. [Google Scholar] [CrossRef]
- Boden, S.A.; McIntosh, R.A.; Uauy, C.; Krattinger, S.G.; Dubcovsky, J.; Rogers, W.J.; Xia, X.C.; Badaeva, E.D.; Bentley, A.R.; Brown-Guedira, G.; et al. Updated Guidelines for Gene Nomenclature in Wheat. Theor. Appl. Genet. 2023, 136, 72. [Google Scholar] [CrossRef]
- Ma, S.; Wang, M.; Wu, J.; Guo, W.; Chen, Y.; Li, G.; Wang, Y.; Shi, W.; Xia, G.; Fu, D.; et al. WheatOmics: A Platform Combining Multiple Omics Data to Accelerate Functional Genomics Studies in Wheat. Mol. Plant 2021, 14, 1965–1968. [Google Scholar] [CrossRef]
- Borrill, P.; Ramirez-Gonzalez, R.; Uauy, C. expVIP: A Customizable RNA-Seq Data Analysis and Visualization Platform. Plant Physiol. 2016, 170, 2172–2186. [Google Scholar] [CrossRef] [PubMed]
- Ramírez-González, R.H.; Borrill, P.; Lang, D.; Harrington, S.A.; Brinton, J.; Venturini, L.; Davey, M.; Jacobs, J.; Van Ex, F.; Pasha, A.; et al. The Transcriptional Landscape of Polyploid Wheat. Science 2018, 361, eaar6089. [Google Scholar] [CrossRef] [PubMed]
- Dong, Y.; Xu, D.; Xu, X.; Ren, Y.; Gao, F.; Song, J.; Jia, A.; Hao, Y.; He, Z.; Xia, X. Fine Mapping of QPm.Caas-3BS, a Stable QTL for Adult-Plant Resistance to Powdery Mildew in Wheat (Triticum aestivum L.). Theor. Appl. Genet. 2022, 135, 1083–1099. [Google Scholar] [CrossRef] [PubMed]
- Xu, X.; Sun, D.; Ni, Z.; Zou, X.; Xu, X.; Sun, M.; Cao, Q.; Tong, J.; Ding, F.; Zhang, Y.; et al. Molecular Identification and Validation of Four Stable QTL for Adult-Plant Resistance to Powdery Mildew in Chinese Wheat Cultivar Bainong 64. Theor. Appl. Genet. 2023, 136, 232. [Google Scholar] [CrossRef]


| FHB Trait | Enva | XN1376 | XY81 | RILs | |||||
|---|---|---|---|---|---|---|---|---|---|
| Min–Max | Mean ± SD | Vp | CV | Vg | h2 | ||||
| AS | E1 | 2.00 | 3.00 | 0–4.00 | 1.88 ± 0.99 | 0.86 | 0.54 | 0.45 | 0.70 |
| E2 | 2.00 | 3.00 | 0–4.00 | 2.09 ± 1.00 | 0.98 | ||||
| E3 | 2.00 | 3.00 | 0–4.00 | 1.39 ± 0.77 | 0.55 | ||||
| E4 | 1.00 | 2.00 | 0–4.00 | 1.43 ± 0.91 | 0.68 | ||||
| PSS (%) | E1 | 28.00 | 47.00 | 2.38–100.00 | 34.80 ± 25.67 | 655.98 | 0.60 | 13.27 | 0.62 |
| E2 | 25.30 | 40.70 | 3.45–100.00 | 39.77 ± 24.53 | 601.48 | ||||
| E3 | 15.25 | 23.00 | 3.35–78.72 | 27.08 ± 15.13 | 226.51 | ||||
| E4 | 10.00 | 17.45 | 4.29–62.52 | 26.12 ± 13.14 | 172.58 | ||||
| QTL | Chro | Env | Position (cM) | Marker Interval | LOD Range | PVE Range (%) | Add Range | Confidence Interval |
|---|---|---|---|---|---|---|---|---|
| QFhba-1A | 1A | E1 | 116 | AX-179475663~AX-94384354 | 3.03 | 3.71 | 0.77 | 111.5~120.5 |
| QFhba-2D.1 | 2D.1 | E4 | 27 | AX-94670144~AX-110384092 | 2.95 | 7.46 | 0.18 | 26.5~27.5 |
| QFhba-2D.3 | 2D.3 | BLUP | 18 | AX-109037696~AX-109487867 | 3.91 | 5.10 | 0.04 | 12.5~23.5 |
| QFhba-3A-1 | 3A | E1 | 45 | AX-89644172~AX-109561037 | 3.15 | 3.51 | 0.75 | 43.5~45.5 |
| QFhba-3A-2 | 3A | E3/MET | 113~118 | AX-94818108~AX-179477034 | 2.51~2.73 | 0.98~6.20 | 0.07~0.17 | 111.5~119.5 |
| QFhba-4A-1 | 4A | E3/MET | 7 | AX-109555862~AX-95202101 | 2.87~5.84 | 1.95~7.20 | 0.04~0.11 | 1.5~7.5 |
| QFhba-4A-2 | 4A | E1/E2/MET | 82~87 | AX-94951008~AX-109872817 | 5.54~6.58 | 3.01~7.20 | −0.01~−1.03 | 80.5~87.5 |
| QFhba-4B-1 | 4B | E3/MET | 19 | AX-95651950~AX-108940369 | 3.43~4.14 | 1.56~6.91 | 0.10~0.21 | 16.5~21.5 |
| QFhba-4B-2 | 4B | E1 | 49 | AX-111494900~AX-94879134 | 5.45 | 6.49 | 1.03 | 42.5~50.5 |
| QFhba-5D.2-1 | 5D.2 | E3/E4/BLUP/MET | 28 | AX-110830424~AX-110928491 | 3.83~6.30 | 1.98~18.55 | −0.10~−0.64 | 27.5~28.5 |
| QFhba-5D.2-2 | 5D.2 | E3/E4/BLUP | 40 | AX-111875352~AX-111358076 | 4.10~5.59 | 4.85~6.54 | −0.04 | 37.5~40.5 |
| QFhba-6A.1 | 6A.1 | E2/MET | 33~34 | AX-110438575~AX-110928380 | 2.95~3.28 | 1.45~6.07 | 0.08~0.27 | 29.5~36.5 |
| QFhba-6B | 6B | E2/E3/E4/BLUP/MET | 7~8 | AX-179562391~AX-111913901 | 3.56~5.95 | 2.52~9.86 | −0.03~−0.34 | 3.5~8.5 |
| QFhba-7A | 7A | E1/E3/BLUP/MET | 235 | AX-95255668~AX-95111195 | 4.00~5.61 | 1.97~6.48 | −0.08~−1.04 | 234.5~237.5 |
| QFhbp-2D.3 | 2D.3 | E4/BLUP/MET | 18~20 | AX-109037696~AX-109487867 | 3.91~7.25 | 2.19~5.33 | 0.02~0.17 | 12.5~26.5 |
| QFhbp-3A | 3A | E3/MET | 118~119 | AX-108909726~AX-179559728 | 2.76~4.03 | 1.33~6.76 | 0.02~0.04 | 117.5~120.5 |
| QFhbp-4A-1 | 4A | E3/MET | 7 | AX-109555862~AX-95202101 | 3.33~4.35 | 1.08~7.44 | 0.02~0.06 | 1.5~7.5 |
| QFhbp-5D.2-1 | 5D.2 | E3/E4/BLUP | 40 | AX-111875352~AX-111358076 | 4.02~5.59 | 5.37~5.92 | −0.04 | 37.5~40.5 |
| QFhbp-6B-1 | 6B | E2/E4/MET | 7~8 | AX-179562391~AX-111913901 | 3.56~6.58 | 3.32~9.08 | −0.02~−0.08 | 3.5~8.5 |
| QFhbp-6B-2 | 6B | E3 | 129 | AX-110038884~AX-94704332 | 3.96 | 7.23 | 0.04 | 128.5~129.5 |
| QFhbp-7A | 7A | E1/E3/MET | 230 | AX-94432700~AX-94699624 | 3.63~4.21 | 0.97~6.85 | −0.04 | 229.5~230.5 |
Disclaimer/Publisher’s Note: The statements, opinions and data contained in all publications are solely those of the individual author(s) and contributor(s) and not of MDPI and/or the editor(s). MDPI and/or the editor(s) disclaim responsibility for any injury to people or property resulting from any ideas, methods, instructions or products referred to in the content. |
© 2025 by the authors. Licensee MDPI, Basel, Switzerland. This article is an open access article distributed under the terms and conditions of the Creative Commons Attribution (CC BY) license (https://creativecommons.org/licenses/by/4.0/).
Share and Cite
Song, P.; Li, Y.; Wang, X.; Wang, X.; Zhang, A.; Wang, Z.; Zhao, W.; Li, H.; Zhao, H.; Song, K.; et al. Exploration of Genomic Regions Associated with Fusarium Head Blight Resistance in Wheat and Development and Validation of Kompetitive Allele-Specific Polymerase Chain Reaction Markers. Int. J. Mol. Sci. 2025, 26, 3339. https://doi.org/10.3390/ijms26073339
Song P, Li Y, Wang X, Wang X, Zhang A, Wang Z, Zhao W, Li H, Zhao H, Song K, et al. Exploration of Genomic Regions Associated with Fusarium Head Blight Resistance in Wheat and Development and Validation of Kompetitive Allele-Specific Polymerase Chain Reaction Markers. International Journal of Molecular Sciences. 2025; 26(7):3339. https://doi.org/10.3390/ijms26073339
Chicago/Turabian StyleSong, Pengbo, Yueyue Li, Xin Wang, Xiaoxiao Wang, Aoyan Zhang, Zitan Wang, Wensha Zhao, Haoyang Li, Huiling Zhao, Kefeng Song, and et al. 2025. "Exploration of Genomic Regions Associated with Fusarium Head Blight Resistance in Wheat and Development and Validation of Kompetitive Allele-Specific Polymerase Chain Reaction Markers" International Journal of Molecular Sciences 26, no. 7: 3339. https://doi.org/10.3390/ijms26073339
APA StyleSong, P., Li, Y., Wang, X., Wang, X., Zhang, A., Wang, Z., Zhao, W., Li, H., Zhao, H., Song, K., Xing, Y., Guo, X., Zhang, X., Sun, S., Feng, Y., & Sun, D. (2025). Exploration of Genomic Regions Associated with Fusarium Head Blight Resistance in Wheat and Development and Validation of Kompetitive Allele-Specific Polymerase Chain Reaction Markers. International Journal of Molecular Sciences, 26(7), 3339. https://doi.org/10.3390/ijms26073339