Abstract
Ultra-high magnetic fields and high-sensitivity cryoprobes permit the achievement of a high S/N ratio in 13C detection experiments, thus making a 13C superWEFT (Super water eliminated Fourier transform) experiment feasible. 13C signals that are not visible using 1H observed heteronuclear experiments, nor with established 2D 13C direct detection experiments, become easily observable when a 13C relaxation-based filter is used. Within this frame, optimal control pulses (OC pulses) have been, for the first time, applied to paramagnetic systems. Although the duration of OC pulses competes with relaxation, their application to paramagnetic signals has been successfully tested. OC pulses are much more efficient with respect to the phase- and amplitude-modulated ones routinely used at lower fields while providing bandwidth excitation profiles that are sufficient to meet the need to cover up to an 80 ppm spectral region. On the other hand, when paramagnetic relaxation is shorter than the duration of OC pulses, the use of hard, rectangular pulses is, at the present state of the art, the best approach to minimize the loss of signal intensity.
1. Introduction
The use of tailored NMR approaches to study paramagnetic systems dates back to about 40 years ago, when the evolution of NMR instrumentation allowed the design of many multi-pulse, fast recycling mono- and bi-dimensional experiments, tailored for the detection of fast relaxing and/or far-shifted 1H signals [1,2,3,4]. A very successful breakthrough was the optimization of an inversion recovery experiment, called superWEFT [5]. Although the acronym refers to an experiment optimized for the elimination of the strong water signal [6], this approach has been primarily adopted by the NMR community working on paramagnetic systems to suppress slow relaxing signals and enhance fast relaxing ones [7,8,9,10,11]. Later on, superWEFT was used as a longitudinal relaxation-based filter, applied prior to many homonuclear or heteronuclear experiments, to observe 1H-1H or 1H-15N or 1H-13C connectivities emerging from the crowded diamagnetic envelope of 2D spectra [12,13,14,15,16,17]. The development of 13C direct detection approaches [18], which rely on the possibility of detecting heteronuclear spins with highly sensitive and dedicated NMR probes [19,20,21,22], has represented a milestone in biomolecular NMR [23,24,25,26,27,28]. The direct excitation and observation of these nuclei allow us to use “protonless” coherence transfer pathways, which are particularly efficient in paramagnetic systems, where the dominant contributions to relaxation are γ2 dependent [29,30,31,32]. Under these circumstances, direct detection approaches decrease the blind sphere around the paramagnetic center, where signals are unobserved due to paramagnetic relaxation enhancement [33,34], adding a precious brick to the wall of NMR applications in biological inorganic chemistry [35,36,37,38].
In this frame, we show that a 13C superWEFT experiment, which identifies 13C signals that are not visible with 1H-13C experiments nor with established 2D 13C direct detected experiments [39], represents a precious and helpful piece of information. Essentially, this very simple experiment has become feasible thanks to the availability of ultra-high magnetic fields [40,41,42,43] that allow us to achieve a high S/N ratio in 13C detection experiments [44,45,46] and to expand the spectral region expressed in Hz, thus providing substantial resolution improvements.
The system that we used to set up the experiment is the human mitochondrial ferredoxin protein, FDX2, containing a [Fe2S2] cluster available in two oxidation states [Fe2S2]2+/+. The protein, identified in 2010 [47], is highly homologous to FDX1, which is also a [Fe2S2] mitochondrial protein. The X-ray structures of both these proteins in the proximity of the cluster are almost superimposable, a consideration that opened a debate concerning their functional specificity [48,49,50]. A structural and functional characterization of the active site at the atomic level helps to address differences between the two enzymes. This aspect becomes particularly important considering the recent data that showed that FDX2 has three different electron partner acceptors, all of which recognize the cluster binding region of FDX2 [51,52,53]. Therefore, an atomic-resolution tool able to map these FDX2 interactions is fundamental for defining the route of the electron transfer pathways. NMR spectroscopy exploiting 13C carbon spins affected by the paramagnetic interaction is an excellent option to obtain atomic-level information as close as possible to the metal binding site. Ultra-high magnetic fields, while increasing signal dispersion in the frequency domain (expressed in Hz), pose a challenge regarding the excitation of all the signals of interest. Rectangular pulses might not be the best choice for signal excitation and/or inversion anymore. However, amplitude- and phase-modulated pulses are bound to fail at such ultra-high fields. We will show here how the combination of high magnetic fields and optimal control pulses overcome the above limitations, providing broad inversion profiles that allow us to perform inversion recovery as well as more sophisticated experiments at 28.2 T over large spectral windows.
2. Results
2.1. 13C SuperWEFT Experiments Reveal Signals Not Visible with Other Experiments
The environment of the [Fe2S2] cluster in FDX2 and the four cysteine residues bound to the cluster are shown in Figure 1 [54]. The superWEFT experiment, shown in Figure 2, can be used to identify signals that experience a nuclear spin relaxation enhancement due to the hyperfine interaction. The carbonyl region of the 13C spectrum is the benchmark to test the approach. The carbonyl spins of the Fe3+-bound cysteines are four bonds apart from Fe3+, and, therefore, no contact contributions to the carbonyl chemical shifts are expected [45]. However, there are also other C’ atoms belonging to the cluster binding loop, such as Gly 41, Ala 42, Ala 45 and Ala 48, that have their C’ atoms less than 5 Å away from the Fe3+, close enough to experience significant paramagnetic relaxation enhancement, as described by the Solomon–Bloembergen equation, which explains the electron–nucleus spins dipole–dipole relaxation [55,56,57]. Therefore, one can expect that, within the narrow spectral region where carbonyl signals usually resonate, a few signals experience paramagnetic relaxation enhancement and no paramagnetic shift.
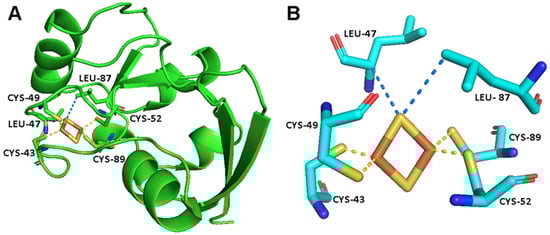
Figure 1.
(A) The crystal structure of FDX2 [54]. (B) The metal binding site of FDX2, showing the [Fe2S2]2+ cluster, the iron bond residues and a few additional residues that are in electronic contact with the cluster [58].
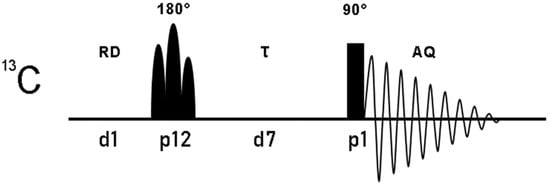
Figure 2.
Pulse sequence of the one-dimensional 13C superWEFT experiment. 13C magnetization, inverted with a selectivity that depends on the nature and duration of the 180° pulse, is subjected to longitudinal relaxation during the delay τ and then acquired with a non-selective 90°. The overall recycle delay is given by the sum of the acquisition time (AQ) and the recycle delay (RD). Below the pulse sequence scheme, pulses and delays are reported according to the standard code of Bruker spectrometers language.
Under these circumstances, a hard and rectangular π pulse is sufficient to provide the inversion of all carbonyl spins. In order to make the experiment fast and effective, the use of an overall recycle delay (AQ+RD, in Figure 2), much shorter than the relaxation times of slow relaxing diamagnetic signals, has to be employed. This will cause a significant suppression of the intensity of slow relaxing signals, thus enhancing broad and fast relaxing ones. After the π inversion pulse, all signals are subjected to T1 relaxation during the delay τ, which acts as a longitudinal relaxation-based filter.
The efficiency of a superWEFT experiment essentially depends on the ratio between the recovery delay τ and the overall recycle delay. For a τ/(AQ+RD) ratio ca. 1, an NMR spectrum where all signals are positive is expected. At decreasing τ values, the inversion recovery gives rise, after the π/2 reading pulse, to positive signal intensity for fast relaxing signals and negative/near zero signal intensity for slow relaxing ones. This is evident in Figure 3A, where a superWEFT experiment was recorded initially with a recycle delay of 110 ms and a τ delay of 70 ms and then repeated at shorter τ delays. The series of experiments show that, for a 45 ms τ delay, only four signals (labeled 1–4 in Figure 3) remain positive, with unaffected or only minimally affected intensity. The fitting of the inversion recovery profile of these four signals permits us to precisely quantify the T1 of signal 4 at 13.4 ms and to obtain for the T1 values of signals 1–3 lower-limit values of 50 ms (signals 1–2) and 60 ms (signal 3). Consistently, the X-ray structure of FDX2 shows that Cys 49 C’ is the only carbonyl atom at 4.1 Å from the Fe3+, with the metal-to-carbon distance for the other C’ spins being ≥ 4.4 Å. The choice of the total recycle delay (AQ + RD) of superWEFT defines the range of T1 values that can be quantitatively measured with this experiment. Signals with 5∙T1 < RD are measured under “almost” steady state conditions, and, therefore, the rate constant of the inversion recovery profile will give the longitudinal relaxation times. On the other hand, signals that relax slower than the above limit will be partly saturated during the superWEFT, such as in the cases of signals 1–3 in Figure 3. Consequently, the rate constant obtained by the fitting is only a lower-limit estimate of the effective T1 values of the signals, as shown in Figure 3B.
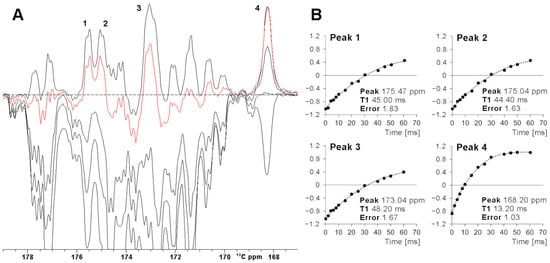
Figure 3.
(A) SuperWEFT 13C experiments on the carbonyl carbon region of oxidized [Fe2S2] FDX2. The series was collected using inter-pulse delays from 100 us to 70 ms. The red trace was recorded with an inter-pulse delay equal to 45 ms. Four signals (1–4), relaxing faster than average, are unambiguously identified. (B) Signal intensities for peaks 1–4 vs the inter-pulse delay τ of the superWEFT experiment. In the case of signals 1–3, the magnetization is not completely recovered to the equilibrium along the z-axis during the recycle delay, and therefore, the time constants represent lower-limit estimates of the effective T1 values. In the case of signal 4, the recovery to the equilibrium is almost completed, and therefore, a reliable longitudinal relaxation time can be measured.
2.2. Optimal Control Pulses Are Useful for Paramagnetic Systems
Unfortunately, the use of rectangular hard pulses at very high fields has intrinsic limitations: a 26 µs 180° pulse, as used in this work, provides an efficient inversion over a +/− 16 ppm spectral region at 28.2 T for carbon spins. This is sufficient for the narrow carbonyl region but inadequate to study a 13C spectrum where signals are spread over a larger spectral window. Our case system is actually an excellent test to tackle this problem: Cβ and Cα atoms of the four Fe3+-bound cysteine residues are only two or three σ bonds apart from the Fe3+ ions, and they experience up to 80 ppm of hyperfine contribution to their shift and, indeed, they are spread in the 140–60 13C ppm region [58]. Figure 4A shows the inversion obtained using a rectangular pulse of 25 µs, with a carrier optimized to observe 13C paramagnetically shifted signals. As expected, a proper inversion is achieved only for signals in the 80–110 ppm region, and a non-homogenous inversion profile is observed outside this narrow spectral region.
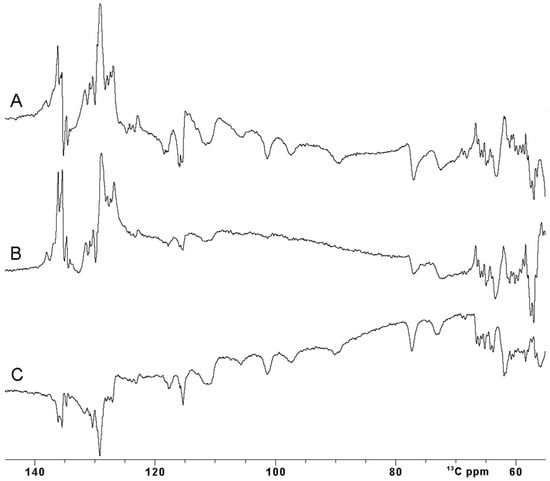
Figure 4.
Comparison between 13C IR experiment performed with different inversion π pulses on oxidized [Fe2S2] FDX2. (A) A rectangular (Squa.100) pulse, (B) shaped (Q3.1000) pulse and (C) optimal control (SURBOP180) pulse [59,60]. The inter-pulse delay was 20 us. All the spectra were properly phased using both zero and first-order phase correction. Baseline correction was not applied.
Amplitude- and phase-modulated pulses, commonly known as shaped pulses, were introduced a long time ago for triple resonance experiments to address the need for uniform inversion profiles over a specific spectral region [59,61,62]. If the spectral region to be covered is huge, as in the case of the paramagnetic resonances, shaped pulses must be shortened to ensure effective irradiation. However, this shortening comes at the cost of increased power. At ultra-high fields when using cryoprobes, this power increase can exceed the maximum tolerable peak power of the NMR probe-head, making the use of such pulses unfeasible, particularly in samples with high ionic strength [63,64,65]. Furthermore, due to their pulse generation approach, even when the power remains within acceptable limits, shaped pulses often fail to meet performance requirements for large spectral widths [59,66]. This results in incomplete irradiation of the desired spins, even for the diamagnetic spin systems. Additionally, these pulses do not compensate for relaxation phenomena occurring during excitation, nor for the J coupling and/or chemical shift evolution [67]. Nevertheless, it is worth trying to invert the signals in the 70 ppm region of interest, exploiting a Q3.1000 pulse 240 µs long and with a corresponding power of 65 W [61]. The spectrum in Figure 4B clearly shows that the inversion made with the Q3.1000 pulse is dramatically affected by the performance of such a pulse at 1.2 GHz of proton Larmor frequency. In our case, fostering the pulse to invert a wide range of ppm results in an inefficient inversion.
Optimal control pulses should be more appropriate to match our needs and to provide complete signal inversion over a large spectral region. Optimal control pulses are indeed designed to provide the maximum desired perturbation possible, exploiting low RF power even for very large spectral widths [60,68,69,70,71,72,73].
An optimal control SURBOP180 pulse, designed to cover an 80 ppm spectral width with a duration of 333 µs with a pulse power of 77 W, was used [60]. Of note, this OC inversion pulse, covering 24 kHz around the frequency carrier, is designed to exploit an rf-amplitude of only 15 kHz. The inversion experiment recorded with OC pulses (Figure 4C) definitely outplays the performance of the Q3.1000 shape inversion pulse in efficiently irradiating the desired spin systems. Even though OC pulses have a designed duration longer than the Q3.1000 inversion pulse previously described, their performance is comparable with the one obtained with a rectangular pulse.
The applied SURBOP pulse is not designed to compensate for the relaxation mechanism during the pulse itself [74,75,76]. However, as reported in Figure 5A-B, which show the spectra obtained after manual polynomial baseline correction, the results obtained with OC pulses show a negligible effect of the relaxation process for the narrowest peaks (i.e., g and b having line widths of 257 Hz and 273 Hz, respectively), while the effect on the broader peaks results in a decrease in intensity of up to 50% (i.e., c and f having line widths of 552 Hz and 429 Hz, respectively).
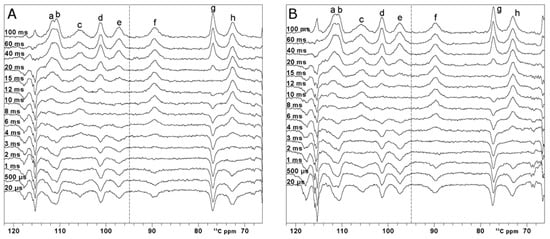
Figure 5.
13C inversion recovery experiments—on oxidized [Fe2S2] FDX2. Series performed with variable inter-pulse delays from 100 ms to 20 µs, recorded using optimal control (A) and rectangular pulses (B) for the inversion. O1p = 95 ppm, AQ+RD = 100 ms. Within each series of inversion recovery experiments, all spectra were processed by applying the same first-order phase and polynomial baseline correction. Letters a-h refer to the different spin systems discussed in the text.
These data suggest that signal relaxation, during the application of inversion pulses, is dominated by transverse relaxation rates. In metalloproteins and in paramagnetic molecules, transverse (and even longitudinal) relaxation times are often below 1 ms. The dominant mechanism contributing to transverse relaxation arises from the non-negligible Fermi contact relaxation [77,78]. In FDX2, most of the unpaired spin density is transferred on sulfide ions and then transferred, mainly via spin polarization mechanisms, not only to the Cα and Cβ of Fe3+-bound cysteines, but also to aliphatic carbon atoms of neighboring residues, close enough to the sulfide ions of the cluster to sense a transfer of unpaired spin density via a Fe3+-S-H-Cali path [15,58].
Figure 6A shows that superWEFT experiments with an OC inversion pulse allowed us to record a single spectrum where ten hyperfine-shifted and fast relaxing signals (labeled in the figure as a’, a-h, h’), in the range of 140–60 13C ppm, can be unambiguously identified. Due to the inversion profile of rectangular inversion pulses, three independent experiments with these pulses were required to obtain the same information. The three spectra shown in Figure 6B, Figure Figure 6C and Figure Figure 6D, respectively, were recorded with the same experiment, where the carrier frequency was set to 130 ppm, 95 ppm and 58 ppm, respectively. The narrow bandwidth excitation of the π rectangular pulse is such that signal a’ can be observed only in Figure 6B; in Figure 6C, signals c–f can be observed with full intensity, while signal g is only partially inverted; finally, the upfield signal h’ clearly emerges only in Figure 6D. Signals a and b are slightly outside the excitation window in both 6B and 6C spectra, but the inversion was evident in both experiments. The superWEFT, based on the differential longitudinal relaxation rate between paramagnetic and diamagnetic signals, operates reliably only when signals are completely inverted. In the spectra obtained with rectangular inversion pulses, this condition was matched only for the narrow spectral region around the frequency carrier, i.e., 146–114 ppm in 6B, and 111–79 ppm and 74–42 ppm in 6D.
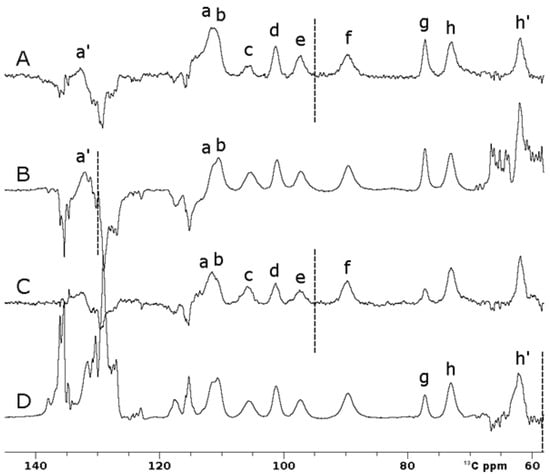
Figure 6.
Comparison between 13C IR experiments on oxidized [Fe2S2] FDX2 performed using 100 ms of recycle delay and 25 ms of τ delay. Optimal control (A) and rectangular pulses (B, C, D) were used for the inversion. (B-D) Traces were obtained using frequency carriers of 130 ppm (B), 95 ppm (C) and 58 ppm (D), respectively. Spectra A and C were recorded with 16,384 scans, while B and D were recorded with 32,768 scans. Letters a-h refer to the different spin systems discussed in the text.
2.3. Inversion Recovery Curves Obtained with and Without OC Pulses
The paramagnetic 13C spectrum shows that signals a’ and h’ are overlapped with diamagnetic signals, and therefore, their T1 values cannot be accurately measured [58]. On the other hand, signals a–h resonate in a region where they are not hampered by diamagnetic spectral crowding. At variance with the carbonyl situation, all these signals are affected by paramagnetic relaxation to a larger extent. Thus, one can use superWEFT to obtain the inversion recovery curve and quantitatively measure T1 values, provided that paramagnetic relaxation rates can be used as structural restraints. Complete inversion recovery series are shown in Figure 5. For comparison purposes, two inversion recovery series using OC inversion pulses and rectangular inversion pulses were performed. T1 values and line widths are summarized in Table 1. The errors on the measured T1 values are below 15%, except for the two fastest relaxing signals, c and f, which display a 20% error. Within the uncertainty, the two series prove the same values of T1. The only signal that provides a different T1 value in the two series is signal c, which is the broadest peak of the spectrum. As observed from the spectra recorded at a very short τ delay, the OC inversion pulse is less efficient than the rectangular pulse, with the restriction that the signal falls within the very narrow excitation region of the rectangular pulse. This shows that, although the OC pulses are substantially more robust in covering a wider spectral region than shaped pulses, relaxation during the pulse is not compensated. Moreover, the possibility to properly irradiate a 24 kHz bandwidth enabled us to properly measure the T1 values of all the paramagnetic signals in a single set of experiments, shortening the overall experimental time.

Table 1.
Chemical shift, atom-type assignments and T1 values, measured with squared and optimal control inversion pulses, are reported for the different protein signals identified here as a’–h.
3. Discussion
In paramagnetic systems, longitudinal relaxation rates depend on the γ2 of the evolving nuclear spin, and therefore, low-γ nuclei allow us to access structural information at progressively shorter metal-to-nucleus distances [30,32,79]. Oxidized FDX2 is a challenging playground to test this approach: the sequence-specific assignment of the protein is almost complete [51]; however, the signal identification of cysteine, 1H and 13C signals is not possible with routine NMR experiments due to the extreme broadening of these signals caused by the proximity to the paramagnetic center. However, a 13C NMR direct detection SuperWEFT is useful to identify paramagnetic resonances within a complex signal envelope, as shown in the case of carbonyl spins overwhelmed by the sharp, slow relaxing signals from residues far from the paramagnetic center. Provided that the molecular structure is available, signal assignment can be performed on the basis of metal-to-atom distances predicted by nuclear relaxation [79], such as the carbonyl signal at 170.7 ppm, assigned here as Cys 49 C’. Furthermore, eight hyperfine-shifted 13C signals are expected for a four-cysteine coordination [80,81]. However, 13C superWEFT was used to identify, in addition to eight hyperfine-shifted well-isolated signals, two additional paramagnetic 13C signals, buried in a crowded envelope and, therefore, not visible without the help of a relaxation-based filter. These results contribute to exhaustively describing the first coordination sphere of the [Fe2S2]2+ center. Within this framework, the use of ultra-high magnetic fields is crucial. Sensitivity is the major issue of 13C detected NMR; at the current state of the art, even when 13C-optimized cryoprobes are used, the gain in sensitivity given by the B0 field allows de facto operation with NMR approaches that, until a few years ago, were considered feasible only for the highly sensitive 1H nucleus. The availability of relaxation times of 13C signals in the immediate proximity of the paramagnetic center, obtained via an IR 13C direct detection experiment, constitutes a useful tool to retrieve structural restraints for structural elucidation [44,82,83,84].
An additional strength of measuring R1 values at high fields is represented by the possibility of expanding the range of action of paramagnetic relaxation enhancements. The observed longitudinal relaxation rates arise from Equation (1):
where R1dia and R1para are, respectively, the sum of all diamagnetic and paramagnetic contributions to the longitudinal relaxation rate. In a slow-motion regime, as in the case of biological macromolecules, R1dia values decrease when the external magnetic field is increased. R1para is obtained by subtracting the diamagnetic contribution from the experimentally measured R1obs; therefore, smaller R1dia values resulted in the observation of R1para contributions down to 1 s−1, enabling us to enlarge the sphere of the protein structure around the cluster that can be investigated using paramagnetic relaxation enhancement (PRE).
R1obs = R1para + R1dia
4. Materials and Methods
4.1. Protein Expression and Purification and NMR Sample Preparation
DNA coding for WT FDX2 (69-186) with an N-terminal 6 xHis-tag and a TEV-cleavage site was cloned into pET29b(+) and transformed into E. coli BL21 (DE3). The construct excludes the mitochondrial targeting sequence and the initial 13 residues. The complete expression and purification protocol is provided elsewhere. The NMR protein buffer was 30 mM HEPES (Sigma-Aldrich®, Kawasaki, Japan) and 150 mM NaCl at pH 7.5. A screw-capped 5 mm NMR tube containing 500 μL of 13C-15N-labeled FDX2 and 50 μL of D2O (Sigma-Aldrich®) was prepared. The protein concentration used in the NMR experiments was between 400 and 1100 μM.
4.2. NMR Data Collection and Processing
13C NMR spectra of oxidized FDX2 were acquired on a Bruker Ascend NMR spectrometer operating at the 300 MHz 13C Larmor frequency. The instrument was equipped with a cryogenically cooled, inverse detection TXO probe-head, optimized for direct detection of 13C spins. Measurements were performed at 298 K, using freshly prepared sample of 13C-15N-labeled oxidized FDX2. Inversion recovery experiments were performed using different π inversion pulses. The rectangular pulse (Squa.100) length was optimized using a zg490 experiment, for a final value of 26 μs with 127 W. The calibration of the Q3.1000 shaped pulse was made with Topspin integrated software STDISP 4.0 for a final value of 240 μs with 65 W. The Surbop180 inversion pulse was designed to cover a 24 kHz bandwidth using a length of 333 μs and a power of 77 W. Two series of inversion recovery experiments were acquired to sample T1 relaxation times of 13C hyperfine-shifted signals from oxidized FDX2. The inversion recovery series differ only in the type of pulse used for the inversion of the signals: Squa.100 and Surbop180. Relaxation delays for signal recovery were as follows: 100 ms, 60 ms, 40 ms, 20 ms, 15 ms, 12 ms, 10 ms, 8 ms, 6 ms, 4 ms, 3 ms, 2 ms, 1 ms, 500 μs and 20 us. A total of 8192 time points were collected for a spectral window of 194 ppm. The frequency offset was 95 ppm. The acquisition and recycle delays were 70 ms and 30 ms, respectively. A total of 16,384 transients were acquired for each experiment. Additionally, one-dimensional 13C NMR spectra were acquired using a Squa.100 inversion pulse, at different frequency offset values: 130 ppm, 95 ppm and 58 ppm. Finally, a series of inversion recovery experiments using a rectangular 180° inversion pulse (26 μs at 127 W) was implemented on the carbonyl region of the 13C spectrum. Acquisition and recycle delays were 70 ms and 40 ms, respectively. The frequency offset was 175 ppm. A total of 32,768 transients were collected. Relaxation delays for signal recovery were as follows: 60 ms, 45 ms, 20 ms, 10 ms and 100 μs. All FIDs were processed using a squared sine function, with an SSB of 2, followed by an exponential multiplication (LB) of 10 Hz. Longitudinal relaxation times were estimated using Topspin integrated software Dynamic Center, using a single exponential function.
5. Conclusions
When approaching ultra-high-field NMR spectroscopy, we face the problem of covering large spectral regions. This is especially true for 13C protein NMR, where signals are spread over 200 ppm and the direct excitation of the complete spectrum is not possible. We have shown here, for the first time, that optimal control pulses are also suitable to address the problem in paramagnetic systems, where relaxation during the pulse plays a crucial role. We have also shown that these pulses are much more efficient with respect to the phase- and amplitude-modulated ones routinely used at lower fields such as the Q-shaped pulses.
Rectangular pulses provide bandwidth excitation profiles that are not sufficient to meet our need to cover up to an 80 ppm spectral region. However, when relaxation rates are > 200 s−1, the duration of OC pulses severely competes with relaxation, and the use of hard, rectangular, pulses is, at the present state of the art, the best approach to minimize the loss of signal intensity. On the other hand, optimal control pulses offer the possibility to combine wide and selective large bandwidth inversion with good robustness with respect to transverse relaxation. This aspect is critical for the application of ultra-high magnetic fields to paramagnetic proteins. In turn, this will be important to foster the study of field-dependent effects arising from the hyperfine interaction between unpaired electrons and nuclear spins.
Author Contributions
Conceptualization, M.P., S.C.-B., M.S. and L.Q.; methodology, M.P., M.S., L.Q. and L.B.; software, M.S., L.Q. and L.B.; validation, M.P., M.S., L.Q. and L.B.; formal analysis, M.P., M.S. and L.Q.; investigation, M.P., M.S., L.Q. and L.B.; resources, S.C.-B. and M.P.; data curation, M.S., L.Q. and L.B.; writing—original draft preparation, M.P., M.S. and L.Q.; writing—review and editing, M.P., S.C.-B., M.S., L.Q. and L.B.; visualization, L.Q. and L.B.; supervision, M.P. and M.S.; project administration, M.P.; funding acquisition, M.P. and S.C.-B. All authors have read and agreed to the published version of the manuscript.
Funding
Financial support (L.Q.) is provided by the European Union NextGenerationEU National Recovery and Resilience Plan, Mission 4, Component 2, Investment 1.5, THE, the Tuscany Health Ecosystem,_ECS00000017-CUP B83C220 03920001. Financial support is also provided by the project “Potentiating the Italian Capacity for Structural Biology Services in Instruct-ERIC”, acronym “ITACA.SB” (Project No. IR0000009, CUP B53C22001790006), funded by the European Union’s NextGenerationEU under the MUR call 3264/2021 PNRR M4/C2/L3.1.1; in particular, M.S. is a Fellow of this project.
Data Availability Statement
Datasets generated during this study are available upon request to the corresponding author.
Acknowledgments
The support of the CERM/CIRMMP center of Instruct-ERIC and of the Italian Ministry for University and Research (MUR, FOE funding) is gratefully acknowledged. This article is based on work from COST Action FeSImmChemNet (CA21115) supported by COST (European Cooperation in Science and Technology).
Conflicts of Interest
The authors declare no conflict of interest.
Abbreviations
The following abbreviations are used in this manuscript:
| MDPI | Multidisciplinary Digital Publishing Institute |
| S/N | Signal-to-Noise |
| OC | optimal control |
| NMR | Nuclear Magnetic Resonance |
| WEFT | Water-Eliminated Fourier Transform |
| Hz | Hertz |
| FDX2 | Human Ferredoxin 2 |
| FDX1 | Adrenodoxin |
| AQ | acquisition delay |
| RD | recycle delay |
| RF | Radio Frequency |
| IR | inversion recovery |
| PRE | paramagnetic relaxation enhancement |
References
- Bertini, I.; Lanini, G.; Luchinat, C.; Messori, L.; Monnanni, R.; Scozzafava, A. Investigation of Cu2Co2SOD and its anion derivatives. 1H NMR and electronic spectra. J. Am. Chem. Soc. 1985, 107, 4391–4396. [Google Scholar] [CrossRef]
- Bertini, I.; Luchinat, C. NMR of Paramagnetic Molecules in Biological Systems; Benjamin/Cummings: Menlo Park, CA, USA, 1986. [Google Scholar]
- Ramaprasad, S.; Johnson, R.D.; La Mar, G.N. 1H-NMR Nuclear Overhauser Enhancement and Paramagnetic Relaxation Determination of Peak Assignment and the Orientation of Ile-99 FG5 in Metcyanomyoglobin. J. Am. Chem. Soc. 1984, 106, 5330–5335. [Google Scholar] [CrossRef]
- Santos, H.; Turner, D.L.; Xavier, A.V.; LeGall, J. Two-Dimensional NMR Studies of Electron Transfer in Cytochrome c3. J. Magn. Reson. 1984, 59, 177–180. [Google Scholar] [CrossRef]
- Inubushi, T.; Becker, E.D. Efficient detection of paramagnetically shifted NMR resonances by optimizing the WEFT pulse sequence. J. Magn. Reson. 1983, 51, 128–133. [Google Scholar] [CrossRef]
- Patt, S.L.; Sykes, B.D. Water eliminated fourier transform NMR spectroscopy. J. Chem. Phys. 1972, 56, 3182. [Google Scholar] [CrossRef]
- Rigby, S.E.J.; Burch, A.M.; Moore, G.R. 1H-NMR Determination of the Ionization Constant of a Carboxylic Acid Group of a Haem Protein in Mixed Aqueous-Organic Solvents Using the SuperWEFT Sequence. Magn. Reson. Chem. 1991, 29, 1036–1039. [Google Scholar] [CrossRef]
- Banci, L.; Bertini, I.; Eltis, L.D.; Felli, I.C.; Kastrau, D.H.W.; Luchinat, C.; Piccioli, M.; Pierattelli, R.; Smith, M. The three dimensional structure in solution of the paramagnetic protein high-potential iron-sulfur protein I from Ectothiorhodospira halophila through nuclear magnetic resonance. Eur. J. Biochem. 1994, 225, 715–725. [Google Scholar] [CrossRef]
- Bertini, I.; Briganti, F.; Luchinat, C.; Scozzafava, A.; Sola, M. 1H NMR spectroscopy and the electronic structure of the high potential iron-sulfur protein from Chromatium vinosum. J. Am. Chem. Soc. 1991, 113, 1237–1245. [Google Scholar] [CrossRef]
- Bertini, I.; Briganti, F.; Luchinat, C.; Messori, L.; Monnanni, R.; Scozzafava, A.; Vallini, G. 1H NMR studies on partially and fully reduced 2(4Fe-4S) ferredoxin from Clostridium pasteurianum. Eur. J. Biochem. 1992, 204, 831–839. [Google Scholar] [CrossRef]
- Macedo, A.L.; Moura, I.; Moura, J.J.G.; LeGall, J.; Huynh, B.H. Temperature-dependent proton NMR investigation of the electronic structure of the trinuclear iron cluster of the oxidized Desulfovibrio gigas ferredoxin II. Inorg. Chem. 1993, 32, 1101–1105. [Google Scholar] [CrossRef]
- Chen, Z.G.; de Ropp, J.S.; Hernandez, G.; La Mar, G.N. 2D NMR approaches to characterizing the molecular structure and dynamic stability of the active site for cyanide-inhibited horseradish peroxidase. J. Am. Chem. Soc. 1994, 116, 8772–8783. [Google Scholar] [CrossRef]
- La Mar, G.N.; Chen, Z.; de Ropp, J.S. Assignment Strategies and Structure Determination in Cyanide-Inhibited Heme Peroxidases. In Nuclear Magnetic Resonance of Paramagnetic Macromolecules; La Mar, G.N., Ed.; Kluwer Academic Publishers: Dordrecht, The Netherlands, 1995; pp. 55–74. [Google Scholar]
- Kalverda, A.P.; Salgado, J.; Dennison, C.; Canters, G.W. Analysis of the paramagnetic copper (II) site of amicyanin by 1H NMR spectroscopy. Biochemistry 1996, 35, 3085–3092. [Google Scholar] [CrossRef]
- Lin, I.J.; Xia, B.; King, D.S.; Machonkin, T.E.; Westler, W.M.; Markley, J.L. Hyperfine-shifted (13)C and (15)N NMR signals from Clostridium pasteurianum rubredoxin: Extensive assignments and quantum chemical verification. J. Am. Chem. Soc. 2009, 131, 15555–15563. [Google Scholar] [CrossRef] [PubMed]
- Holroyde, C.P.; Gabuzda, T.G.; Putnam, R.C.; Paul, P.; Reichard, G.A. Altered glucose metabolism in metastatic carcinoma. Cancer Res. 1975, 35, 3710–3714. [Google Scholar]
- Machonkin, T.E.; Westler, W.M.; Markley, J.L. 13C-13C 2D NMR: A novel strategy for the study of paramagnetic proteins with slow electronic relaxation times. J. Am. Chem. Soc. 2002, 124, 3204–3205. [Google Scholar] [CrossRef] [PubMed]
- Felli, I.C.; Pierattelli, R. Intrinsically disordered proteins studied by NMR spectroscopy. Adv. Exp. Med. Biol. 2015, 870, 361–362. [Google Scholar]
- Eletsky, A.; Moreira, O.; Kovacs, H.; Pervushin, K. A novel strategy for the assignment of side-chain resonances in completely deuterated large proteins using (13)C spectroscopy. J. Biomol. NMR 2003, 26, 167–179. [Google Scholar] [CrossRef]
- Bermel, W.; Bertini, I.; Felli, I.C.; Kümmerle, R.; Pierattelli, R. 13C direct detection experiments on the paramagnetic oxidized monomeric copper, zinc superoxide dismutase. J. Am. Chem. Soc. 2003, 125, 16423–16429. [Google Scholar] [CrossRef]
- Bertini, I.; Luchinat, C.; Parigi, G.; Pierattelli, R. NMR of paramagnetic metalloproteins. ChemBioChem 2005, 6, 1536–1549. [Google Scholar] [CrossRef]
- Bermel, W.; Bertini, I.; Duma, L.; Emsley, L.; Felli, I.C.; Pierattelli, R.; Vasos, P.R. Complete assignment of heteronuclear protein resonances by protonless NMR spectroscopy. Angew. Chem. Int. Ed. 2005, 44, 3089–3092. [Google Scholar] [CrossRef]
- Richter, C.; Kovacs, H.; Buck, J.; Wacker, A.; Furtig, B.; Bermel, W.; Schwalbe, H. 13C-direct detected NMR experiments for the sequential J-based resonance assignment of RNA oligonucleotides. J. Biomol. NMR 2010, 47, 259–269. [Google Scholar] [CrossRef]
- Jordan, J.B.; Kovacs, H.; Wang, Y.; Mobli, M.; Luo, R.; Anklin, C.; Hoch, J.C.; Kriwacki, R.W. Three-dimensional 13C-detected CH3-TOCSY using selectively protonated proteins: Facile methyl resonance assignment and protein structure determination. J. Am. Chem. Soc. 2006, 128, 9119–9128. [Google Scholar] [CrossRef] [PubMed]
- Hu, K.; Vögeli, B.; Clore, G.M. 13C detected HN(CA)C and HMCMC experiments using a single methyl reprotonated sample for unambiguous methyl-resonance assignment. J. Biomol. NMR 2006, 36, 259–266. [Google Scholar] [CrossRef]
- Shimba, N.; Kovacs, H.; Stern, A.S.; Nomura, A.M.; Shimada, I.; Hoch, J.C.; Craik, C.S.; Dotsch, V. Optimization of 13C direct detection NMR methods. J. Biomol. NMR 2004, 30, 175–179. [Google Scholar] [CrossRef]
- Felli, I.C.; Gonnelli, L.; Pierattelli, R. In-cell 13C NMR spectroscopy for the study of intrinsically disordered proteins. Nat. Protoc. 2014, 9, 2005–2016. [Google Scholar] [CrossRef] [PubMed]
- Bertini, I.; Felli, I.C.; Kümmerle, R.; Moskau, D.; Pierattelli, R. 13C−13C NOESY: An attractive alternative for studying large macromolecules. J. Am. Chem. Soc. 2004, 126, 464–465. [Google Scholar] [CrossRef] [PubMed]
- Bertini, I.; Jimenez, B.; Piccioli, M. 13C direct detected experiments: Optimization for paramagnetic signals. J. Magn. Reson. 2005, 174, 125–132. [Google Scholar] [CrossRef]
- Trindade, I.B.; Coelho, A.; Cantini, F.; Piccioli, M.; Louro, R.O. NMR of paramagnetic metalloproteins in solution: Ubi venire, quo vadis? J. Inorg. Biochem. 2022, 234, 111871. [Google Scholar] [CrossRef]
- Piccioli, M. Paramagnetic NMR Spectroscopy Is a Tool to Address Reactivity, Structure, and Protein-Protein Interactions of Metalloproteins: The Case of Iron-Sulfur Proteins. Magnetochemistry 2020, 6, 46. [Google Scholar] [CrossRef]
- Querci, L.; Piccioli, M.; Ciofi-Baffoni, S.; Banci, L. Structural aspects of iron-sulfur protein biogenesis: An NMR view. Biochim. Et Biophys. acta. Mol. Cell Res. 2024, 1871, 119786. [Google Scholar] [CrossRef]
- Arnesano, F.; Banci, L.; Bertini, I.; Felli, I.C.; Luchinat, C.; Thompsett, A.R. A strategy for the NMR characterization of type II copper (II) proteins: The case of the copper trafficking protein CopC from Pseudomonas Syringae. J. Am. Chem. Soc. 2003, 125, 7200–7208. [Google Scholar] [CrossRef] [PubMed]
- Balayssac, S.; Jiménez, B.; Piccioli, M. Assignment Strategy for Fast Relaxing Signals: Complete Aminoacid Identification in Thulium Substituted Calbindin D9k. J. Biomol. NMR 2006, 34, 63–73. [Google Scholar] [CrossRef]
- Baglivo, I.; Russo, L.; Esposito, S.; Malgieri, G.; Renda, M.; Salluzzo, A.; Di Blasio, B.; Isernia, C.; Fattorusso, R.; Pedone, P.V. The structural role of the zinc ion can be dispensable in prokaryotic zinc-finger domains. Proc. Natl. Acad. Sci. USA. 2009, 106, 6933–6938. [Google Scholar] [CrossRef]
- Zambelli, B.; Basak, P.; Hu, H.; Piccioli, M.; Musiani, F.; Broll, V.; Imbert, L.; Boisbouvier, J.; Maroney, M.J.; Ciurli, S. The structure of the high-affinity nickel-binding site in the Ni,Zn-HypA•UreE2 complex. Metallomics 2023, 15, mfad003. [Google Scholar] [CrossRef] [PubMed]
- Invernici, M.; Selvolini, G.; Silva, J.M.; Marrazza, G.; Ciofi-Baffoni, S.; Piccioli, M. Interconversion between [2Fe-2S] and [4Fe-4S] cluster glutathione complexes. Chem. Commun. 2022, 58, 3533–3536. [Google Scholar] [CrossRef]
- Trindade, I.B.; Invernici, M.; Cantini, F.; Louro, R.O.; Piccioli, M. PRE-driven protein NMR structures: An alternative approach in highly paramagnetic systems. FEBS J. 2021, 288, 3010–3023. [Google Scholar] [CrossRef] [PubMed]
- Felli, I.C.; Pierattelli, R. (13)C Direct Detected NMR for Challenging Systems. Chem. Rev. 2022, 122, 9468–9496. [Google Scholar] [CrossRef]
- Wikus, P.; Frantz, W.; Kümmerle, R.; Vonlanthen, P. Commercial gigahertz-class NMR magnets. Supercond. Sci. Technol. 2022, 35, 033001. [Google Scholar] [CrossRef]
- Luchinat, E.; Barbieri, L.; Cremonini, M.; Banci, L. Protein in-cell NMR spectroscopy at 1.2 GHz. J. Biomol. NMR 2021, 75, 97–107. [Google Scholar] [CrossRef]
- Nimerovsky, E.; Movellan, K.T.; Zhang, X.C.; Forster, M.C.; Najbauer, E.; Xue, K.; Dervişoǧlu, R.; Giller, K.; Griesinger, C.; Becker, S.; et al. Proton Detected Solid-State NMR of Membrane Proteins at 28 Tesla (1.2 GHz) and 100 kHz Magic-Angle Spinning. Biomolecules 2021, 11, 752. [Google Scholar] [CrossRef]
- Callon, M.; Malär, A.A.; Pfister, S.; Římal, V.; Weber, M.E.; Wiegand, T.; Zehnder, J.; Chávez, M.; Cadalbert, R.; Deb, R.; et al. Biomolecular solid-state NMR spectroscopy at 1200 MHz: The gain in resolution. J. Biomol. NMR 2021, 75, 255–272. [Google Scholar] [CrossRef]
- Querci, L.; Fiorucci, L.; Ravera, E.; Piccioli, M. Paramagnetic Nuclear Magnetic Resonance: The Toolkit. Inorganics 2024, 12, 15. [Google Scholar] [CrossRef]
- Querci, L.; Trindade, I.B.; Invernici, M.; Silva, J.M.; Cantini, F.; Louro, R.O.; Piccioli, M. NMR of Paramagnetic Proteins: 13C Derived Paramagnetic Relaxation Enhancements Are an Additional Source of Structural Information in Solution. Magnetochemistry 2023, 9, 66. [Google Scholar] [CrossRef]
- Querci, L.; Grifagni, D.; Trindade, I.B.; Silva, J.M.; Louro, R.O.; Cantini, F.; Piccioli, M. Paramagnetic NMR to study iron sulfur proteins: 13C detected experiments illuminate the vicinity of the metal center. J. Biomol. NMR 2023, 77, 247–259. [Google Scholar] [CrossRef] [PubMed]
- Sheftel, A.D.; Stehling, O.; Pierik, A.J.; Elsasser, H.P.; Muhlenhoff, U.; Webert, H.; Hobler, A.; Hannemann, F.; Bernhardt, R.; Lill, R. Humans possess two mitochondrial ferredoxins, Fdx1 and Fdx2, with distinct roles in steroidogenesis, heme, and Fe/S cluster biosynthesis. Proc. Natl. Acad. Sci. USA 2010, 107, 11775–11780. [Google Scholar] [CrossRef]
- Schulz, V.; Freibert, S.A.; Boss, L.; Mühlenhoff, U.; Stehling, O.; Lill, R. Mitochondrial [2Fe-2S] ferredoxins: New functions for old dogs. FEBS Lett. 2023, 597, 102–121. [Google Scholar] [CrossRef]
- Shi, Y.; Ghosh, M.; Kovtunovych, G.; Crooks, D.R.; Rouault, T.A. Both human ferredoxins 1 and 2 and ferredoxin reductase are important for iron-sulfur cluster biogenesis. Biochim. Biophys. Acta 2012, 1823, 484–492. [Google Scholar] [CrossRef]
- Cai, K.; Tonelli, M.; Frederick, R.O.; Markley, J.L. Human Mitochondrial Ferredoxin 1 (FDX1) and Ferredoxin 2 (FDX2) Both Bind Cysteine Desulfurase and Donate Electrons for Iron-Sulfur Cluster Biosynthesis. Biochemistry 2017, 56, 487–499. [Google Scholar] [CrossRef]
- Grifagni, D.; Doni, D.; Susini, B.; Fonseca, B.M.; Louro, R.O.; Costantini, P.; Ciofi-Baffoni, S. Unraveling the molecular determinants of a rare human mitochondrial disorder caused by the P144L mutation of FDX2. Protein Sci. 2024, 33, e5197. [Google Scholar] [CrossRef]
- Steinhilper, R.; Boß, L.; Freibert, S.-A.; Schulz, V.; Krapoth, N.; Kaltwasser, S.; Lill, R.; Murphy, B.J. Two-stage binding of mitochondrial ferredoxin-2 to the core iron-sulfur cluster assembly complex. Nat. Commun. 2024, 15, 10559. [Google Scholar] [CrossRef]
- Weiler, B.D.; Brück, M.C.; Kothe, I.; Bill, E.; Lill, R.; Mühlenhoff, U. Mitochondrial [4Fe-4S] protein assembly involves reductive [2Fe-2S] cluster fusion on ISCA1-ISCA2 by electron flow from ferredoxin FDX2. Proc. Natl. Acad. Sci. USA 2020, 117, 20555–20565. [Google Scholar] [CrossRef] [PubMed]
- Schulz, V.; Basu, S.; Freibert, S.A.; Webert, H.; Boss, L.; Mühlenhoff, U.; Pierrel, F.; Essen, L.O.; Warui, D.M.; Booker, S.J.; et al. Functional spectrum and specificity of mitochondrial ferredoxins FDX1 and FDX2. Nat. Chem. Biol. 2023, 19, 206–217. [Google Scholar] [CrossRef]
- Solomon, I.; Bloembergen, N. Nuclear Magnetic Interactions in the HF Molecule. J. Chem. Phys. 1956, 25, 261–266. [Google Scholar] [CrossRef]
- Bertini, I.; Luchinat, C.; Parigi, G.; Ravera, E. NMR of Paramagnetic Molecules; Elsevier: Amsterdam, The Netherlands, 2016. [Google Scholar]
- Ravera, E.; Gigli, L.; Fiorucci, L.; Luchinat, C.; Parigi, G. The evolution of paramagnetic NMR as a tool in structural biology. Phys. Chem. Chem. Phys. 2022, 24, 17397–17416. [Google Scholar] [CrossRef] [PubMed]
- Querci, L.; Fiorucci, L.; Grifagni, D.; Costantini, P.; Ravera, E.; Ciofi-Baffoni, S.; Piccioli, M. Shedding light on the electron delocalization pathway at the [Fe2S2]2+ cluster of FDX2 through the combination of paramag-netic NMR and density functional theory. Inorg. Chem. 2025, 64, 6698–6712. [Google Scholar] [CrossRef] [PubMed]
- Geen, H.; Freeman, R. Band-selective radiofrequency pulses. J. Magn. Reson. 1991, 93, 93–141. [Google Scholar] [CrossRef]
- Slad, S.; Bermel, W.; Kümmerle, R.; Mathieu, D.; Luy, B. Band-selective universal 90° and 180° rotation pulses covering the aliphatic carbon chemical shift range for triple resonance experiments on 1.2 GHz spectrometers. J. Biomol. NMR 2022, 76, 185–195. [Google Scholar] [CrossRef]
- Emsley, L.; Bodenhausen, G. Gaussian pulse cascades: New analytical functions for rectangular selective inversion and in-phase excitation in NMR. Chem. Phys. Lett. 1990, 165, 469–476. [Google Scholar] [CrossRef]
- Emsley, L.; Bodenhausen, G. Optimization of Shaped Selective Pulses for Nmr Using a Quaternion Description of Their Overall Propagators. J. Magn. Reson. 1992, 97, 135–148. [Google Scholar] [CrossRef]
- Sattler, M.; Schleucher, J.; Griesinger, C. Heteronuclear multidimensional NMR experiments for the structure determination of proteins in solution employing pulsed field gradients. Progr. NMR Spectrosc. 1999, 34, 93–158. [Google Scholar] [CrossRef]
- Robosky, L.C.; Reily, M.D.; Avizonis, D. Improving NMR sensitivity by use of salt-tolerant cryogenically cooled probes. Anal. Bioanal. Chem. 2007, 387, 529–532. [Google Scholar] [CrossRef] [PubMed]
- Schiavina, M.; Bracaglia, L.; Rodella, M.A.; Kümmerle, R.; Konrat, R.; Felli, I.C.; Pierattelli, R. Optimal (13)C NMR investigation of intrinsically disordered proteins at 1.2 GHz. Nat. Protoc. 2024, 19, 406–440. [Google Scholar] [CrossRef]
- Joseph, D.; Griesinger, C. Optimal control pulses for the 1.2-GHz (28.2-T) NMR spectrometers. Sci. Adv. 2023, 9, eadj1133. [Google Scholar] [CrossRef] [PubMed]
- Brutscher, B.; Solyom, Z. Polarization-Enhanced Fast-Pulsing Techniques. In Fast NMR Data Acquisition: Beyond the Fourier Transform; Mobli, M., Hoch, J.C., Eds.; The Royal Society of Chemistry: London, UK, 2017. [Google Scholar] [CrossRef]
- Coote, P.W.; Robson, S.A.; Dubey, A.; Boeszoermenyi, A.; Zhao, M.; Wagner, G. Optimal control theory enables homonuclear decoupling without Bloch–Siegert shifts in NMR spectroscopy. Nat. Commun. 2018, 9, 3014. [Google Scholar] [CrossRef] [PubMed]
- Skinner, T.E.; Reiss, T.O.; Luy, B.; Khaneja, N.; Glaser, S.J. Application of optimal control theory to the design of broadband excitation pulses for high-resolution NMR. J. Magn. Reson. 2003, 163, 8–15. [Google Scholar] [CrossRef]
- Khaneja, N.; Reiss, T.; Kehlet, C.; Schulte-Herbrüggen, T.; Glaser, S.J. Optimal control of coupled spin dynamics: Design of NMR pulse sequences by gradient ascent algorithms. J. Magn. Reson. 2005, 172, 296–305. [Google Scholar] [CrossRef]
- Tosner, Z.; Vosegaard, T.; Kehlet, C.; Khaneja, N.; Glaser, S.J.; Nielsen, N.C. Optimal control in NMR spectroscopy: Numerical implementation in SIMPSON. J. Magn. Reson. 2009, 197, 120–134. [Google Scholar] [CrossRef]
- Nimbalkar, M.; Luy, B.; Skinner, T.E.; Neves, J.L.; Gershenzon, N.I.; Kobzar, K.; Bermel, W.; Glaser, S.J. The Fantastic Four: A plug ‘n’ play set of optimal control pulses for enhancing NMR spectroscopy. J. Magn. Reson. 2013, 228, 16–31. [Google Scholar] [CrossRef]
- Frueh, D.P.; Ito, T.; Li, J.-S.; Wagner, G.; Glaser, S.J.; Khaneja, N. Sensitivity enhancement in NMR of macromolecules by application of optimal control theory. J. Biomol. NMR 2005, 32, 23–30. [Google Scholar] [CrossRef]
- Skinner, T.E.; Gershenzon, N.I.; Nimbalkar, M.; Glaser, S.J. Optimal control design of band-selective excitation pulses that accommodate relaxation and RF inhomogeneity. J. Magn. Reson. 2012, 217, 53–60. [Google Scholar] [CrossRef][Green Version]
- Gershenzon, N.I.; Kobzar, K.; Luy, B.; Glaser, S.J.; Skinner, T.E. Optimal control design of excitation pulses that accommodate relaxation. J. Magn. Reson. 2007, 188, 330–336. [Google Scholar] [CrossRef] [PubMed]
- Khaneja, N.; Reiss, T.; Luy, B.; Glaser, S.J. Optimal control of spin dynamics in the presence of relaxation. J. Magn. Reson. 2003, 162, 311–319. [Google Scholar] [CrossRef] [PubMed][Green Version]
- Banci, L.; Bertini, I.; Luchinat, C. The 1H NMR parameters of magnetically coupled dimers-The Fe2S2 proteins as an example. Struct. Bond. 1990, 72, 113–135. [Google Scholar]
- Bertini, I.; Galas, O.; Luchinat, C.; Parigi, G.; Spina, G. Nuclear and Electron Relaxation in Magnetic Exchange Coupled Dimers: Implications for NMR Spectroscopy. J. Magn. Reson. 1998, 130, 33–44. [Google Scholar] [CrossRef]
- Grifagni, D.; Silva, J.M.; Cantini, F.; Piccioli, M.; Banci, L. Relaxation-based NMR assignment: Spotlights on ligand binding sites in human CISD3. J. Inorg. Biochem. 2023, 239, 112089. [Google Scholar] [CrossRef]
- Machonkin, T.E.; Westler, W.M.; Markley, J.L. Paramagnetic NMR spectroscopy and density functional calculations in the analysis of the geometric and electronic structures of iron-sulfur proteins. Inorg. Chem. 2005, 44, 779–797. [Google Scholar] [CrossRef] [PubMed]
- Machonkin, T.E.; Westler, W.M.; Markley, J.L. Strategy for the study of paramagnetic proteins with slow electronic relaxation rates by nmr spectroscopy: Application to oxidized human [2Fe-2S] ferredoxin. J. Am. Chem. Soc. 2004, 126, 5413–5426. [Google Scholar] [CrossRef]
- Trindade, I.B.; Hernandez, G.; Lebegue, E.; Barriere, F.; Cordeiro, T.; Piccioli, M.; Louro, R.O. Conjuring up a ghost: Structural and functional characterization of FhuF, a ferric siderophore reductase from E. coli. J. Biol. Inorg. Chem. 2021, 26, 313–326. [Google Scholar] [CrossRef] [PubMed]
- Mori, M.; Kateb, F.; Bodenhausen, G.; Piccioli, M.; Abergel, D. Towards structural dynamics: Protein motions viewed by chemical shift modulations and direct detection of C’N multiple-quantum relaxation. J. Am. Chem. Soc. 2010, 132, 3594–3600. [Google Scholar] [CrossRef]
- Camponeschi, F.; Gallo, A.; Piccioli, M.; Banci, L. The long-standing relationship between Paramagnetic NMR and Iron-Sulfur proteins: The mitoNEET example. An old method for new stories or the other way around? Magn. Reson. Discuss. 2021, 2, 203–211. [Google Scholar] [CrossRef]


Disclaimer/Publisher’s Note: The statements, opinions and data contained in all publications are solely those of the individual author(s) and contributor(s) and not of MDPI and/or the editor(s). MDPI and/or the editor(s) disclaim responsibility for any injury to people or property resulting from any ideas, methods, instructions or products referred to in the content. |
© 2025 by the authors. Licensee MDPI, Basel, Switzerland. This article is an open access article distributed under the terms and conditions of the Creative Commons Attribution (CC BY) license (https://creativecommons.org/licenses/by/4.0/).