
Influence of Side Chain–Backbone Interactions and Explicit Hydration on Characteristic Aromatic Raman Fingerprints as Analysed in Tripeptides Gly-Xxx-Gly (Xxx = Phe, Tyr, Trp)

 ,
,  and
and
Abstract
:
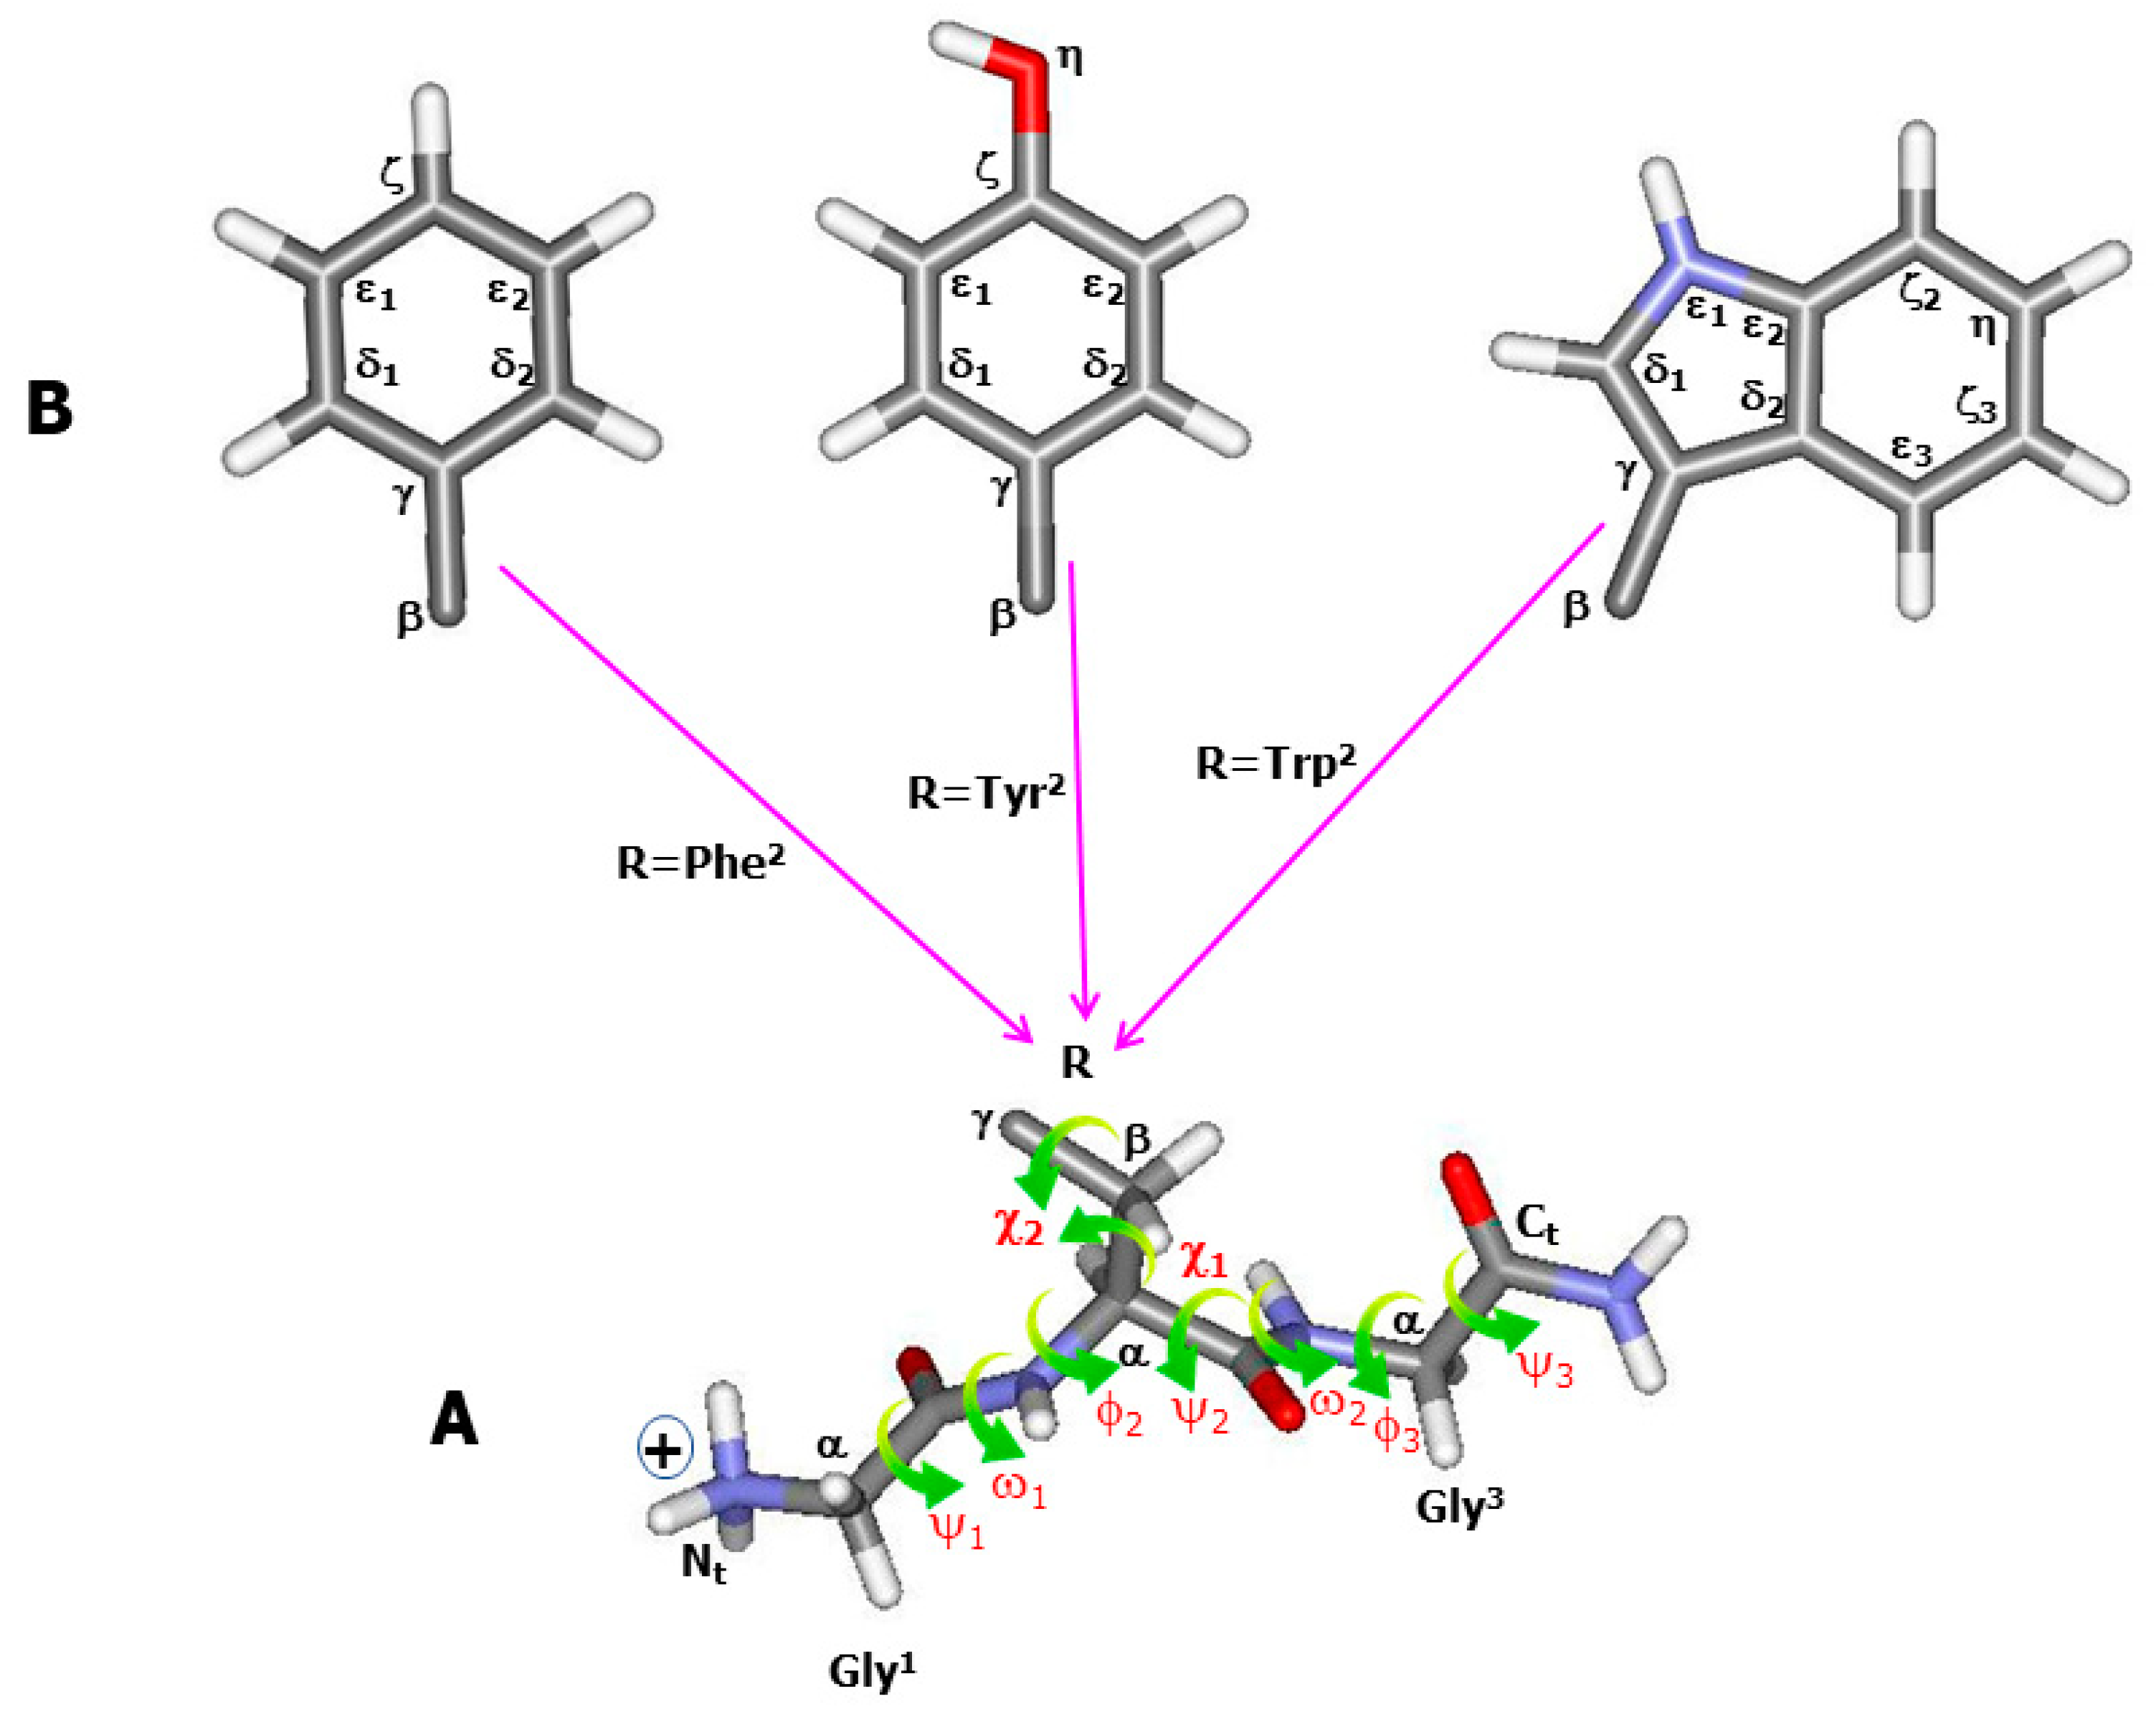
1. Introduction
2. Results
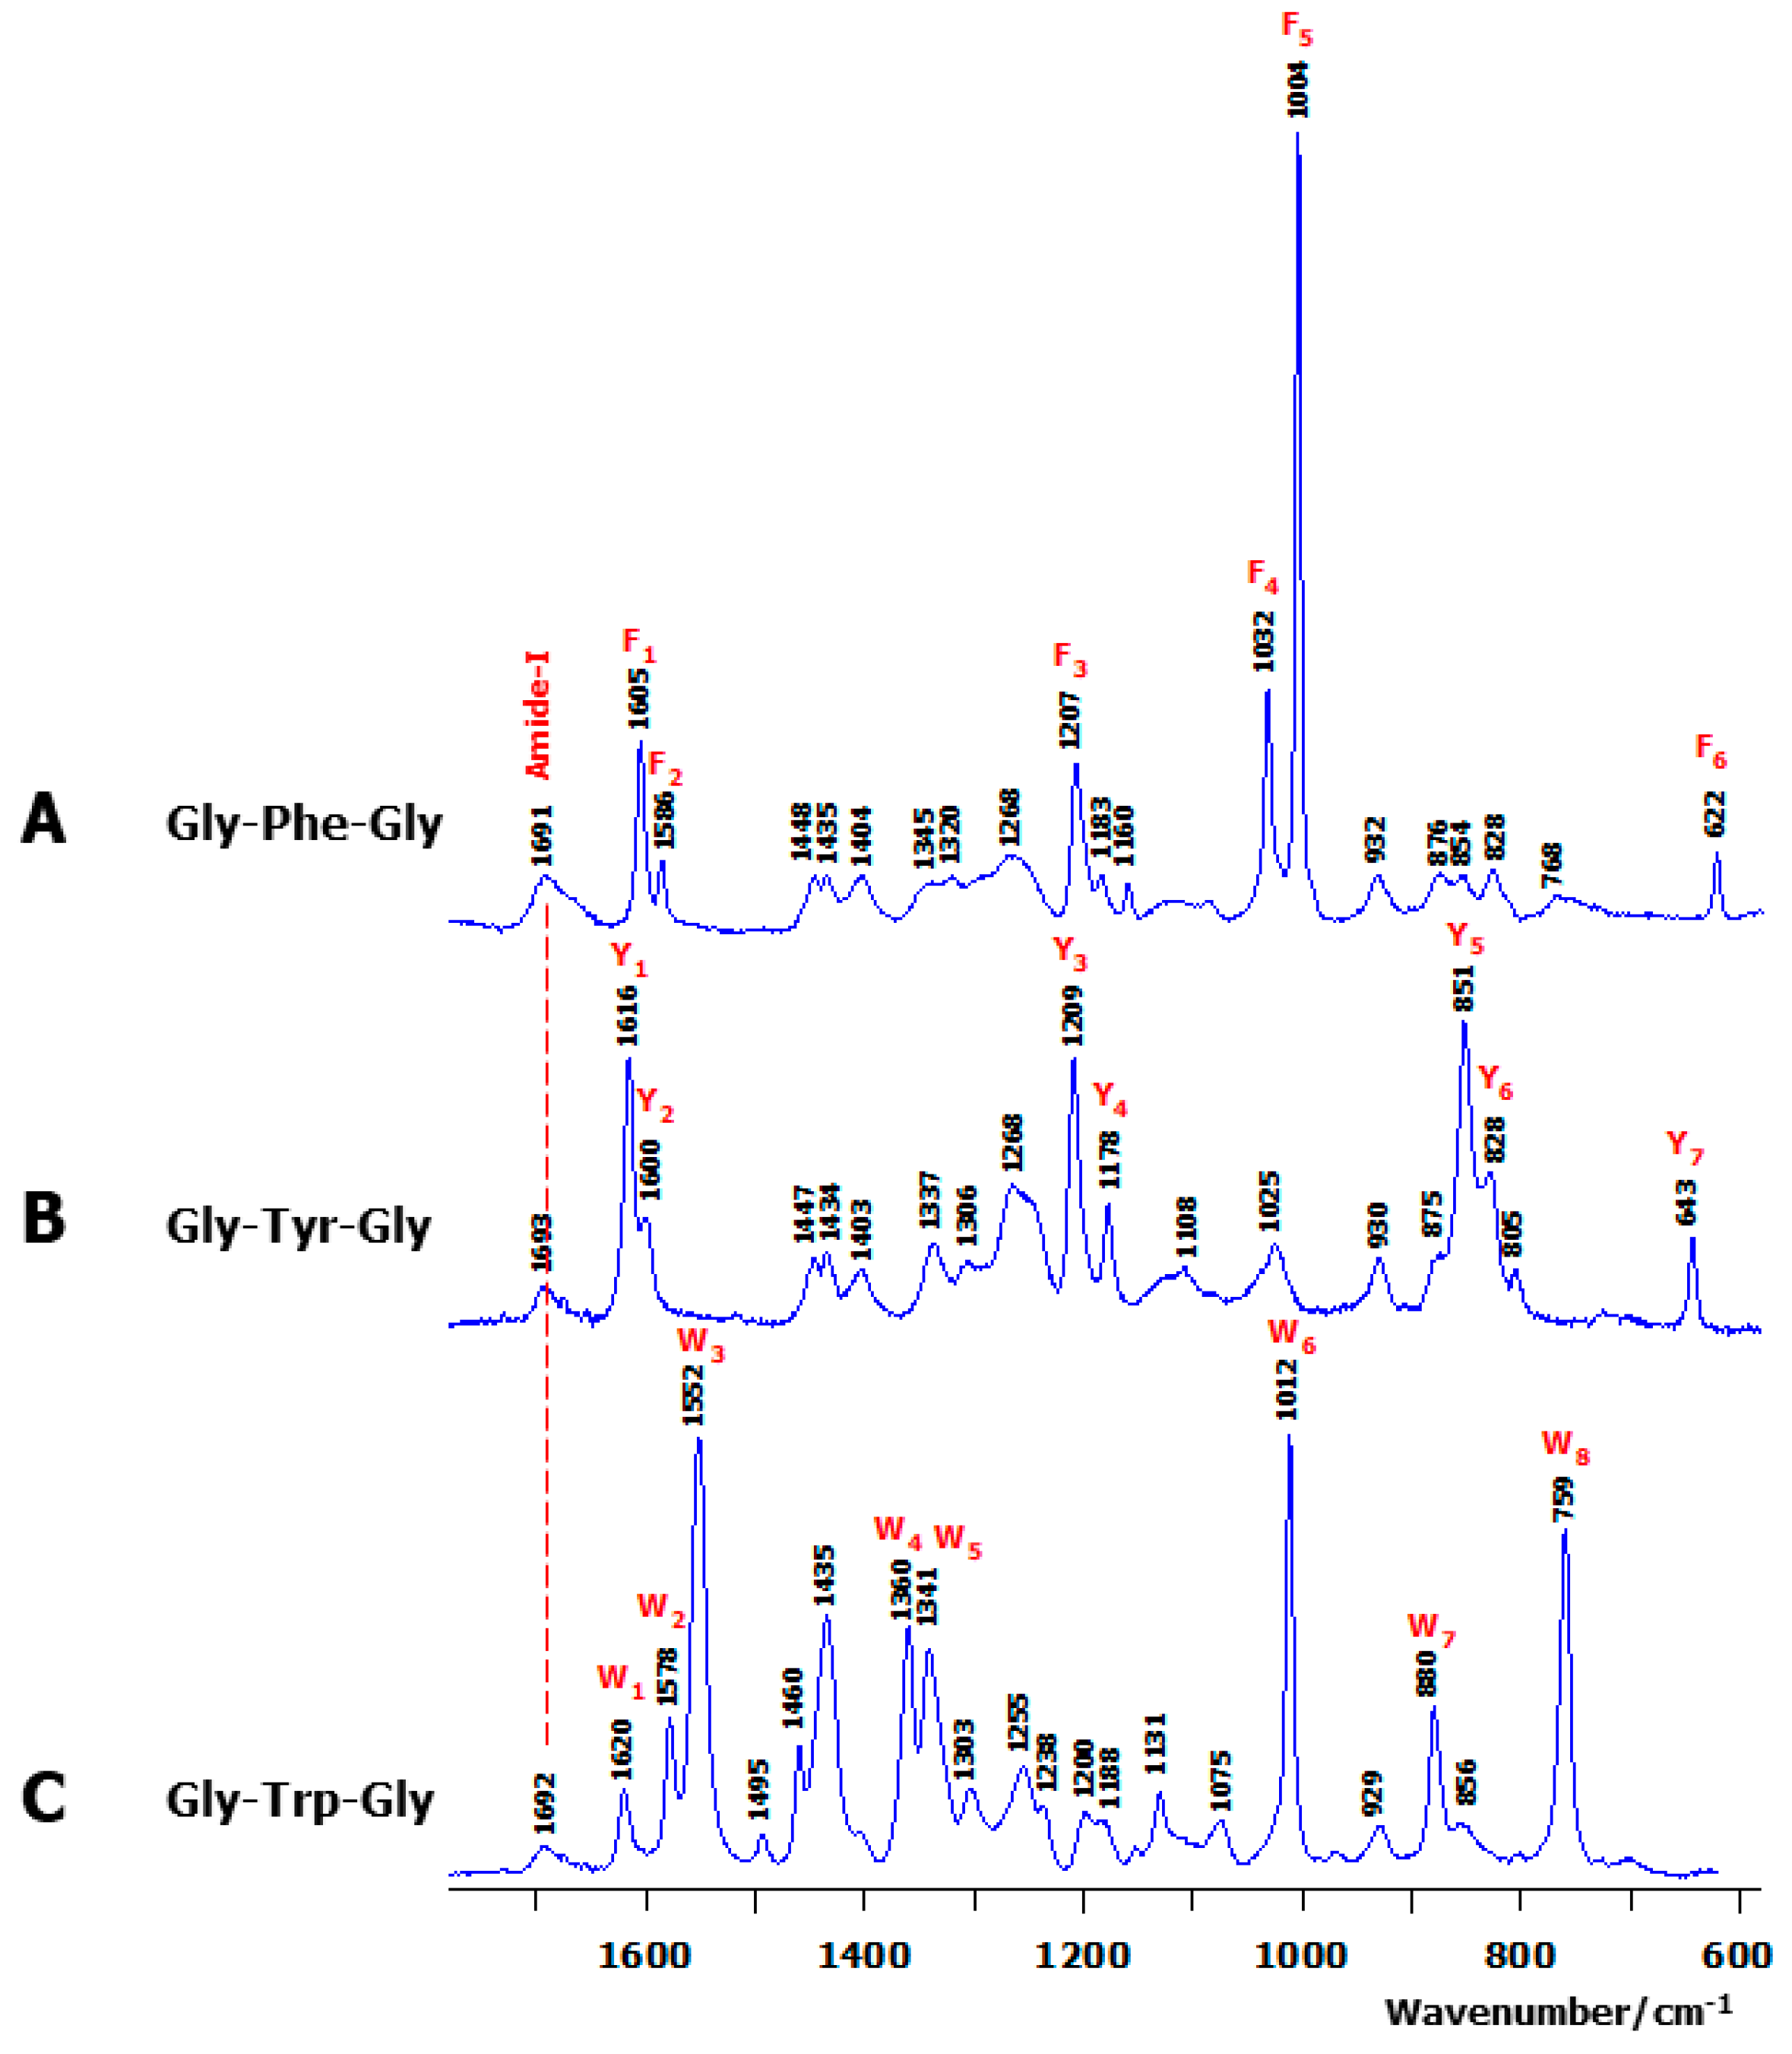
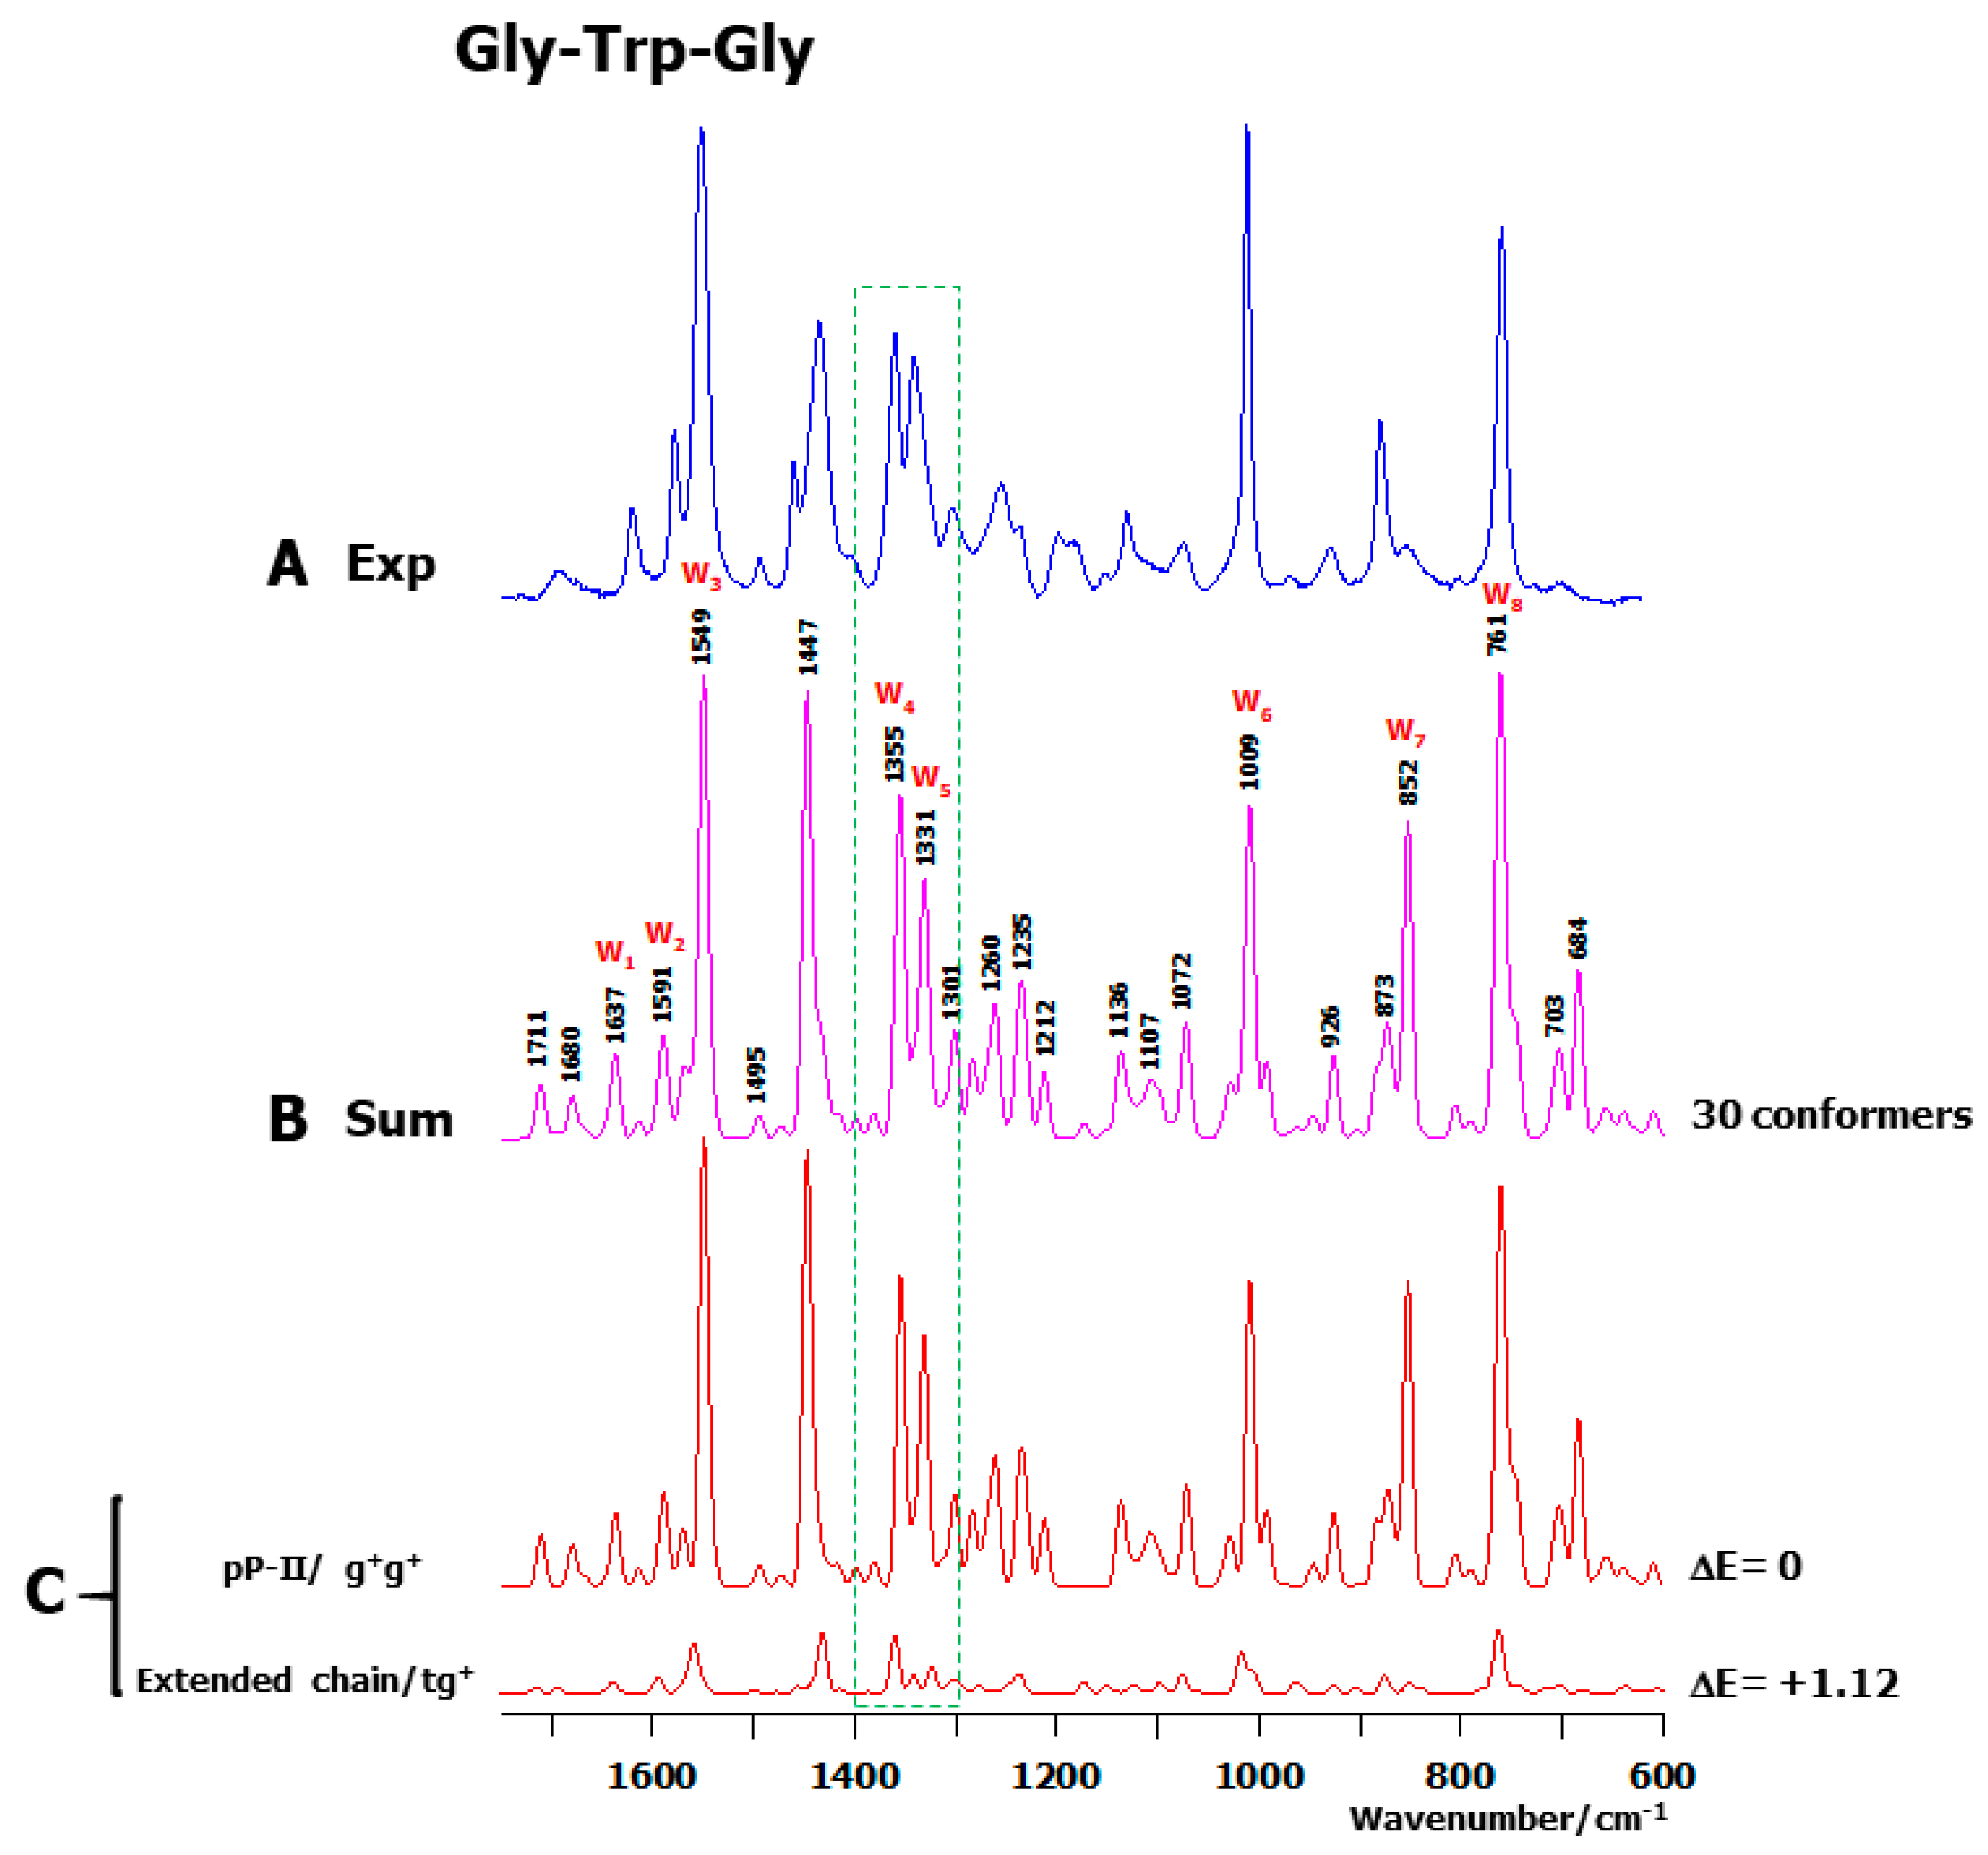
2.1. Observed Solution Raman Spectra
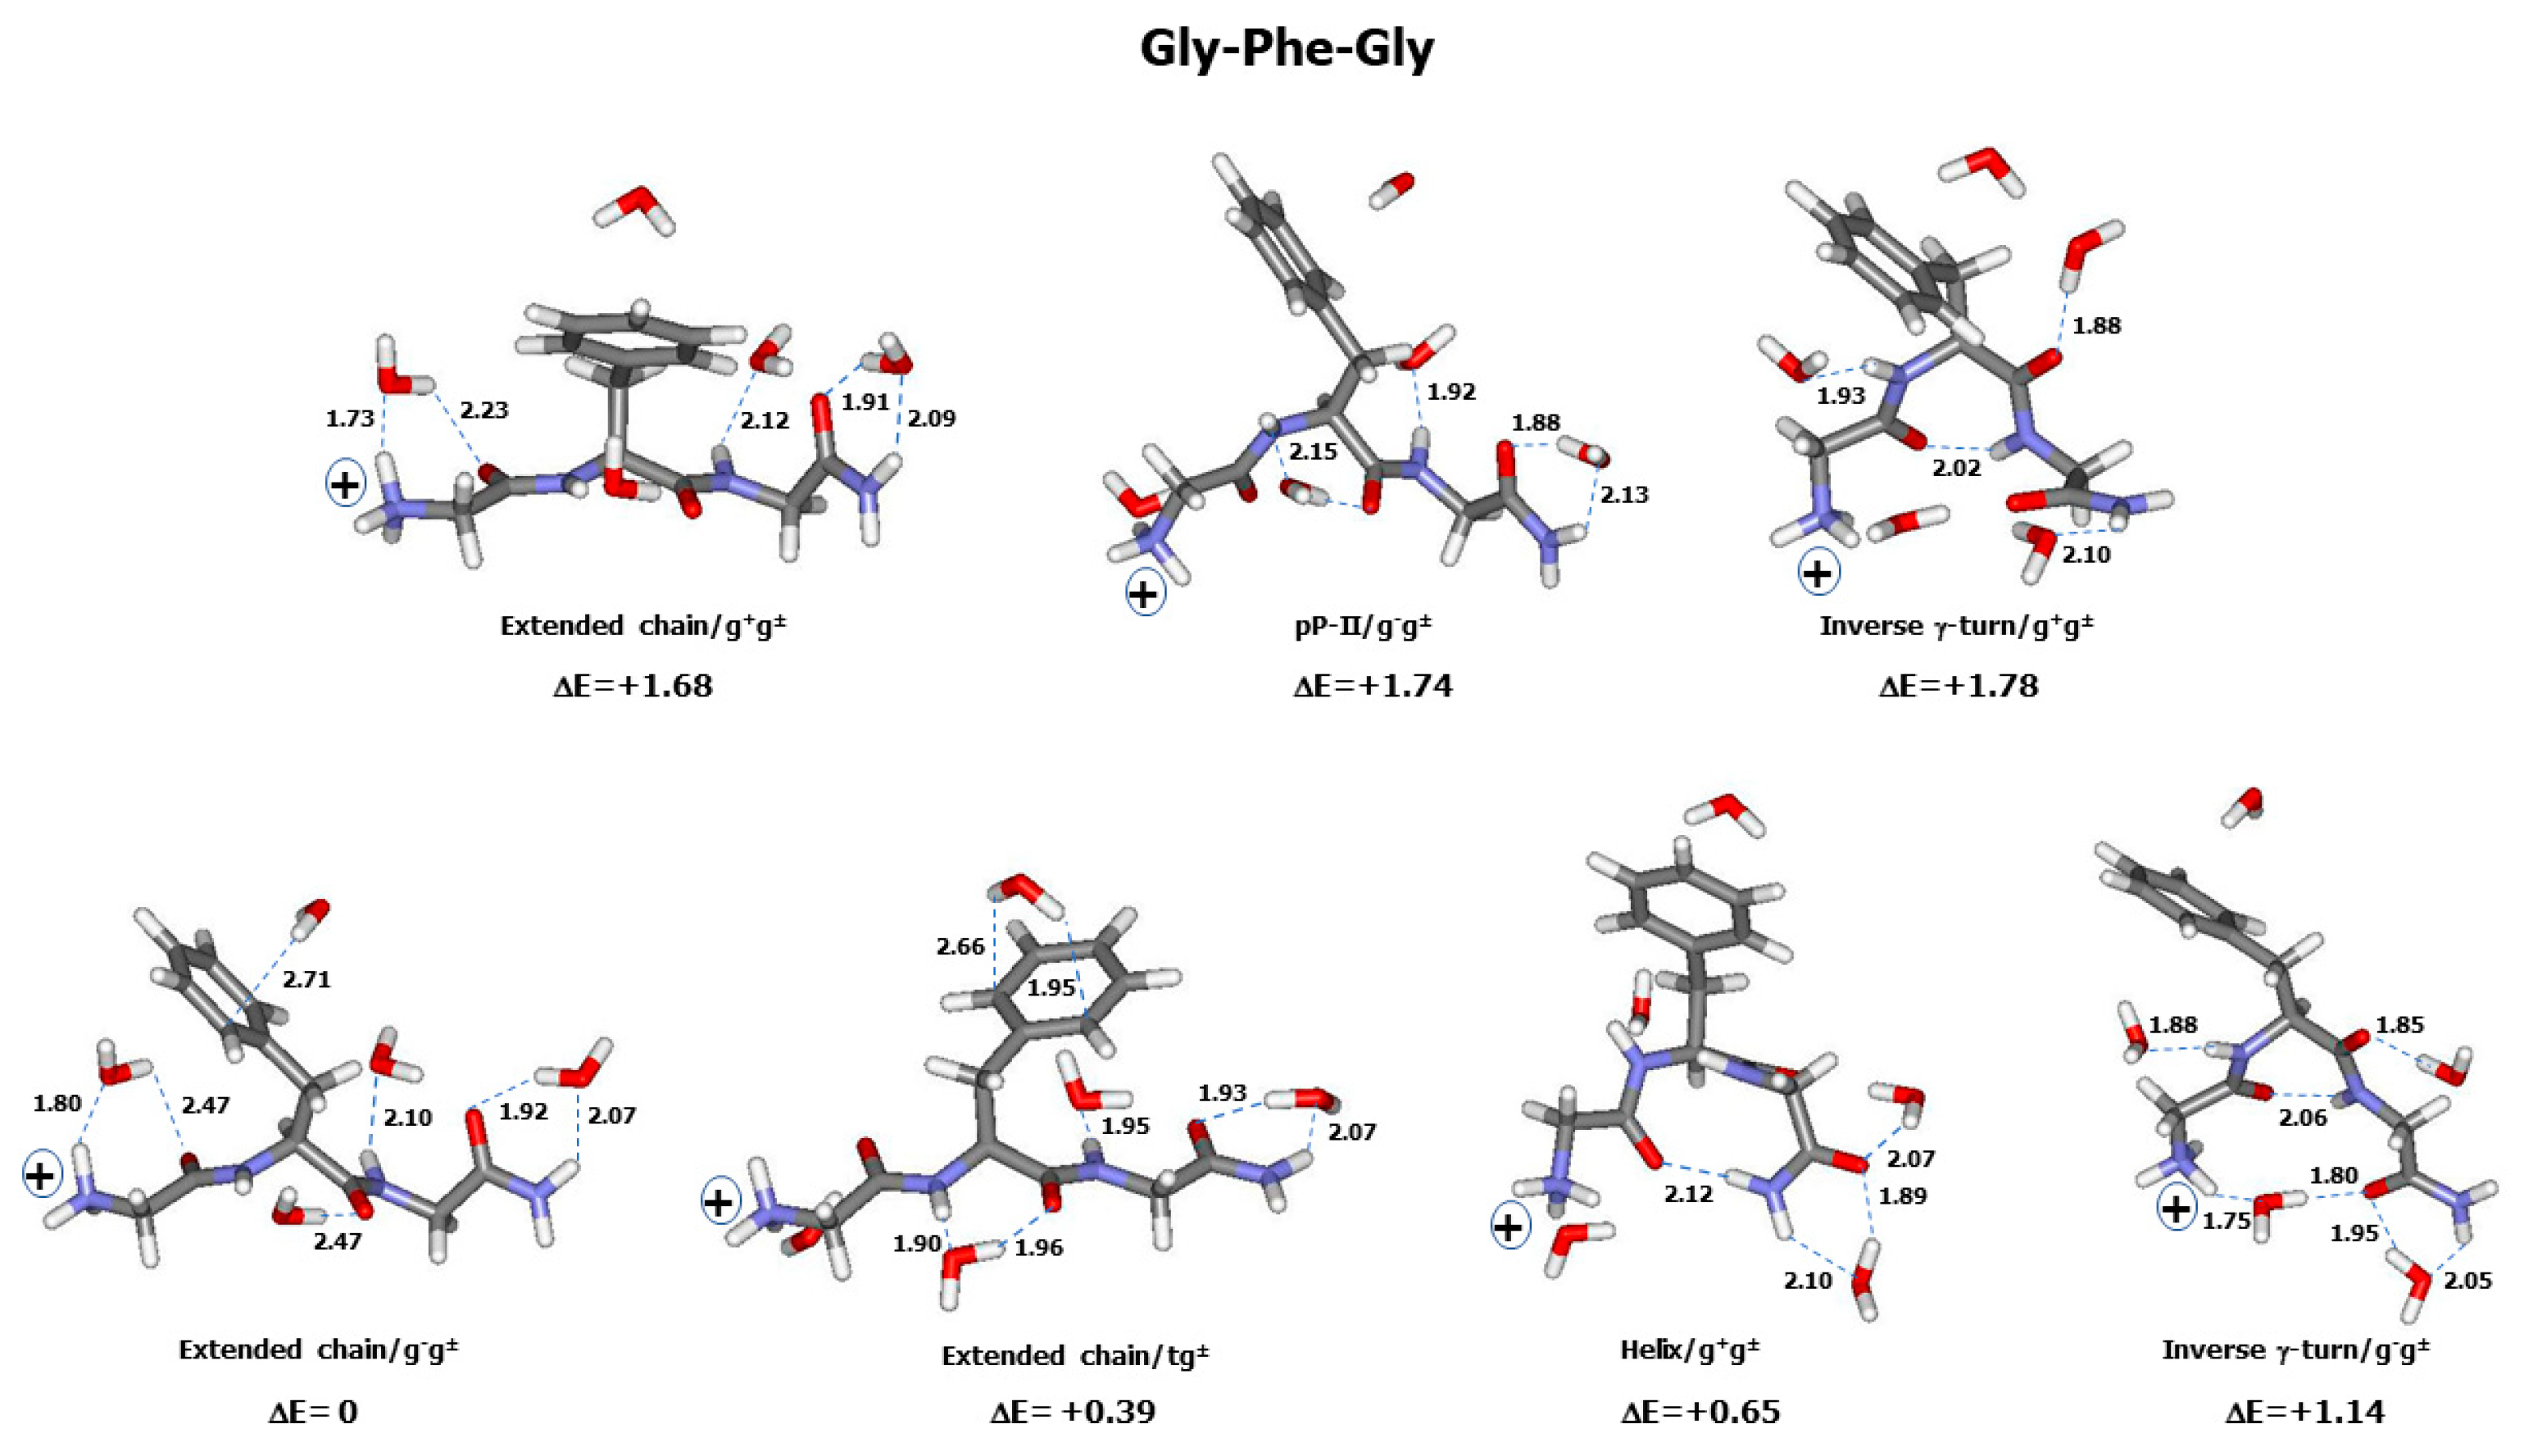
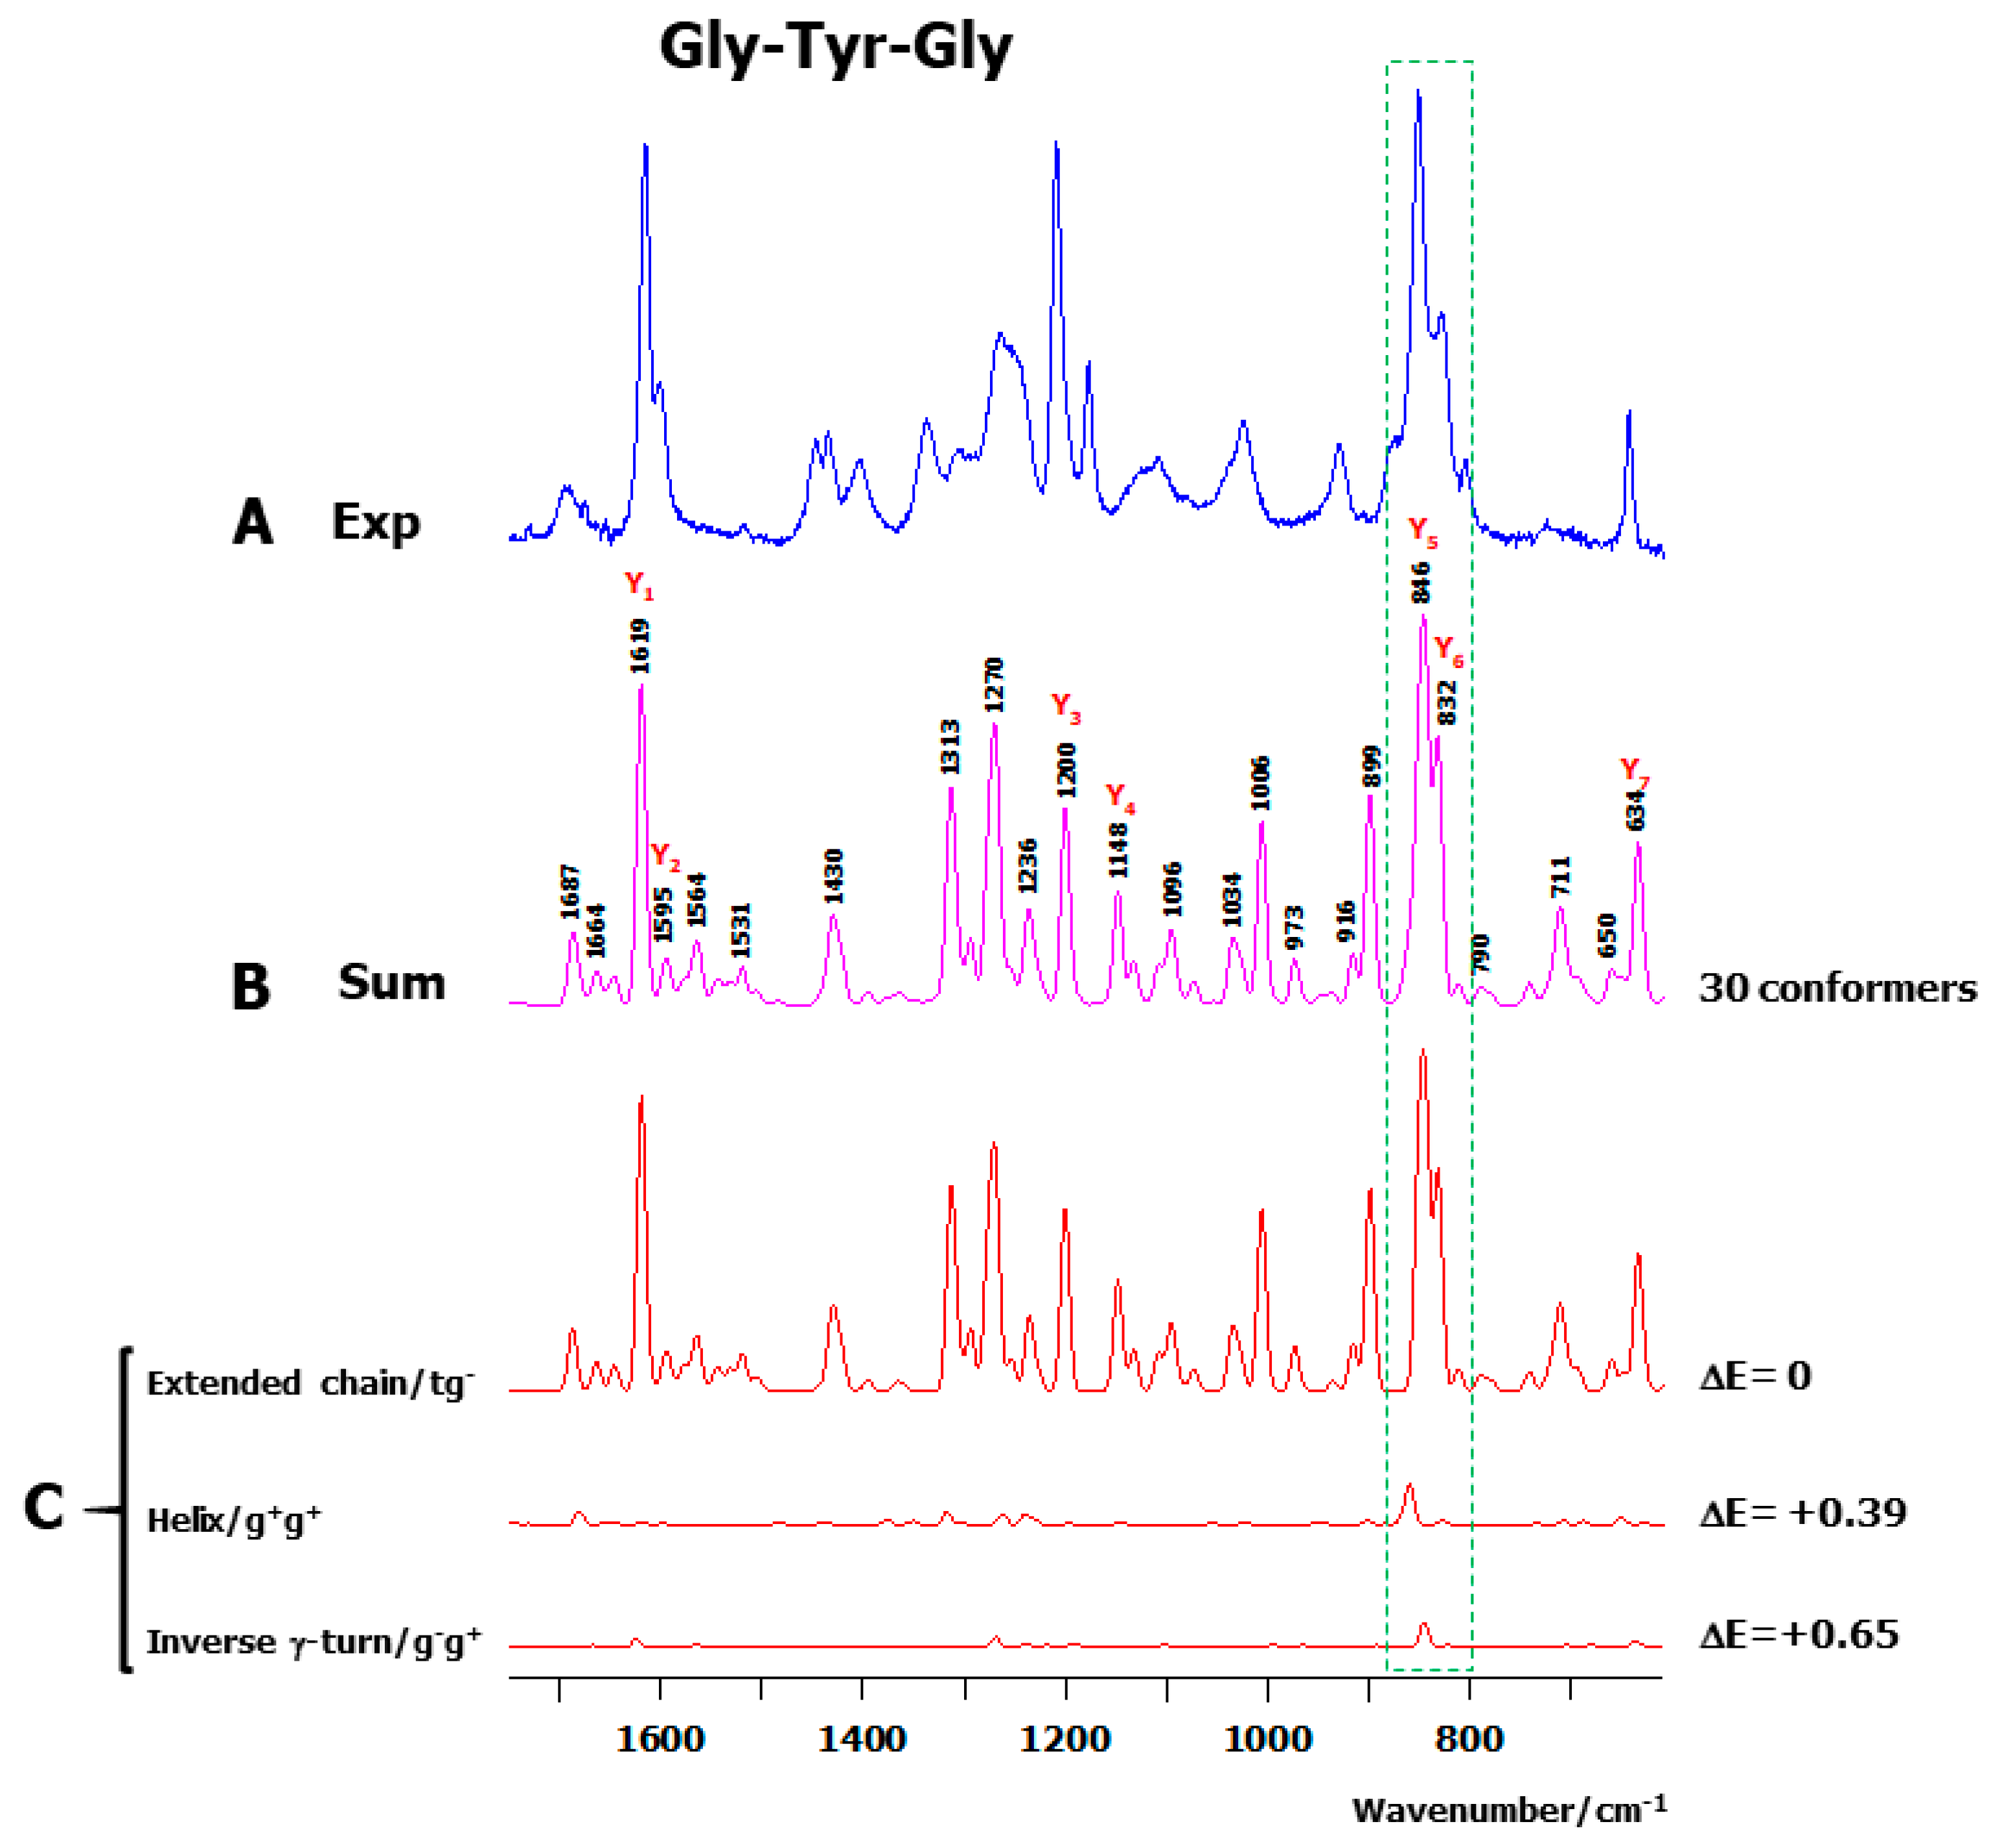
2.2. Theoretical Conformers and Raman Spectra
3. Discussion
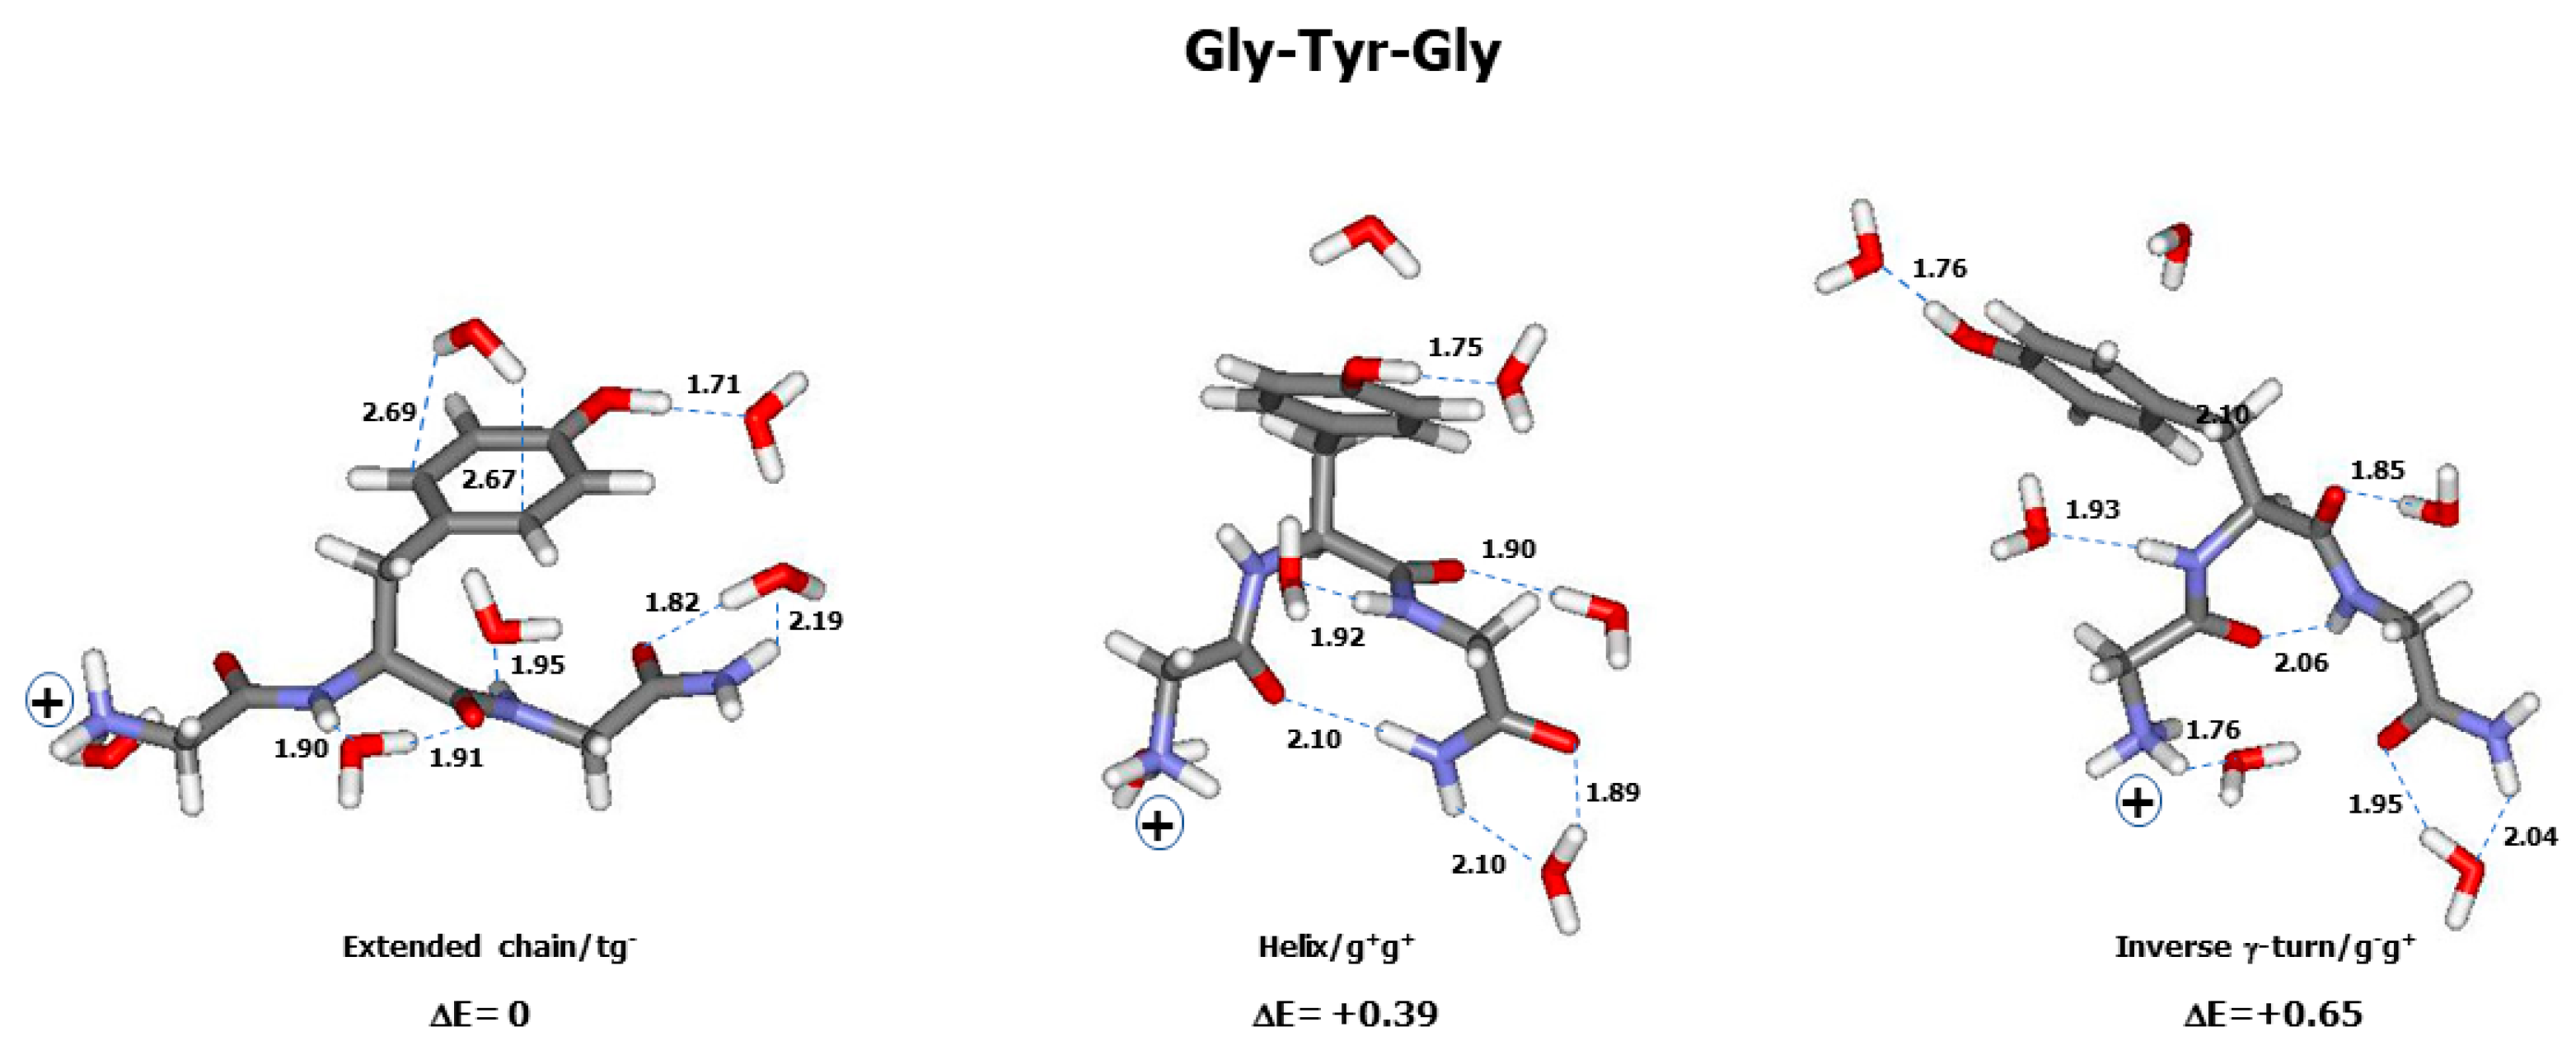
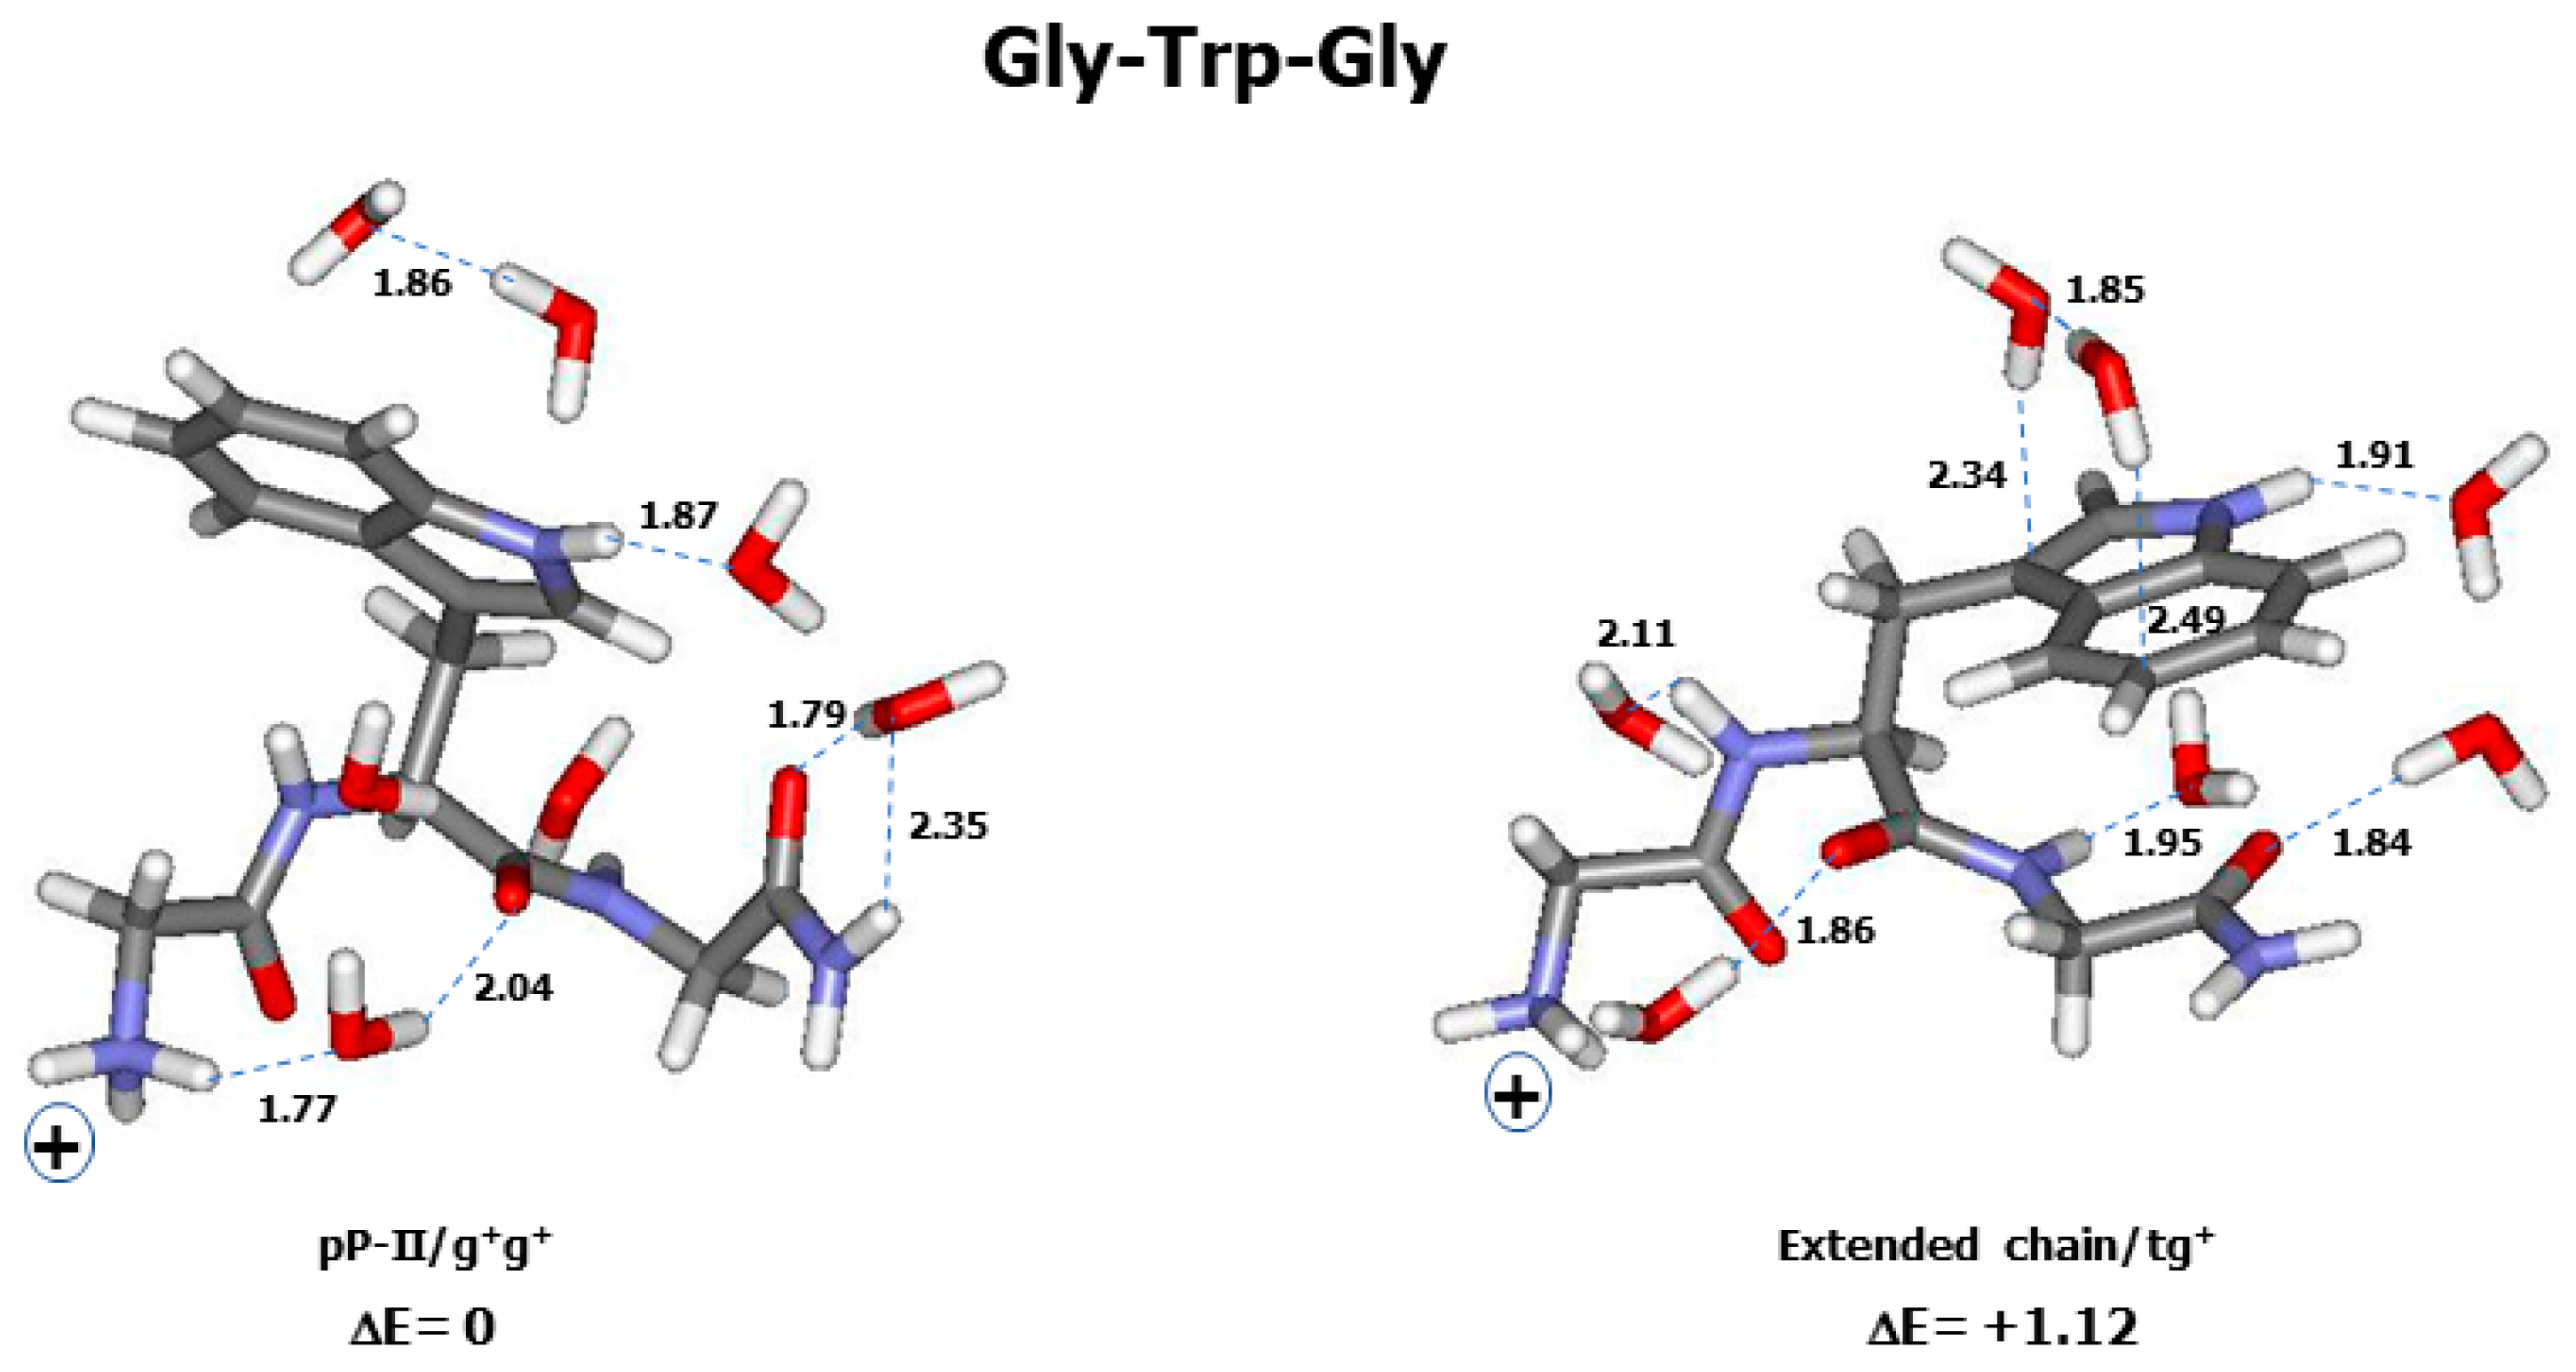
3.1. Conformational and Energetic Landscapes of Tripeptides
3.2. Assignment of Aromatic Raman Markers

| Marker | Exp. | Assignment |
|---|---|---|
| Phe | ||
| F1 | 1605 | ν(Cδ1-Cε1); ν(Cδ2-Cε2) |
| F2 | 1586 | ν(Cε1-Cζ); ν(Cε2-Cζ); ν(Cγ-Cδ2); ν(Cγ-Cδ1) |
| F3 | 1207 | ν(Cβ-Cγ); Cβ-H2 rock.;ν(Cγ-Cδ1); ν(Cγ-Cδ2) |
| F4 | 1032 | ν(Cε2-Cζ); ν(Cε1-Cζ); δ(Cζ-Cε1-H); δ(Cζ-Cε2-H) |
| F5 | 1003 | δ(Cγ-Cδ1-Cε1); δ(Cδ1-Cε1-Cζ); δ(Cζ-Cε2-Cδ2); δ(Cγ-Cδ2-Cε2) |
| F6 | 628 | δ(Cζ-Cε2-Cδ2); δ(Cδ1-Cε1-Cζ); δ(Cγ-Cδ1-Cε1); δ(Cγ-Cδ2-Cε2) |
| Tyr | ||
| Y1 | 1616 | ν(Cδ1-Cε1); ν(Cδ2-Cε2); ν(Cγ-Cδ1); ν(Cε2-Cζ) |
| Y2 | 1600 | ν(Cε1-Cζ); ν(Cγ-Cδ2); ν(Cε2-Cζ); ν(Cγ-Cδ1) |
| Y3 | 1209 | ν(Cβ-Cγ); Cβ-H2 rock.; ν(Cδ1-Cε1); ν(Cδ2-Cε2); ν(Cγ-Cδ2); δ(Cδ1-Cγ-Cδ2) |
| Y4 | 1178 | δ(Cγ-Cδ1-H); δ(Cε1-Cδ1-H); δ(Cζ-Oη-H); δ(Cζ-Cε2-H); Cβ-H2 twist.; δ(Cδ2-Cε2-H); δ(Cδ1-Cε1-H) |
| Y5 | 851 | ν(Cγ-Cδ1); ν(Cβ-Cγ); ν(Cε1-Cζ); ν(Cε2-Cζ); ν(Cγ-Cδ1); ν(Cζ-Oη) |
| Y6 | 828 | ω(Cε2-H); ω(Cδ2-H); ω(Cδ1-H) |
| Y7 | 643 | δ(Cγ-Cδ1-Cε1); δ(Cγ-Cδ2-Cε2); δ(Cδ1-Cε1-Cζ); δ(Cδ2-Cε2-Cζ) |
| Trp | ||
| W1 | 1620 | ν(Cε2-Cζ2); ν(Cε3-Cζ3) |
| W2 | 1578 | ν(Cδ2-Cε3); ν(Cζ2-Cη); ν(Cζ3-Cη); ν(Cδ2-Cε2) |
| W3 | 1552 | ν(Cγ-Cδ1); ν(Cε2-Cζ2); ν(Cβ-Cγ) |
| W4 | 1360 | ν(Cγ-Cδ2); Cβ-H2 twist. |
| W5 | 1340 | ν(Cζ2-Cη); ν(Cζ3-Cη); ν(Cε2-Cζ2); ν(Cδ2-Cε2) |
| W6 | 1012 | ν(Cζ3-Cη); ν(Cε3-Cζ3); ν(Cζ2-Cη) |
| W7 | 880 | δ(Cε2-Nε1-Cδ1); Cβ-H2 wagg. |
| W8 | 759 | ω(Cζ2-H); τ(Cζ2-Cη); ω(Cη-H); ω(Cζ3-H); τCδ2-Cε3); τ(Cε2-Cζ2) |
3.3. Wavenumber Dispersion of Aromatic Raman Markers
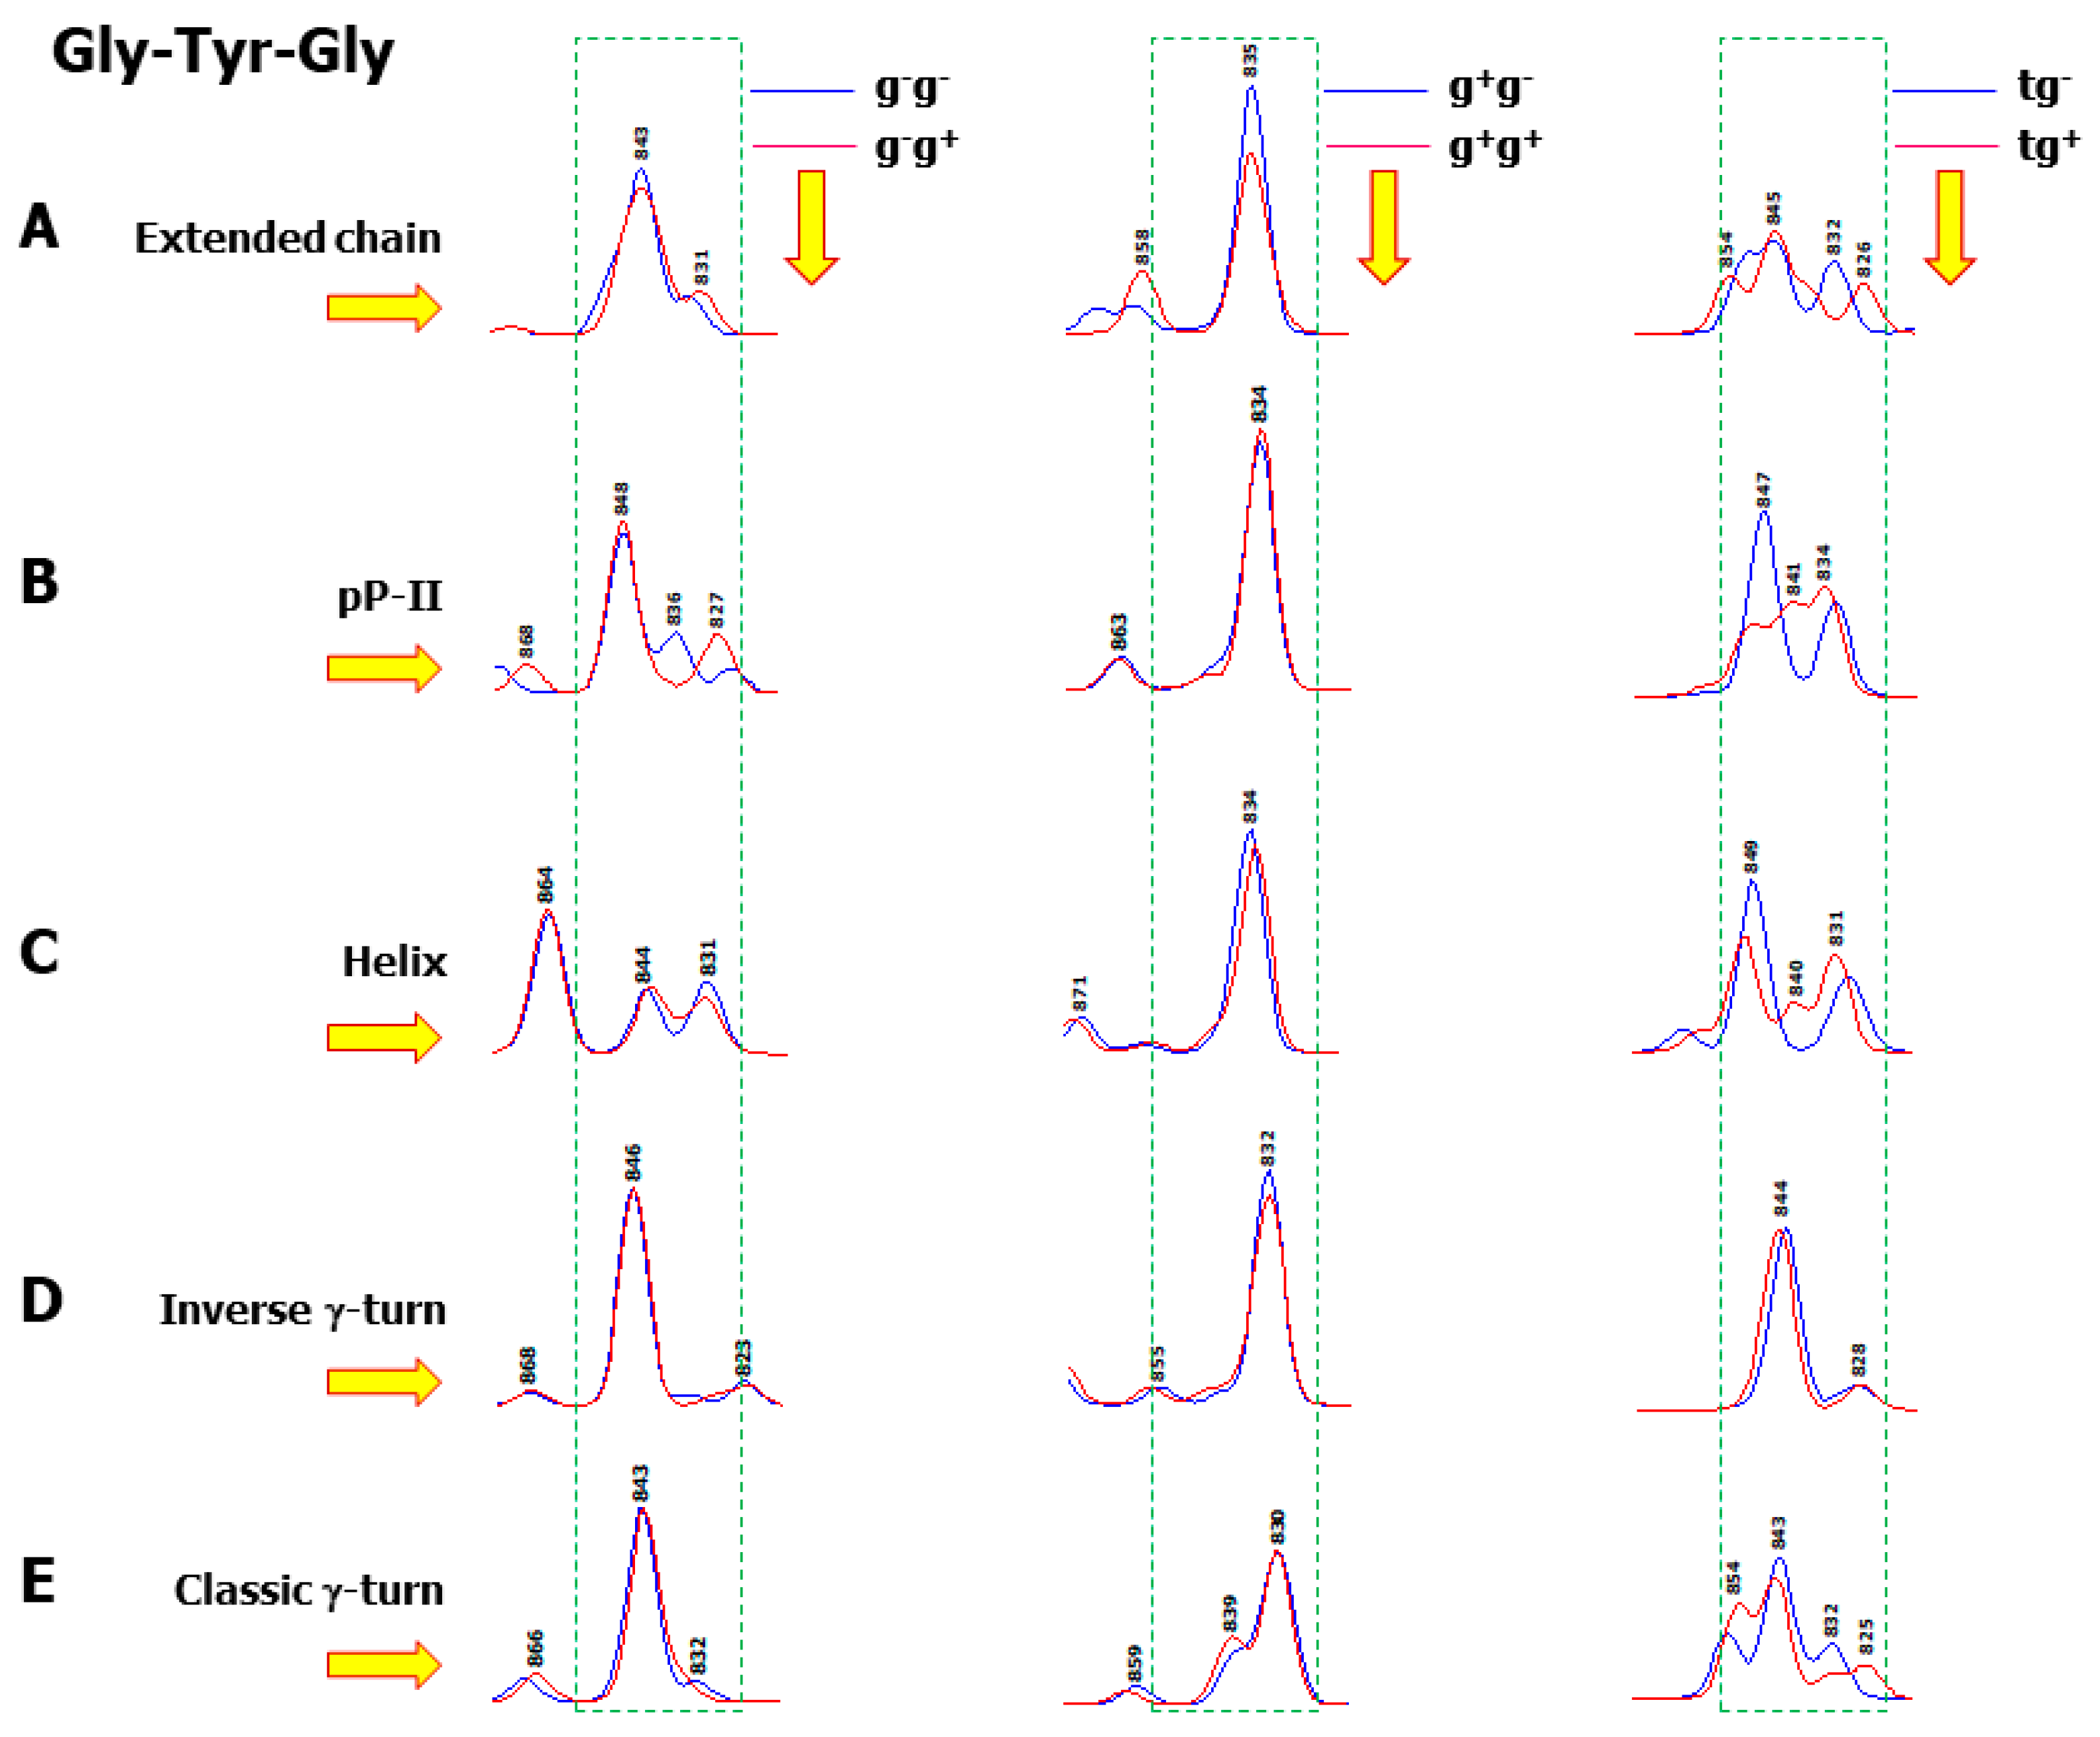
3.4. A New Interpretation for Tyr (Y5–Y6) and Trp (W4–W5) Raman Doublets
4. Methods
4.1. Experimental Details
4.2. Theoretical Details
5. Concluding Remarks
Supplementary Materials
Author Contributions
Funding
Institutional Review Board Statement
Informed Consent Statement
Data Availability Statement
Acknowledgments
Conflicts of Interest
References
- Lord, R.C.; Yu, N.T. Laser-excited Raman spectroscopy of biomolecules: I. Native lysozyme and its constituent amino acids. J. Mol. Biol. 1970, 50, 509–524. [Google Scholar] [CrossRef]
- Siamwiza, M.N.; Lord, R.C.; Chen, M.C.; Takamatsu, T.; Harada, I.; Matsuura, H.; Shimanouchi, T. Interpretation of the doublet at 850 and 830 cm−1 in the Raman spectra of tyrosyl residues in proteins and certain model compounds. Biochemistry 1975, 14, 4870–4876. [Google Scholar] [CrossRef] [PubMed]
- Harada, I.; Miura, T.; Takeuchi, H. Origin of the doublet at 1360 and 1340 cm−1 in the Raman spectra of tryptophan and related compounds. Spectrochim. Acta 1986, 42A, 307–312. [Google Scholar]
- Hildebrandt, P.G.; Copeland, R.A.; Spiro, T.G.; Otlewski, J.; Laskowski, M., Jr.; Prendergast, F.G. Tyrosine hydrogen-bonding and environmental effects in proteins probed by ultraviolet resonance Raman spectroscopy. Biochemistry 1988, 27, 5426–5433. [Google Scholar] [CrossRef] [PubMed]
- Whittaker, M.M.; DeVito, V.L.; Asher, S.A.; Whittaker, J.W. Resonance Raman evidence for tyrosine involvement in the radical site of galactose oxidase. J. Biol. Chem. 1989, 264, 7104–7106. [Google Scholar] [CrossRef]
- Asher, S.A.; Larkin, P.J.; Teraoka, J. Ultraviolet resonance Raman and absorption difference spectroscopy of myoglobins: Titration behavior of individual tyrosine residues. Biochemistry 1991, 30, 5944–5954. [Google Scholar] [CrossRef] [PubMed]
- Overman, S.A.; Aubrey, K.L.; Vispo, N.S.; Cesareni, G.; Thomas, G.J., Jr. Novel tyrosine markers in Raman spectra of wild-type and mutant (Y21M and Y24M) Ff virions indicate unusual environments for coat protein phenoxyls. Biochemistry 1994, 33, 1037–1042. [Google Scholar] [CrossRef]
- Thomas, G.J., Jr. Raman spectroscopy of protein and nucleic acid assemblies. Annu. Rev. Biophys. Biomol. Struct. 1999, 28, 1–27. [Google Scholar] [CrossRef]
- Benevides, J.M.; Overman, S.A.; Thomas, G.J., Jr. Raman spectroscopy of proteins. In Current Protocols in Protein Science; Coligan, J.E., Dunn, B.M., Ploegh, H.L., Speicher, D.W., Wingfield, P.T., Eds.; John Wiley & Sons Inc.: New York, NY, USA, 2003; pp. 17.8.1–17.8.35. [Google Scholar]
- Wei, F.; Zhang, D.; Halas, N.J.; Hartgerink, J.D.J. Aromatic amino acids providing characteristic motifs in the Raman and SERS spectroscopy of peptides. Phys. Chem. B 2008, 112, 9158–9164. [Google Scholar] [CrossRef]
- Takeuchi, H. UV Raman markers for structural analysis of aromatic side chains in proteins. Anal. Sci. 2011, 27, 1077–1086. [Google Scholar] [CrossRef]
- Shao, J.; Kuiper, B.P.; Thunnissen, A.M.W.H.; Cool, R.H.; Zhou, L.; Huang, C.; Dijkstra, B.W.; Broos, J. The role of tryptophan in π interactions in proteins: An experimental approach. J. Am. Chem. Soc. 2022, 144, 13815–13822. [Google Scholar] [CrossRef] [PubMed]
- Jena, S.; Dutta, J.; Tulsiyan, K.D.; Sahu, A.K.; Choudhury, S.S.; Biswal, H.S. Noncovalent interactions in proteins and nucleic acids: Beyond hydrogen bonding and π-stacking. Chem. Soc. Rev. 2022, 51, 4261–4286. [Google Scholar] [CrossRef] [PubMed]
- Otto, C.; Pully, V.V. Hyperspectral Raman Microscopy of the Living Cell. In Applications of Raman Spectroscopy to Biology. From Basis Studies to Disease Diagnosis; Ghomi, M., Ed.; IOP Press: Amsterdam, The Netherlands, 2012; pp. 148–173. [Google Scholar]
- Kann, B.; Offerhaus, H.L.; Windbergs, M.; Otto, C. Raman Microscopy for Cellular Investigations-From Single Cell Imaging to Drug Carrier Uptake Visualization. Adv. Drug Deliv. Rev. 2015, 89, 71–90. [Google Scholar] [CrossRef] [PubMed]
- Hernández, B.; Pflüger, F.; Adenier, A.; Kruglik, S.G.; Ghomi, M. Vibrational analysis of amino acids and short peptides in hydrated media. VIII. Amino Acids with Aromatic Side Chains: L-Phenylalanine, L-Tyrosine, and L-Tryptophan. J. Phys. Chem. B 2010, 114, 15319–15330. [Google Scholar] [CrossRef]
- Hernández, B.; Pflüger, F.; Adenier, A.; Kruglik, S.G.; Ghomi, M. Characteristic Raman lines of phenylalanine analyzed by a multiconformational approach. J. Raman Spectrosc. 2013, 44, 827–833. [Google Scholar] [CrossRef]
- Hernández, B.; Coic, Y.M.; Pfluger, F.; Kruglik, S.G.; Ghomi, M. All Characteristic Raman Markers of Tyrosine and Tyrosinate Originate From Phenol Ring Fundamental Vibrations. J. Raman Specrosc. 2016, 47, 210–220. [Google Scholar] [CrossRef]
- Gerhards, M.; Unterberg, C.; Gerlach, A.; Jansen, A. β-sheet model systems in the gas phase: Structures and vibrations of AcePheNHMe and its dimer (AcePheNHMe)2. Phys. Chem. Chem. Phys. 2004, 6, 2682–2690. [Google Scholar] [CrossRef]
- Chin, W.F.; Piuzzi, F.; Dognon, J.P.; Dimicoli, I.; Mons, M. Gas-phase models of γ-turns: Effect of side-chain/backbone interactions investigated by IR/UV spectroscopy and quantum chemistry. J. Chem. Phys. 2005, 123, 84301. [Google Scholar] [CrossRef]
- Gloaguen, E.; Pagliarulo, F.; Brenner, V.; Chin, W.; Piuzzi, F.; Tardivel, B.; Mons, M. Intramolecular recognition in a jet-cooled short peptide chain: γ-turn helicity probed by a neighbouring residue. Phys. Chem. Chem. Phys. 2007, 9, 4491–4497. [Google Scholar] [CrossRef]
- Hernández, B.; Pfluger, F.; Kruglik, S.G.; Ghomi, M. Protonation-deprotonation of the glycine backbone as followed by Raman scattering and multiconformational analysis. Chem. Phys. 2013, 425, 104–113. [Google Scholar] [CrossRef]
- Hernández, B.; Sanchez-Cortes, S.; Ghomi, M. Energetic, conformational and vibrational features of the tripeptide (Gly)3. Data from MP2 and DFT calculations. Comput. Theor. Chem. 2023, 1220, 113989. [Google Scholar] [CrossRef]
- Schweitzer-Stenner, R.; Eker, F.; Huang, Q.; Griebenow, K. Dihedral angles of trialanine in D2O determined by combining FTIR and polarized visible Raman spectroscopy. J. Am. Chem. Soc. 2001, 123, 9628–9633. [Google Scholar] [CrossRef] [PubMed]
- Schweitzer-Stenner, R. Dihedral angles of tripeptides in solution directly determined by polarized Raman and FTIR spectroscopy. Biophys. J. 2002, 83, 523–532. [Google Scholar] [CrossRef]
- Eker, F.; Griebenow, K.; Schweitzer-Stenner, R. Stable conformations of tripeptides in aqueous solution studied by UV circular dichroism spectroscopy. J. Am. Chem. Soc. 2003, 125, 8178–8185. [Google Scholar] [CrossRef]
- Eker, F.; Griebenow, K.; Cao, X.; Nafie, L.A.; Schweitzer-Stenner, R. Tripeptides with ionizable side chains adopt a perturbed polyproline II structure in water. Biochemistry 2004, 43, 613–621. [Google Scholar] [CrossRef] [PubMed]
- Hagarman, A.; Measey, T.J.; Mathieu, D.; Schwalbe, H.; Schweitzer-Stenner, R. Intrinsic Propensities of amino acid residues in GxG peptides inferred from amide I’ band profiles and NMR scalar coupling constants. J. Am. Chem. Soc. 2010, 132, 540–551. [Google Scholar] [CrossRef]
- Pizzanelli, S.; Forte, C.; Monti, S.; Zandomeneghi, G.; Hagarman, A.; Measey, T.J.; Schweitzer-Stenner, R. Conformations of phenylalanine in the tripeptides AFA and GFG probed by combining MD simulations with NMR, FTIR, polarized Raman, and VCD spectroscopy. J. Phys. Chem. B 2010, 114, 3965–3978. [Google Scholar] [CrossRef]
- Schweitzer-Stenner, R.; Hagarman, A.; Toal, S.; Mathieu, D.; Schwalbe, H. Disorder and order in unfolded and disordered peptides and proteins: A view derived from tripeptide conformational analysis. I. Tripeptides with long and predominantly hydrophobic side chains. Proteins 2013, 81, 955–967. [Google Scholar] [CrossRef]
- Kohn, W.; Sham, L.J. Self-consistent equations including exchange and correlation effects. Phys. Rev. 1965, 140, A1133–A1138. [Google Scholar] [CrossRef]
- Mardirossian, N.; Head-Gordon, M. Thirty years of density functional theory in computational chemistry: An overview and extensive assessment of 200 density functionals. Mol. Phys. 2017, 115, 2315–2372. [Google Scholar] [CrossRef]
- Lee, C.; Yang, W.; Parr, R.G. Development of the Colle-Salvetti correlation-energy formula into a functional of the electron density. Phys. Rev. B: Condens. Matter Mater. Phys. 1988, 37, 785–789. [Google Scholar] [CrossRef]
- Becke, A.D. Density-functional thermochemistry. III. The role of exact exchange. J. Chem. Phys. 1993, 98, 5648–5652. [Google Scholar] [CrossRef]
- Hernández, B.; Pflüger, F.; Kruglik, S.G.; Ghomi, M. Multiconformational analysis of tripeptides upon consideration of implicit and explicit hydration effects. J. Mol. Graph. Modell. 2021, 102, 107790. [Google Scholar] [CrossRef]
- Benighaus, T.; DiStasio, R.A., Jr.; Lochan, R.C.; Chai, J.D.; Head-Gordon, M. Semiempirical Double-Hybrid Density Functional with Improved Description of Long-Range Correlation. J. Phys. Chem. A 2008, 112, 2702–2712. [Google Scholar] [CrossRef] [PubMed]
- Chai, J.D.; Head-Gordon, M. Systematic optimization of long-range corrected hybrid density functionals. J. Chem. Phys. 2008, 128, 84106. [Google Scholar] [CrossRef] [PubMed]
- Chai, J.D.; Head-Gordon, M. Long-range corrected hybrid density functionals with damped atom-atom dispersion corrections. Phys. Chem. Chem. Phys. 2008, 10, 6615–6620. [Google Scholar] [CrossRef]
- Zhao, Y.; Truhlar, D.G. The M06 suite of density functional for main group thermochemistry, thermochemical kinetics, noncovalent interactions, excited states, and transition elements: Two new functionals and systematic testing of four M06-class functionals and 12 other functionals. Theor. Chem. Acc. 2008, 120, 215–241. [Google Scholar]
- Møller, C.; Plesset, M.S. Note on an Approximation Treatment for Many-Electron Systems. Phys. Rev. 1934, 46, 618–622. [Google Scholar] [CrossRef]
- Hernández, B.; Coïc, Y.M.; Kruglik, S.G.; Sanchez-Cortes, S.; Ghomi, M. The relationship between the tyrosine residue 850–830 cm−1 Raman doublet intensity ratio and the aromatic side chain χ1 torsion angle. Spectrochim. Acta A 2024, 308, 123681. [Google Scholar] [CrossRef]
- Hernández, B.; Coïc, Y.M.; Kruglik, S.G.; Sanchez-Cortes, S.; Ghomi, M. Relationships between conformational and vibrational features of tryptophan characteristic Raman markers. Spectrochimica Acta A 2024, 316, 124377. [Google Scholar] [CrossRef]
- Hernández, B.; Coïc, Y.M.; Kruglik, S.G.; Sanchez-Cortes, S.; Ghomi, M. Conformation dependence of phenylalanine characteristic Raman markers. J. Raman Spectrosc 2025, 56, 262–277. [Google Scholar] [CrossRef]
- Barone, V.; Cossi, M. Quantum calculation of molecular energies and energy gradients in solution by a conductor solvent model. J. Phys. Chem. A 1988, 102, 1995–2001. [Google Scholar] [CrossRef]
- Cossi, M.; Rega, N.; Scalmani, G.; Barone, V. Energies, structures, and electronic properties of molecules in solution with the C-PCM solvation model. J. Comput. Chem. 2003, 24, 669–681. [Google Scholar] [CrossRef]
- Lanza, G.; Chiacchio, M.A. Interfacial water at the trialanine hydrophilic surface: A DFT electronic structure and bottom-up investigation. Phys. Chem. Chem. Phys. 2015, 17, 17101–17111. [Google Scholar] [CrossRef]
- Ilawe, N.V.; Raeber, A.E.; Schweitzer-Stenner, R.; Toal, S.E.; Wong, B.M. Assessing backbone solvation effects in the conformational propensities of amino acid residues in unfolded peptides. Phys. Chem. Chem. Phys. 2015, 17, 24917–24924. [Google Scholar] [CrossRef]
- Chan, W.C.; White, P.D. Fmoc Solid Phase Peptide Synthesis. A Practical Approach; Oxford University Press: Oxford, UK, 2000. [Google Scholar]
- Schulz, G.E.; Schirmer, R.H. Principles of Protein Structure; Springer: Berlin/Heidelberg, Germany, 1979. [Google Scholar]
- Kishore, R.; Balaram, P. Stabilization of γ-turn conformations in peptides by disulfide bridging. Biopolymers 1985, 24, 2041–2043. [Google Scholar] [CrossRef] [PubMed]
- Milner-White, E.J.; Ross, B.M.; Ismail, R.; Belhadj-Mostefa, K.; Poet, R. One type of gamma-turn, rather than the other gives rise to chain-reversal in proteins. J. Mol. Biol. 1988, 204, 777–782. [Google Scholar] [CrossRef]
- Suzuki, S.; Green, P.G.; Bumgarner, R.E.; Dasgupta, S.; Goddard, W.A., III; Blake, G.A. Benzene forms hydrogen bonds with water. Science 1992, 257, 942–945. [Google Scholar] [CrossRef]
- Hernández, B.; Pflüger, F.; Dauchez, M.; Ghomi, M. Privileged hydration sites in aromatic side chains: Effect on conformational equilibrium. Phys. Chem. Chem. Phys. 2017, 19, 28684–28695. [Google Scholar] [CrossRef]
- Hernández, B.; Pflüger, F.; Ghomi, M. Aspartate: An interesting model for analyzing dipole-ion and ion pair interactions through its oppositely charged amine and acid groups. J. Comput. Chem. 2020, 41, 1402–1410. [Google Scholar] [CrossRef]
- Frisch, M.J.; Trucks, G.W.; Schlegel, H.B.; Scuseria, G.E.; Robb, M.A.; Cheeseman, J.R.; Scalmani, G.; Barone, V.; Petersson, G.A.; Nakatsuji, H.; et al. Gaussian 16; Revision C.01; Gaussian, Inc.: Wallingford, CT, USA, 2019. [Google Scholar]
- Frisch, M.J.; Pople, J.A.; Binkley, J.S. Self-Consistent Molecular Orbital Methods. 25. Supplementary Functions for Gaussian Basis Sets. J. Chem. Phys. 1984, 80, 3265–3269. [Google Scholar] [CrossRef]
- Califano, S. Vibrational States; John Wiley & Sons Ltd.: New York, NY, USA, 1976. [Google Scholar]
- Keresztury, G. Raman spectroscopy: Theory. In Handbook of Vibrational Spectroscopy; Chalmers, J.M., Griffiths, P.R., Eds.; Wiley & Sons: New York, NY, USA, 2002; Volume 1, pp. 71–87. [Google Scholar]


| Marker Phe a | av ± sd | Marker Tyr b | av ± sd | Marker Trp c | av ± sd |
|---|---|---|---|---|---|
| F1 | 1643 ± 2 | Y1 | 1621 ± 4 | W1 | 1639 ± 2 |
| F2 | 1623 ± 2 | Y2 | 1598 ± 7 | W2 | 1594 ± 3 |
| F3 | 1219 ± 5 | Y3 | 1198 ± 8 | W3 | 1560 ± 5 |
| F4 | 1046 ± 3 | Y4 | 1164 ± 17 | W4 | 1359 ± 4 |
| F5 | 1003 ± 1 | Y5 | 848 ± 8 | W5 | 1335 ± 6 |
| F6 | 626 ± 4 | Y6 | 830 ± 10 | W6 | 1013 ± 3 |
| Y7 | 639 ± 8 | W7 | 868 ± 9 | ||
| W8 | 760 ± 4 |
Disclaimer/Publisher’s Note: The statements, opinions and data contained in all publications are solely those of the individual author(s) and contributor(s) and not of MDPI and/or the editor(s). MDPI and/or the editor(s) disclaim responsibility for any injury to people or property resulting from any ideas, methods, instructions or products referred to in the content. |
© 2025 by the authors. Licensee MDPI, Basel, Switzerland. This article is an open access article distributed under the terms and conditions of the Creative Commons Attribution (CC BY) license (https://creativecommons.org/licenses/by/4.0/).
Share and Cite
Hernández, B.; Coïc, Y.-M.; Kruglik, S.G.; Sanchez-Cortes, S.; Ghomi, M. Influence of Side Chain–Backbone Interactions and Explicit Hydration on Characteristic Aromatic Raman Fingerprints as Analysed in Tripeptides Gly-Xxx-Gly (Xxx = Phe, Tyr, Trp). Int. J. Mol. Sci. 2025, 26, 3911. https://doi.org/10.3390/ijms26083911
Hernández B, Coïc Y-M, Kruglik SG, Sanchez-Cortes S, Ghomi M. Influence of Side Chain–Backbone Interactions and Explicit Hydration on Characteristic Aromatic Raman Fingerprints as Analysed in Tripeptides Gly-Xxx-Gly (Xxx = Phe, Tyr, Trp). International Journal of Molecular Sciences. 2025; 26(8):3911. https://doi.org/10.3390/ijms26083911
Chicago/Turabian StyleHernández, Belén, Yves-Marie Coïc, Sergei G. Kruglik, Santiago Sanchez-Cortes, and Mahmoud Ghomi. 2025. "Influence of Side Chain–Backbone Interactions and Explicit Hydration on Characteristic Aromatic Raman Fingerprints as Analysed in Tripeptides Gly-Xxx-Gly (Xxx = Phe, Tyr, Trp)" International Journal of Molecular Sciences 26, no. 8: 3911. https://doi.org/10.3390/ijms26083911
APA StyleHernández, B., Coïc, Y.-M., Kruglik, S. G., Sanchez-Cortes, S., & Ghomi, M. (2025). Influence of Side Chain–Backbone Interactions and Explicit Hydration on Characteristic Aromatic Raman Fingerprints as Analysed in Tripeptides Gly-Xxx-Gly (Xxx = Phe, Tyr, Trp). International Journal of Molecular Sciences, 26(8), 3911. https://doi.org/10.3390/ijms26083911