Abstract
Determination of the relationships between environmental factors and diatom assemblages is usually made for several hundred lakes spread over a large area. However, the analysis of several lakes located near Lake Wigry also gives interesting results. Lakes in Wigry National Park (Poland) with broad similarity of geological origin show clear limnological, physical, and chemical differences. Here, we report on an investigation into how these dissimilarities influence diatom assemblages. Hierarchical Cluster Analysis showed that the studied lakes can be divided into three groups: (1) disharmonic, (2) harmonious with greater human impact on the environment, and (3) harmonious with a more limited human impact. The harmonious lakes could be divided into two groups that are mainly in line with the contents of the chloride and sulfates ions taken as indicative of human impacts on the environment. Overall, the three groups had different dominance structures, as reference to the Dominance Index (DI) made clear (mean values being: (1) −70.54%, (2) −72%, and (3) −54.58%, Generalized Linear Models with the categorical independent variable (group) showed significant differences between groups (for 1–3, 2–3) p value < 0.05). Lakes impacted by anthropopressure and disharmonic ones had the strongest dominance structure. More broadly, DI differences between the groups are consistent with the Species Pool Hypothesis (SPH), while studied differences can be said to result from natural geological dissimilarities, as well as disparate anthropogenic impacts.
Keywords:
lakes; disharmonic lakes; diatoms; dominance index; peat bogs; Wigry National Park; Poland 1. Introduction
Recently observed environmental changes of anthropogenic origin are associated with the steady establishment of new relationships between the environment and ecological communities. In this regard, the past state forms the basis for current trends, just as these lead to anticipated future responses. While the unprecedented threat to global biodiversity posed by human activity is clear, we have not achieved a full understanding of how this changes in response to pressure. Nevertheless, in its recent reports, the Intergovernmental Science-Policy Platform on Biodiversity and Ecosystem Services (IPBES) announced an unprecedentedly dangerous decline in biodiversity, with limits of tolerance clearly being surpassed at present [1].
Lakes are hotspots of biodiversity [2,3] as well as systems particularly sensitive to environmental change. Furthermore, as their shore-zone areas offer so many ecosystem services, lakes can be seen as among the world’s most threatened environments [4] particularly in need of change monitoring. Lakes are threatened by direct (e.g., nutrient enrichment, forestry practices, and agriculture pressure) and indirect (e.g., climate change) effects [3]. Over the last several decades, interdisciplinary studies have shown the increasing impact of climate change on lakes’ water chemistry, resulting in an uncommon dangerous decline in biodiversity [1,3]. Diatoms are among the indicators also used in assessing natural and human-related features of aquatic environments [5,6]. The diversity and distribution of diatoms (Bacillariophyta) is mainly driven by environmental conditions, and their assemblages are particularly useful bioindicators and are frequently analyzed from sediment cores to infer past conditions [7]. Their value in water quality/environmental health assessment was appreciated so relatively long ago [8]. That usefulness can be seen to lie in the rapid and precise nature of a diatom assemblage’s response to changing conditions [7], with particular importance noted where tested environments are of low pH [9,10].
The first aim of the work detailed here was to compare variables relating to physical and chemical characteristics of the different waters, and to set the results against previous data for the same area [11,12]. A comparison of this kind would encapsulate long-term changes in physical and chemical properties of waters in the lakes, and—as these conditions affect the diversity of lacustrine organisms—there was value in comparing dominant diatom taxa (in terms of both numbers of species and uniformity of abundance). Thus, the second goal of the study entailed an examination of the lakes’ impacts on their diatom assemblages, with results in this regard again being set against previous findings for lakes within Wigry National Park [12,13,14,15].
Here, it is the changes in water parameters, and responses in terms of diatom dominance structure, that gain presentation, which are in line with a juxtaposition of the diatom assemblages and the physical and chemical variables characterizing ten lakes located in Wigry National Park. This area makes it possible to analyze the large Wigry lake and smaller lakes with similar climate and geological origin simultaneously, as they were connected with each other in groups in the past. Covering the Wigry Lake and adjacent lakes with research gives a chance to understand the abiotic processes occurring in time in a given area. One of the characteristic features of these lakes is the differentiated human impact to their environment
2. Materials and Methods
2.1. Study Area
Located in NE Poland, Wigry National Park includes 42 lakes with a total surface area equal to 2732 ha. The whole area is under the influence of a temperate climate transitional between the maritime and the continental [16,17], although—compared with Poland’s other lake districts—this one is known for its low mean annual temperature (7.2 °C) and its potentially prolonged duration of snow cover (at 118 days per year) [18]. Lakes here are of glacial and postglacial origin, and they form a landscape first generated some 12,000 years ago. The origin is in essence uniform, as all are remnants of the last glacial period, i.e., the Weichselian Glaciation [11]. Many of the lakes studied were once part of a single larger body of water termed the late-Pleistocene Pre-Wigry. Certain lakes here, such as Białe Wigierskie, Okrągłe, Krusznik, and Muliczne form a group of postglacial accumulation and separation bodies of water. Lake Suchar III is of similar genesis, relating to a process of fragmentation that generated smaller bodies of surface water. A glacial lake formed syngenetically with the retreat of the ice sheet is in turn Lake Białe Pierciańskie, while Lake Suchar Wielki is typical of the kind associated with the melting of individual blocks of ice [11].
The mainly homogeneous soils within Wigry National Park were formed from young-glacial sedimentary rocks. Most are brown or of the pararendzina type (with a high content of calcium carbonate and skeletal particles). Only a minority of soils here are podsolic or of silt and peat [19].
The largest lake studied is Lake Wigry proper (at 2163.3 ha), while all other bodies of water are very much smaller (less than 100 ha in area). Indeed, half cover only a few hectares in area (Table 1). In terms of origin, the National Park lakes are assigned to the Wigierskie group (Lakes Wigry, Białe Wigierskie, Krusznik, Okrągłe, Muliczne, Suchar Wielki, and Wygorzele), the Huciańskie group (Lake Suchar III), and the Pierciańskie group (Lakes Wądołek and Białe Pierciańskie). Almost all are connected by rivers or small streams [20], while shore-zone vegetation is very largely formed from such helophytes as common reed (Phragmites australis (Cav.) Trin. ex Steud), common club-rush (Schoenoplectus lacustris L.), and lesser bulrush (Typha angustifolia L.), with a limited admixture of nympheids [12]. Humic lakes are exceptions to this rule, their shore-zone vegetation formed by floating mats comprising the roots and rhizomes of vascular plants (Scheuchzeria palustris L., Cyperaceae, Ericaceae), as well as peat mosses and brown mosses [17]. Overall, Wigry National Park protects a wetland area with an abundance of precious and rare organisms [21].

Table 1.
Limnological characteristics of lakes (modified after [11]).
The ten lakes selected for study were Białe Wigierskie (BW), Białe Pierciańskie (BP), Okrągłe (OK), Muliczne (M), Krusznik (K), Suchar Wielki (SW), Suchar III (SIII), Wądołek (WAD), Wygorzele (WYG), Wigry (Krzyżańska Bay (WK), and Słupiańska Bay (WS) (Table 1, Figure 1).

Figure 1.
The study area map. Studied lakes: 1—Suchar Wielki (SW), 2—Wygorzele (WYG), 3—Wądołek (WAD), 4—Suchar III (SIII), 5—Okrągłe (OK), 6—Białe Wigierskie (BW), Wigry 7.1—Słupiańska Bay (WS), 7.2—Wigry (WK) Krzyżańska Bay, 8—Krusznik (K), 9—Muliczne (M), 10—Białe Pierciańskie (BP).
In total, 44 water samples were analyzed for their physical and chemical properties (Table 2). They were collected in spring (May 2015, May 2017), summer (September 2017), and autumn (November 2016) from 11 sampling points (one in each lake and two in the large Lake Wigry). All sampling for physical and chemical properties was done in open water, with comparable environments selected as far as possible. Conductivity and pH were measured using a YSI 6600 V2 multiparameter sonde. Water for chemical analyses was sampled 20–30 cm below the lake surface using 0.33 L polyethylene bottles and stored in the dark at 4 °C to limit ongoing chemical reactions. Ionic analyses were related to phosphate, sulfate, nitrate, fluoride, carbonate, chloride, and nitrite, as well as sodium, lithium, potassium, magnesium, ammonium, and calcium. Laboratory measurement of conductivity and pH (Table 2) involved the Dionex ion chromatograph at the laboratory of the Institute of Nature Conservation, Polish Academy of Sciences.
Table 2.
Physical, chemical, and biological characteristic of the studied lakes.
2.2. Statistical Data
A Hierarchical Cluster Analysis (HCA) was applied to the chemical data to identify the main sources of variation within given lakes and to produce a classification of the bodies of water analyzed. Ward’s minimum variance method was used as a standard clustering procedure, while Euclidean distance served as the distance measure [22]. The Silhouette Index and Prediction Strength [23] analyzed the effectiveness of the grouping process. Principal Component Analysis was used to visualize a sample grouping in line with physical and chemical variables. Statistical analysis was performed in R 3.6.1 [24], in association with the packages: FactoMineR [25], ggplot2 [26], and factoextra [27]. The combining of HCA and PCA provided for more robust interpretation of the variability present in lake-water chemistry, as well as the change characterizing assemblages. The dominance index (after [28]) was calculated as DI = p1 + p2, i.e., the sum of the two highest abundance values (%) in a sample.
We used Generalized Linear Models (lm function) with the categorical independent variable (group) to investigate differences between groups.
2.3. Diatom Data
We sampled material from ten lakes and eleven locations (Figure 1, Table 1 and Table 2). The samples were collected in autumn–spring time (November 2014, May 2015) and prepared after [29] and [30]. In total, 22 samples of periphyton (from common reed Phragmites australis in harmonious lakes and Carex spp. in disharmonic lakes) were taken. Samples were cleaned by adding 37% H2O2 and then heated. The reaction was completed by adding KMnO4 and HCl. The cleaned diatom material dried on slides was mounted in Naphrax® synthetic resin. Then, the slides were analyzed using an Nikon Eclipse–80i microscope, with 400 diatom valves counted. Diatom identification mainly followed [5,31,32,33,34,35,36,37,38]. Dominants are defined here as the species occurring most frequently, with a relative abundance above 10%.
3. Results
3.1. Physical and Chemical Data
The physical and chemical data collected for the lakes (Table 2) showed the most marked variation in the case of water conductivity [from 15 to 402 µS/cm (in SW and WK respectively)], as well as pH [range 3.6 to 8.3 (at SIII and OK)]. Carbonates were present at the highest concentration in Lake BP (at 292 mg/L), while the lowest levels were characterized in Lake SW (8.66). The content of sulfate ions varied from 0.02 (WYG, SIII) to 30.92 mg/L (OK), chloride ions varied from 0.86 (SIII) to 17.05 mg/L (WK), nitrates varied from <0.0001 (SW, SIII, WAD, WYG) to 1.75 mg/L (OK), phosphates varied from 0.002 (M) to 0.05 mg/L (SIII), and calcium ions varied from 0.59 (at SIII) to 73.62 mg/L (at OK).
3.2. Statistical Data
The Hierarchical Cluster Analysis (HCA) grouped the lakes considered into three clusters, as (1) disharmonic, (2) harmonious with a greater human impact on the environment, and (3) harmonious with a limited human impact on the environment (Figure 2). The Silhouette Index (used to analyze the effectiveness of grouping, Figure 3 showed a relatively high score while mean the Silhouette width was 0.37. The prediction strength of these three clusters were estimated as 0.86 (PS > 0.8, strong support).
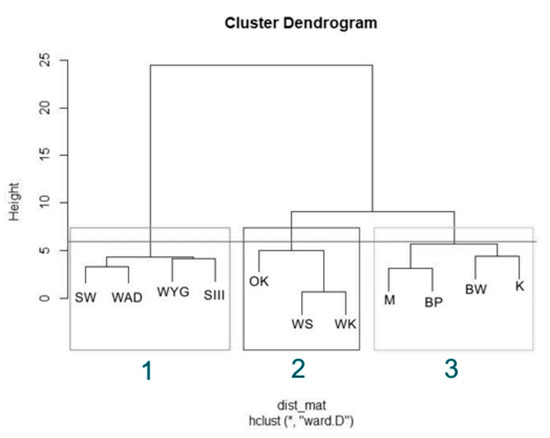
Figure 2.
Hierarchical Cluster Analysis (HCA) for physical and chemical variables in the studied bodies of water, with cutting highlighting the corresponding clusters. Lakes in the first group disharmonic—box (1): SW, WYG, WAD, and SIII. Lakes in the second group harmonious with greater human impact on the environment—box (2): OK, WS, and WK. Lakes in the last group harmonious with low human impact on the environment—box (3) were BW, K, M, and BP.
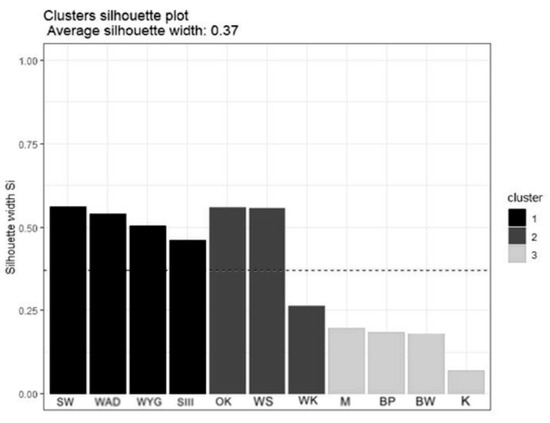
Figure 3.
The Silhouette plot for HCA. Lakes in cluster 1—disharmonic lakes, lakes in cluster 2—harmonious with greater human impact on the environment, and lakes in cluster 3—harmonious with a low human impact on the environment.
The Principal Component Analysis (PCA) revealed two main directions of variation, with axis 1 explaining 52.4% of the total variance and axis 2 explaining an additional 12.4% (Figure 4). The strongest direction of variation (axis 1) was primarily a gradient of water conductivity, pH, and ion (mainly magnesium, carbonate, fluoride, calcium, sulfate, sodium, and chloride) concentrations (Figure 5). All of these variables correlated positively with PCA axis 1. The second gradient (of axis 2) was characterized by chloride, potassium, nitrate, lithium, phosphate, sodium, and calcium (Figure 6). PCA (Figure 4) offered a clear separation out of disharmonic lakes (group 1). None of the lakes from this group (SW, WYG, WAD, and SIII) overlapped with the members of other groups. They represent a group of distrophic lakes characterized by low pH values, limited conductivity, and low concentrations of carbonates (Table 2). In this study, group 1 showed concentrations of phosphates and ammonium that were relatively high by the standards of the ten lakes studied (Table 2).
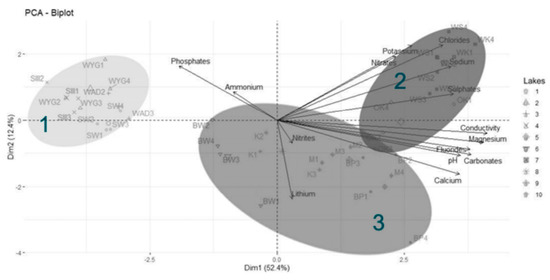
Figure 4.
Principal Component Analysis (PCA) for physical and chemical variables in the studied reservoirs. Ellipses on the biplot represent cluster groups (from HCA). The cumulative explained variation (for axis 1 and 2) is 64.8%. Lakes in group 1 (disharmonic): 1—SW, 2—WYG, 3—WAD, and 4—SIII. Lakes in group 2 (harmonious with a greater human impact on the environment): 5—OK, 7—WS and WK. Lakes in group 3 (harmonious with a more limited human impact on the environment): 6—BW, 8—K, 9—M, and 10—BP. Ellipses on the biplot represent cluster groups (HCA). Water samples were collected in spring: May 2015 (notation 1 after lake abbreviation e.g., BW1), May 2017 (notation 2), summer: September 2017 (notation 3), and autumn: November 2016 (notation 4).

Figure 5.
Contributions of variables—PCA axis 1.
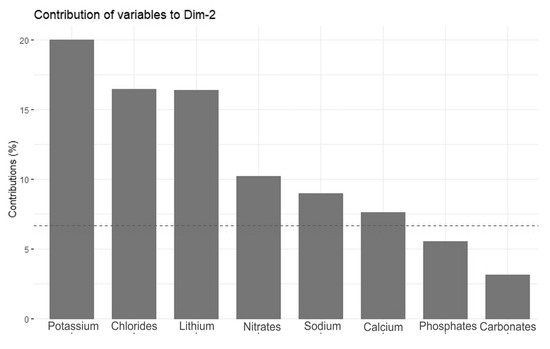
Figure 6.
Contributions of variables—PCA axis 2.
The PCA and HCA both divided harmonious lakes into two groups (2 and 3), which were mainly in line with concentrations of chloride and sulfate, although nitrate content was also an important factor. Assigned to the group of harmonious lakes showing greater human impact on the environment were OK, WS and WK. These lakes were indeed characterized by their high concentrations of chloride and sulfate, but also sodium. The lakes of the third group (harmonious and with a limited human impact on the environment) were BW, K, M, and BP, and this group proved most dependent for its cohesive identity on high calcium and low orthophosphate concentrations (Figure 4). Some samples from a harmonious lake (OK2, OK3,) were in the overlapping area between groups 2 and 3, comparably so with both the HCA analysis and the Silhouette Index score.
We analyzed differences in Dominance Index between groups (Figure 7). We used Generalized Linear Models (lm function) with the categorical independent variable (group) to investigate differences between groups. It showed significant differences (p < 0.05) between groups 1–3 and 2–3.
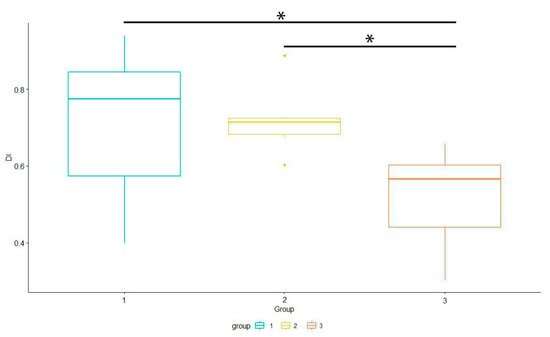
Figure 7.
Differences in Dominance Index between groups. * showed significant differences (p < 0.05) between groups 1–3 and 2–3.
3.3. Diatom Data
Dominance within the diatom assemblages is different in the three groups (Figure 8). The most marked differences are those observed between disharmonic sites (group 1) and harmonious (groups 2 and 3). In the disharmonic group (1), the most characteristic dominant species was Tabellaria flocculosa (Roth) Kützing 1844. Such species as Eunotia mucophila (Lange-Bertalot, Nörpel-Schempp and Alles), Lange-Bertalot 2007, E. rhomboidea Hustedt 1950, E. genuflexa Nörpel-Schempp 1996, Stauroforma exiguiformis (Lange-Bertalot), R.J.Flower, V.J.Jones and Round 1996, Kobayasiella subtillissima (Cleve) Lange-Bertalot 1999, and Nitzschia gracilis Hantzsch 1860 were additional dominants. The second group was solely dominated by Achnanthidium minutissimum (Kützing) Czarnecki 1994, Fragilaria subconstricta Østrup 1910, and Encyonopsis microcephala (Grunow) Krammer 1997. In comparison, the third group of lakes was dominated by Achnanthidium minutissimum, Encyonopsis microcephala, and additionally Brachysira microcephala (Grunow) Compère 1986, Encyonopsis cesatii (Rabenhorst) Krammer 1997, Eunotia arcubus Nörpel and Lange-Bertalot 1993, Delicatophycus delicatulus (Kützing) M.J.Wynne 2019, and Staurosirella pinnata (Ehrenberg) D.M.Williams and Round 1988. The clearest dominance structure was found in Lake WYG (DI = 93.67%) and Lake SIII (DI = 83.41%) (Figure 8). Here, the occurrence of Tabellaria flocculosa accounted respectively for 64.48 and 74.71% of relative abundance (Figure 8). Strong dominance in the harmonious lakes characterized WS (DI = 72.26%), and Lake OK (DI = 88.78%). Lakes K, M, and SW showed a more even structure (DIK = 38%, DIM = 48%, DISW = 40%).
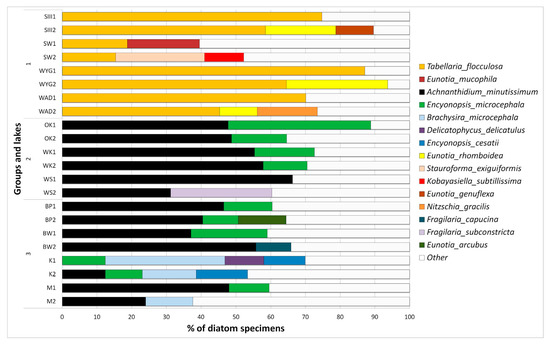
Figure 8.
Relative abundance of the most numerous diatom taxa found in examined lakes group (1)—SW, WYG –, WAD, SIII, group (2)—OK, WSand WK, group (3)—BW, M and BP. Notation 1 (as e.g., in BW1) spring samples, notation 2 (as e.g., in BW2) autumn samples.
4. Discussion
Determination of the relationships between environments and diatom assemblages is the urgent aim of several works. Usually, these elaborations are based on a broad scale of located lakes (e.g., [39,40]). However, the kind of prediction shown in our study is clearly visible, even on a very small scale: one large lake (Wigry) and the small lakes surrounding it. Analysis of physical and chemical variables and comparison with historical data showed that the highest concentrations of both phosphate and nitrate were reached around 1996 ([12], our analysis of data). After this, a lowering of concentrations ensued, due to a change in wastewater treatment (modernization of a plant) [12]. Values for some variables, such as conductivity, have risen (Figure 9). The physical values of water and ion concentration were undoubtedly influenced by elevated temperature and very low rainfall during the research (2014–2015). Furthermore, biological variables such as the quality of macrophytes (as measured using the Ecological State Macrophyte Index—ESMI [41]) and the structure of the littoral zone (area covered by littoral vegetation) showed deterioration [12]. Similar aggravation in the quality of charophytes was reported [42] in the surrounding districts. These are indicators of human impact on the environment [41]. According to Górniak [12], the human impact in the study area was mostly attributed to a lack of separators in rainwater drainage and problems with wastewater treatment in buildings located far (up to 15km) from sewerage. Fish farming and increased tourism pressure reflecting economic growth in Poland make these processes much more complicated. Similar changes were reported by Siuda et al. [43] in the Mazurian Lake District. Siuda et al. [43] attributed the lowered concentrations of phosphate and nitrate and retreat in terms of the trophic state of lakes to economic collapse (in the 1980s–1990s), with a change in wastewater treatment and the collapse of unsustainable agriculture also involved.
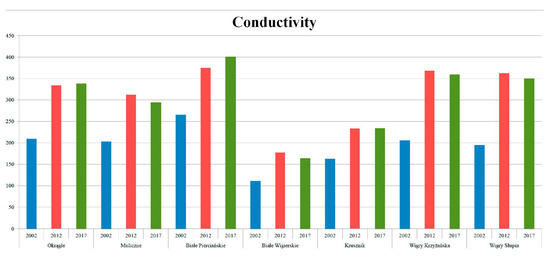
Figure 9.
Changes in conductivity: our results from summer in comparison with data from 2011/2012 and 2002 (modified after Górniak (Ed.), 2014 and Górniak, 2006).
However, the reductions in concentrations of phosphate and nitrate that were noted have turned back into increases, with this attributed by Siuda et al. [43] to the problem of concentrated wastewater treatment. This is comparable to the Wigry lake case in our study area. The Siuda et al. [43] prediction is that the deposition of all treated sewage from over a larger area into bodies of water or rivers is what has been causing increased concentrations of nutrients, given that treated wastewater still has more phosphate and nitrate than naturally occurring water. Thus, the solution advocated is dispersed wastewater treatment (with water first clarified near the households that generate it, in small wastewater treatment stations). In our study area, such a solution was implemented at least in part (with wastewater treatment at the village of Bryzgiel), and the outcomes were positive. It is possible that these changes are related to the increase in the annual temperature of this area. In comparison with other lake districts in Poland, Wigry National Park continues to have lakes of good water quality [12,44,45]. The statistical analysis (PCA and HCA) in relation to water physical and chemical variables allowed the lakes under study to be assigned to three groups, i.e., (1) disharmonic, (2) harmonious with a greater human impact on the environment, and (3) harmonious with a more limited human impact on the environment. Group 1, firmly distinguished in our analysis, comprises dystrophic lakes SW, SIII, WAD, and WYG. Two of these lakes (SW and WYG) are in the Wigry group, while the others form part of the Lake Pierciańskie group (WAD) and the Lake Huciańskie group (SIII) (Table 1). Thus, while origins are different, the endorheic character is similar (except in the case of WAD). Lake SW developed in connection with melting blocks of ice, while Lake II was created during a process of fragmentation that created smaller surface bodies of water. Lake WAD came into being as the ice sheet cover of Lake BP retreated, while Lake WYG is a remnant of the Pre-Wigry lake that once existed [11,20]. Today, these lakes represent a group that is cohesive from the ecological point of view.
Water samples are characterized by low pH, low values for electrolytic conductivity, and water of a brown-yellow hue. As Górniak [11] reported, a strong shift in one variable (here a low pH value) leaves lakes unbalanced and switched toward a disharmonic path of evolution. The low pH values are in fact natural, reflecting the ombrotrophic sourcing of water. The catchments of these lakes are mainly covered by coniferous forest [12,16], so an increased supply of allochthonous matter leaves lakes rich in humic acids [11]. The range of the photic zone is reduced in consequence, with the spectrum of light penetrating the different layers of water changed, and stratification is also affected [46].
On the other hand, the chelation properties of the humic acids influence the physical and chemical variables of water, while the environment offers an additional selection factor where diatoms are concerned, as the presence of humic acids lowers concentrations of silica in water [9]. This disturbs the production of frustules, especially in early stages of development [9,47]. Only adaptable species of diatom can survive in such environments. In the disharmonic group of lakes, the most characteristic dominant species is Tabellaria flocculosa, which is often in fact abundant in acidic, soft waters [48]. Other species found to be abundant in the disharmonic group of lakes (group 1) were Eunotia mucophila, E. rhomboidea, E. genuflexa, Stauroforma exiguiformis, Kobayasiella subtillissima, and Nitzschia gracilis. Environments of low pH are joined by peatlands as important refugia for rare species [9,10]. Taxa from the first group reported for the first time from Wigry National Park are Eunotia genuflexa, E. mucophila, E. rhomboidea, Kobayasiella subtillissima, Nitzschia gracilis, and Stauroforma exiguiformis.
The division of the harmonious lakes into two groups was mainly a reflection of the presence of chloride and sulfate, but also nitrate. Chloride and sulfate in inland waters are usually of anthropogenic origin [12,49]. Lakes from the second group (with greater anthropopressure) are OK, WK, and WS. These lakes fall within the Wigry group and are remnants of the old, Pre-Wigry lake [11,20]. Catchments of group 3 (less affected by anthropopressure) are mostly covered in forest, with anthropopressure limited, while Lake BW (one of the group 3 lakes) enjoys special protection within Wigry National Park (being within the Strict Nature Reserve). From an origin point of view, group 3 represents the Wigierskie group (K, M, BW) and the Pierciańskie group (BP). Some samples from the harmonious lakes (groups 2 and 3) were collected in an overlapping area (OK) in PCA, which is comparable with the HCA analysis and Silhouette Index score. Analysis of biological and physical and chemical variables by Górniak [12] showed that the different indexes divide lakes from groups 2 and 3 differently. The lakes studied are subject to various kinds of anthropopressure both now and from the historical point of view. For example, Lake K has an agricultural catchment, while Lake OK has a rural catchment [12], with the result that the waters have excesses of different ions. This explains the lower Silhouette width and overlapping of these two groups—the lakes form a gradient, not two groups straightforwardly. Group (2)—harmonious with a greater human impact on the environment—was dominated by Achnanthidium minutissimum, Fragilaria subconstricta, and Encyonopsis microcephala. Only Achnanthidium minutissimum is observed in a wide range of environmental conditions, while Fragilaria subconstricta occurs in mesotrophic, slightly alkaline environments, and Encyonopsis microcephala is present in oligotrophic to slightly eutrophic conditions [38,46]. These taxa are more resistant to slight anthropopressure and a higher nutrient content than less common taxa from the third group. In comparison, the lakes of group (3)—harmonious with a lower human impact on the environment—were dominated by Achnanthidium minutissimum and Encyonopsis microcephala, and additionally by Brachysira microcephala, Encyonopsis cesatii, Eunotia arcubus, Delicatophycus delicatulus, and Staurosirella pinnata. These species are mostly indicative of oligotrophic to mesotrophic waters, which are rich in calcium bicarbonate [48]. This is comparable with our findings (the third group is characterized by more limited anthropopressure and lower concentrations of nitrate and phosphate).
Lake monitoring is very important, especially due to proven changes in nutrient status and the non-straightforward explanation of these processes [12]. Taxa from group 3 not reported hitherto from Wigry National Park were Delicatophycus delicatulus, Encyonopsis cesatii, Fragilaria subconstricta, and Eunotia arcubus [9,11,13,14,15].
The seasons were chosen in which diatoms have the highest abundance in temperate climate, due to minimizing the impact of competition on the biodiversity of diatoms. In our analysis of diatom dominance structure, we can see the clearest cases (in relation to DI) characterizing lakes WYG (DI 89–94) and SIII (DI 79–83). The marked dominance there was obviously related to lower species richness and more limited evenness. As Witkowski et al. [9] stated, when pH values fall, species richness is curtailed, and the structure of diatom assemblages can be changed profoundly. Such environments of lowered resilience are susceptible to stressors other than an excess of hydrogen ions e.g., the expansion of Gonyostomum semen (Ehrenberg) Diesing 1866 reported [50,51]. On the other hand, low diversity in the distrophic group can be related to low conductivity (as reported in [52]). It is worth consideration to look at the outlier in this group—Lake SW showed a more even structure (mean value—40%). Our observations and the processes of invasion by nympheids [12] may be related, but this hypothesis demands further analysis. Despite reports regarding HDI (the Hydrochemical Dystrophy Index) [11,12], some physical, chemical, and biological variables of Lake SW show differences from other dystrophic lakes, encouraging some scientists to describe it as moderately dystrophic [53]. The unique features of lake SW are also described by Karpowicz et al. [51]. Their data show a lower abundance of Gonyostomum semen and a higher biomass of zooplankton in Lake SW in comparison to the lower biomass in the other dystrophic lakes, as well as a deep and oxygenated epilimnion in contrast to lower oxygen concentration in other disharmonic lakes. The changes in diatom dominance structure are not linked solely with pH value; the pH values noted for Lake SW are not the highest in the dystrophic group ([11,12] and our data), yet the structure and low DI repeats in other seasons (average pH by the standards of the dystrophic group yet the most limited dominance). Another influencing factor is presumably present.
Generalized Linear Models showed significant (p < 0.05) differences in Dominance Index in two groups of harmonious lakes. Strong dominance (DI > 70%) in the context of harmonious lakes was found for Lake WS and WK, and for Lake OK. On the other hand, Lakes K and M (M) show a more even distribution of dominants (DIK < 50, DIM < 60). As Van Dam [54] reports, such a peak of diversity can be connected with an intermediate level of disturbance. The expected structure of diatom assemblages of natural lakes is one or two strongly dominant taxa, a few subdominants, and rare species in the minority. For example, as a disturbance, a temporal drought [55] is introduced; then, the dominance structure becomes more even—with a few dominants and more rare species. This can be explained by reference to a change from one environment with its specialists to another with different specialists. Thus, peak species richness is connected with a rebuilding of the structure of the diatom assemblage. More intensive disturbance in turn renders the environment more homogeneous and thus generates a collapse in species richness. Such effects are in line with the Intermediate Disturbance Hypothesis [56], although this structure of dominance repeats between seasons, raising a question as to whether these are repeated disturbances (consistent rebuilding), stressors, or other factors. In our case, Lake BP and Lake SW had an even structure (lower DI), yet they are especially protected or hard to reach in the field. The IDH has been a subject of heated debate in recent years (e.g., [36,57,58]). Anthropogenic disturbances (as in group 2) are known to reduce biodiversity [59] and are shifting in species composition toward taxa thriving in nutrient-rich conditions ([60]—for nutrient enrichment). In our case, changes in the diatom dominance structure can be connected with the changing physical and chemical properties of water in lakes to a more evolutionary common one (e.g., from electrolyte-poor and acidic to circumneutral water, as between groups 1 and 3). In such environments, there are more specialists available due to an evolutionarily longer time for adaptation [61,62]. This point of view is consistent with the Species Pool Hypothesis [61,62]. In groups, we can see similar patterns, as the third group—of intermediate status (in terms of pH and nutrient content) and with lower anthropopressure—shows a depression in the Dominance Index. Moreover, as research concerning our study area showed, high pH and a relatively high mineralization or oligotrophy were more common in this area [63,64]. Recent research reports diatoms behavior as consistent with SPH [65]; however, more evidence will be more conclusive. Samples with a high Dominance Index were inhabited by either generalists or specialists (group 1 and 2), which is consistent with observations reported by Soininen and Heino [66]; however, samples in group 3, which were more diverse, were dominated firstly by generalists and then specialists (contradictory to Soininen and Heino [66], but this was consistent with other analyses on lakes, as in e.g, [67,68]).
Strong pressure exerted by tourism and fish farming and problems with sewage treatment plants all potentially pose dangerous threats to this region. Moreover, the lakes are threatened by indirect effects (climate change). Therefore, further monitoring of physical, chemical, and biological changes here is a necessity.
5. Conclusions
The lakes in Poland’s Wigry National Park are diversified in size, depth, and trophic status. The lakes belong to the Wigierskie, Huciańskie, and Pierciańskie groups and show broad heterogeneity in chemical variables and diatom dominance structure. The variability reflects differences in both the geological and anthropological history of the studied lakes. Hierarchical Cluster Analysis (HCA) and Principal Component Analysis (PCA) clearly separated off disharmonic lakes (of low pH and rich in allochthonous matter), as opposed to harmonious ones. The latter were divided into groups indicating human impact on the environment as either high or low, with this assessment depending mainly on content of chloride and sulfate ions. The comparison of dominant diatom taxa is justified, as physical and chemical variables describing water are important factors affecting numbers of species and the uniformity of abundance among organisms that inhabit them. In the disharmonic group of lakes, the most distinctive dominant species was Tabellaria flocculosa, with harmonious lakes in turn being dominated by Achnanthidium minutissimum and Encyonopsis microcephala. The first group was dominated by acidophilous diatoms, the second group was dominated by species tolerating a wide spectrum of habitat conditions, and the third group was dominated by more sensitive kinds that prefer oligotrophic to mesotrophic waters. Lakes impacted by anthropopression and disharmonic had the strongest dominance structure. The three groups had different dominance structures, given the abundance of dominants as well as the Dominant Index (mean values being: (1)—70.54%, (2)—72%, and (3)—54.58%, Generalized Linear Models with the categorical independent variable (for 1–3, 2–3) p value < 0.05). The high figure in the first case can be considered due to the more severe environmental conditions experienced (low pH and the presence of humic acids); on the other hand, the high DI in group 2 can be associated with anthropopression indicators. The differences in environmental variables and observed diatom dominance structure arise out of natural geological differences and levels of anthropogenic impact.
Author Contributions
Conceptualization, methodology, software, validation, formal analysis, investigation, M.E.-K.; writing—original draft preparation, M.E.-K. and A.Z.W.; data curation, A.Z.W. All authors have read and agreed to the published version of the manuscript.
Funding
This work was supported by the Institute of Nature Conservation, Polish Academy of Sciences (Kraków, Poland) through grant funding for PhD students and through the Institute’s statutory funds.
Acknowledgments
We are indebted to Hanna Szymańska, Hanna Werblan-Jakubiec, Bożena Zakryś and Włodzimierz Winiarski, Adam Flis, employees of Wigry National Park, especially Mateusz Danilczyk, Maciej Romański, Mariusz Szczęsny, Lech Krzysztofiak and Maciej Kamiński. We are thankful for generous help with field work and for other assistance. We thank Łukasz Peszek, Matusz Rybak for help and fruitful suggestions. We thank Wojciech Krztoń for advices about statistical analyses and the anonymous reviewers for constructive suggestions.
Conflicts of Interest
The authors declare no conflict of interest.
References
- Morandín-Ahuerma, I.; Contreras-Hernández, A.; Ayala-Ortiz, D.A.; Pérez-Maqueo, O. Socio—Ecosystemic sustainability. Sustainability 2019, 11, 3354. [Google Scholar] [CrossRef]
- Krztoń, W.; Kosiba, J.; Pociecha, A. The effect of cyanobacterial blooms on bio-and functional diversity of zooplankton communities. Biodivers. Conserv. 2019, 28, 1815–1835. [Google Scholar] [CrossRef]
- Ognjanova-Rumenova, N.; Wojtal, A.Z.; Sienkiewicz, E.; Botev, I.; Trichkova, T. Biodiversity of high mountain lakes in europe with special regards to Rila Mountains (Bulgaria) and Tatra Mountains (Poland). Diatoms Fundam. Appl. 2019, 335–354. [Google Scholar] [CrossRef]
- Strayer, D.L.; Findlay, S.E. Ecology of freshwater shore zones. Aquat. Sci. 2010, 72, 127–163. [Google Scholar] [CrossRef]
- Hofmann, G.; Werum, M.; Lange-Bertalot, H. Diatomeen im Süßwasser-Benthos von Mitteleuropa. Bestimmungsflora Kieselalgen für die Ökologische Praxis; Über, 700 der Häufigsten Arten und Ihrer Ökologie; Gantner: Nüziders, Austria, 2011; pp. 1–942. [Google Scholar]
- Marra, R.C.; Algarte, V.M.; Ludwig, T.A.; Padial, A.A. Diatom diversity at multiple scales in urban reservoirs in Southern Brazil reveals the likely role of trophic state. Limnologica 2018, 70, 49–57. [Google Scholar] [CrossRef]
- Stoermer, E.F.; Smol, J.P. Applications and uses of diatoms: Prologue. In The Diatoms: Applications for the Environmental and Earth Sciences, 1st ed.; Cambridge University Press: New York, NY, USA, 1999; pp. 3–10. [Google Scholar]
- Van Dam, H. On the use of measures of structure and diversity in applied diatom ecology. Nova Hedwig. 1982, 73, 97–115. [Google Scholar]
- Witkowski, A.; Radziejewska, T.; Wawrzyniak-Wydrowska, B.; Lange-Bertalot, H.; Bąk, M.; Gelbrecht, J. Living on the pH edge: Diatom assemblages of low–pH lakes in western Pomerania (NW Poland). In The Diatom World; Sekbach, J., Kociolek, P., Eds.; Springer: Dordrecht, The Netherlands, 2011; pp. 365–384. [Google Scholar]
- Rybak, M.; Poradowska, A.; Kochman-Kedziora, N.; Peszek, Ł.; Noga, T.; Stanek-Tarkowska, J. Okrzemki (bacillariophyta) torfowiska wołosate (bieszczadzki park narodowy). Rocz. Bieszcz. 2018, 26, 169–183. [Google Scholar]
- Górniak, A. Typologia i Aktualna Trofia Jezior WPN; Wydawnictwa–Uniwersytet w Białymstoku. Zakład Hydrobiology: Białystok, Poland, 2006; pp. 128–140. [Google Scholar]
- Górniak, A. Plan Ochrony dla Wigierskiego Parku Narodowego i Obszaru Natura 2000 Ostoja PLH200004. Available online: http://www.wigry.org.pl/inf_i_rozw/plany/materialy.htm (accessed on 4 August 2019).
- Tomaszewicz, G.H. Flora glonow wigierskiego parku narodowego. Fragm. Florist. Geobot. Pol. 1996, 3, 239–259. [Google Scholar]
- Rakowska, B. Preliminary elaboration of the diatom communities occuring in the benthos of the Kamionka River and Lake Czarne at the Pojezierze Suwalskie (1993–1994). Fragm. Florist. Geobot. Pol. 1996, 3, 221–238. [Google Scholar]
- Bobrukiewicz, K. Bory Tucholskie i Inne Obszary Leśne. Ochrona, Monitoring, Edukacja. Available online: https://books.google.cn/books/about/Bory_Tucholskie_i_inne_obszary_le%C5%9Bne.html?id=ejZ0PgAACAAJ&redir_esc=y (accessed on 12 July 2019).
- Andrzejczyk, T.; Brzeziecki, B. The structure and dynamics of old-growth Pinus sylvestris (L.) stands in the Wigry National Park, north-eastern Poland. Vegetatio 1995, 117, 81–94. [Google Scholar] [CrossRef]
- Drzymulska, D.; Zieliński, P. Phases and interruptions in postglacial development of humic lake margin (Lake Suchar Wielki, NE Poland). Limnol. Rev. 2014, 14, 13–20. [Google Scholar] [CrossRef][Green Version]
- Górniak, A. Current Climatic Conditions of Lake Regions in Poland and Impacts on Their Functioning; Polish River Basins and Lakes–Part. I, 1–25; Springer: Cham, Switzerland, 2020. [Google Scholar] [CrossRef]
- Skrajna, T.; Kubicka, H. Segetal flora of the wigry national park. Acta Agrobot. 2011, 64, 119–132. [Google Scholar] [CrossRef][Green Version]
- Kostrowicki, A.S.; Baumgart-Kotarba, M. Studium Geoekologiczne Rejonu Jezior Wigierskich; Zakład Narodowy im. Ossolińskich: Warszawa, Poland, 1988. [Google Scholar]
- Rutkowski, J.; Krzysztofiak, L. Jezioro Wigry: Historia Jeziora w Świetle Badań Geologicznych i Paleoekologicznych; Stowarzyszenie Człowiek i Przyroda: Podlaskie, Poland, 2009. [Google Scholar]
- Boggero, A.; Zaupa, S.; Musazzi, S.; Rogora, M.; Dumnicka, E.; Lami, A. Environmental factors as drivers for macroinvertebrate and diatom diversity in Alpine lakes: New insights from the Stelvio National Park (Italy). J. Limnol. 2019, 78, 147–162. [Google Scholar] [CrossRef]
- Tibshirani, R.; Walther, G. Cluster validation by prediction strength. J. Comput. Graph. Stat. 2005, 14, 511–528. [Google Scholar] [CrossRef]
- R Core Team. R: A Language and Environment for Statistical Computing. R Foundation for Statistical Computing, Vienna, Austria 2013. Available online: http://www.R-project.org (accessed on 2 March 2020).
- Husson, F.; Josse, J.; Le, S.; Mazet, J.; Husson, M.F. Package ‘FactoMineR’. Package R FactorMine 2019, 96, 698. [Google Scholar]
- Wickham, H. Ggplot2: Elegant Graphics for Data Analysis; Springer: Berlin/Heidelberg, Germany, 2016. [Google Scholar] [CrossRef]
- Kassambara, A.; Mundt, F. Factoextra: Extract and visualize the results of multivariate data analyses. R Package Version 2017, 1, 337–354. [Google Scholar]
- McNaughton, S.J.; Wolf, L.L. Dominance and the niche in ecological systems. Science 1970, 167, 131–139. [Google Scholar] [CrossRef]
- Picińska-Fałtynowicz, J.; Błachuta, J. Wytyczne Metodyczne do Przeprowadzenia Oceny Stanu Ekologicznego Jednolitych Części Wód Rzek i Jezior Oraz Potencjału Ekologicznego Sztucznych i Silnie Zmienionych Jednolitych Części Wód Płynących Polski na Podstawie Badań Fitobentosu; Wydawnictwo GIOŚ Warszawa: Warsaw, Poland, 2008; pp. 1–79. [Google Scholar]
- Zgrundo, A.; Peszek, Ł.; Poradowska, A. Podręcznik do Monitoringu i Oceny Rzecznych Jednolitych Części Wód Powierzchniowych na Podstawie Fitobentosu; Ocean Sense: Gdańsk, Poland, 2018. [Google Scholar]
- Kulikovskiy, M.S.; Lange-Bertalot, H.; Witkowski, A.; Dorofeyuk, N.I.; Genkal, S.I. Diatom assemblages from Sphagnum bogs of the world. Bibl. Diatomol. 2010, 55, 1–326. [Google Scholar]
- Wojtal, A.Z.; Ector, L.; Van de Vijver, B.; Morales, E.A.; Blanco, S.; Piatek, J.; Smieja, A. The Achnanthidium minutissimum complex (Bacillariophyceae) in southern Poland. Algol. Stud. 2011, 136, 211–238. [Google Scholar] [CrossRef]
- Lange-Bertalot, H.; Ulrich, S. Contributions to the taxonomy of needle-shaped Fragilaria and Ulnaria species. Lauterbornia 2014, 78, 1–73. [Google Scholar]
- Van de Vijver, B. Analysis of the type material of Navicula brachysira Brébisson with the description of Brachysira sandrae, a new raphid diatom (Bacillariophyceae) from Iles Kerguelen (TAAF, sub-Antarctica, southern Indian Ocean). Phytotaxa 2014, 184, 139–147. [Google Scholar] [CrossRef]
- Delgado, C.; Novais, M.H.; Blanco, S.; Almeida, S.F. Examination and comparison of Fragilaria candidagilae sp. nov. with type material of Fragilaria recapitellata, F. capucina, F. perminuta, F. intermedia and F. neointermedia (Fragilariales, Bacillariophyceae). Phytotaxa 2015, 231, 1–18. [Google Scholar] [CrossRef]
- Lengyel, E. Stress and Disturbance in Benthic Diatom Assemblages. Examples from Lakes and Streams and from the Field and Laboratory Studies. Ph.D. Thesis, University of Pannonia, Veszprém, Hungary, 2016. [Google Scholar] [CrossRef]
- Kennedy, B.; Allott, N. A review of the genus Brachysira in Ireland with the description of Brachysira praegeri and Brachysira conamarae, new raphid diatoms (Bacillariophyceae) from high status waterbodies. Phytotaxa 2017, 326, 1–27. [Google Scholar] [CrossRef]
- Heudre, D.; Wetzel, C.E.; Moreau, L.; Van de Vijver, B.; Ector, L. On the identity of the rare Fragilaria subconstricta (Fragilariaceae), with Fragilaria species forming ribbon–like colonies shortly reconsidered. Plant Ecol. Evol. 2019, 152, 327–339. [Google Scholar] [CrossRef]
- Bennett, J.R.; Cumming, B.F.; Ginn, B.K.; Smol, J.P. Broad-scale environmental response and niche conservatism in lacustrine diatom communities. Glob. Ecol. Biogeogr. 2010, 19, 724–732. [Google Scholar] [CrossRef]
- Schaumburg, J.; Schranz, C.; Hofmann, G.; Stelzer, D.; Schneider, S.; Schmedtje, U. Macrophytes and phytobenthos as indicators of ecological status in German lakes—A contribution to the implementation of the Water Framework Directive. Limnologica 2004, 34, 302–314. [Google Scholar] [CrossRef]
- Ciecierska, H.; Kolada, A. ESMI: A macrophyte index for assessing the ecological status of lakes. Environ. Monit. Assess. 2014, 186, 5501–5517. [Google Scholar] [CrossRef]
- Kłosowski, S.; Tomaszewicz, G.H.; Tomaszewicz, H. The expansion and decline of charophyte communities in lakes within the Sejny Lake District (north-eastern Poland) and changes in water chemistry. Limnologica 2006, 36, 234–240. [Google Scholar] [CrossRef]
- Siuda, W.; Kaliński, T.; Kauppinen, E.; Chróst, R.J. Eutrofizacja południowej części kompleksu wielkich jezior mazurskich w latach 1977–2011. Technol. Wody 2014, 3, 48–62. [Google Scholar]
- Bok, G.; Boguszewska, A.; Barańska, A.; Panasewicz, A.; Wiśniewska, M. Raport o Stanie Środowiska Województwa Podlaskiego 2015. Available online: http://www.wios.bialystok.pl/pdf/wios_raport2015_wersja_WWW.pdf (accessed on 6 June 2020).
- Panek, P.; Biliński, G.; Brodowska, M.; Chełstowska, A.; Czajka, J.; Dudek, M.; Fornal, B.; Kamińska, M.; Kasprowicz, H.; Kociuba, M.; et al. Stan Środowiska w Polsce. Raport 2018. Available online: http://www.gios.gov.pl/pl/aktualnosci/521-stan-srodowiska-w-polsce-raport-2018 (accessed on 12 May 2020).
- Górniak, A.; Jekatierynczuk-Rudczyk, E.; Dobrzyń, P. Hydrochemistry of three dystrophic lakes in Northeastern Poland. Acta Hydrochim. Hydrobiol. 1999, 27, 12–18. [Google Scholar] [CrossRef]
- Hervé, V.; Derr, J.; Douady, S.; Quinet, M.; Moisan, L.; Lopez, P.J. Multiparametric analyses reveal the pH-dependence of silicon biomineralization in diatoms. PLoS ONE 2012, 7, e46722. [Google Scholar] [CrossRef] [PubMed]
- Lange-Bertalot, H.; Hofmann, G.; Werum, M.; Cantonati, M. Freshwater Benthic Diatoms of Central Europe: Over 800 Common Species Used in Ecological Assessment; Koeltz Botanical Books: Hochtaunuskreis, Germany, 2017. [Google Scholar]
- Bennion, H.; Sayer, C.D.; Tibby, J.; Carrick, H.J. Diatoms as indicatorsof environmental change in shallow lakes. In The Diatoms: Applications for the Environmental and Earth Sciences; Cambridge University Press: Cambridge, UK, 2010. [Google Scholar] [CrossRef]
- Pęczuła, W.; Grabowska, M.; Zieliński, P.; Karpowicz, M.; Danilczyk, M. Vertical distribution of expansive, bloom-forming algae Gonyostomum semen vs. plankton community and water chemistry in four small humic lakes. Knowl. Manag. Aquat. Ecosyst. 2018, 419, 28. [Google Scholar] [CrossRef]
- Karpowicz, M.; Zieliński, P.; Grabowska, M.; Ejsmont-Karabin, J.; Kozłowska, J.; Feniova, I. Effect of eutrophication and humification on nutrient cycles and transfer efficiency of matter in freshwater food webs. Hydrobiologia 2020. [Google Scholar] [CrossRef]
- Pestryakova, L.A.; Herzschuh, U.; Gorodnichev, R.; Wetterich, S. The sensitivity of diatom taxa from Yakutian lakes (north-eastern Siberia) to electrical conductivity and other environmental variables. Polar Res. 2018, 37, 1485625. [Google Scholar] [CrossRef]
- Szczęsny, B.; Majecki, J. Variations in the composition of Trichoptera communities associated with lakes of different trophy in the Wigry National Park (NE-Poland). Nova Suppl. Entomol. 2002, 15, 581–593. [Google Scholar]
- Van Dam, H.; Mertens, A.; Sinkeldam, J. A coded checklist and ecological indicator values of freshwater diatoms from The Netherlands. Neth. J. Aquat. Ecol. 1994, 28, 117–133. [Google Scholar] [CrossRef]
- Calapez, A.R.; Elias, C.L.; Almeida, S.F.; Feio, M.J. Extreme drought effects and recovery patterns in the benthic communities of temperate streams. Limnetica 2014, 33, 281–296. [Google Scholar] [CrossRef]
- Connell, J.H. Diversity in tropical rain forests and coral reefs. Science 1978, 199, 1302–1310. [Google Scholar] [CrossRef]
- Fox, J.W. The intermediate disturbance hypothesis should be abandoned. Trends Ecol. Evol. 2013, 28, 86–92. [Google Scholar] [CrossRef]
- Sheil, D.D.; Burslem, F.R.P. Defining and defending Connell’s intermediate disturbance hypothesis: A response to Fox. Trends Ecol. Evol. 2013, 28, 571–572. [Google Scholar] [CrossRef]
- Pandey, U. Anthropogenic drivers shift diatom dominance-diversity relationships and transparent exopolymeric particles production in River Ganga: Implication for natural cleaning of river water. Curr. Sci. 2017, 00113891, 113. [Google Scholar] [CrossRef]
- Schneider, S.C.; Hjermann, D.O.; Edvardsen, H. Do benthic algae provide important information over and above that provided by macrophytes and phytoplankton in lake status assessment?–Results from a case study in Norway. Limnologica 2019, 76, 28–40. [Google Scholar] [CrossRef]
- Taylor, D.R.; Aarssen, L.W.; Loehle, C. On the relationship between r/K selection and environmental carrying capacity: A new habitat templet for plant life history strategies. Oikos 1990, 58, 239–250. [Google Scholar] [CrossRef]
- Pither, J.; Aarssen, L.W. The evolutionary species pool hypothesis and patterns of freshwater diatom diversity along a pH gradient. J. Biogeogr. 2005, 32, 503–513. [Google Scholar] [CrossRef]
- Witkowski, A.; Bąk, M.; Kierzek, A. Zmiany warunków środowiskowych w Holocenie w jeziorze Wigry w świetle analizy diatomologicznej osadów. In Jezioro Wigry Historia Jeziora w Świetle Badań Geologicznych i Paleoekologicznych; Rutkowski, J., Krzysztofiak, L., Eds.; Stowarzyszenie “Człowiek i Przyroda”: Podlaskie, Poland, 2009; pp. 215–226. [Google Scholar]
- Zawisza, E.; Szeroczyńska, K. The development history of Wigry Lake as shown by subfossil Cladocera. Geochronometria 2007, 27, 67–74. [Google Scholar] [CrossRef]
- González-Trujillo, J.D.; Pedraza-Garzón, E.; Donato-Rondon, J.C.; Sabater, S. Ecoregional characteristics drive the distribution patterns of neotropical stream diatoms. J. Phycol. 2020. [Google Scholar] [CrossRef]
- Soininen, J.; Heino, J. Variation in niche parameters along the diversity gradient of unicellular eukaryote assemblages. Protist 2007, 158, 181–191. [Google Scholar] [CrossRef]
- Chen, W.; Wang, Q.; Xia, S.; Pei, G. Comparative responses of dominant and subordinate periphytic diatom species to environmental gradients in Donghu Lake, China. Int. Rev. Hydrobiol. 2016, 101, 182–192. [Google Scholar] [CrossRef]
- MacDougall, M.J.; Paterson, A.M.; Winter, J.G.; Jones, F.C.; Knopf, L.A.; Hall, R.I. Response of periphytic diatom communities to multiple stressors influencing lakes in the Muskoka River watershed, Ontario, Canada. Freshw. Sci. 2017, 36, 77–89. [Google Scholar] [CrossRef]


© 2020 by the authors. Licensee MDPI, Basel, Switzerland. This article is an open access article distributed under the terms and conditions of the Creative Commons Attribution (CC BY) license (http://creativecommons.org/licenses/by/4.0/).