Article

Subtle East–West Phylogeographic Break of Asteropyrum (Ranunculaceae) in Subtropical China and Adjacent Areas

1
Laboratory of Subtropical Biodiversity, Jiangxi Agricultural University, Nanchang 330045, China
2
Research Center of Ecological Sciences, Jiangxi Agricultural University, Nanchang 330045, China
*
Authors to whom correspondence should be addressed.
Diversity 2021, 13(12), 627; https://doi.org/10.3390/d13120627
Submission received: 17 October 2021 / Revised: 23 November 2021 / Accepted: 24 November 2021 / Published: 29 November 2021
(This article belongs to the Special Issue Conservation Genetics and Biogeography of Seed Plant Species)

Abstract

:
East–west phylogeographic break is common among plant species in subtropical China. However, the estimation time of east–west phylogeographic break has always relied on inferences of calibrated phylogenies, and the contribution of environmental heterogeneity to population differentiation has largely been ignored. In this study, we estimated the divergence time of Asteropyrum populations through coalescent-based approaches based on DNA sequences of ten nuclear loci and evaluated the contribution of environmental heterogeneity to population differentiation. The results showed that there were two chloroplast clades and nuclear groups within Asteropyrum, displaying a subtle pattern of east–west differentiation. The divergence time of the two nuclear groups was dated to ~1.2 Ma, which is associated with climate changes during the Mid-Pleistocene transition. A genetic admixture event between the two genetic groups happened at ~0.46 Ma, resulting in several admixed populations. Isolation by environmental distance (IBE) explained the majority (46.32%) of population differentiation, but that isolation by geographic distance (IBD) only contributed 4.66%. The results of this study suggest that climate changes during the Pleistocene may be a major cause for the east–west phylogeographic break in subtropical China. However, the complex terrain and high environmental heterogeneity in the west of subtropical China (and adjacent regions such as the Hengduan Mountains and the Himalayan Moutains) caused by strong geological uplift may have profoundly shaped the population structure of plant species in subtropical China.

1. Introduction

In a milestone paper concerning plant molecular phylogeography in China about one decade ago, the authors encouraged Chinese phylogeographers to explicitly state the time scale to which they refer when interpreting their results with respect to refugial isolation or range expansions [1]. Afterwards, a large number of plant phylogeographic studies have been implemented in China following Qiu’s et al. (2011) recommendation, which has substantially enhanced our understandings of the evolution and biogeographic history of the world’s most diverse temperate flora since the late Cenozoic [2,3,4,5,6,7,8]. For example, using DNA sequences of four chloroplast spacer regions, Sun et al. (2014) found that the time to the most recent common ancestor of all haplotypes in Tetracentron sinense (Trochodendraceae) was 9.6 million years ago (Ma) [9]. The extant distribution of T. sinense is likely to have been shaped by both pre-Quaternary and Pleistocene climate changes. However, the time estimates in most studies have been based on calibrated phylogenies [2,4,5,6,7,9,10,11], which may reflect the divergence history of genes (particularly chloroplast genes) rather than divergence history of populations [12] and thus may compromise the conclusions that have been made. During the last decade, several coalescent-based approaches such as Approximate Bayesian Computation (ABC) [13] and Isolation with Migration (IM) [14] have been developed to infer the population divergence time based on multi-locus or genomic variation, providing powerful arsenals for deciphering population history in a diverse array of organisms.
Subtropical China is located in eastern China between the Qinling Mountains-Huai River line (at ~34° N) and the tropical South (≦22° N), and bordered by the Hengduan Mountains (~98° E) in the west and the coastline in the east [15]. This region has never been directly affected by extensive and unified ice sheets [16], and thus served as one of the most important refuge areas for numerous Cenozoic plant genera [17], constituting one of the most diverse temperate flora in the world. Owing to the uplift of Qianghai-Tibetan Plateau since ~40 Ma [18], the western part of subtropical China is characterized by diverse topography (high plateaus, large mountains and deep gorges) but the eastern part by hills and low plains (0–500 m a.s.l.) [19]. The two parts of subtropical China are controlled by different summer monsoon systems, i.e., the eastern part by the Pacific monsoon and the western part by the Indian monsoon, which are divided approximately along longitude 105° E [20,21]. The distinct terrain and climate in subtropical China, coupled with strong uplift of mountains during the late Cenozoic and climatic oscillations during the (late) Pleistocene, have profoundly shaped the biome of this region. For example, the zonal vegetation of subtropical China is dominated by humid evergreen broad-leaved forests (EBLF) in the east but by semi-moist EBLF in the west [22]. At the species level, many plant species exhibit a pattern of conspicuous east–west phylogeographic break (hereafter EWPB, e.g., Dysosma versipellis [23], Sophora davidii [2], Davidia involucrata [24], Cephalotaxus oliveri [25], and Liriodendron chinense [8,26], also the review in [27]), which has been ascribed to strong geological uplift of the Qinghai-Tibetan Plateau and adjacent regions [24], the development of contrast summer monsoon systems [2], or the cold and dry climate during the glacial periods [23]. However, the time estimates for the population divergence and subsequent population demographic history have been either lacking or dependent on calibrated phylogenies [2,23], which may bias the inferences in those studies.
Population differentiation can be a result of random genetic drift and/or natural selection [28]. The EWPB in subtropical China is generally thought to have resulted from allopatric isolation via genetic drift (coupled with restricted genetic exchange) across complex topography generated by tectonic movements and vegetation changes linked to the Plio-Pleistocene glacial/interglacial cycles [8,23,24]. Such an allopatric model of non-adaptive population differentiation essentially implies that mutation and random genetic drift, rather than habitat-mediated selection, will be the primary factors causing divergence of populations. However, this can be misleading because the substantial differences in their environments (such as different summer monsoon systems [2]) may reduce the rate of successful dispersal and gene flow (isolation by environmental distance, IBE [28,29]), having contributed to population differentiation in subtropical China.
In this study, we selected the genus Asteropyrum J. R. Drummond et Hutchinson in Ranunculaceae as a focal system. Asteropyrum is a small genus of perennial herbs widely distributed in subtropical China and also occurring in Bhutan and north Myanmar [30]. Originally, this genus contains two species: A. cavaleriei (Lévl. et Vant.) Drumm. et Hutch. and A. peltatum (Franch.) Drumm. et Hutch. [31]. By investigating the cytology, palynology, and leaf morphology, Yuan and Yang (2006) proposed that the two species should be treated as two subspecies [30]. Recently, we applied an integrative approach to delimit the species boundary of the genus and found that the two species cannot be differentiated in terms of leaf form, genetics and ecology and even the classification of two subspecies should be abandoned [32]. Asteropyrum always inhabits in humid and shady environments (personal observation) and plants with such ecological requirement may be sensitive to the variation of precipitation that is significant in subtropical China due to the differential influence of two summer monsoon systems [15]. Therefore, Asteropyrum may represent an ideal system to test the roles of historical events and environmental heterogeneity on population differentiation and demography of plant species in subtropical China. The main questions we would like to address in this study are as follows: (i) Does Asteropyrum display a pattern of EWPB? (ii) What are the historical factors related with the population divergence and demography? (iii) Are the geographical isolation and environmental heterogeneity responsible for the population differentiation?

2. Material and Methods

2.1. Population Sampling, DNA Amplification, and Sequencing

A total of 28 populations spanning the entire natural distribution of Asteropyrum were sampled in subtropical region of China and adjacent areas (Figure 1, Supplementary Table S1). One to 10 individuals were collected, spacing at least 10 m apart when the populations were large. All fresh leaves were immediately dried and stored in silica gel. All voucher specimens were deposited at Jiangxi Agricultural University.
Total genomic DNA was extracted from dried and healthy leaves using a modified cetyltrime-thylammonium bromide (CTAB) method [33]. Ten single-copy nuclear DNA (nDNA) loci developed from transcriptome sequences of Asteropyrum previously [32] and one chloroplast region (cpDNA, psbA-trnH) were amplified and sequenced (Table 1). Polymerase chain reactions (PCRs) were performed in a 20 μL volume containing 10 μL 2 × Taq PCR MasterMix (Tiangen, Shanghai, China), 7 μL ddH2O, 1 μL template DNA (c. 50–100 ng), and 1 μL each primer (5 μM). All reactions were carried out in a Bioer XP cycler (Bioer, Hangzhou, China) programmed for an initial step for 5 min at 94 °C, followed by 36 cycles of 94 °C for 50 s, 50–53 °C for 50 s, and 72 °C for 1 min or 1.5 min, with a final extension for 10 min at 72 °C. The PCR products were checked on 1% agarose gel and then were directly sequenced with the corresponding PCR primers in both directions commercially by Sangon Biotech Co., Ltd. (Shanghai, China). The haplotype phases of ten nuclear sequences were determined by applying the phase algorithm in DnaSP 5.10. Then, DNA sequences were edited with Sequencher 4.1.4 (Gene Codes Corporation, Ann Arbor, MI, USA), aligned by BioEdit 7.2 [34], and finally adjusted manually in MEGA v. 5.05 [35]. All obtained sequences were deposited into GenBank database with accession numbers (MV033551-MV033560, OL871580-OL871750, OL901373-OL901434).

2.2. Population Genetic Analyses

To measure the level of genetic variation, the number of segregating sites (S), nucleotide diversity (π), the number of haplotypes (Nh), and haplotype diversity (Nd) were calculated for cpDNA and each nuclear locus in DnaSP v5.10 [36]. For cpDNA dataset, a median-joining network was constructed to view intraspecific relationships of cpDNA haplotypes (chlorotypes) by coalescent simulations in Network 10.3 (https://www.fluxus-engineering.com/sharenet.htm (accessed on 25 November 2021)) and the geographic distribution of chlorotypes were displayed on the relief map of China using ArcGIS 10.7 (ESRI, Inc., Redlands, CA, USA, Figure 1).
For the nuclear dataset, eight loci were used to infer population structure owing to the difficulty of amplification and sequencing of two loci (X17 and X125). We assessed population genetic structure under an admixture model using the Bayesian method in Structure 2.3.4 [37]. Segregating sites with significant linkage disequilibrium were excluded from this analysis. The number of clusters (K) ranged from 1 to 10 using 20 independent runs for each value of K. Burn-in was set to 20,000 generations and Markov chain Monte Carlo (MCMC) run length to 200,000. The optimal K was estimated using ΔK statistics [38] implemented in Structure Harvester [39]. The population clusters were visualized by the program Distruct 1.1 [40]. The amount of variation among groups (Group_1 and Group_2), population within groups and within populations were calculated by the analysis of molecular variance (AMOVA) performed in Arlequin 3.01 [41].

2.3. Population Divergence and Demographic Analyses

The Approximate Bayesian Computational (ABC) approach was used to decipher the divergence time, historical demography, and genetic admixture event among different population groups of Asteropyrum. The cpDNA sequences were not included in these analyses because of their low variation. Three groups (Group_1, N1; Group_2, N2; and mixed populations, N3) were set based on above-mentioned structure analysis. We tested five alternative scenarios (Figure 2) to estimate the origin of N3 with ten nuclear loci using DIYABC 2.1.0 [42]. In the first model, N1, N2, and N3 derived from an ancestral population at the same time (T2), and the next three scenarios modeled the possible hypotheses about the divergence patterns among the three groups. In the last model, N3 was formed from a genetic admixture event between N1 and N2 at time T1. We gave a uniform prior probability and ran 106 simulations for each scenario, of which 10% was used to estimate the relative posterior probability with 95% confidence intervals via logistic regression and posterior parameter distribution (Supplementary Figure S1, Table S2) according to the most likely scenario [43]. The time parameters were calculated in generations and converted into years by considering generation time, which was set to 1 year based on filed observation.
In addition, we also used isolation with a migration (IM) model [14,44] to estimate divergence time and gene flow among genetic groups. The demographic parameters including effective population size (θ), divergence time (t), and migration rate (m) between two groups of Asteropyrum were estimated using MCMC coalescent simulation implemented in IMa2 software [14,45]. We ran 6 × 10⁶ simulations with a burn-in of 10% under the HKY mutation model for each of the ten loci. These parameters from IM model were further scaled by a mean mutation rate. Initially, two rates (3.46 × 10⁻⁹ or 8.69 × 10⁻⁹ per site per year (s/s/y)) were adopted to estimate lineage divergence according to the range of substitution rate of herbaceous angiosperms [46,47]. However, because the former rate is close to the result in ABC simulation (3.30–3.47 × 10⁻⁹ s/s/y), we finally chose this rate (3.46 × 10⁻⁹ s/s/y) to scale the divergence time and population demographic parameters. We also applied the coalescence-based skyline-plot method (i.e., Bayesian skyline plot (BSP)) to infer population size change over time using BEAST v1.10.4 software [48] and visualized the results using Tracer v1.7.1 program [49].

2.4. Isolation by Distance and Isolation by Environment

To understand the effect of geographic distance and environmental heterogeneity on spatial genetic variation, we quantified the contributions of isolation by geographic distance (IBD) and isolation by environmental distance (IBE) to genetic distance using multiple matrix regression with randomization (MMRR) function in R [29]. In the case of MMRR, three distance matrices of genetic, geographic, and environmental are needed. The genetic distance (Fst) among each pair of populations was regarded as the response variable (Y), and geographic (X1) and environmental distances (X2) were used as explanatory variables. First, 19 bioclimatic variables of each population were extracted from WorldClim dataset (current climatic data; http://www.worldclim.org (accessed on 25 November 2021)) with 30 arc-second resolution using DIVA GIS [50]. An environmental distance matrix was constructed based on Euclidean distances of pairwise populations using IBM SPSS Statistics 22 (IBM, New York, NY, USA). Next, we calculated the genetic and geographical distances using Arlequin 3.01 and GenAlEx 6.5, respectively [51]. The regression coefficients between genetic distance and geographic distance (βD)/environmental distance (βE) and their significance values (P) were obtained after standardizing the three distance matrices using R software. Finally, the average values of 19 bioclimatic variables and elevation between the two genetic groups were compared by two-tailed t tests with IBM SPSS Statistics 22.

3. Results

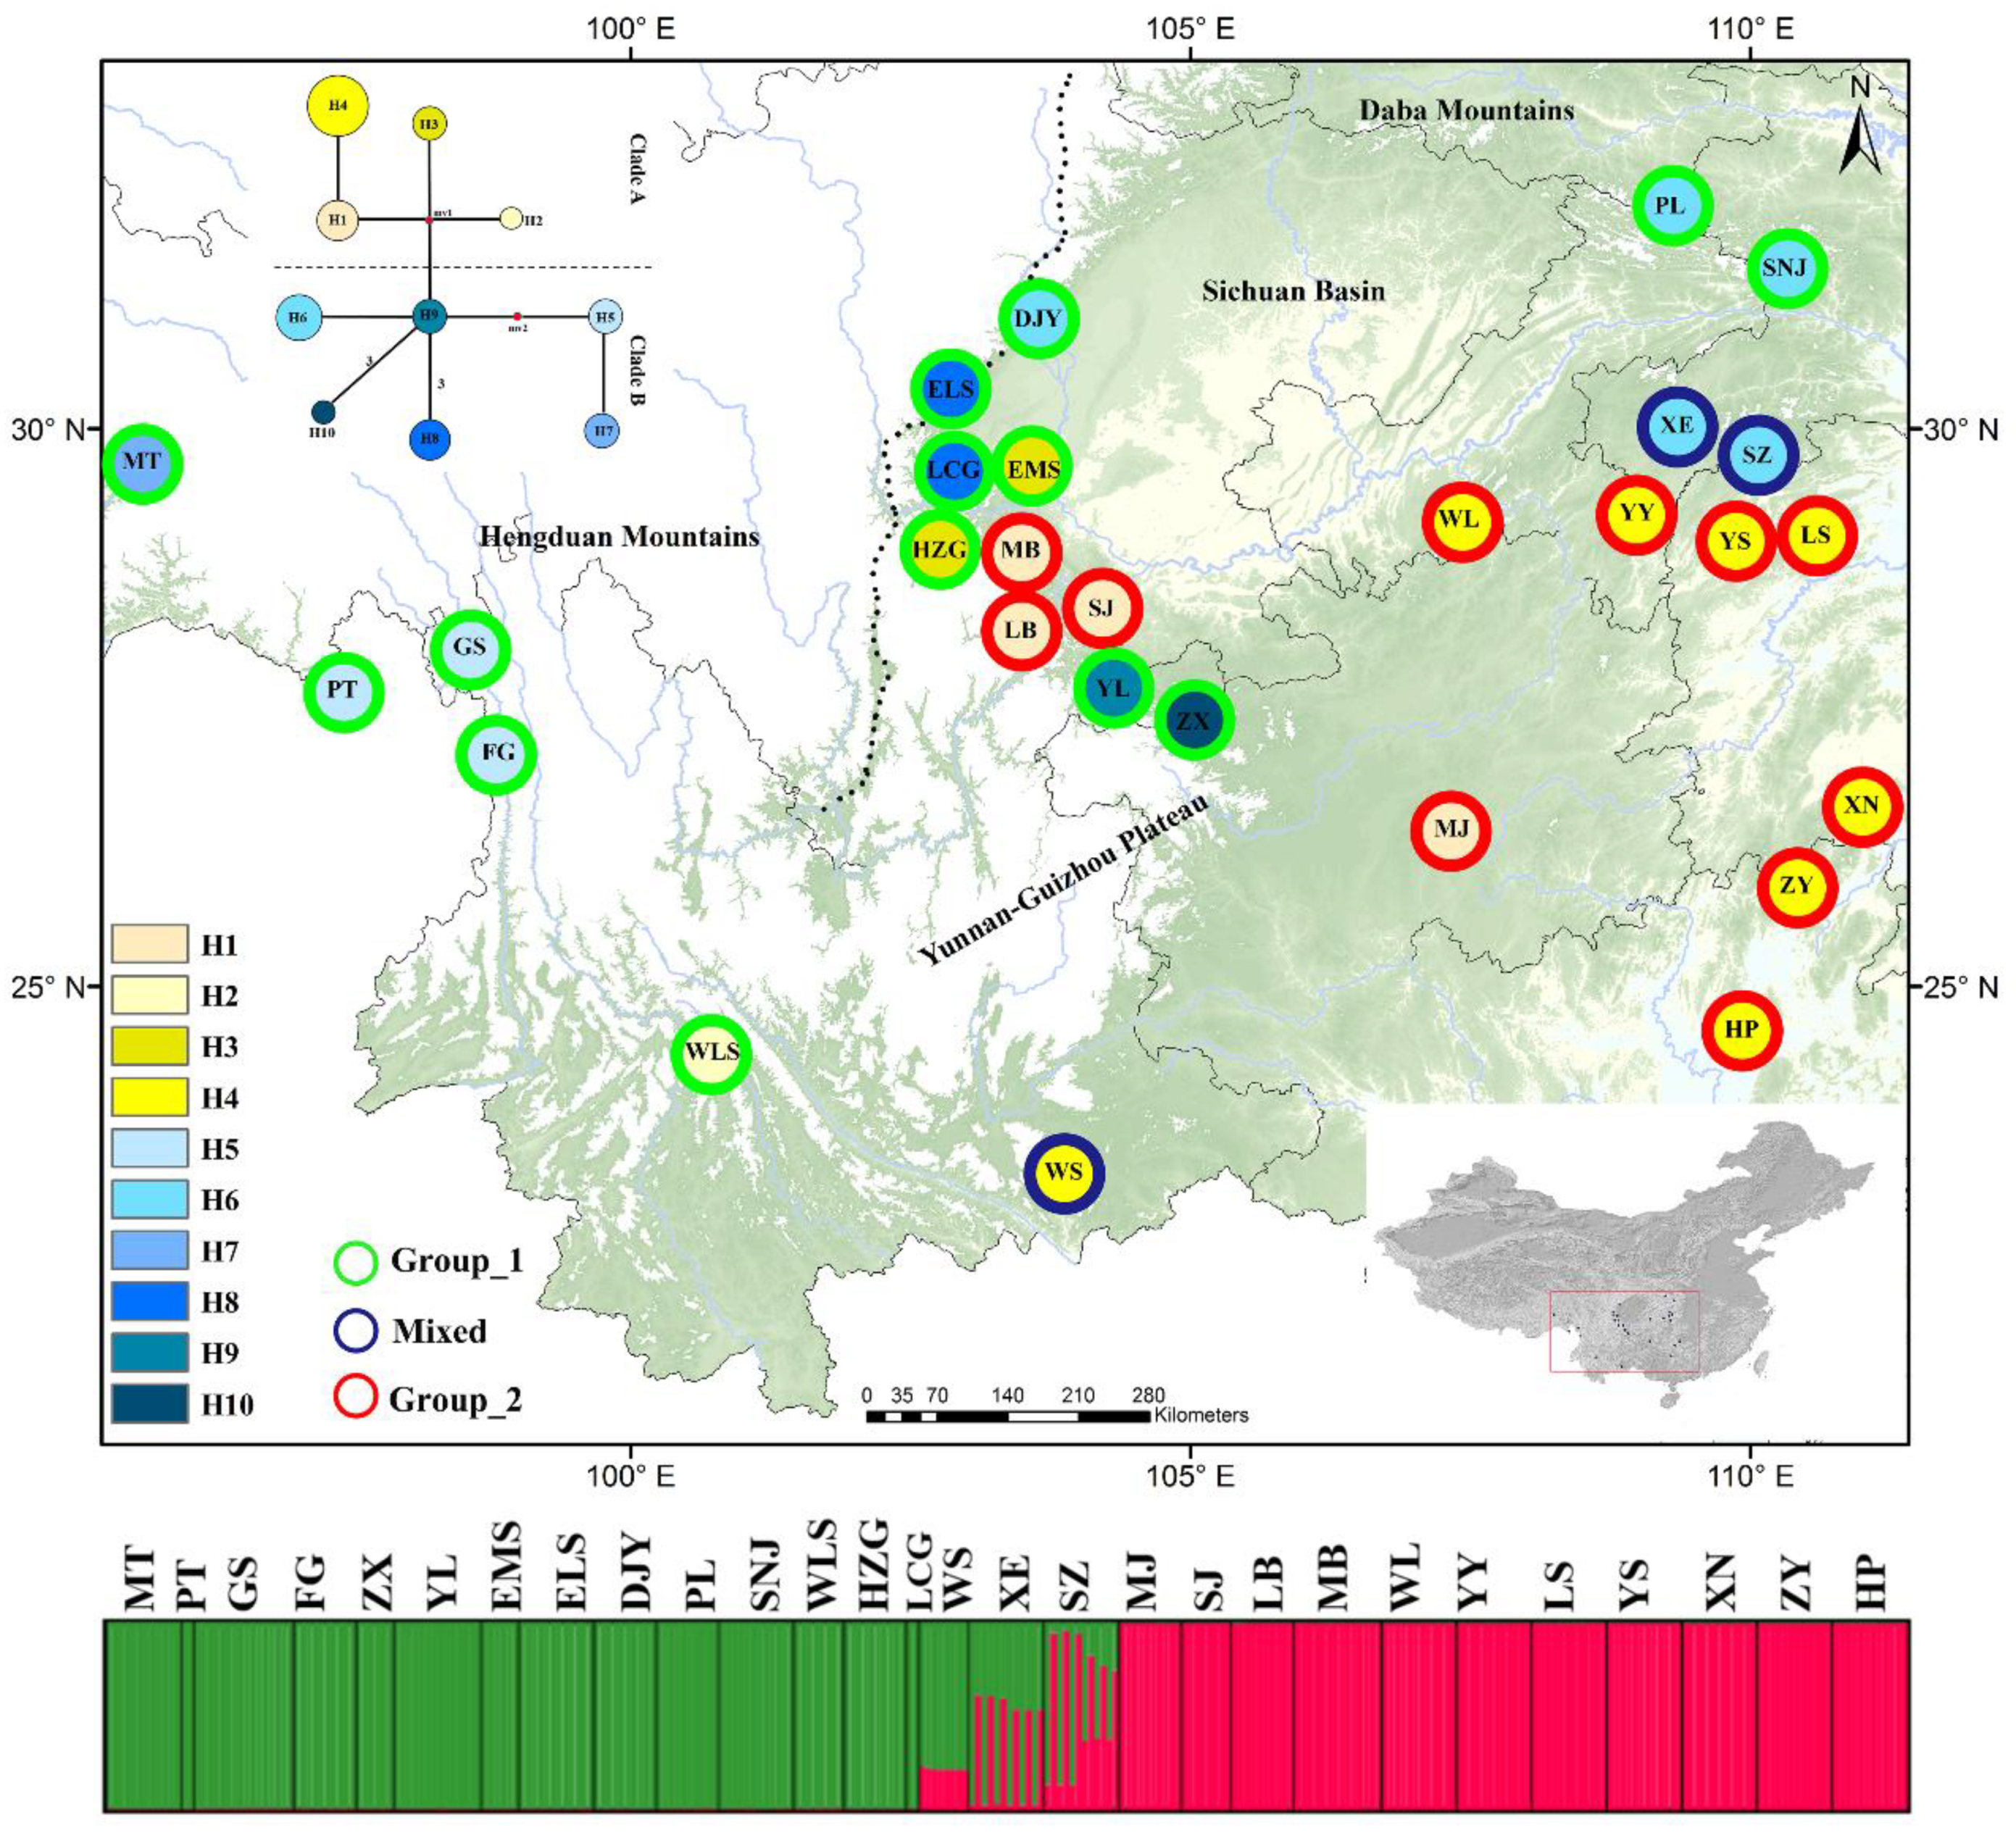
3.1. Sequence Variation and Distribution of cpDNA Haplotypes

We obtained 219 bp cpDNA sequences across the 323 individuals of 28 populations of Asteropyrum. At the species level, nucleotide diversity (π) and haplotype diversity (Hd) were high with values of 0.011 and 0.849, respectively (Table 1). Genetic differentiation was one owing to monomorphism in each population, which was not shown in this study. A total of 10 chlorotypes were identified by 13 polymorphic sites (Supplementary Table S3). The phylogenetic network can be divided into two clades: Clade A includes H1 to H4, while the others belonged to Clade B. Haplotypes of Clade A were largely distributed in east and southeast of the range. Most haplotypes of Clade B were distributed in the west and southwest, however, some central (YL and ZX) and northeastern populations (PL, SNJ, XE, and SZ) were also featured by haplotypes of Clade B.
Of the 10 chlorotypes, six were shared by at least two populations, while the other four (H2, H7, H9, and H10) were only found in a single population (WLS, MT, YL, and ZX, respectively) (Figure 1). The most common chlorotypes were H4 (found in eight populations and 84 individuals) and H6 (found in five populations and 54 individuals), and all the populations were monomorphic (Figure 1).

3.2. Population Diversity and Structure for Nuclear DNA

The length of ten nuclear DNA sequences ranged from 206 to 432 bp, and basic population genetic parameters for each locus were summarized in Table 1. Within-population nucleotide diversity (π) per locus ranged from 0.004 (X63) to 0.017 (X47) and haplotype diversity (Hd) from 0.780 (X130) to 0.953 (X17). All the nuclear loci did not deviate strongly from the neutral model except for X125. The minimum number of recombination events were also detected for all loci, ranging from zero to seven. Given the difficulty of amplification and sequencing and results of neutral test of X17 and X125, eight low-copy nuclear genes were jointed for 144 individuals from 28 populations. The aligned matrix was 2687 bp in length, with 121 variable nucleotide sites after excluding sites in significant linkage disequilibrium and recombinant nucleotides. Genetic diversity at species was very high (π = 0.007; Hd = 0.988, Table 2).
The STRUCTURE analysis indicated that the most likely number of genetic groups was K = 2 (Figure 1). Consistent with the distribution of two chloroplast clades, Group_2 (N2) was distributed in the east and southeast of the range, while Group_1 (N1) in the west and southwest but extending to the central (YL and ZX) and northeastern parts (PL and SNJ) of the range. Meanwhile, three populations (WS, XE, and SZ) showed signals of genetic admixture, and therefore were defined as N3. The AMOVA analysis revealed significant genetic differentiation (Fst = 0.334, p < 0.001), with 0.18% of the variation partitioned among groups, 33.36% among populations within groups, and 66.46% within populations (Table 3).

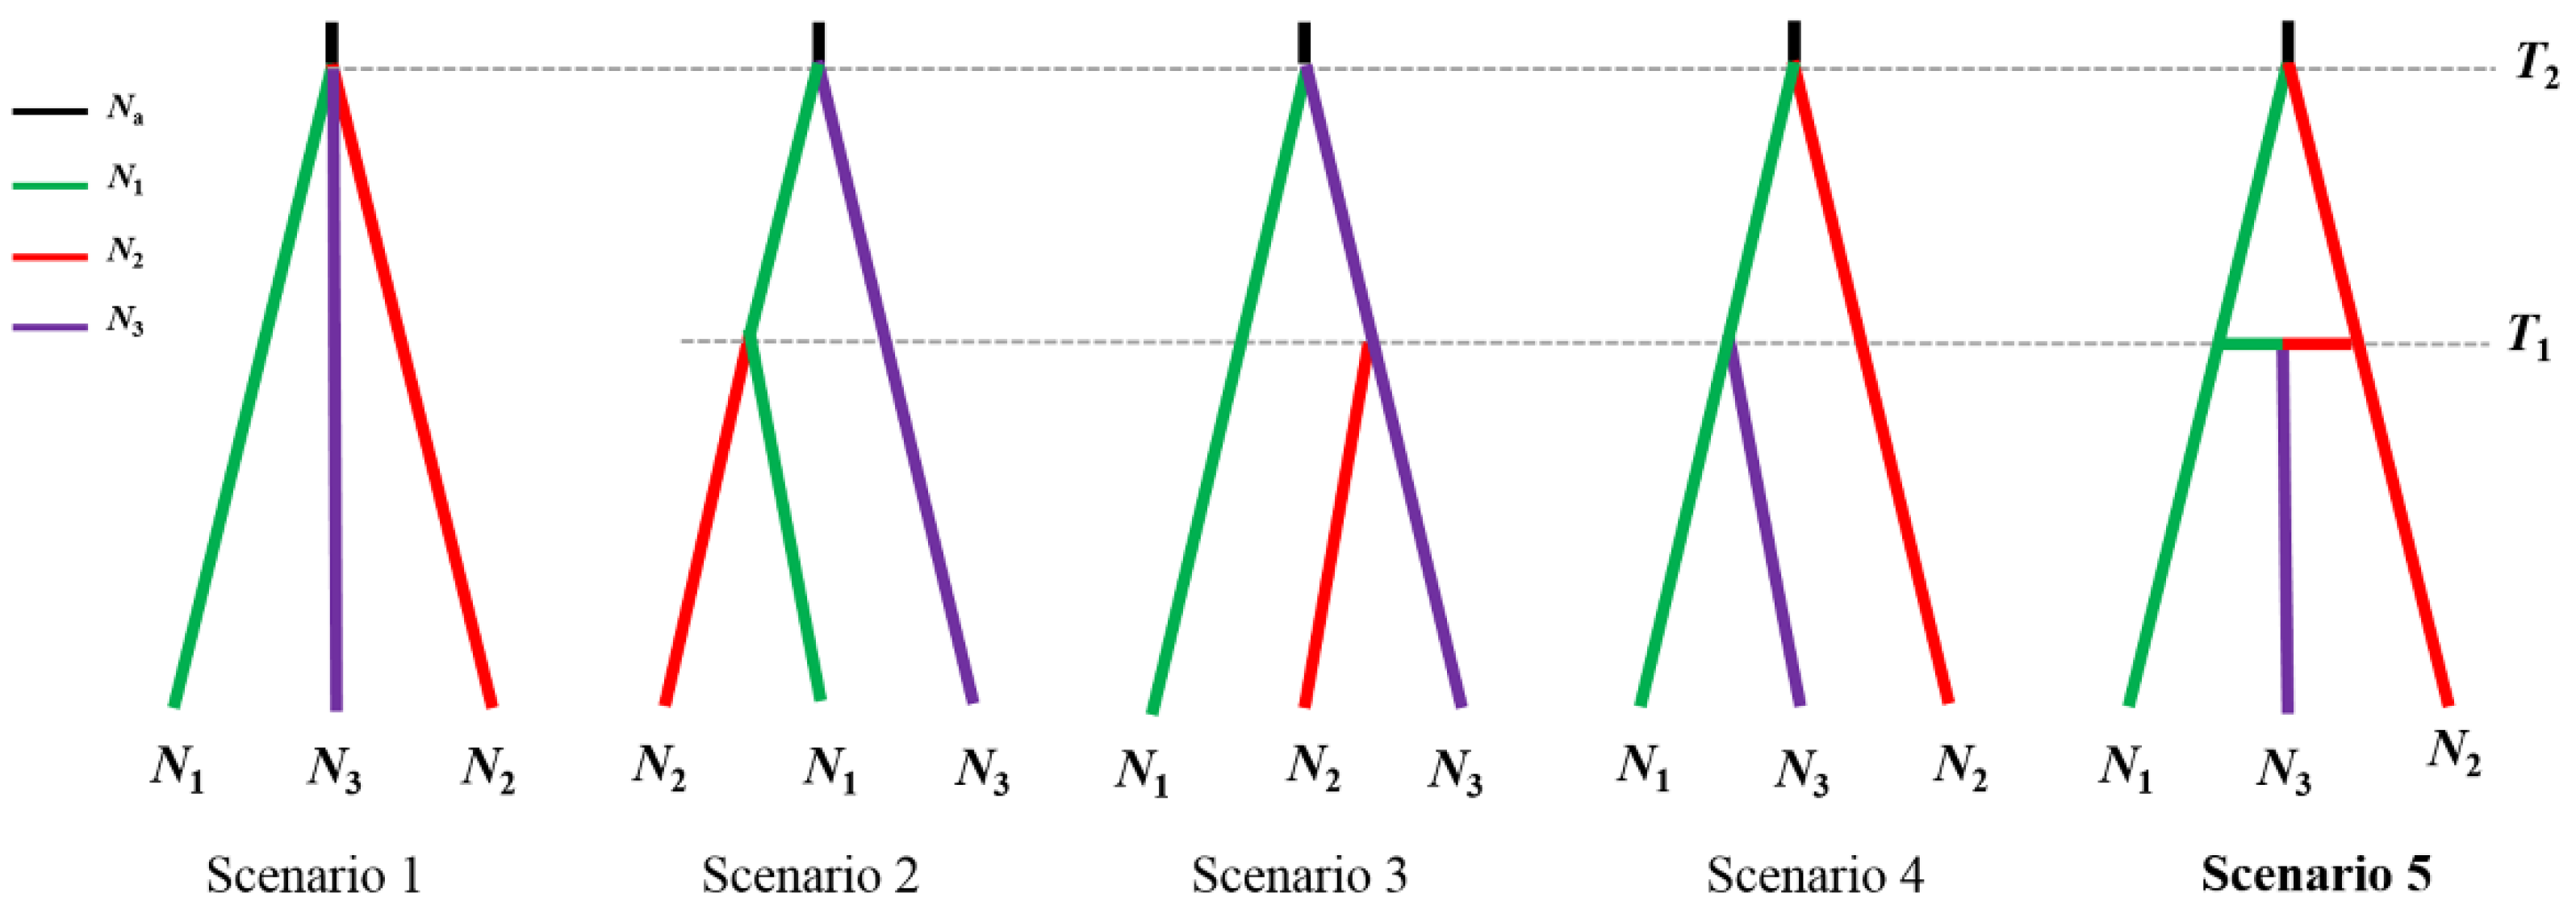
3.3. Population Divergence and Demographic History

The ABC results showed that the model that N3 derived from historical admixture between N1 and N2 provided the best fit to our observed data (Scenario 5, 73.33% posterior probability, Figure 2). Posterior parameter estimates for Scenario 5 indicated that N1 and N2 diverged from each other at 1.23 Ma (95% HPD: 0.48–1.90 Ma), followed by a genetic admixture c. 0.47 Ma (Table 4). In addition, these simulated results showed that N1 and N2 have experienced slight population expansion, which was supported by the results of Bayesian skyline analysis (Figure 3). Both ABC simulations suggested the average substitution rate of nuclear sequences is close to the general rate of 3.46 × 10⁻⁹ s/s/y for herbaceous angiosperms [46].
The mixed group (N3) was excluded from isolation with migration (IM) analysis. IM analysis found that migration rate between N1 and N2 was asymmetric, with much higher gene flow from N1 to N2 (2Nm = 0.122) than the reverse direction (2Nm = 0.059). The divergence time between them was ~1.2 Ma (95% HPD: 0.89–1.51 Ma) (Table 5; Figure 4), which is almost identical with that estimated by ABC modeling. Effective population sizes in N1 and N2 were larger than ancestral population size (Na), consistent with the results of ABC modelling and Bayesian skyline analysis (Table 5, Figure 4).

3.4. Effects of IBD and IBE on Population Divergence

The regression coefficient of environmental distances (βE = 0.463, p = 0.013) was about one order of magnitude greater than that of geographic distance (βD = 0.046, p = 0.766), indicating that IBE has much greater contribution than IBD does. Out of 19 bioclimatic variables, nine variables (bio3: isothermality, bio4: temperature seasonality, bio5: max temperature of warmest month, bio7: temperature annual range, bio10: mean temperature of warmest quarter, bio14: precipitation of driest month, bio15: precipitation seasonality, bio17: precipitation of driest quarter, bio19: precipitation of coldest quarter) showed significant differences between the two genetic groups (Supplementary Table S4). Bio14, bio15, and bio17 exhibited the highest significance level (p < 0.001), followed by bio4 and bio19 (p < 0.01), and the remaining four with p < 0.05. In addition, there was also significant difference in elevation between the two groups, with mean elevation 943 m higher in Group_1 than in Group_2.

4. Discussion

4.1. Subtle East–West Differentiation in Asteropyrum

Due to different geological history, the development of contrast monsoon systems, or the cold and dry climate during the glacial periods, distinct east–west phylogeographic breaks (EWPBs) have been observed in an array of plant species [2,8,23,24,25,26,27]. In this study, we also detected two distinct clades using chloroplast DNA and two genetic groups using DNA sequences of multiple nuclear loci. Populations of Clade A are distributed in the east and southeast, while most populations of Clade B in the west and southwest. The two nuclear groups have similar pattern, most populations of Group_1 are located in the west and southwest while those of Group_2 in the east and southeast.
However, it is clear that the two clades/groups are not strictly associated with geography. For example, in the center of the range, several populations (MB, SJ, LB, YL, and ZX) belonging to different chloroplast and nuclear clades/groups intertwine together. Four populations (PL, SNJ, XE, and SZ) of Clade B extend to the northeast. In addition, three populations (XE, SZ, and WS) display genetic admixture between the two nuclear groups. This subtle east–west differentiation pattern, on the one hand, is largely consistent with an emerging east–west differentiation pattern that has been observed in many plant species in subtropical China. On the other hand, this pattern reflects the fact that different plant species may have responded to historical events idiosyncratically [52] and a diverse of plant species with various evolutionary trajectories should be investigated to fully understand the evolutionary history of plant species in subtropical China.

4.2. Historical Factors Responsible for Population Differentiation

In this study, we found a subtle EWPB in Asteropyrum that happened during the Mid-Pleistocene (MPT; 0.8–1.2 Ma) [53]. The time estimates (ABC: 1.23 Ma; IMa: 1.2 Ma) are very close to the divergence time of two chloroplast clades in Sophora davidii (1.28 Ma). However, we believe that our estimate could be more robust to stochastic errors because this study used two coalescent-based approaches that account for stochasticity of gene trees [12] and the results of two approaches are almost identical, although they rely on different philosophies (a mutation rate for sequences is needed for parameter estimation in IMa analysis, but not in ABC modelling [14,44,54]).
Pleistocene glaciations have been the most frequently quoted factors responsible for demographic dynamics and genetic differentiation in subtropical China [1]. For example, Qiu et al. (2009) detected an east–west differentiation (likely incipient speciation) in Dysosma versipellis based on cpDNA sequences along the line of 105° E since ~0.48 Ma, which was interpreted as a consequence of cold and dry climate in central China (glaciation-driven hypothesis) [23]. On the contrary, Fan et al. (2013) ascribed an EWPB (~1.28 Ma) observed in Sophora davidii to the establishment of presently differing monsoon regimes on either side of Tanaka-Kaiyong Line (extending from c. 33° N/102° E to 19° N/108° E, see Figure 1 for Kaiyong Line) during the (late) Pleistocene (monsoon-driven hypothesis) [2]. They also proposed that the Tanaka-Kaiyong Line is a climatically-driven barrier to present-day plant dispersal. The third hypothesis is related to the uplift of Yungui Plateau and Qianghai-Tibetan Plateau. In Cephalotaxus oliveri, Wang et al. (2014) also found a EWPB in cpDNA; however, the two cpDNA groups (Yungui and Hunan-Hubei groups) diverged at ~9.15 Ma, which is associated with the rapid uplift of Yungui Plateau during 8–10 Ma (plateau uplift-driven hypothesis) [25].
Based on our time estimates, we can reject the plateau uplift-driven hypothesis directly because even the most recent rapid uplift of Qinghai-Tibetan Plateau (between the late Miocene and late Pliocene [55,56] greatly predates the east–west divergence of Asteropyrum. For the remaining two hypotheses, we favor the glaciation-driven hypothesis over the monsoon-driven hypothesis for two reasons. First, although changes in the strength of monsoon during the Pleistocene have been reported in many studies [57], the initiation and development of monsoon system in East Asia predate substantially the onset of the Pleistocene [58,59,60]. Therefore, the population divergence of Asteropyrum is unlikely to be the result of the establishment of presently differing monsoon regimes (i.e., Pacific monsoon and Indian Monsoon) during the Pleistocene as suggested by Fan et al. (2013). Second, the Mid-Pleistocene climate transition (MPT; 0.8–1.2 Ma) [53] is an important period marked by an increase in the severity of glaciations and the emergence of the ~100-kyr glacial cycles [55]. In coincidence, the earliest moraine was reported on the QTP at the beginning of MPT [61], which was assumed to be the earliest glaciation in China [62]. Palaeoecological studies suggested that central China and adjacent regions to the southwest (between 20° to 30° N and around 105° to 120° E), which today harbor subtropical evergreen forests interspersed with warm temperate deciduous forests, had been displaced by temperate deciduous to mixed temperate and boreal forest vegetation or no forest vegetation at all during the Pleistocene glacial periods [63,64]. Therefore, it is very likely that cold and dry climate during the earliest glacial period could have expelled the populations of Asteropyrum and other floristic components in subtropical China to east and west refugia and then initiated genetic differentiation among refugia. However, we should bear in mind that the monsoons (particularly winter monsoon) and the Pleistocene glaciations have interacted with each other during the glacial periods [65], and they could have shaped the biome of subtropical China in combination. The categorization of glaciation-driven and monsoon-driven hypotheses might be arbitrary.

4.3. Demographic History and Population Genetic Admixture

In this study, we found that both groups of Asteropyrum had experienced gradual demographic expansions, with their effective population sizes (Ne) much larger than that of their ancestral populations. In addition, an admixture event was dated to 0.46 Ma, which led to several admixed populations (WS, XE, and SZ). Thus, our results contradict the notion of limited demographic expansion and population genetic admixture of temperate plant species due to both glacial and interglacial isolation in subtropical China in old literature [23,66,67,68,69]. In contrast, our results support the conclusion that the early generalization is premature possibly because early works have biased toward endangered species with narrow distribution [3]. To our knowledge, distinct east–west divergence in subtropical has been mostly observed in endangered plants with fragmented populations, such as Dysosma versipellis [23], Davidia involucrata [24], and Liriodendron chinense [8,26]. In such plant species, genetic differentiation may be strong due to genetic drift in fragmented and isolated populations. In contrast, for widespread species such as Asteropyrum, range expansion could have enhanced genetic admixture among populations as observed in ABC modeling, resulting in much less distinct east–west divergence.
Note that the time estimate of the genetic admixture event in Asteropyrum corresponds to an interglacial between 500 and 460 ka (the Large Interglacial [62]). It is most likely that populations of the west group might have experienced demographic expansion and migrated along the Daba Mountains during the Large Interglacial, and then met populations of the east group in the Three-Gorge Area. This dispersal event can be evidenced by the genetic components of XE and SZ, both populations possessing the chlorotype (H6) of Clade B. Interestingly, two adjacent populations (PL and SNJ) have both the west chloroplast and nuclear types, clearly indicating a dispersal route along the Daba Mountains. In contrast to the eastward dispersal of PL and SNJ, WS might be the result of westward dispersal and genetic admixture, because it has a Clade A haplotype (H4).

4.4. The Relative Contribution of Geographical Isolation and Environmental Heterogeneity to Population Differentiation

Geography and environment represent two key landscape components that can potentially influence gene flow and population differentiation [28]. In this study, MMRR analysis found significant IBE but non-significant effect of IBD on genetic divergence. Significant differences in nine bioclimatic variables and elevation between two genetic groups further suggest that environmental heterogeneity have substantial contribution to population differentiation of Asteropyrum. In Emmenopterys henryi, a temperate tree species with similar distribution to Asteropyrum, significant contribution of environment to genetic divergence was also revealed [70]. However, the study found that IBE is more important in Asteropyrum (βE = 0.463, βD = 0.046) than in Emmenopterys henryi (βE = 0.181, βD = 0.360), suggesting environmental heterogeneity is stronger in the former than in the later. This is reasonable because a few populations of Asteropyrum extend to the Hengduan Mountains, a region with extreme topographic relief and climatic diversity [71]. Recently, the effects of ecology in population divergence in subtropical China have received increasing attention because of high environmental heterogeneity in this region [7,70,72]. Nonetheless, more attempts are needed to fully disentangle the relative roles of geography and ecology in driving population divergence in subtropical China.

Supplementary Materials

The following are available online at https://www.mdpi.com/article/10.3390/d13120627/s1, Figure S1: Prior and posterior distributions of demographic parameters under scenario 5 in Figure 2 estimated using DIYABC. Table S1: Sample information of Asteropyrum. Table S2: Description of the prior distribution of parameters from five scenarios in Figure 2 used in Approximate Bayesian Computation. Table S3: Variable sites of the psbA-trnH sequences for each of the haplotypes identified in Asteropyrum. Table S4: Results of t-tests on elevation and 19 bioclimatic variables between the two groups of Asteropyrum.

Author Contributions

Z.Z. and Y.K. designed the project and conducted the analysis. W.Z., H.L. and Y.Y. collected the materials and conducted the lab work. D.F. provided suggestions to data analysis. S.C. performed the analysis. Z.Z. and S.C. wrote the manuscript. All authors have read and agreed to the published version of the manuscript.

Funding

This research was funded by grants from the National Natural Science Foundation of China (Nos. 31560064, 31960049 and 31860167) and Training Program for Academic and Technical Leaders (leading talents) in Major Disciplines of Jiangxi Province.

Institutional Review Board Statement

Not applicable.

Data Availability Statement

The data presented in the study are depositing in the NCBI repository, accession numbers: MV033551-MV033560, OL871580-OL871750, OL901373-OL901434.

Acknowledgments

The authors are grateful to the people (too many to be mentioned here) who helped us in the field. Special thanks go to Jie Cai and Xiaohua Jin for giving the samples from Himalaya Mountains and Gansu Province, respectively.

Conflicts of Interest

The authors declare no conflict of interest.

References

  1. Qiu, Y.X.; Fu, C.X.; Comes, H.P. Plant molecular phylogeography in China and adjacent regions: Tracing the genetic imprints of Quaternary climate and environmental change in the world’s most diverse temperate flora. Mol. Phylogenet. Evol. 2011, 59, 225–244. [Google Scholar] [CrossRef]
  2. Fan, D.M.; Yue, J.; Nie, Z.; Li, Z.; Comes, H.P.; Sun, H. Phylogeography of Sophora davidii (Leguminosae) across the ‘Tanaka-Kaiyong Line’, an important phytogeographic boundary in southwest China. Mol. Ecol. 2013, 22, 4270–4288. [Google Scholar] [CrossRef]
  3. Tian, S.; Lei, S.Q.; Hu, W.; Deng, L.L.; Li, B.; Meng, Q.L.; Soltis, D.S.; Soltis, P.S.; Fan, D.M.; Zhang, Z.Y. Repeated range expansions and inter-/postglacial recolonization routes of Sargentodoxa cuneata (Oliv.) Rehd. et Wils. (Lardizabalaceae) in subtropical China revealed by chloroplast phylogeography. Mol. Phylogenet. Evol. 2015, 85, 238–246. [Google Scholar] [CrossRef] [PubMed]
  4. Zhang, J.; Li, Z.; Fritsch, P.W.; Tian, H.; Yang, A.; Yao, X. Phylogeography and genetic structure of a Tertiary relict tree species, Tapiscia sinensis (Tapisciaceae): Implications for conservation. Ann. Bot. 2015, 116, 727–737. [Google Scholar] [CrossRef] [Green Version]
  5. Ye, J.; Li, D.; Hampe, A. Differential Quaternary dynamics of evergreen broadleaved forests in subtropical China revealed by phylogeography of Lindera aggregate (Lauraceae). J. Biogeogr. 2019, 46, 1112–1123. [Google Scholar] [CrossRef]
  6. Kou, Y.X.; Cheng, S.M.; Tian, S.; Li, B.; Fan, D.M.; Chen, Y.; Soltis, D.E.; Soltis, P.S.; Zhang, Z.Y. The antiquity of Cyclocarya paliurus (Juglandaceae) provides new insights into the evolution of relict plants in subtropical China since the late Early Miocene. J. Biogeogr. 2015, 43, 351–360. [Google Scholar] [CrossRef]
  7. Kou, Y.X.; Zhang, L.; Fan, D.M.; Cheng, S.M.; Li, D.; Hodel, R.G.J.; Zhang, Z.Y. Evolutionary history of a relict conifer, Pseudotaxus chienii (Taxaceae), in southeast China during the late Neogene: Old lineage, young populations. Ann. Bot. 2020, 125, 105–117. [Google Scholar] [CrossRef]
  8. Zhong, Y.; Yang, A.; Liu, S.; Liu, L.; Li, Y.; Wu, Z.; Yu, F. RAD-Seq data point to a distinct split in Liriodendron (Magnoliaceae) and obvious east–west genetic divergence in L. chinense. Forests 2018, 10, 13. [Google Scholar] [CrossRef] [Green Version]
  9. Sun, Y.; Moore, M.; Yue, L.; Feng, T.; Chu, H.; Chen, S.; Ji, Y.; Wang, H.; Li, J. Chloroplast phylogeography of the East Asian Arcto-Tertiary relict Tetracentron sinense (Trochodendraceae). J. Biogeogr. 2014, 41, 1721–1732. [Google Scholar] [CrossRef]
  10. Wang, Y.H.; Jiang, W.W.; Comes, H.P.; Hu, F.S.; Qiu, Y.X.; Fu, C.X. Molecular phylogeography and ecological niche modelling of a widespread herbaceous climber, Tetrastigma hemsleyanum (Vitaceae): Insights into Plio-Pleistocene range dynamics of evergreen forest in subtropical China. New Phytol. 2015, 206, 852–867. [Google Scholar] [CrossRef]
  11. Fan, L.; Zheng, H.; Milne, R.I.; Zhang, L.; Mao, K. Strong population bottleneck and repeated demographic expansions of Populus adenopoda (Salicaceae) in subtropical China. Ann. Bot. 2018, 121, 665–679. [Google Scholar] [CrossRef] [Green Version]
  12. Edwards, S.; Beerli, P. Perspective: Gene divergence, population divergence, and the variance in coalescence time in phylogeographic studies. Evolution 2000, 54, 1839–1854. [Google Scholar] [CrossRef]
  13. Csilléry, K.; Blum, M.G.; Gaggiotti, O.E.; François, O. Approximate Bayesian Computation (ABC) in practice. Trends Ecol. Evol. 2010, 25, 410–418. [Google Scholar] [CrossRef] [PubMed]
  14. Hey, J. Isolation with migration models for more than two populations. Mol. Biol. Evol. 2009, 27, 905–920. [Google Scholar] [CrossRef] [PubMed] [Green Version]
  15. Ma, L.J.C.; Zhao, S. Physical Geography of China; Science Press: Beijing, China, 1986. [Google Scholar]
  16. Shi, Y.; Ren, B.; Wang, J.; Derbyshire, E. Quaternary glaciation in China. Quat. Sci. Rev. 1986, 5, 503–507. [Google Scholar] [CrossRef]
  17. Wu, Z.Y.; Wang, X.; Liu, F.; Zhou, F. Vegetation of China; Science Press: Beijing, China, 1980. [Google Scholar]
  18. Favre, A.; Päckert, M.; Pauls, S.U.; Jähnig, S.C.; Uhl, D.; Michalak, I.; Muellner-Riehl, A.N. The role of the uplift of the Qinghai-Tibetan Plateau for the evolution of Tibetan biotas. Biol. Rev. 2014, 90, 236–253. [Google Scholar] [CrossRef]
  19. Chen, F.; Fu, B.; Xia, J.; Wu, D.; Wu, S.; Zhang, Y.; Sun, H.; Liu, Y.; Fang, X.; Qin, B.; et al. Major advances in studies of the physical geography and living environment of China during the past 70 years and future prospects. Sci. China Earth Sci. 2019, 62, 1665–1701. [Google Scholar] [CrossRef]
  20. Wang, B.; Clemens, S.C.; Liu, P. Contrasting the Indian and East Asian monsoons: Implications on geologic timescales. Mar. Geol. 2003, 201, 5–21. [Google Scholar] [CrossRef] [Green Version]
  21. Wang, P.; Clemens, S.; Beaufort, L.; Braconnot, P.; Ganssen, G.; Jian, Z.; Kershaw, P.; Sarnthein, M. Evolution and variability of the Asian monsoon system: State of the art and outstanding issues. Quat. Sci. Rev. 2005, 24, 595–629. [Google Scholar] [CrossRef]
  22. Song, Y.C. The essential characteristics and main types of the broadleaved evergreen forest in China. Phytocoenologia 1988, 16, 105–123. [Google Scholar]
  23. Qiu, Y.-X.; Guan, B.-C.; Fu, C.-X.; Comes, H.P. Did glacials and/or interglacials promote allopatric incipient speciation in East Asian temperate plants? Phylogeographic and coalescent analyses on refugial isolation and divergence in Dysosma versipellis. Mol. Phylogenet. Evol. 2009, 51, 281–293. [Google Scholar] [CrossRef]
  24. Chen, J.M.; Zhao, S.Y.; Liao, Y.Y.; Gichira, A.W.; Gituru, R.W.; Wang, Q.F. Chloroplast DNA phylogeographic analysis reveals significant spatial genetic structure of the relictual tree Davidia involucrata (Davidiaceae). Conserv. Genet. 2014, 16, 583–593. [Google Scholar] [CrossRef]
  25. Wang, C.; Wang, T.; Su, Y. Phylogeography of Cephalotaxus oliveri (Cephalotaxaceae) in relation to habitat heterogeneity, physical barriers and the uplift of the Yungui Plateau. Mol. Phylogenet. Evol. 2014, 80, 205–216. [Google Scholar] [CrossRef] [PubMed]
  26. Chen, J.; Hao, Z.; Guang, X.; Zhao, C.; Wang, P.; Xue, L.; Zhu, Q.; Yang, L.; Sheng, Y.; Zhou, Y.; et al. Liriodendron genome sheds light on angiosperm phylogeny and species–pair differentiation. Nat. Plants 2018, 5, 18–25. [Google Scholar] [CrossRef] [Green Version]
  27. Ye, J.W.; Zhang, Y.; Wang, X.J. Phylogeographic breaks and the mechanisms of their formation in the Sino-Japanese floristic region. Chin. J. Plant Ecol. 2017, 41, 1003–1019. [Google Scholar]
  28. Wang, I.J.; Bradburd, G.S. Isolation by environment. Mol. Ecol. 2014, 23, 5649–5662. [Google Scholar] [CrossRef]
  29. Wang, I.J. Examining the full effects of landscape heterogeneity on spatial genetic variation: A multiple matrix regression approach for quantifying geographic and ecological isolation. Evolution 2013, 67, 3403–3411. [Google Scholar] [CrossRef]
  30. Yuan, Q.; Yang, Q.-E. Cytology, palynology, and taxonomy of Asteropyrum and four other genera of Ranunculaceae. Bot. J. Linn. Soc. 2006, 152, 15–26. [Google Scholar] [CrossRef] [Green Version]
  31. Fu, D.Z.; Robinson, O.R.; Asteropyrum, J.R. Drummond & Hutchinson, in Flora of China; Wu, Z.Y., Raven, P.H., Eds.; Science Press: Beijing, China, 2001; Volume 6. [Google Scholar]
  32. Cheng, S.; Zeng, W.; Wang, J.; Liu, L.; Liang, H.; Kou, Y.; Wang, H.; Fan, D.; Zhang, Z. Species delimitation of Asteropyrum (Ranunculaceae) based on morphological, molecular, and ecological variation. Front. Plant Sci. 2021, 12. [Google Scholar] [CrossRef]
  33. Doyle, J.J.; Doyle, J.L. A rapid DNA isolation procedure for small quantities of fresh leaf tissue. Phytochem. Bull. 1987, 19, 11–15. [Google Scholar]
  34. Hall, T.A. BioEdit: A user-friendly biological sequence alignment editor and analysis program for Windows 95/98/NT. Nuclc. Acids Symp. Ser. 1999, 41, 95–98. [Google Scholar]
  35. Tamura, K.; Peterson, D.; Peterson, N.; Stecher, G.; Nei, M.; Kumar, S. MEGA5: Molecular evolutionary genetics analysis using maximum likelihood, evolutionary distance, and maximum parsimony methods. Mol. Biol. Evol. 2011, 28, 2731–2739. [Google Scholar] [CrossRef] [PubMed] [Green Version]
  36. Librado, P.; Rozas, J. DnaSP v5: A software for comprehensive analysis of DNA polymorphism data. Bioinformatics 2009, 25, 1451–1452. [Google Scholar] [CrossRef] [Green Version]
  37. Hubisz, M.J.; Falush, D.; Stephens, M.; Pritchard, J.K. Inferring weak population structure with the assistance of sample group information. Mol. Ecol. Resour. 2009, 9, 1322–1332. [Google Scholar] [CrossRef] [Green Version]
  38. Evanno, G.; Regnaut, S.; Goudet, J. Detecting the number of clusters of individuals using the software STRUCTURE: A simulation study. Mol. Ecol. 2005, 14, 2611–2620. [Google Scholar] [CrossRef] [Green Version]
  39. Earl, D.A.; vonHoldt, B.M. STRUCTURE HARVESTER: A website and program for visualizing STRUCTURE output and implementing the Evanno method. Conserv. Genet. Resour. 2011, 4, 359–361. [Google Scholar] [CrossRef]
  40. Rosenberg, N.A. Distruct: A program for the graphical display of population structure. Mol. Ecol. Notes 2004, 4, 137–138. [Google Scholar] [CrossRef]
  41. Excoffier, L.; Laval, G.; Schneider, S. Arlequin (version 3.0): An integrated software package for population genetics data analysis. Evol. Bioinform. 2005, 1, 47–50. [Google Scholar] [CrossRef] [Green Version]
  42. Cornuet, J.-M.; Pudlo, P.; Veyssier, J.; Dehne-Garcia, A.; Gautier, M.; Leblois, R.; Marin, J.-M.; Estoup, A. DIYABC v2.0: A software to make approximate Bayesian computation inferences about population history using single nucleotide polymorphism, DNA sequence and microsatellite data. Bioinformatics 2014, 30, 1187–1189. [Google Scholar] [CrossRef] [Green Version]
  43. Cornuet, J.-M.; Ravigné, V.; Estoup, A. Inference on population history and model checking using DNA sequence and microsatellite data with the software DIYABC (v1.0). BMC Bioinform. 2010, 11, 401. [Google Scholar] [CrossRef] [Green Version]
  44. Hey, J. The Divergence of Chimpanzee Species and Subspecies as Revealed in Multipopulation Isolation-with-Migration Analyses. Mol. Biol. Evol. 2009, 27, 921–933. [Google Scholar] [CrossRef] [Green Version]
  45. Hey, J.; Nielsen, R. Integration within the Felsenstein equation for improved Markov chain Monte Carlo methods in population genetics. Proc. Natl. Acad. Sci. USA 2007, 104, 2785–2790. [Google Scholar] [CrossRef] [PubMed] [Green Version]
  46. Richardson, J.E.; Pennington, R.T.; Pennington, T.D.; Hollingsworth, P.M. Rapid Diversification of a Species-Rich Genus of Neotropical Rain Forest Trees. Science 2001, 293, 2242–2245. [Google Scholar] [CrossRef]
  47. Wang, L.; Abbott, R.J.; Zheng, W.; Chen, P.; Wang, Y.; Liu, J. History and evolution of alpine plants endemic to the Qinghai-Tibetan Plateau: Aconitum gymnandrum (Ranunculaceae). Mol. Ecol. 2009, 18, 709–721. [Google Scholar] [CrossRef] [PubMed]
  48. Suchard, M.A.; Lemey, P.; Baele, G.; Ayres, D.L.; Drummond, A.J.; Rambaut, A. Bayesian phylogenetic and phylodynamic data integration using BEAST 1.10. Virus Evol. 2018, 4, vey016. [Google Scholar] [CrossRef] [PubMed] [Green Version]
  49. Rambaut, A.; Drummond, A.J.; Xie, D.; Baele, G.; Suchard, M.A. Posterior summarisation in bayesian phylogenetics using Tracer 1.7. Syst. Biol. 2018, 67, 901–904. [Google Scholar] [CrossRef] [Green Version]
  50. Hijmans, R.J.; Guarino, L.; Cruz, M.; Rojas, E. Computer tools for spatial analysis of plant genetic resources data: 1. DIVA-GIS. Plant Genet. Resour. Newsl. 2001, 127, 15–19. [Google Scholar]
  51. Peakall, R.; Smouse, P.E. GenAlEx 6.5: Genetic analysis in Excel. Population genetic software for teaching and research—an update. Bioinformatics 2012, 28, 2537–2539. [Google Scholar] [CrossRef] [Green Version]
  52. Fan, D.M.; Hu, W.; Li, B.; Morris, A.B.; Zheng, M.; Soltis, U.E.; Soltis, P.S.; Zhang, Z.Y. Idiosyncratic responses of evergreen broad-leaved forest constituents in China to the late Quaternary climate changes. Sci. Rep. 2016, 6, 31044. [Google Scholar] [CrossRef] [Green Version]
  53. Tzedakis, P.; Raynaud, D.; McManus, J.F.; Berger, A.; Brovkin, V.; Kiefer, T. Interglacial diversity. Nat. Geosci. 2009, 2, 751–755. [Google Scholar] [CrossRef]
  54. Beaumont, M.A. Approximate bayesian computation in evolution and ecology. Annu. Rev. Ecol. Evol. Syst. 2010, 41, 379–406. [Google Scholar] [CrossRef]
  55. Clark, M.; House, M.; Royden, L.; Whipple, K.; Burchfiel, B.; Zhang, X.; Tang, W. Late Cenozoic uplift of southeastern Tibet. Geology 2005, 33, 525. [Google Scholar] [CrossRef] [Green Version]
  56. Wang, E.; Kirby, E.; Furlong, K.P.; Van Soest, M.; Xu, G.; Shi, X.; Kamp, P.; Hodges, K. Two-phase growth of high topography in eastern Tibet during the Cenozoic. Nat. Geosci. 2012, 5, 640–645. [Google Scholar] [CrossRef]
  57. Thomson, J.R.; Holden, P.B.; Anand, P.; Edwards, N.R.; Porchier, C.A.; Harris, N.B.W. Tectonic and climatic drivers of Asian monsoon evolution. Nat. Commun. 2021, 12, 4022. [Google Scholar] [CrossRef] [PubMed]
  58. Guo, Z.T.; Sun, B.; Zhang, Z.S.; Peng, S.Z.; Xiao, G.Q.; Ge, J.Y.; Hao, Q.Z.; Qiao, Y.S.; Liang, M.Y.; Liu, J.F.; et al. A major reorganization of Asian climate by the early Miocene. Clim. Past 2008, 4, 153–174. [Google Scholar] [CrossRef] [Green Version]
  59. Clift, P.D.; Hodges, K.; Heslop, D.; Hannigan, R.; Van Long, H.; Calvès, G. Correlation of Himalayan exhumation rates and Asian monsoon intensity. Nat. Geosci. 2008, 1, 875–880. [Google Scholar] [CrossRef]
  60. Sun, X.; Wang, P. How old is the Asian monsoon system?—Palaeobotanical records from China. Palaeogeogr. Palaeoclim. Palaeoecol. 2005, 222, 181–222. [Google Scholar] [CrossRef]
  61. Zheng, B.; Xu, Q.; Shen, Y. The relationship between climate change and Quaternary glacial cycles on the Qinghai–Tibetan Plateau: Review and speculation. Quat. Int. 2002, 97, 93–101. [Google Scholar] [CrossRef]
  62. Cui, Z.J.; Chen, Y.X.; Zhang, W.; Zhou, S.Z.; Zhou, L.P.; Zhang, M.; Li, C.C. Research history, glacial chronology and origins of Quaternary glaciations in China. Quatern. Sci. 2011, 31, 749–764. [Google Scholar]
  63. Harrison, S.P.; Yu, G.; Takahara, H.; Prentice, I.C. Palaeovegetation (Communications arising): Diversity of temperate plants in East Asia. Nature 2001, 413, 129–130. [Google Scholar] [CrossRef]
  64. Guan, B.-C.; Fu, C.-X.; Qiu, Y.-X.; Zhou, S.-L.; Comes, H.P. Genetic structure and breeding system of a rare understory herb, Dysosma versipellis (Berberidaceae), from temperate deciduous forests in China. Am. J. Bot. 2010, 97, 111–122. [Google Scholar] [CrossRef]
  65. An, Z.S.; Kutzbach, J.E.; Prell, W.L.; Porter, S.C. Evolution of Asian monsoons and phased uplift of the Himalaya–Tibetan plateau since Late Miocene times. Nature 2001, 411, 62–66. [Google Scholar] [CrossRef]
  66. Wang, H.-W.; Ge, S. Phylogeography of the endangered Cathaya argyrophylla (Pinaceae) inferred from sequence variation of mitochondrial and nuclear DNA. Mol. Ecol. 2006, 15, 4109–4122. [Google Scholar] [CrossRef]
  67. Lei, M.; Wang, Q.; Wu, Z.J.; López-Pujol, J.; Li, D.Z.; Zhang, Z.Y. Molecular phylogeography of Fagus engleriana (Fagaceae) in subtropical China: Limited admixture among multiple refugia. Tree Genet. Genomes 2012, 8, 1203–1212. [Google Scholar] [CrossRef]
  68. Wang, J.; Gao, P.; Kang, M.; Lowe, A.J.; Huang, H. Refugia within refugia: The case study of a canopy tree Eurycorymbus cavaleriei in subtropical China. J. Biogeogr. 2009, 36, 2156–2164. [Google Scholar] [CrossRef]
  69. Zhang, Z.Y.; Wu, R.; Wang, Q.; Zhang, Z.R.; López-Pujol, J.; Fan, D.M.; Li, D.Z. Comparative phylogeography of two sympatric beeches in subtropical China: Species-specific geographic mosaic of lineages. Ecol. Evol. 2013, 3, 4461–4472. [Google Scholar] [CrossRef] [PubMed]
  70. Zhang, Y.H.; Wang, I.; Comes, H.P.; Peng, H.; Qiu, Y.X. Contributions of historical and contemporary geographic and environmental factors to phylogeographic structure in a Tertiary relict species, Emmenopterys henryi (Rubiaceae). Sci. Rep. 2016, 6, 24041. [Google Scholar] [CrossRef] [Green Version]
  71. Boufford, D. Biodiversity hotspot: China’s Hengduan Mountains. Arnoldia 2014, 72, 24–35. [Google Scholar]
  72. Cao, Y.; Zhu, S.; Chen, J.; Comes, H.P.; Wang, I.J.; Chen, L.; Sakaguchi, S.; Qiu, Y. Genomic insights into historical population dynamics, local adaptation, and climate change vulnerability of the East Asian Tertiary relict Euptelea (Eupteleaceae). Evol. Appl. 2020, 13, 2038–2055. [Google Scholar] [CrossRef] [PubMed]
Figure 1. Geographical distribution and haplotype network of chloroplast haplotypes and structure diagram using eight nuclear loci of Asteropyrum. The sizes of circles in the network are proportional to the haplotype frequencies. Group_1, MT, PT, GS, FG, ZX, YL, EMS, ELS, DJY, PL, SNJ, HZG, LCG, WLS; Group_2, MJ, SJ, LB, MB, WL, YY, LS, YS, XN, ZY, HP; Mixed, WS, XE, SZ.
Diversity 13 00627 g001
Figure 2. Alternative scenarios of population divergence of three groups of Asteropyrum, i.e., Group_1 (N1), Group_2 (N2), and the mixed populations (N3).
Diversity 13 00627 g002
Figure 3. Bayesian skyline plots of two groups of Asteropyrum based on mutation rate 3.46 × 10⁻⁹, respectively. The y axis represents the effective population size, and the x axis is in units of years before present. The dark blue lines represent median values, the light blue lines mark the 95% highest posterior density (HPD) intervals.
Diversity 13 00627 g003
Figure 4. Posterior probability density distributions of the divergence time (t) between two groups and their migration rates (m) from both directions and effective population size changes for Group_1, Group_2, and the ancestral population estimated by the IM model.
Diversity 13 00627 g004
Table 1. Information of ten nuclear loci and one chloroplast fragment used in this study.
PrimersSequences(5′–3′)NLSπθwNhHdDRm
psbA-
trnH
F:GTTATGCATGAACGTAATGCTC323219130.0110.009100.8490.4911
R:CGCGCATGGTGGATTCACAAATC
X14F:GTTTCGGGTGTTCTTGTT162388190.0050.008270.807−0.8374
R:CATCTTCTTGGCTCGTAG
X17F:AACCTTAGAACTCCGATTA146368490.0160.021400.953−0.7477
R:CCTGATGATACCCTACTTT
X23F:TGAGCGGTTCCTTGTCCC156411330.0070.013280.914−1.3161
R:CAGCGTGATGTCTTACGATGC
X35F:CCGCTTTGCCACAGATTA162253140.0090.009150.820−0.0471
R:TGCTTTACCAGCCGTTGA
X47F:ACAACATCCCAATCAGCA160231230.0170.017230.881−0.2670
R:ACAACCCACAACACCAGA
X63F:CGTCGCCCAGTAGTATCTT159389230.0040.009160.807−1.4850
R:ACATTCATCGTTCGCTTG
X82F:ATGAGAAGGGCACCAAAT159308170.0070.009180.867−0.4311
R:AAGCAAACAGAGGGAAGC
X89F:CGAGTAGCCTTTACGACG157432390.0100.014350.927−0.8813
R:GAGTGGAACCCAACCTTT
X125F:CAGGTGCGGTCATAGTTG134206260.0080.020230.794−1.802 *1
R:CGAGTCGCCTTGAGTTTT
X130F:GGGAAGCCGTAGACTCAC160275210.0060.012210.780−1.4190
R:CCCGACAAGGCATAGAAC
N, sample size; L, length in base pair; S, number of polymorphic sites; π, nucleotide diversity; θw, Watterson’s parameter; Nh, number of haplotype; Hd, haplotype diversity; D, Tajima’s D statistic; Rm, minimum number of recombinant event. The asterisk indicates statistical significances (p < 0.05).
Table 2. Genetic diversity, differentiation and neutrality test of two groups and Asteropyrum as a whole.
GroupπHdHsFstNmDFs
Group_10.0050.9760.7040.5310.6300.332−1.222
Group_20.0050.9570.6340.7300.4900.617−0.840
Asteropyrum0.0070.9880.6890.8720.5700.599−0.927
π, nucleotide diversity; Hd, haplotype diversity; Hs, mean genetic diversity within populations; Fst, genetic differentiation among populations within group/species; Nm, calculated by using Gst; D, Tajima’s D statistic; Fs, Fu’s Fs.
Table 3. Results of AMOVA analysis of Asteropyrum based on eight nuclear loci.
Source of Variationd.f.Sum of SquaresVariance ComponentsPercentage of VariationFst
Among groups12.33700.00010.18
Among populations within groups2346.56900.166833.36
Within populations23176.76700.332366.46
Total255125.67300.5000 0.3342 *
d.f., degree of freedom; *, p < 0.001.
Table 4. Posterior estimates of demographic parameters for the best model of population divergences based on Approximate Bayesian Computation.
GroupParameterMeanMedianMode95% HPD
Na1.57 × 1061.59 × 1061.59 × 1060.47–2.61 × 10⁶
N12.32 × 1062.40 × 1062.55 × 1061.48–2.86 × 10⁶
N21.61 × 1061.63 × 1061.85 × 1060.70–2.51 × 10⁶
3N33.18 × 1052.21 × 1051.65 × 1050.71–9.81 × 10⁵
T2 (years)1.23 × 1061.23 × 1061.20 × 1060.48–1.90 × 10⁶
T1 (years)4.77 × 1054.11 × 1052.38 × 1050.15–1.08 × 10⁶
μ3.47 × 10−92.84 × 10−91.93 × 10−91.21–7.56 × 10⁻⁹
ra2.97 × 10−12.37 × 10−11.49 × 10−10.35–7.63 × 10⁻¹
N1, N2, and N3 represent effective population size of Group_1, Group_2, and Mixed populations, respectively. T, divergence time or admixture time of different groups; Na, ancestral population size; μ, the mutation rate; ra, admixture rate.
Table 5. Maximum likelihood estimates and 95% highest posterior density (HPD) intervals of demographic parameters of two nuclear groups of Asteropyrum estimated by IMa2.
Par.θ1θ2θam1m2tN1N2Na2N1m12N2m2T
Mean3.398 1.761 0.615 0.072 0.067 1.349 7.53 × 1053.90 × 1051.36 × 1050.122 0.059 1.20 × 10⁶
HPD95Lo2.886 1.377 0.068 0.015 0.000 1.011 6.39 × 1053.05 × 1051.50 × 1040.022 0.000 8.96 × 10⁵
HPD95Hi3.9982.1521.3270.1350.1371.7048.86 × 1054.77 × 1052.94 × 1050.2700.1471.51 × 106
θ1 and N1, effective population size of Group_1; θ2 and N2, effective population size of Group_2. m1, population migration rate from Group_1 to Group_2; m2, population migration rate in the opposite direction; 2N1m1 and 2N2m2, population migration rate estimated by m1 and m2; t and T, divergent time between each other. θ, m, and t are scaled by the mutation rate, while N1, N2, 2N1m1, 2N2m2, and T are scaled by individuals or years.
Publisher’s Note: MDPI stays neutral with regard to jurisdictional claims in published maps and institutional affiliations.

