Article

Genetic Assignment Tests to Identify the Probable Geographic Origin of a Captive Specimen of Military Macaw (Ara militaris) in Mexico: Implications for Conservation

by
Francisco A. Rivera-Ortíz
1,*,
Jessica Juan-Espinosa
1,
Sofía Solórzano
1,
Ana M. Contreras-González
2 and
María del C. Arizmendi
2
1
Laboratorio de Ecología Molecular y Evolución, Unidad de Biotecnología y Prototipos FES Iztacala, Universidad Nacional Autónoma de México, Avenida de los Barrios 1, Los Reyes Iztacala, Tlalnepantla de Baz 54090, Mexico
2
Laboratorio de Ecología, Unidad de Biotecnología y Prototipos, Facultad de Estudios Superiores Iztacala, Universidad Nacional Autónoma de México, Avenida de los Barrios No. 1, Los Reyes Ixtacala, Tlalnepantla de Baz 54090, Mexico
*
Author to whom correspondence should be addressed.
Diversity 2021, 13(6), 245; https://doi.org/10.3390/d13060245
Submission received: 7 May 2021 / Accepted: 29 May 2021 / Published: 2 June 2021

Abstract

:
The Military Macaw (Ara militaris) faces a number of serious conservation threats. The use of genetic markers and assignment tests may help to identify the geographic origin of captive individuals and improve conservation and management programs. The purpose of this study was to identify the possible geographic origin of a captive individual using genetic markers. We used a reference database of genotypes of 86 individuals previously shown to belong to two different genetic groups to determine the genetic assignment of the captive individual of unknown origin (captive specimen) and five individuals of known geographic origin (as positive controls). We evaluated the accuracy of three assignment/exclusion criteria to determine the success of correct assignment of the individual of unknown origin and the five positive control individuals. WICHLOCI estimated that eight loci were required to achieve an assignment success of 83%. The correct geographic origin of positive controls was identified with 83% confidence. All of the analyses assigned the captive individual to the genetic group from the Sierra Madre Oriental. Bayesian assignment tests, tests for genetic distance and allele frequency tests assigned the unknown individual to the locations from the Sierra Madre Oriental with a probability of 71.2–82.4%. We show that the use of genetic markers provides a promising tool for determining the origin of pets and individuals seized from the illegal animal trade to better inform decisions on reintroduction and improve conservation programs.

1. Introduction

The order Psittaciformes contains some of the most charismatic and recognizable bird species in the world [1]. However, of the order’s approximately 352 species, 26% face some degree of extinction risk [2]. For example, out of the 22 Psittacidae species recorded in Mexico [1,3], 20 are at risk according to Mexican law [4], and at the international level, the Red List of the International Union for the Conservation of Nature (IUCN) places eight of those species in some risk category [5]. The Military Macaw (Ara militaris) is one of the endangered psittacid species in Mexico, and faces two main threats: (1) habitat transformation (loss, fragmentation and degradation) [6,7], and (2) illegal collection for the national and international illegal pet trade [7,8,9,10,11,12,13,14,15]. Indeed, illegal trafficking has led to the extirpation of populations from conserved areas [11,12,16].
In Mexico, the illegal wildlife trade has threatened 19 out of the 22 Psittacidae species [7]. The capture of any wild Psittacidae species was outlawed in Mexico in 2003, and the current General Wildlife Law (LGVS) prohibits the extraction of psittacid species, only granting permits for conservation or scientific research purposes [17]. One of the objectives of the LGVS was to guide management efforts, including the recovery, reproduction, research, release, and/or relocation of individuals [18]. One of the problems faced by reintroduction and recovery efforts is that in most cases, the geographic origin of animals recovered from the illegal pet trade is unknown. Information on the geographic origin of rehabilitated individuals is crucial in order to avoid mixing individuals from genetically distinct populations, which can lead to genetic problems (e.g., local maladaptation and outbreeding depression) [19,20,21,22].
Molecular tools make it possible to answer questions concerning evolutionary history, define taxonomic uncertainties, and identify release locations using molecular markers (e.g., microsatellites) and statistical approaches [23,24,25,26]. However, these techniques are not often used for the identification of release locations for rehabilitated birds illegally taken from the wild [21,27]. The use of molecular tools to establish the origin of individuals for conservation purposes is increasing in reintroduction plans and for identifying illegal trade sites, as demonstrated by studies of several species, such as the Hyacinth Macaw (Anodorhynchus hyacinthinus) [28], the Blue-and-Yellow Macaw (Ara ararauna) [21] and the European Pond Turtle (Emys orbicularis) [29].
The purpose of this study was to determine the probable geographic origin of a captive Military Macaw of unknown origin using different molecular statistical analyses and test the accuracy of these techniques using individuals of known origin, in order to generate a protocol that can be used for reintroduction programs, for management and conservation.
The Military Macaw is one of the most charismatic species in the New World. Its distribution is fragmented, ranging from northern Mexico to northwestern Argentina [1,6,30]. In Mexico, the Military Macaw is distributed in apparently isolated colonies in two separate areas. One includes the Sierra Madre Occidental and the Sierra Madre del Sur (from southern Sonora to Chiapas); the other is in the Sierra Madre Oriental, where the macaws are reported in Tamaulipas, San Luis Potosi, Guanajuato, and Querétaro [31,32]. The geographic distribution of the Military Macaw in Mexico declined by 43% over 16 years (2000–2016) [10,13,14]. It is endangered under Mexican law [4,13], vulnerable on the IUCN Red List [5], and listed in Appendix I of the Convention on International Trade in Species [33].
A study conducted by Rivera-Ortíz et al. [
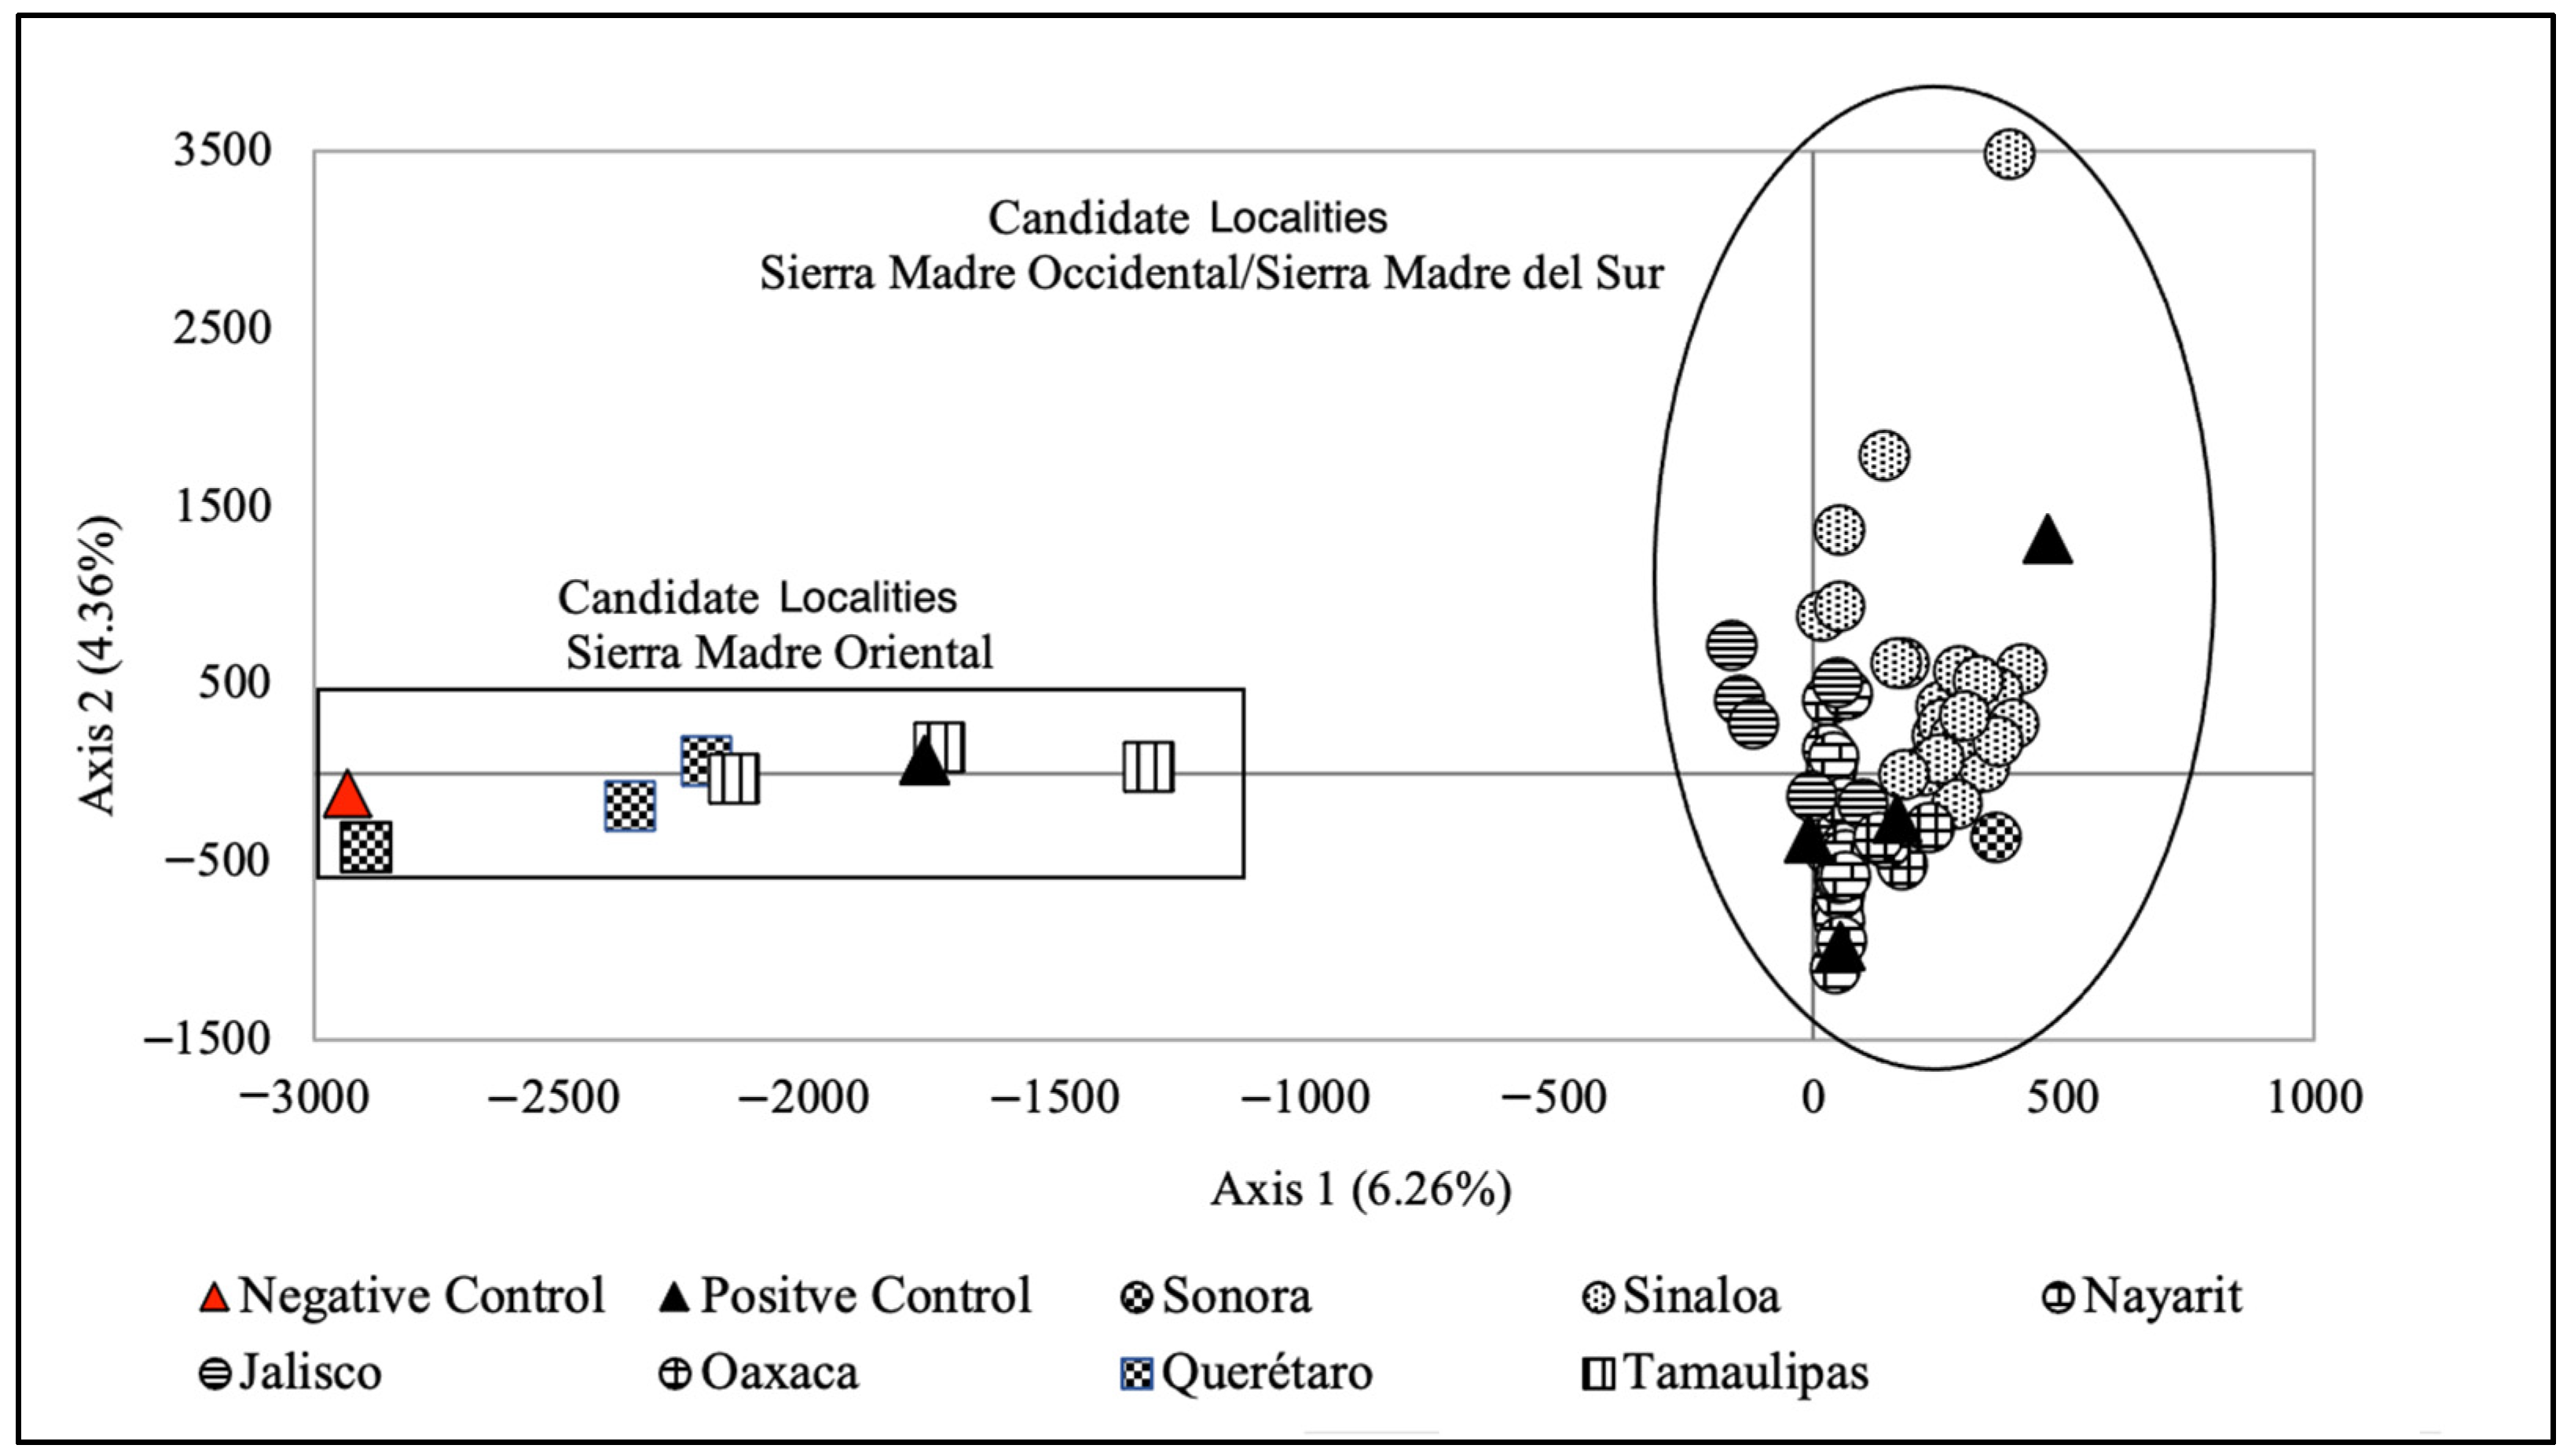
34] on the genetics of the Military Macaw used microsatellites from samples collected in seven Mexican locations and found strong genetic structuring, showing two groups presenting geographic concordance. Group one corresponded to the locations found in the Sierra Madre Occidental and the Sierra Madre del Sur (Pacific slope), and Group two corresponded to the locations found in the Sierra Madre Oriental (Gulf of Mexico slope). Given these results, the authors proposed the protection of the two genetic groups found in the three physiographic regions as independent conservation units. In this study, we used both classification (correspondence analysis) and genetic assignment methods to evaluate whether the Military Macaw individual of unknown origin belonged to any of those previously identified genetic groups, and if possible, assign it to a particular location.

2. Materials and Methods

2.1. DNA Extraction and Genotyping

We extracted DNA from five feathers collected from a captive individual housed at the AFP OCEAN Foundation A.C. The rachises of the collected feathers were cleaned with 75% molecular grade ethyl [34]. This same procedure was performed with positive control samples from five individuals of known geographic origin.
Total genomic DNA was extracted using the standard digestion protocol with Proteinase-K/sodium dodecyl sulfate (SDS), followed by chloroform and alcohol purification as described by Leeton and Christidis [35]. Eight loci were amplified from nuclear microsatellites using primers designed for other parrot species (five for Ara ararauna and three for Amazona guildinguii) [36,37,38]. These polymorphic microsatellites were those previously used by Rivera-Ortíz et al. [34] for Military Macaw individuals from seven different locations.
These eight loci were amplified by polymerase chain reaction (PCR) according to the parameters used by Rivera-Ortíz et al. [34]. Electrophoresis was carried out using an ABI PRISM 3100 Avant sequencer (Applied Biosystems) with Gene Scan LIZ 500 to determine fragment size. Fragments and their final size were analyzed using GENE MAPPER 4.0 software (Applied Biosystems). Since this program automatically determines allele size, we visually checked the electropherograms of microsatellites from the eight loci to corroborate their size and number. PCR sequences were repeated for samples with unclear electropherograms to resolve uncertainties [39].

2.2. Data Analysis

Genetic assignment analyses were conducted using the genotypes of 86 individuals from seven locations grouped into the two genetic groups reported by Rivera-Ortíz et al., [34]. Those genetic groups considered the candidate places of origin of the captive specimen of unknown origin and the five specimens of known origin (one individual from Sinaloa, two from Nayarit, one from Oaxaca and one from Tamaulipas).
Theoretical studies have examined how the number of loci and alleles relate to the success of assignment [40,41]. WICHLOCI 1.0 software [41] chooses the best combination of loci to assign a captive individual by analyzing the data extracted from candidate locations. Combinations of the eight microsatellites were used to test the minimum loci needed for a successful assignment [41,42].

2.3. Factorial Correspondence Analysis (FCA)

First, we did a factorial correspondence analysis (FCA) using GENETIX 4.05.4 software [43]. This analysis is a multivariate interdependence statistical method that is well adapted to describe associations between variables [44] and provides a graphical display of the genetic relationships between the individuals of interest and those of the reference populations in a multidimensional space based on allelic data. FCA was performed using three data combinations: (i) positive controls + unknown individual + individuals from the Sierra Madre Occidental/Sierra Madre del Sur populations + individuals from the Sierra Madre Oriental populations and (ii) positive controls + unknown individual + individuals from the Sierra Madre Oriental. These combinations were created to determine whether any differences existed between the unknown individual and the locations or candidate genetic groups.

2.4. Genetic Assignment Analysis

A Bayesian approach was used to assign the unknown individual and positive controls to genetic groups or populations, implemented in STRUCTURE 2.3.1 software [45,46]. This approach was designed to infer the number of genetic groups or populations of individuals (K) according to their genotypes and estimate the proportional membership of each individual’s genotype to one or more of the inferred genetic clusters.
We used the results of the population structure analysis of Military Macaws from Rivera-Ortíz et al. [34], which identified two genetic groups: (1) Sierra Madre Occidental/Sierra Madre del Sur populations and (2) Sierra Madre Oriental populations. Within these groups, we explored the possibility of hierarchical structuring as recommended by Jombart [47]. We repeated these analyses until no additional structure was found within clusters, i.e., until the optimal K value was 1. The burn-in length for each repetition consisted of 500,000 steps, followed by 10,000,000 iterations, under the admixture assumption. No clear substructure was detected in the two genetic groups reported by Rivera-Ortíz et al. [34] (Supplementary Materials, Figure S1). A similar analysis, the discriminant analysis of principal components (DAPC) also showed that the studied seven candidate locations grouped into two inferred clusters (K = 2), according to Bayesian information criterion (BIC) [47] (Supplementary Materials, Figure S2). Therefore, we assumed that there was no hierarchical structure and we continued the genetic assignment analysis under these conditions.
To assign the unknown individual and positive controls of known origin back to their genetic groups, we used the USEPOPINFO function within an admixture framework. We performed this analysis with all of the controls and the two genetic groups.
We used 10 repetitions in a range of K = 1 to K = 10. The burn-in length for each repetition consisted of 500,000 steps, followed by 10,000,000 iterations, under the admixture assumption in order to determine the maximum value of the posteriori probability (lnP (D)), to detect the true K [45]. CLUMPP 1.1.2 software [48] was used to eliminate label switching, using the greedy algorithm with 1,000 random input orders. These values were visualized using bar plots prepared with DISTRUCT software [49], which showed how the test individuals were assigned relative to the grouping of the reference set of individuals, and to determine the probability of their assignment to one of the two genetic groups identified by Rivera-Ortíz et al. [34].
Genetic relationships between the unknown individual and positive controls and the genetic groups/locations were also examined by applying discriminant analysis of principal components (DAPC) [47] using the “adegenet 2.1.3” package [26] in R 4.0.5 software [50], with the number of principle components set to 35 following alpha-score indication. DAPC is a multivariate, model-free approach designed to generate clusters based on prior population information [26]. DAPC allowed us to analyze the population structure by assigning the unknown individual and positive controls to the genetic groups or locations.
We used three genetic assignment/exclusion approaches implemented in GENECLASS 2.0 software [51]. The analyses were carried out for the two genetic groups and for each of the locations that contain them. The first approach used allele frequencies [52]; the unknown individual and positive controls were assigned to the genetic groups and candidate locations where each of their genotypic frequencies was expected to be the highest. We calculated the probability of the genotype of the controls and then applied the simulation algorithm proposed by Paetkau et al. [53] with a Monte Carlo (MC) resampling of 10,000 steps and an exclusion threshold of p < 0.05. In the second approach, we used a partially Bayesian test based on Rannala and Mountain [54], which estimates the population’s allele frequencies and individual assignment’s statistical significance (unknown individual and positive controls). We used the simulation algorithm proposed by Paetkau et al. [53] with an MC resampling of 10,000 steps and an exclusion threshold of p < 0.05. In the third approach, we calculated the genetic distance between the unknown individual and candidate groups and locations. The same was done for the positive controls [55].
We used three measurements of genetic distance: (1) Nei’s minimum genetic distance [56], (2) Nei’s DA genetic distance [57], and (3) the simulation algorithm proposed by Paetkau et al. [53] with an MC resampling of 10,000 steps and an exclusion threshold of p < 0.05. A self-assignment of all of the individuals from the reference populations was also performed, with an exclusion threshold of p < 0.05, with an MC resampling of 10,000 steps.

3. Results

The summary statistics per locus and per-locations locus, positive controls and unknown captive individual are given in the Supplementary Materials (Tables S1 and S2).
The assignment scores estimated by WICHLOCI 1.0 software indicated that the contribution to the genetic assignment of each of the eight loci varied between 9.0% (locus UnaCT21) and 15.55% (locus UnaCT21). Using eight loci produced the highest score, assigning the captive specimen to the candidate populations with an accuracy of 83% (Table 1). The eight loci were used in all subsequent assignment/exclusion tests to improve the assignment success for the unknown captive individual and positive controls.

3.1. FCA

Using the combination of the positive controls + unknown individual + individuals from the Sierra Madre Occidental/Sierra Madre del Sur locations + individuals from the Sierra Madre Oriental locations, the FCA produced a data cloud showing the position of each of the 86 individuals from the candidate genetic groups in a two-dimensional space (taken from the study by Rivera-Ortíz et al. [34]) including the unknown individual and the positive controls. Two distinct genetic groups were differentiated in the data cloud: (1) individuals from the candidate locations from the Sierra Madre Occidental/Sierra Madre del Sur and (2) individuals from the candidate locations from the Sierra Madre Oriental (Figure 1). We observed that the positive controls of the individuals of Sinaloa, Nayarit, and Oaxaca were located in the point cloud of the candidate locations from the Sierra Madre Occidental/Sierra Madre del Sur. In contrast, the unknown individual and the positive control from Tamaulipas were located in the point cloud of the candidate locations from the Sierra Madre Oriental (Figure 1).
The combination of the positive controls + unknown individual + individuals from the Sierra Madre Oriental showed that the unknown individual was placed within the data cloud corresponding to the Sierra Madre Oriental candidate locations and was closest to the individuals from the Querétaro location. The positive control of the individual from Tamaulipas was also placed in this cloud but was closer to the individuals from the location from Tamaulipas. In contrast, positive control individuals from Sinaloa, Nayarit, and Oaxaca formed a cloud of points that was quite distant from the individuals from the reference locations in the Sierra Madre Oriental (Figure 2).

3.2. Genetic Assignment

STRUCTURE showed the two genetic groups (K = 2) reported previously by Rivera-Ortíz et al. [34]. The results of this analysis (Figure 3) indicates that the positive control individuals were correctly assigned to the locations corresponding to their known geographic origins. The unknown individual was assigned to the genetic group of the Sierra Madre Oriental with a genetic allocation ratio of 97.1% to 99.6% (Table 2).
DAPC supported STRUCTURE, identifying two genetic groups (K = 2) (Figure 4), according to Bayesian information criterion (BIC). The DAPC plot also reflects the assignment probabilities of the positive control individuals as well as the individual of unknown origin to the Sierra Madre Oriental (Figure 4).
In the four approaches implemented by GENECLASS, positive controls from Sinaloa, Nayarit and Oaxaca were assigned to the Sierra Madre Occidental/Sierra Madre del Sur genetic group, with values ranging from 70% to 82.4%. The positive control from Tamaulipas and the unknown individual were assigned to the genetic group from the Sierra Madre Oriental with values of 71.2% to 82.4% (Table 3).
The unknown captive individual was assigned to the candidate locations from Tamaulipas and Querétaro (Table 4). The analysis of Nei’s genetic distances and the minimum Nei distance proposed by Cournuet et al. [55,56,57] showed the probabilities of assignment of the unknown individual to the locations from Querétaro and Tamaulipas (Table 4). The partially Bayesian approach taken by Rannala and Mountain [54] and the allele frequency approach described by Paetkau et al. [53] both assigned the unknown individual to the location from Querétaro, with probabilities of 32.7% and 30.3%, respectively (Table 4). All positive control individuals were assigned correctly to each of their locations of origin; the four approaches showed assignment probabilities between 29.8% and 55.0% for individuals from Sinaloa, Nayarit, Oaxaca, and Tamaulipas (Table 5).
Self-assignment tests of the candidate locations panel correctly assigned between 65.1% and 90.6% of the individuals to their population of origin (Table 6).

4. Discussion

Identification of an individual’s geographic origin by means of genetic analysis depends on the ability to assign it to a particular location, which in turn depends on the level of genetic structuring among reference locations [58]. Here, we tested the ability of molecular genetic assignment to identify the likely location of origin of one individual of the Military Macaw of unknown origin and five individuals of known origin, in order to evaluate the method’s utility in future conservation efforts for the species. In this study, the results showed that the methods tested were useful in identifying the geographic areas from which individuals likely originated, for both the unknown individual and the five positive controls.
The results of the FCA, STRUCTURE and DAPC tests grouped the unknown individual with the Sierra Madre Oriental genetic group with high confidence. However, it was impossible to assign it to a specific geographic location because there is no differentiation between individuals from different reference locations in this genetic group, indicating gene flow. These FCA, STRUCTURE and DAPC results are reliable because the reference sample of individuals used in the study and provided by Rivera-Ortíz et al. [34] presents a marked genetic structure and differentiation across the distribution range of the Military Macaw in Mexico, showing a pattern that was also found by Eberhard et al. [59] with mitochondrial markers. These previously documented patterns of genetic structure are important in the context of the present study because structure and differentiation among the reference locations must be high if there is to be reasonable success in geographic allocation using grouping methods (with 80–100% correct allocation) [26,60,61].
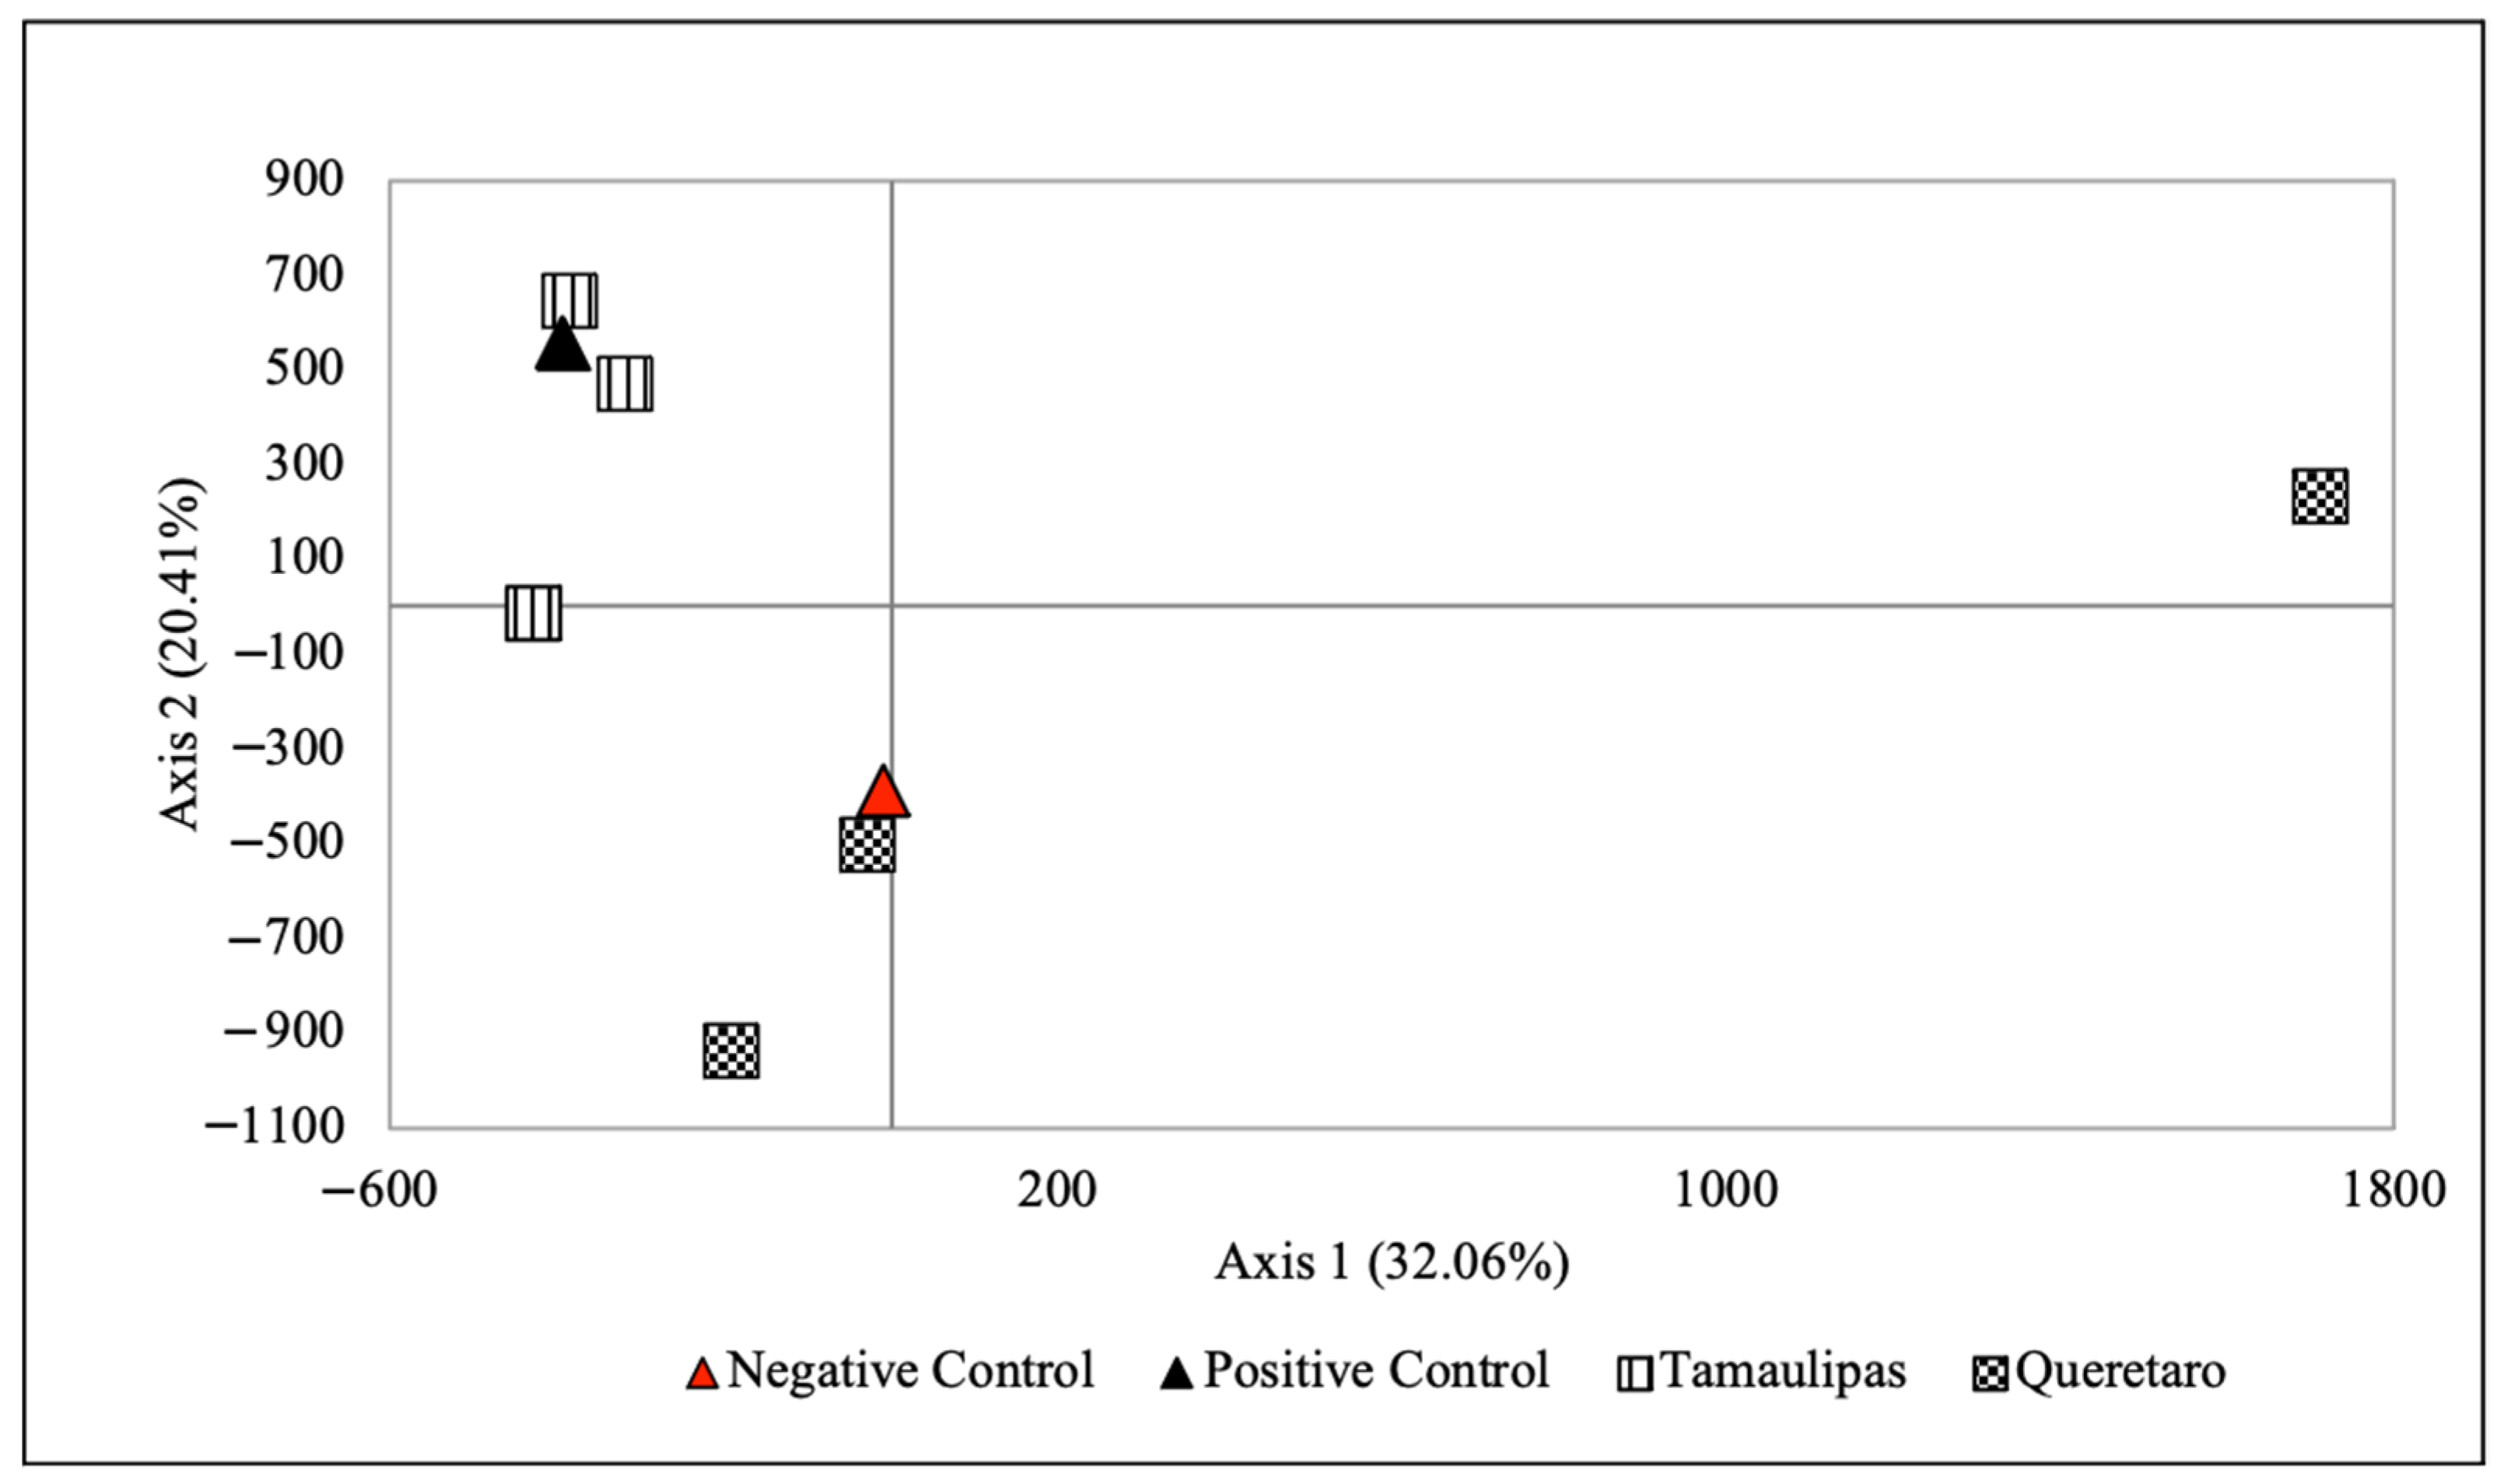
The allocation/exclusion analyses carried out using GENCLASS suggest that the likely origin of the unknown individual is the Sierra Madre Oriental metapopulation, as determined by the grouping analyses. Three of the four criteria used for the allocation/exclusion analyses show some probability that the unknown individual belongs to the Querétaro location, although with relatively low certainty (30–46% probability). These low probability values should be interpreted with caution, since they may be affected by small sample sizes in some of the reference locations. Some authors suggest that a sample of 30–50 individuals per reference location is necessary to allow accurate estimates [26,55,58]. Unfortunately, obtaining large sample sizes in studies of endangered species is extremely difficult due to small population sizes, restricted areas, and difficulty accessing their distributional areas [13,62,63], as in the case of the Military Macaw.
The different methods used to identify the probable location of origin of the individual Military Macaw of unknown origin proved to be effective and complementary, as demonstrated in this study. When carrying out this type of analysis, we recommend graphically showing the genetic similarity of the individuals as a first step that reveals if the samples of unknown origin are grouped in the reference localities [64]. Then, consider a Bayesian approach to determine the probability that the individuals of unknown origin originate from a population, considering all reference localities together [26]. Finally, use the tests to exclude or identify individuals of unknown origin in the reference localities, to determine the probability that individuals of unknown origin are rejected or belong to the reference localities [65].
Our study shows that given the degree of population genetic structure in Military Macaw locations in Mexico, it is possible to use microsatellite data to identify the probable location of origin of an individual of unknown provenance. This, in turn, makes it possible to make a more informed selection of locations at which the individual could be released. The captive specimen was geographically assigned to the Sierra Madre Oriental, and according to our results, is a candidate for release in that zone. It is essential that the programs for reintroducing and releasing Military Macaw individuals into the wild make proper use of this kind of molecular tools [42,66,67], given that for an endangered species, such as the Military Macaw, the strong genetic structuring of wild locations may reflect local adaptations that would be lost if they were to be managed as a single group [34].
To improve the accuracy of assigning individuals of unknown origin to their correct populations, it is crucial to continue genetic studies of wild locations and increase the number of molecular markers used in genetic analyses. Relatively low numbers of microsatellites were used in this study, but microsatellites have provided sufficient power for geographic assignment of a variety of wild species due to their high level of polymorphism and genetic structure of the populations [68,69,70]. The use of other markers such as mitochondrial DNA would be very informative and complementary since it might allow us to distinguish lineages that correspond to particular geographic areas [21]. Identification of single nucleotide polymorphisms (SNPs) from genomic data also have a significant advantage for geographic assignment, since information from hundreds or thousands of SNPs could potentially provide improved resolution of patterns of genetic structure, and thus, the more precise assignment of an individual’s geographic origin [61].
Our study demonstrates that in combination with the reference samples analyzed by Rivera-Ortiz et al. [34], currently available molecular markers and statistical assignment and exclusion software can help identify the geographic origin of captive individuals or specimens confiscated from illegal trade [50]. No studies have been conducted to analyze the number of Military Macaw individuals trapped each year, but Cantú et al. [16] estimated that 65,000 to 78,000 psittacid individuals are poached for illegal trade and suffer a mortality rate of 77%. Only about 2% of poached individuals are seized by the Mexican Federal Environmental Protection Agency (PROFEPA) [16], but given how many are poached, this small percentage still represents several hundred individuals. In this sense, identifying the geographic origin of captive individuals or specimens confiscated from illegal trade helps biodiversity managers to detect locations with intense poaching, and thus, focus efforts and resources on these sites to prevent poaching. It will also support and guide restoration or demographic translocation programs if they are deemed necessary to increase genetic variability [23,28].
A crucial component of this study was the availability of the set of reference samples of known geographic origin [34]. We recommend the establishment of large DNA reference collections and large public databases containing allele frequencies from many populations, and the use of museum collections, which can play an essential role since DNA can be extracted from museum skins. Any genetic analysis that attempts to identify geographic origin of an individual/sample depends on having good data on georeferenced genetic variation. These databases would be extremely valuable in efforts to conserve endangered species [26], by helping to detect and reduce illegal trade and informing conservation management plans.

Supplementary Materials

The following are available online at https://www.mdpi.com/article/10.3390/d13060245/s1, Table S1: Locus name and sequences of the eight microsatellite loci used for assignment analysis, Table S2: Descriptive statistics over all loci for each reference locations, positive controls, and unknown individual Military Macaw, Figure S1: Ln(DK) values plotted from 1 to 10 for the genetic group of the (a) Sierra Madre Occidental / Sierra Madre del Sur and (b) Sierra Madre Oriental, Figure S2: Changes in mean Bayesian information criterion (BIC) values in successive K-means clustering.

Author Contributions

Conceptualization, F.A.R.-O.; methodology, F.A.R.-O. and J.J.-E.; software, F.A.R.-O. and J.J.-E.; validation, F.A.R.-O. and S.S.; formal analysis, F.A.R.-O., J.J.-E. and S.S.; investigation, F.A.R.-O., A.M.C.-G. and M.d.C.A.; resources, F.A.R.-O., A.M.C.-G. and S.S.; writing—original draft preparation, F.A.R.-O., J.J.-E. and S.S.; writing—review and editing, F.A.R.-O. and M.d.C.A. All authors have read and agreed to the published version of the manuscript.

Funding

The author(s) received the following financial support for the research, authorship, and/or publication of this article: this study was funded by a CONACYT (National Council of Science and Technology) scholarship for “Complementary Support for Research Groups”, granted to F.A.R.-O.

Institutional Review Board Statement

Not applicable.

Data Availability Statement

Not applicable.

Acknowledgments

We thank the Organization for the Conservation, Study and Analysis of Nature A.C. for providing the sample of the individual in captivity. Also, thanks to the CONACYT (National Council of Science and Technology) scholarship for “Complementary Support for Research Groups”. Special thanks to Patricia Davila and Ken Oyama for their support. We thank Karl Phillips and second reviewer for his constructive suggestions to improve an earlier version of the manuscript, and Lynna Kiere for the review of the English language style.

Conflicts of Interest

The authors declare no conflict of interest.

References

  1. Juniper, T.; Parr, M. Parrots: A Guide to the Parrots of the World; Yale University Press: New Haven, CT, USA, 1998. [Google Scholar]
  2. Collar, N.J. Globally threatened parrots; criteria, characteristics and cures. Int. Zoo. Yearbk. 2000, 37, 21–35. [Google Scholar] [CrossRef]
  3. Berlanga, H.; Gómez de Silva, H.; Vargas-Canales, V.M.; Rodríguez-Contreras, V.; Sánchez-González, L.A.; Ortega-Álvarez, R.; Claderón-Parra, R. Aves de México: Lista Actualizada de Especies y Nombres Communes; CONABIO Press: Mexico City, Mexico, 2015. [Google Scholar]
  4. Norma Oficial Mexicana 059 SEMARNAT. Protección ambiental—Especies Nativas de México de Flora y Fauna Silvestres—Categorías de Riesgo y Especificaciones Para su Inclusión, Exclusión o Cambio. Lista de Especies en Riesgo. México. Available online: https://www.gob.mx/profepa/documentos/norma-oficial-mexicana-nom-059-semarnat-2010 (accessed on 13 December 2020).
  5. IUCN. Red List of Threatened Species. Available online: https://www.iucnredlist.org/ (accessed on 24 April 2020).
  6. Collar, N.J. Family Psittacidae (parrots). In Handbook of the Birds of the World; del Hoyo, J., Elliott, A., Sargatal, J., Eds.; Bird Life Internationa: Barcelona, Spain, 1997; pp. 280–477. [Google Scholar]
  7. Macías, C.C.; Iñigo-Elías, E.E.; Enkerlin-Hoeflich, E.C. Proyecto de Recuperación de Especies Prioritarias: Proyecto Nacional para la Conservación, Manejo y Aprovechamiento Sustentable de los Psitácidos de México; SEMARNAT Press: Mexico City, Mexico, 2000. [Google Scholar]
  8. Iñigo-Elias, E.; Ramos, M. The psittacine trade in Mexico. In Neotropical Wildlife Use and Conservation; Robinson, J.G., Redford, K.H., Eds.; University of Chicago: Chicago, IL, USA, 1991; pp. 380–392. [Google Scholar]
  9. Collar, N.J.; Juniper, A.T. Dimensions and causes of the parrot conservation crisis. In New World Parrots in Crisis: Solutions from Conservation Biology; Beissinger, S.R., Snyder, N.F.R., Eds.; Smithsonian Institution: Washington, DC, USA, 1992; pp. 1–24. [Google Scholar]
  10. Ríos-Muñoz, C.A.; Navarro-Sigüenza, A.G. Efectos del cambio de uso de suelo en la disponibilidad hipotética de hábitat para los psitácidos de México. Ornitol. Neotrop. 2009, 20, 491–509. [Google Scholar]
  11. Monterrubio-Rico, T.C.; de Labra-Hernández, M.A.; Ortega-Rodríguez, J.M.; Cancino-Murillo, R.; Villaseñor-Gómez, F. Distribución actual y potencial de la guacamaya verde en Michoacán, México. Rev. Mex. Biodivers. 2011, 82, 1311–1319. [Google Scholar] [CrossRef] [Green Version]
  12. Marín-Togo, M.C.; Monterrubio-Rico, T.C.; Renton, K.; Rubio-Rocha, Y.; Macías-Caballero, C.; Ortega-Rodríguez, J.M.; Cancino-Murillo, R. Reduced current distribution of Psittacidae on the Mexican Pacific coast: Potential impacts of habitat loss and capture for trade. Biodivers. Conserv. 2012, 21, 451–473. [Google Scholar] [CrossRef]
  13. Rivera- Ortíz, F.A.; Oyama, K.; Ríos-Muñoz, C.A.; Solórzano, S.; Navarro-Sigüenza, A.G.; Arizmendi, M.C. Habitat characterization and modeling of the potential distribution of the Military Macaw (Ara militaris) in Mexico. Rev. Mex. Biodivers. 2013, 84, 1200–1215. [Google Scholar] [CrossRef] [Green Version]
  14. Monterrubio-Rico, T.C.; Charre-Medellín, J.F.; Pacheco-Figueroa, C.; Arriaga-Weiss, S.; Valdez-Leal, J.D.; Cancino-Murillo, R.; Escalona-Segura, G.; Bonilla-Ruiz, C.; Rubio-Rocha, Y. Distribución potencial histórica y contemporánea de la familia Psittacidae en México. Rev. Mex. Biodivers. 2016, 87, 1103–1117. [Google Scholar] [CrossRef] [Green Version]
  15. Monterrubio-Rico, T.C.; Álvarez-Jara, M.; Téllez-García, L. Hábitat de anidación de Amazona oratrix (Psittaciformes: Psittacidae) en el Pacífico Central, México. Rev. Mex. Biodivers. 2014, 62, 1053–1072. [Google Scholar] [CrossRef] [Green Version]
  16. Cantú, J.C.; Sánchez, M.E.; Grosselet, M.; Silva, J. Tráfico Ilegal de Pericos en México: Una Evaluación Detallada; Defenders of Wildlife/Teyeliz, Press: Washington, DC, USA, 2007; pp. 3–74. [Google Scholar]
  17. SEMARNAT. Ley General del Equilibrio Ecológico y la Protección al Ambiente. México. Available online: https://biblioteca.semarnat.gob.mx/janium/Documentos/Ciga/agenda/DOFsr/148.pdf (accessed on 24 April 2020).
  18. Moya, H.; Peters, E.; Zamorano, P. La importancia de un enfoque regional para la conservación del hábitat natural en la frontera norte de México. In Temas Sobre la Conservación de Vertebrados Silvestres en México; Sánchez, O., Zamorano, P., Peters, E., Moya, H., Eds.; SEMARNAT: Mexico City, Mexico, 2011; pp. 1–67. [Google Scholar]
  19. Lynch, M. The genetic interpretation of inbreeding depression and outbreeding depression. Evolution 1991, 45, 622–629. [Google Scholar] [CrossRef] [PubMed]
  20. Edmands, S. Between a rock and a hard place: Evaluating the relatives risks of inbreeding and outbreeding for conservation and management. Mol. Ecol. 2007, 16, 463–475. [Google Scholar] [CrossRef]
  21. Fernandes, G.A.; Caparroz, R. DNA sequence analysis to guide the release of blue-and-yellow macaws (Ara ararauna, Psittaciformes, Aves) from the illegal trade back into the wild. Mol. Biol. Rep. 2013, 40, 2757–2762. [Google Scholar] [CrossRef]
  22. Pertoldi, C.; Bijlsma, R.; Loeschke, V. Conservation genetics in a globally changing environment: Present problems, paradoxes and future challenges. Biodivers. Conserv. 2007, 16, 4147–4163. [Google Scholar] [CrossRef]
  23. Frankham, R.; Ballou, J.D.; Briscoe, D.A. Introduction to Conservation Genetics; Cambridge University Press: Cambridge, UK, 2010; pp. 161–181. [Google Scholar]
  24. Allendorf, F.W.; Luikart, G.H.; Aitken, S.N. Conservation and the Genetics of Populations; Wiley-Blackwell Press: Oxford, UK, 2012; pp. 52–73. [Google Scholar]
  25. Qiu-Hong, W.; Hua, W.; Tsutomu, F.; Sheng-Guo, F. Which genetic marker for which conservation issue? Electrophoresis 2004, 25, 2165–2176. [Google Scholar] [CrossRef]
  26. Manel, S.; Berthier, P.; Luikart, G. Detecting Wildlife Poaching: Identifying the Origin of Individuals with Bayesian Assignment Test and Multilocus Genotypes. Conserv. Biol. 2002, 16, 650–659. [Google Scholar] [CrossRef] [Green Version]
  27. Burns, C.E.; Ciofi, C.; Beheregaray, L.B.; Fritts, T.H.; Gibbs, J.P.; Márquez, C.; Milinkovitch, M.C.; Powell, J.R.; Caccone, A. The origin of captive Galápagos tortoises based on DNA analysis: Implications for the management of natural populations. Anim. Conserv. 2003, 6, 329–337. [Google Scholar] [CrossRef]
  28. Presti, F.T.; Guedes, N.M.R.; Antas, P.T.Z.; Miyaki, C.Y. Population genetic structure in Hyacinth Macaws (Anodorhynchus hyacinthinus) and identification of the probable origin of confiscated individuals. J. Heredity 2015, 106, 491–502. [Google Scholar] [CrossRef] [PubMed] [Green Version]
  29. Velo-Antón, G.; Godinho, R.; Ayres, C.; Ferrand, N.; Cordero-Rivera, A. Assignment tests applied to relocate individuals of unknown origin in a threatened species, the European pond turtle (Emys orbicularis). Amphibia-Reptilia 2007, 28, 475–484. [Google Scholar] [CrossRef] [Green Version]
  30. Iñigo, E.E. Las Guacamayas verde y escarlata en México. Biodiversitas 1999, 25, 7–11. [Google Scholar]
  31. Howell, S.N.G.; Webb, S. A Guide to the Birds of Mexico and Northern Central America; Oxford University Press: Oxford, UK, 1995; p. 337. [Google Scholar]
  32. Arizmendi, M.C.; Marquez-Valdelamar, L. Áreas de Importancia para la Conservación de las Aves en México; CIPAMEX AC Press: Mexico City, Mexico, 2000; pp. 7, 23, 57, 59, 76, 79, 127. [Google Scholar]
  33. CITES. Appendices I, II and II to the Convention on International Trade in Endangered Species of wild Fauna and Flora. USA. Available online: https://www.cites.org/ (accessed on 13 December 2020).
  34. Rivera-Ortíz, F.A.; Solórzano, S.; Arizmendi, M.C.; Dávila-Aranda, P.; Oyama, K. Genetic diversity and structure of the Military Macaw (Ara militaris) in Mexico: Implications for conservation. Trop. Conserv. Sci. 2017, 10, 1–12. [Google Scholar] [CrossRef] [Green Version]
  35. Leeton, P.; Christidis, L. Feathers from Museum Bird Skins—A good source of DNA for Phylogenetic Studies. Condor 1993, 95, 465–466. [Google Scholar] [CrossRef]
  36. Caparroz, R.; Miyaki, C.Y.; Baker, A.J. Characterization of microsatellite loci in Blue-and-Gold Macaw, Ara ararauna (Psittaciforme: Aves). Mol. Ecol. Notes 2003, 3, 441–443. [Google Scholar] [CrossRef]
  37. Russello, M.A.; Calcagnotto, D.; DeSalle, R.; Amato, G. Characterization of microsatellite loci in the endangered St. Vicent Parrot, Amazona guildingii. Mol. Ecol. Notes 2001, 1, 162–164. [Google Scholar] [CrossRef]
  38. Russello, M.A.; Lin, K.; Amato, G.; Caccone, A. Additional microsatellite loci for the endangered St. Vicent Parrot, Amazona guildingii. Conserv. Genet. 2005, 6, 643–645. [Google Scholar] [CrossRef]
  39. Morin, P.A.; Chambers, K.E.; Boesch, C.; Vigilant, L. Quantitative polymerase chain reaction analysis of DNA from noninvasive samples for accurate microsatellite genotyping of wild chimpanzees (Pantroglodytes verus). Mol. Ecol. 2001, 10, 1835–1844. [Google Scholar] [CrossRef]
  40. Garrido-Garduño, T.; Vázquez-Domínguez, E. Métodos de análisis genéticos, espaciales y de conectividad en genética del paisaje. Rev. Mex. Biodivers. 2013, 84, 1031–1054. [Google Scholar] [CrossRef] [Green Version]
  41. Banks, M.; Eichert, W.; Olsen, J.B. Which genetic loci have greater population assignment power? Bioinf. Appl. Note 2003, 19, 1436–1438. [Google Scholar] [CrossRef] [PubMed]
  42. Yue, G.H.; Xia, J.H.; Liu, P.; Liu, F.; Sun, F.; Lin, G. Tracing asian aeabass individuals to single fish farms using microsatellites. PLoS ONE 2012, 7, e52721. [Google Scholar] [CrossRef]
  43. Belkhir, K.; Borsa, P.; Chikhi, L.; Raufaste, N.; Bonhomme, F. GENETIX 4.05, Logiciel Sous Windows TM Pour la Génetique des Populations. Francia. Available online: https://kimura.univ-montp2.fr/genetix/ (accessed on 20 August 2020).
  44. Hair, J.F.; Anderson, R.E.; Tatham, R.L.; Black, W.C. Análisis Multivariante; Pearson Prentice Hall Press: Madrid, Spain, 1999; pp. 92–98. [Google Scholar]
  45. Pritchard, J.K.; Stephens, M.; Donnelly, P. Inference of population structure using multilocus genotype data. Genetics 2000, 155, 945–959. [Google Scholar] [CrossRef] [PubMed]
  46. Falush, D.; Stephens, M.; Pritchard, J. Inference of population structure using multilocus genotypes data: Linked loci and correlated allele frequencies. Genetics 2003, 164, 1567–1587. [Google Scholar] [CrossRef] [PubMed]
  47. Jombart, T. Adegenet: A R package for the multivariate analysis of genetic markers. Bioinformatics 2008, 24, 1403–1405. [Google Scholar] [CrossRef] [Green Version]
  48. Jakobsson, M.; & Rosenberg, N.A. CLUMPP: A cluster matching and permutation program for dealing with label switching and multimodality in analysis of population structure. Bioinformatics 2007, 23, 1801–1806. [Google Scholar] [CrossRef] [Green Version]
  49. Rosenberg, N.A. DISTRUCT: A program for the graphical display of population structure. Mol. Ecol. Notes 2004, 4, 137–138. [Google Scholar] [CrossRef]
  50. R Core Team R: A Language and Environment for Statistical Computing; R Foundation for Statistical Computing: Vienna, Austria; Available online: https://www.R-project.org/ (accessed on 3 April 2021).
  51. Piry, S.; Alapetite, A.; Cornuet, J.M.; Paetkau, D.; Baudouin, L.; Estoup, A. GENECLASS2: A Software for Genetic Assignment and First-Generation Migrant Detection. J. Heredity 2004, 95, 536–539. [Google Scholar] [CrossRef] [PubMed]
  52. Paetkau, D.; Calvert, W.; Stirling, I.; Strobeck, C. Microsatellite analysis of population structure in Canadian polar bears. Mol. Ecol. 1995, 4, 347–354. [Google Scholar] [CrossRef] [PubMed]
  53. Paetkau, D.; Slade, R.; Burden, M.; Estoup, A. Genetic assignment methods for the direct, real-time estimation of migration rate: A simulation-based exploration o accuracy and power. Mol. Ecol. 2004, 13, 55–65. [Google Scholar] [CrossRef] [PubMed]
  54. Rannala, B.; Mountain, J. Detecting immigration by using multilocus genotypes. Proc. Natl. Acad. Sci. USA 1997, 94, 9197–9201. [Google Scholar] [CrossRef] [PubMed] [Green Version]
  55. Cornuet, J.M.; Piry, S.; Luikart, G.; Estoup, A.; Solignac, M. New methods employing multilocus genotypes to select or exclude populations as origins of individuals. Genetics 1999, 153, 1989–2000. [Google Scholar] [CrossRef]
  56. Nei, M. The theory and estimation of genetic distance. In Genetic Structure of Population; Morton, N.E., Ed.; University Press: Honolulu, HI, USA, 1973; pp. 45–54. [Google Scholar]
  57. Nei, M.; Tajima, F.; Tateno, Y. Accuracy of estimated phylogenetic trees from molecular data. J. Mol. Evol. 1983, 9, 153–170. [Google Scholar] [CrossRef]
  58. Ogden, R.; Dawnay, N.; McEwing, R. Wildlife DNA forensics—Bridging the gap between conservation genetics and law enforcement. Endanger. Species Res. 2009, 9, 179–195. [Google Scholar] [CrossRef] [Green Version]
  59. Eberhard, J.R.; Iñigo-elias, E.; Enkerlin-Hoeflich, E.; Cun, E.P. Phylogeography of the Military Macaw (Ara militaris) and the Great Green Macaw (A. Ambiguus) Based on MTDNA Sequence Data. Wilson J. Ornithol. 2015, 127, 661–669. [Google Scholar] [CrossRef]
  60. Hauser, L.; Seamons, T.R.; Dauer, M.; Naish, K.A.; Quinn, T.P. An empirical verification of population assignment methods by marking and parentage data: Hatchery and wild steelhead (Oncorhynchus mikiss) in Forks Creek, Washington, USA. Mol. Ecol. 2006, 15, 3157–3173. [Google Scholar] [CrossRef]
  61. Ogden, R.; Linacre, A. Wildlife forensic science: A review of genetic geographic origin assignment. Forensic Sci. Int. Genet. 2015, 18, 152–159. [Google Scholar] [CrossRef] [PubMed]
  62. Palomera-García, C.; Santana, E.; Amparán-Salido, R. Patrones de distribución de la avifauna en tres estados del occidente de México. An. Inst. Biol. 1994, 5, 137–175. [Google Scholar]
  63. Gaucín, R.N. Biología de la Conservación de la Guacamaya Verde (Ara militaris) en el Sótano del Barro, Querétaro. Master’s Thesis, Universidad Autónoma de Querétaro, Santiago de Querétaro, Mexico, March 2000. [Google Scholar]
  64. Honnen, A.C.; Petersen, B.; Kabler, L.; Elmeros, M.; Ross, A.; Sommer, R.S.; Zachos, F.E. Genetic structure of Eurasian otter (Lutra lutra, Carnivora: Mustelidae) populations from the western Baltic sea region and its implications for the recolonization of north-western Germany. J. Zool. Syst. Evol. Res. 2011, 49, 169–175. [Google Scholar] [CrossRef]
  65. García-Navas, V.; Ferrer, E.S.; Sanz, J.J.; Ortego, J. The role of immigration and local adaptation on fine-scale genotypic and phenotypic population divergence in a less mobile passerine. J. Evol. Biol. 2014, 27, 1590–1603. [Google Scholar] [CrossRef] [PubMed]
  66. Mateus, J.C.; Russo-Almeida, P.A. Traceability of 9 Portuguese cattle breed with PDO products in the market using microsatellites. Food Control 2015, 47, 487–492. [Google Scholar] [CrossRef]
  67. Tonteri, A.; Je, A.; Zubchenko, A.V.; Lumme, J.; Primmer, C.R. Microsatellites reveal clear genetic boundaries among Atlantic salmon (Salmo salar) populations from the Barents and White seas, northwest Russia. Can. J. Fish. Aquat. Sci. 2009, 66, 717–735. [Google Scholar] [CrossRef]
  68. Wasser, K.S.; Clark, W.J.; Drori, O.; Kisamo, E.S.; Mailand, C.; Mutayoba, B.; Stephens, M. Combating the illegal trade in African Elephant Ivory whit DNA forensics. Conserv. Biol. 2008, 22, 1065–1071. [Google Scholar] [CrossRef]
  69. Millions, D.G.; Swanson, B.J. An application of Manel’s model: Detecting Bobcat Poaching in Michigan. Wildl. Soc. Bull. 2006, 34, 150–155. [Google Scholar] [CrossRef]
  70. Gonclaves-Nazareno, A.; Sedrez dos Reis, M. Where did they come from? Genetic diversity and forensic investigation of the threatened palm species Butia eriospatha. Conserv. Gent. 2014, 15, 441–452. [Google Scholar] [CrossRef]
Figure 1. Results of the test to analyze the behavior of a bidimensional FCA of all candidate locations of the Military Macaw with respect to the unknown individual and positive control.
Diversity 13 00245 g001
Figure 2. Results of the test to analyze the behavior of a bidimensional FCA of candidate locations of the Military Macaw of the Sierra Madre Oriental with respect to the unknown individual and positive control.
Diversity 13 00245 g002
Figure 3. Proportional membership of unknown individual (NC) and positive controls (PC) and the relationship with the two genetic groups of Military Macaw (86 individuals). Each bar represents the genotype of each individual; the colors (green and red) represent the likelihood of membership of each of the two genetic clusters identified in the STRUCTURE analysis. The vertical black lines show divisions between sampling locations.
Diversity 13 00245 g003
Figure 4. Scatter plots of the DAPC of the microsatellite data for Military Macaw candidate locations, positive controls and unknown individual from Mexico. The axes represent the first two linear discriminants (LD). Each dot represents an individual. Eigenvalues of the analysis are displayed in the inset.
Diversity 13 00245 g004
Table 1. Ranking carried out in WICHLOCI 1.0 for the eight loci. The loci are in order of highest to the lowest score obtained.
LocusScoreScore (%)A (%)
UnaCT21139.47415.55683%
UnaCT32118.57313.225
UnaCT74116.43212.986
UnaCT43114.07112.723
UnaGT55110.09612.279
AgGT17109.72212.237
AgGT1998.69411.007
AgGT3289.519.983
A = Correct assignment with the eight loci combined.
Table 2. Variation in the genetic allocation percentages of the unknown individual of Military Macaw, with the USEPOPINFO function of STRUCTURE for 10 runs with K = 2.
RunGenetic Group 1Genetic Group 2
Assignment Percentages
12.997.1
20.499.6
397.292.8
497.292.8
52.798.3
61.698.4
70.899.2
897.390.7
90.599.5
101.898.2
Genetic group 1 = Sierra Madre Occidental/Sierra Madre del Sur. Genetic group 2 = Sierra Madre Oriental.
Table 3. Assignment probabilities of the positive control samples and the captive individual of unknown origin, according to four types of analysis.
Analysis Type
Genetic GroupsControlsFrequenciesBayesianNei’s Genetic Distance (1983)Minimal Nei Distance (1973)
Sierra Madre Occidental/Sierra Madre del SurSinaloa0.756 *0.705 *0.771 *0.816 *
Nayarit (Ind. 1)0.745 *0.723 *0.700 *0.801 *
Nayarit (Ind. 2)0.742 *0.737 *0.715 *0.810 *
Oaxaca0.778 *0.756 *0.789 *0.836 *
Sierra Madre OrientalTamaulipas0.764 *0.758 *0.764 *0.799 *
Unknown individual0.712 *0.748 *0.79 *0.824 *
* The probability of exclusion calculated with the Monte Carlo method of Paetkau et al. (2004) is p < 0.05.
Table 4. Assignment probabilities for the captive individual of unknown origin to each candidate location, according to four types of analysis.
Analysis Type
Candidate PopulationsFrequenciesBayesianGenetic Distance of Nei (1983)Minimal Distance of Nei (1973)
Sonora0.00 0.00 0.00 0.00
Sinaloa0.00 0.00 0.00 0.00
Nayarit (Ind. 1)0.00 0.00 0.00 0.00
Nayarit (Ind. 2)0.00 0.00 0.00 0.00
Jalisco0.00 0.00 0.00 0.00
Oaxaca0.00 0.00 0.00 0.00
Querétaro0.303 *0.327 *0.373 *0.461 *
Tamaulipas0.00 0.00 0.224 *0.418 *
* The probability of exclusion calculated with the Monte Carlo method of Paetkau et al. (2004) is p < 0.05.
Table 5. Assignment probabilities for the positive control samples to each candidate location, according to four types of analysis.
Analysis Type
Candidate PopulationsPositive Controls (• = TAM, + = SIN, ♢ = NAY and ▸ = Oax)
FrequenciesBayesianGenetic Distance of Nei (1983)Minimal Distance of Nei (1973)
Sonora0.00 0.00 0.00 0.00
Sinaloa0.306 +*0.298 +*0.471 +*0.501 +*
Nayarit (Ind. 1)0.349 ♢*0.376 ♢*0.401 ♢*0.550 ♢*
Nayarit (Ind. 2)0.449 ♢*0.376 ♢*0.401 ♢*0.505 ♢*
Jalisco0.00 0.000.00 0.00
Oaxaca0.408 ▸*0.378 ▸*0.439 ▸*0.451 ▸*
Querétaro0.00 0.00 0.00 0.00
Tamaulipas0.35.7 •*0.310 •*0.309 •*0.457 •*
* The probability of exclusion calculated with the Monte Carlo method of Paetkau et al. (2004) is p < 0.05.
Table 6. Allocation criteria implemented in GENECLASS, self-assignment test of the 86 wild individuals of the seven candidate locations.
The Criterion of the AlgorithmNumber of IndividualsPercentage (%)
Frequencies6777.9
Bayesian7486.0
Nei’s Genetic distance (1983)7890.6
Minimal Nei distance (1973)5665.1
Publisher’s Note: MDPI stays neutral with regard to jurisdictional claims in published maps and institutional affiliations.

