Abstract
As anuran biodiversity quickly declines, it is important to understand local patterns of anuran occurrence. However, the limitations of traditional sampling methods make anuran biodiversity surveys inadequate. Tropical environments are rich in anuran species, which makes biodiversity measurements more difficult. Therefore, it is important to develop a rapid, inexpensive and nondestructive method to measure anuran biodiversity in tropical environments. We used eDNA metabarcoding to measure anuran diversity at 288 sites in 18 regions of Hainan Island. We also used traditional methods and compared the results with those obtained through the eDNA metabarcoding methods. We detected 9 anuran species by traditional sampling methods. We produced 626 million reads by eDNA metabarcoding and assigned them to 15 anuran species. Therefore, eDNA metabarcoding can be used for rapid and large-scale anuran biodiversity surveys.
1. Introduction
One of the key features of the Anthropocene is the increase in global extinction [1]. With the continuous impact of humans on land use, climate change and the emergence of wildlife infectious diseases, the threat to biodiversity will become increasingly severe [1,2]. Amphibians are a particularly vulnerable group, and many species have experienced declines in population size, diminishing distribution and extinction [3,4]. One of the challenges in assessing the conservation status of these species is that individuals are less likely to be found at low population densities. Accurate detection of amphibian species in the environment will contribute to their protection.
Assessing the distribution or occurrence of amphibians is a key step in the study of amphibian diversity. When species are not abundant and organisms cannot be observed directly, it may be difficult to complete these assessments [5]. This is especially true for Anura in tropical freshwater ecosystems, the observations of which are limited by water turbidity, water depth and plant density. Traditionally, anuran surveys often use the traditional line transect method (TLTM), which is a physical monitoring method based on acoustic and visual observations; however, these physical monitoring methods are often subject to various restrictions [6,7,8]. There is an urgent need to develop nondestructive methods to detect amphibians as alternatives to traditional methods. By searching for DNA traces left by organisms in the environment (eDNA), as the DNA is left behind and can be collected at some time after the animal has passed through that area [9,10,11,12,13], challenges posed by traditional methods in investigating species that are difficult to find under low population density can be overcome [14,15]. This has the added benefit of allowing detection even after the animal has passed through the study area. With the development of sequencing technology, the application of environmental DNA (eDNA) in biodiversity research has attracted widespread attention in recent years [6,7,8,16]. The development of eDNA sequencing technology has the potential to increase our understanding of the persistence and distribution of threatened and cryptic species.
To date, the effectiveness and efficiency of eDNA has been evaluated in temperate freshwater environments, and eDNA has yielded good results for monitoring amphibians on temperate islands [6,7,8,17]. The estimation of the abundance of amphibians will be greatly increased by the application of eDNA, which is not affected by these physical factors. Therefore, the application of environmental DNA to amphibian investigations in tropical freshwater environments is a way to not only reduce sampling work and cost but also research and protect the diversity of tropical amphibians.
However, there is no guarantee that eDNA is as effective in tropical waters as it is in temperate waters. In tropical areas, high temperatures and moderately high UV-B radiation are conducive to microbial growth [18] and therefore promote DNA degradation [19,20]. Moreover, strong solar radiation may accelerate the degradation of eDNA, thus limiting the monitoring efficiency of eDNA. Therefore, the application of eDNA needs to be tested for more species.
In this paper, we tested the efficiency of eDNA for monitoring Anura diversity on Hainan Island. A total of 288 sites were surveyed at 16 sampling locations in each region (Table S1). We established a reference database of Anura species on Hainan Island. Then, we compared the efficiency of the eDNA monitoring method and the TLTM method. The results of the eDNA survey were more efficient than those of the TLTM.
2. Materials and Methods
2.1. Study Area and Sample Location
Hainan is the second largest island (located between 108°37′~111°03′ E and 18°10′~20°10′ N) in the South China Sea (Figure 1). The total land area of Hainan is approximately 33,920 km²; 42.5% of which is in the tropical zone. Hainan is the largest tropical island in China. Most of the hills have an elevation of 500~800 m, and more than 81 hills are higher than 1000 m. The mean temperature is 23~25 °C and the mean rainfall is 1728 mm. The Nandu River, Changhua River, and Wanquan River are the three largest rivers on Hainan Island, and each has a catchment area of more than 3000 km².
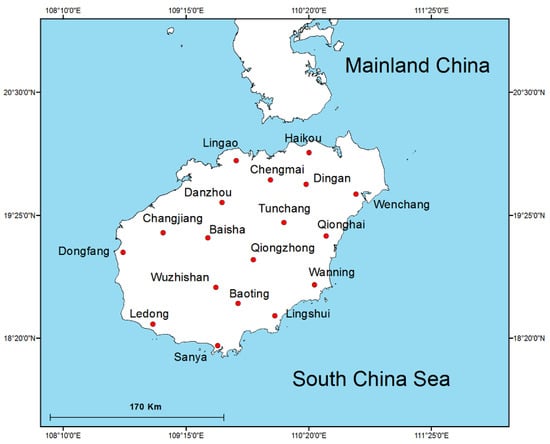
Figure 1.
Sample regions on Hainan island: Haikou (HK), Wenchang (WC), Qionghai (QH), Wanning (WN), Lingshui (LS), Sanya (SY), Ledong (LD), Dongfang (DF), Changjiang (CJ), Baisha (BS), Danzhou (DZ), Lingao (LG), Chengmai (CM), Dingan (DA), Tunchang (TC), Qiongzhong (QZ), Wuzhishan (WZ), Baoting (BT). Abbreviations are in parentheses.
We sampled 18 regions on Hainan Island for Anura using both traditional line transect methods (TLTM) and eDNA metabarcoding. In each region, 16 sites were sampled, for a total of 288 sites (Figure 1, Table 1, Table S1). The 18 sampled regions were located within 6 major river drainage basins (Nandu River, Wanquan River, Lingshui River, Sanya River, Changhua River, and Wenchang River) on Hainan Island. For each site, traditional and metabarcoding sampling was conducted in the same year (2018). For each site, we converted the anuran species abundance data into occurrence data to avoid potential bias due to possible differences in sampling efficiency among sites.

Table 1.
List of the 18 studied regions. See Figure 1 for region locations. Each region has 16 sample sites.
2.2. Traditional Methods
We investigated the richness and abundance of amphibians in waterbodies from 20 April to 8 May (2018) using the traditional line transect method (TLTM), which is based on visual and acoustic sampling [21,22,23,24,25,26,27], each site sampled for once. We searched for amphibians along the transects each night between 19:30 and 22:30 hours after eDNA sampling, and both methods were performed over the same nights for each site. We also carefully listened to calls from amphibians within the transects. We captured frogs or tadpoles after the TLTM and eDNA sampling, and brought them to the lab for further study.
2.3. Reference DNA Database
Based on literature reports for species diversity and known species ranges [28], we defined a list of 45 amphibian species that were known to occur on Hainan Island (Table 2). We constructed a reference database of the 12S rRNA mitochondrial sequences as completely as possible to ensure appropriate taxonomic assignment to sequences recovered from the environmental samples. We sequenced at least one individual from each of the 11 species that were found using the traditional survey method; 9 species were sampled from the sites at which we surveyed eDNA (Table 2). Two species (Kaloula pulchra and Fejervarya kawamurai) were collected from the survey sites and preserved in 96% ethanol. As it was a challenge to collect samples from all 45 species expected, we supplemented our local amphibian sequence reference database with sequences recovered from the EMBL database, release 143. Following the extraction of toe clip tissues (1–3 individuals per species) for 11 amphibian species, we amplified the 12S rRNA mitochondrial gene in a dedicated room. We sequenced the PCR products using Sanger sequencing [29,30].
Table 2.
Occurrence of historically recorded anuran species according to traditional methods and the eDNA metabarcoding method on Hainan Island. ‘+’ indicates a presence record.
We attempted to sequence at least one individual from each species found using the traditional survey method. We supplemented our local amphibian sequence reference database with sequences recovered from the EMBL database, release 143. We downloaded all the vertebrate sequences from the EMBL database. From our local reference database and the EMBL database, we extracted the relevant fragment of 12S sequences for metabarcoding analyses using the programs ecoPCR 0.5.0 [31] and OBITools 1.1.22 [32]. The final 12S metabarcoding reference database is as complete as possible, given the available tissues and EMBL accessions. For the 28 species that were detected in our aquatic eDNA samples, we used the final 12S metabarcoding reference database to attribute taxonomy to the sequences.
2.4. eDNA Metabarcoding Sampling
eDNA sampling. We sampled the water within a waterbody for eDNA analysis each night between 18:30 and 19:30, each site sampled for one night. For each sample waterbody, we chose 5 sampling sites along the bank at random and collected 400 mL of surface water at each site using sterile bottles. We then mixed one replicate from each of the 5 sites into one bottle to obtain three bottles with 2000 mL of water each. For each waterbody, we replicated the experiment 3 times.
We used 1.5 µm glass fiber (GF) filters and filtered each water sample until the filter was blocked. To control for possible contamination of equipment or cross-contamination among waterbodies, for each replicate, a negative control was created by filtering 1000 mL of ultrapure water (one filter) (Lan Hai Co., Ltd., Guangzhou, China). The filters were kept in ethanol in a 1.5 mL screw-cap microcentrifuge tube on ice. All the tubes were stored at –20 °C in a laboratory until DNA extraction was performed. Before sampling each waterbody, we eliminated any DNA attached to the bottles and filtering equipment using 10% commercial bleach (approximately 0.5% hypochlorous acid) and then washed the bottles using DNA-free distilled water. The samples from each waterbody were collected and filtered by individuals wearing disposable, nonpowdered latex gloves.
PCR and sequencing. We extracted mitochondrial DNA (mtDNA) from the filters of each water sample using a General AllGen Kit (Beijing CoWinBiotech Co., Ltd., Beijing, China) [33], which generated 100 µL of DNA extract. We amplified DNA from a short fragment of the 12S rRNA mitochondrial gene in a mixture that included 2 µL of DNA extract as a template, 1 U of Start Taq DNA Polymerase, 0.2 mM of each dNTP, 0.2 IM of the batra_F (5′-ACACCGCCCGTCACCCT-3′) and batra_R (5′-GTAYACTTATGTTACTT-3′) primers [33] and 4 µM of the human blocking primer batra_blk (5′-TCACCCTCCTCAAGTATACTTCAAAGGCA-SPC3I-3′) [34]. The ‘batra’ primers were used for the amplifications because they have a high proportion of sequences related to amphibian and fish species (99.28%) and show high taxonomic discrimination [34]. The primers (batra_F and batra_R) were 5′ labeled with a unique six-nucleotide tag (with at least three differences between tags), so we could differentiate all the samples and assign sequences to the individual samples during the sequence filtering process by the primer tags. The PCR mixture was denatured at 94 °C for 5 min; this was followed by 35 cycles of 30 s at 94 °C, 30 s at 58 °C and 30 s at 72 °C; the final elongation step was performed at 72 °C for 10 min. The PCR was run for 9 replicates per sample. Additional negative controls were generated using ddH2O (instead of the filters) during DNA extraction and PCR. According to the study in [35], we used DNA extract from Lithobates catesbeianus as a positive control to verify whether the amplification of DNA from the target species in the eDNA samples failed due to inhibition of the PCR [36,37]. We ran parallel PCR assays of the negative (including negative field controls and PCR processing controls) and positive controls. The amplification and the DNA extract was performed in isolated rooms.
Before preparing the libraries, we examined the quality of each PCR product based on fluorescent signals using gel electrophoresis. All the negative controls (negative field controls and PCR processing controls) showed a lack of PCR products following gel electrophoresis. Each PCR product was pooled in equal volume to construct a library for the expected sequencing depth of 300,000 reads per sample. We prepared libraries using the DNA Sample Prep Reagent Set (MyGenostics, Beijing, China), which included end repair and adapter ligation. We built 9 libraries for the PCR products from the water samples, with each library having 32 samples (totaling 288 samples), two libraries for the negative controls (one for the PCR control and one for the field control) and one library for the positive controls. The DNA for libraries were further purified before sequencing using SPRI beads according to the manufacturer’s protocol. The enrichment libraries were sequenced on an Illumina HiSeq X Ten sequencer with paired-end readings of 150 bp.
Bioinformatics analysis. We filtered and annotated the eDNA sequence reads using functions implemented in the OBITools package [32]. We assembled direct and reverse strands to construct consensus sequences and then removed low-quality sequences from the consensus sequences (FASTQ average quality score <35) using the Illumina paired-end program. We identified each sequence record by its corresponding sample based on its molecular tag (no errors allowed) and assigned primers (2 bp errors per primer allowed) to PCR products using the ‘ngsfilter’ function. Unaligned sequences were removed from the datasets with the ‘obigrep’ function. For each library, we clustered strictly identical sequences into operational taxonomic units (OTUs) using the ‘obiuniq’ function to keep the information from their read counts. With the ‘obigrep’ function, we removed sequences with lengths that were too long (>130 bp) or too short (<30 bp), deleted OTUs with read counts ≤10, and kept only the OTUs with total read counts >10 for the denoising analysis [33]. We labeled the sequences in each library as ‘head’, ‘singleton’, or ‘internal’ (most likely due to amplification/sequencing errors and chimeric sequences) using the ‘obiclean’ function [32]. We then removed the ‘singleton’ and ‘internal’ sequences from each library and kept only the ‘head’ sequences for taxonomic assignment (options –r 0.05 -H) [38]. We downloaded the gene sequence data from the EMBL database (release 124), National Center for Biotechnology Information (NCBI); these data included information on different taxonomic groups (vertebrates, mammals, prokaryotes, fungi, invertebrates and plants) and environmental samples. We constructed the NCBI database of 12S rRNA mitochondrial sequences based on the downloaded data using ecoPCR [31]. Sequences from the samples and negative and positive controls were assigned taxonomy according to the National Center for Biotechnology Information (NCBI) reference database and local amphibian reference database using the ecotag tool. Sequences were assigned to a database sequence based on a 95% similarity threshold.
2.5. Statistical Analyses
We compared the list of species, genera and families obtained from eDNA sampling with that obtained by traditional sampling. For each sample, we calculated the percentage of species detected by each method; that is, we divided the number of species detected by one method by the total number of species detected.
In addition to the observed species richness measurements, we also calculated the richness estimates for data obtained by traditional survey methods and eDNA methods using Chao2 richness estimates [39,40]. A 95% confidence interval was calculated to test the difference in estimated richness among the sampling methods.
Then, we tested the consistency of the diversity patterns determined based on the two methods at each site. We calculated the species richness according to the data obtained with the two sampling methods at each site and tested their correlation with Pearson’s correlation coefficient. We calculated the relative incidence of species as the percentage of sites where species were found and used Kendall’s rank correlation coefficient to test whether the occurrence patterns were related.
All the statistical analyses were performed using R 3.3.2 [41], the "vegan" package (version 2.4-1) [42], and the “dunn.test” package (version 1.3.4) [43]. The significance level was fixed at p < 0.05.
3. Results
Using traditional methods, we detected 9 amphibian species in Hainan (Table 2). After sampling with the TLTM, eDNA was collected from water samples. Specimens of two species were collected, and data for 17 species were downloaded from the NCBI database. The sequences of 28 species were obtained. There were 17 species of amphibians in Hainan that were neither collected nor found in the NCBI database. A total of 626,468,064 sequences were obtained in the eDNA analysis, and 25,472,437 sequences remained after quality control filtering. After comparison with the NCBI library, a total of 38 orders, 56 families and 110 species remained (Table S2). Based on comparison with the local database, 193,933 sequences were identified as amphibians local to Hainan.
A total of 15 local Hainan amphibian species were identified by the eDNA method from 288 sample points, while 9 species of local Hainan amphibian species were detected by the traditional methods (Table 2); Fejervarya kawamurai, Kaloula pulchra, Limnonectes fragilis, Microhyla butleri, Micryletta inornata, and Occidozyga martensii were not detected by the TLTM. The Chao2 estimates of amphibian abundance show that the eDNA metabolite method (15 species) resulted in a higher number of species than the traditional method (9 species) (Table 3). The observed and estimated values of species richness based on the eDNA method are higher than those based on the traditional sampling methods.
Table 3.
Overall species richness of the 18 regions. Species richness represents the number of species observed by the eDNA metabarcoding method or traditional sampling method. Chao II represents the bias-corrected Chao II estimates, with the 95% confidence interval in parentheses.
In the 18 areas of Hainan sampled, 95.1 ± 19.8% of species were detected by eDNA. The TLTM detected 56.8 ± 24.8% of species. A total of 51.9 ± 26.1% species were detected by both methods (Figure 2). The percentage of total species detected by each method was different (Wilcoxon rank sum test: p < 0.001) (Figure 3a), and the proportion of species detected by eDNA was higher than that detected by traditional methods.
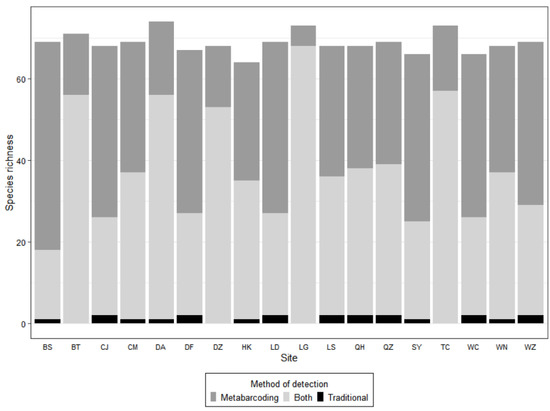
Figure 2.
Species richness per site as detected with traditional and eDNA metabarcoding methods. The species caught only with traditional methods are shown in black, those detected only with the metabarcoding method are shown in dark gray, and those detected by both metabarcoding and traditional methods are shown in light gray.
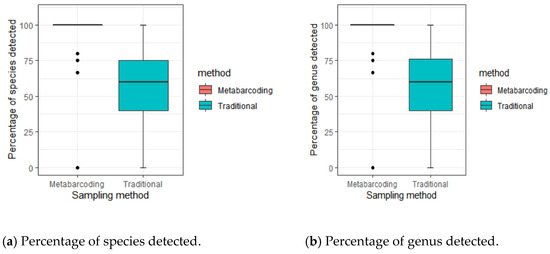
Figure 3.
Percentage of species detected during each visit with the metabarcoding (red) or traditional (blue) methods. The differences between the eDNA and traditional methods were tested using a Wilcoxon rank sum test (p < 0.001).
The eDNA method detected a high proportion of genera. A total of 95.1 ± 19.8% of genera were detected with the eDNA method. The TLTM allowed detection of 56.9 ± 24.8% of genera. A total of 52.1 ± 26.2% of genera were detected by both methods. The percentage of total genera detected by the two methods was different (Wilcoxon rank sum test: p < 0.001). The number of genera detected by the eDNA method was greater than that detected by the traditional survey method (Figure 3b).
The percentage of genera detected by the two methods was similar to the percentage of species detected by the two methods (Dunn random dominance test: z = 0.09, p = 0.46; Figure 4a,c).
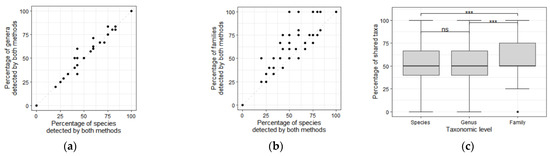
Figure 4.
Percentage of genera (a) and families (b) detected by either the eDNA or traditional methods compared to the percentage of species detected by both methods. The 1:1 line is represented by the dashed line in all plots; (c) Percentage of taxa detected by both the metabarcoding and traditional methods according to taxonomic level (species, genus and family). Differences between taxonomic levels were tested using Dunn’s test for stochastic dominance; ns: p > 0.05, ***: p < 0.001.
The eDNA method also detected more family-level species. The eDNA method detected 95.1 ± 19.8% of the first-class species. The TLTM detected 63.3 ± 25.2% of the first-class species. A total of 58.5 ± 27.6% of the first-class species were detected by both methods. The proportion of family-level species detected by the eDNA method in the 18 sampled areas was higher than the proportion detected by traditional methods (Wilcoxon rank sum test: p < 0.001).
The percentage of families detected by the two methods was higher than the percentage of species (Dunn test: z = 3.13, p < 0.001; Figure 4b,c) and genera (Dunn test: z = 3.04, p = 0.0011; Figure 4c) detected by the two methods.
Among the 288 sampling points in this survey, based on the traditional sampling method, the site with the highest species richness had 6 species, and the site with the lowest species richness had 0 species, with an average of 2.39 ± 1.35; based on the eDNA sampling method, the site with the highest species richness had 10 species, and the site with the lowest species richness had 0 species, with an average of 4.22 ± 1.7. Pearson correlation coefficient was used to test the correlation between these values. The species richness values estimated by the two methods were significantly correlated (r = 0.663, p < 0.001, Figure 5a).
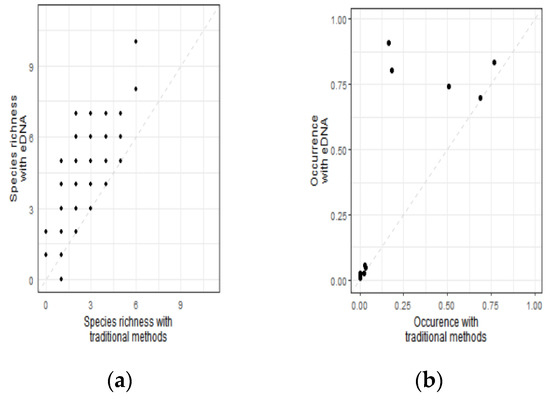
Figure 5.
Relationships between species richness (a) and species occurrences (b) determined by the metabarcoding and traditional methods for (a) all data. Species occurrences are expressed as the percentage of sites where a species was detected. The 1:1 line is represented by the dashed line on all plots.
Among the 15 amphibians investigated in this study, the species with the highest occurrence rate (76.7%) was observed 221 times by the traditional method (Table S3). The species with the lowest occurrence rate were investigated 0 times, with an occurrence rate of 0%, and the average occurrence rate was 15.9%. In the eDNA surveys, the species with the highest occurrence rate occurred 262 times, and the occurrence rate was 90.9%. The species with the lowest occurrence rate appeared three times, the occurrence rate was 1.04%, and the average occurrence rate was 28.1%. Kendall’s rank correlation coefficient was used to test the occurrence rate, and the species occurrence rates estimated by the two methods were also correlated (τ= 0.78, p = 0.0014, Figure 5b).
4. Discussion
As many amphibian habitats in Hainan are streams in remote mountainous areas, it is not feasible to conduct surveys with the TLTM at night. The main areas addressed by TLTM surveys are rivers, farmland, ponds, reservoirs and other areas that are greatly disturbed by human activities. Therefore, many local amphibian habitats in Hainan are not within the scope of TLTM surveys.
The detection of local species is not perfect, and many amphibians local to Hainan were not detected in this study; however, based on the abundance and occurrence rates of the investigated species, the number of species obtained from the eDNA samples is higher than that obtained from traditional methods. The proportion of species detected by eDNA was higher than that detected by traditional methods. The eDNA method can detect more concealed species, which are difficult to observe with the TLTM. Due to the high temperature, humidity and solar radiation, the plants in Hainan are highly diverse. The plant species in Hainan are mainly tropical, and the proportion of woody plants, especially trees, is very large, which makes it difficult to observe amphibians, which hide in trees, by traditional survey methods.
Despite its limitations, eDNA is a promising method for assessing Anura biodiversity in tropical areas. In view of the rarity of false species detection, the species richness values estimated by the two methods were significantly correlated (r = 0.663, p < 0.001). The species occurrence rates estimated by the two methods were also correlated (τ = 0.78, p = 0.0014).
Our results confirm that eDNA significantly enhances biodiversity surveys and can be applied to overcome many challenges associated with traditional monitoring methods [15]. Due to strict quality control and careful evaluation of positive detections, eDNA surveys have great potential for detecting species with low population density and can detect more concealed species than other methods. Therefore, the analysis of eDNA can be used as a rapid assessment method for biodiversity in neotropical areas, and eDNA should be used as a supplementary tool in addition to traditional methods [44].
5. Conclusions
As with any other survey method, strict quality control of eDNA data is important to avoid the false reporting of missing species (false positive) or undetected species (false negative). A complete reference database is essential to avoid miscalculation, especially in highly biodiverse environments [45]. We carefully examined the inference of target species detection to avoid false positives. We considered the ability of 12S rRNA to differentiate local species. We also tested whether the DNA traces of the target species detected at the survey site were consistent with the species investigated by traditional methods in the study environment.
Environmental DNA can also lead to imperfect detection and biased results. For example, primer bias may lead to false negatives [15]. During the sampling process, we did not discover nearby undetected species. Amphibians breed in the rainy season. In this survey, we did not sample in the rainy season, which reduced our detection ability. In addition, the diffusion of eDNA differs by habitat. In streams, eDNA can be detected in the range of several meters to several tens of kilometers from the source according to the velocity and turbulence of the streamflow [15]. Sampling of more conservative niches, such as ponds, must take into account the occupancy and connectivity of the water body. There are 154 rivers flowing into the sea on Hainan Island, 39 of which have a water area of more than 100 square kilometers. A complex water environment will reduce the monitoring ability of eDNA. In addition, in tropical areas, the adverse effects of high temperatures on eDNA should be considered [46].
Our results support the potential application of eDNA in investigating species diversity in tropical regions [14,38,47,48]. The diversity of amphibians in Hainan is high. However, the exact distribution and number of these amphibians is often unknown. In future work, environmental DNA and other survey methods should be applied to describe the geographical range, population fluctuation and conservation status of species.
Our study confirmed the ability of eDNA sampling to detect threatened aquatic wildlife. As an effective monitoring method, eDNA sampling could be applied to other taxa of conservation concern. Of course, eDNA sequences cannot reveal the health status or recovery potential of amphibian populations, but they clearly indicate that further assessment and protection are needed.
Supplementary Materials
The following are available online at https://www.mdpi.com/article/10.3390/d13090440/s1, Table S1: Coordinate of 288 sites on Hainan island, Table S2: Order assigned using NCBI database, Table S3: Species occurrences, expressed as the percentage of sites where each species was found using eDNA metabarcoding or traditional methods.
Author Contributions
Conceptualization, Y.L. and W.L.; methodology, W.L.; software, W.L.; laboratory work, W.L., X.H., C.X. and M.Q.; formal analysis, C.X.; investigation, W.L. and T.S.; data curation, W.L.; writing—original draft preparation, W.L.; writing—review and editing, W.L.; project administration, Y.L.; funding acquisition, Y.L. All authors have read and agreed to the published version of the manuscript.
Funding
This study was supported by grants from National Science Foundation of China (32030070) and Second Tibetan Plateau Scientific Expedition and Research (STEP) Program (2019QZKK0501).
Institutional Review Board Statement
The study was conducted according to the guidelines of the Declaration of Helsinki.
Conflicts of Interest
The authors declare no conflict of interest.
References
- Ceballos, G.; Ehrlich, P.R.; Barnosky, A.D.; García, A.; Pringle, R.M.; Palmer, T.M. Accelerated modern human-induced species losses: Entering the sixth mass extinction. Sci. Adv. 2015, 1, e1400253. [Google Scholar] [CrossRef] [Green Version]
- Scheele, B.C.; Pasmans, F.; Skerratt, L.F.; Berger, L.; Martel, A.N.; Beukema, W.; Acevedo, A.A.; Burrowes, P.A.; Carvalho, T.; Catenazzi, A.; et al. Amphibian fungal panzootic causes catastrophic and ongoing loss of biodiversity. Science 2019, 363, 1459–1463. [Google Scholar] [CrossRef] [PubMed]
- Becker, C.G.; Fonseca, C.R.; Haddad, C.F.B.; Batista, R.F.; Prado, P.I. Habitat split and the global decline of amphibians. Science 2007, 318, 1775–1777. [Google Scholar] [CrossRef] [PubMed] [Green Version]
- Wake, D.B.; Vredenburg, V.T. Are we in the midst of the sixth mass extinction? A view from the world of amphibians. Proc. Natl. Acad. Sci. USA 2008, 105, 11466–11473. [Google Scholar] [CrossRef] [Green Version]
- Murphy, B.R.; Willis, D.W. Fisheries Techniques; American Fisheries Society: Bethesda, MD, USA, 1996. [Google Scholar]
- Deiner, K.; Bik, H.M.; Mächler, E.; Seymour, M.; Lacoursière-Roussel, A.; Altermatt, F.; Creer, S.; Bista, I.; Lodge, D.M.; De Vere, N.; et al. Environmental DNA metabarcoding: Transforming how we survey animal and plant communities. Mol. Ecol. 2017, 26, 5872–5895. [Google Scholar] [CrossRef] [PubMed]
- Thomsen, P.F.; Willerslev, E. Environmental DNA—An emerging tool in conservation for monitoring past and present biodiversity. Biol. Conserv. 2015, 183, 4–18. [Google Scholar] [CrossRef]
- Yates, M.C.; Fraser, D.J.; Derry, A.M. Meta-analysis supports further refinement of eDNA for monitoring aquatic species-specific abundance in nature. Environ. DNA 2019, 1, 5–13. [Google Scholar] [CrossRef]
- Lawson Handley, L. How will the ‘molecular revolution’ contribute to biological recording? Biol. J. Linn. Soc. 2015, 115, 750–766. [Google Scholar] [CrossRef] [Green Version]
- Hänfling, B.; Lawson Handley, L.; Read, D.S.; Hahn, C.; Li, J.; Nichols, P.; Blackman, R.C.; Oliver, A.; Winfield, I.J. Environmental DNA metabarcoding of lake fish communities reflects long-term data from established survey methods. Mol. Ecol. 2016, 25, 3101–3119. [Google Scholar] [CrossRef] [Green Version]
- Lim, N.K.; Tay, Y.C.; Srivathsan, A.; Tan, J.W.; Kwik, J.T.; Baloğlu, B.; Meier, R.; Yeo, D.C. Next-generation freshwater bioassessment: eDNA metabarcoding with a conserved metazoan primer reveals species-rich and reservoir-specific communities. R. Soc. Open Sci. 2016, 3, 160635. [Google Scholar] [CrossRef] [Green Version]
- Thomsen, P.F.; Moller, P.R.; Sigsgaard, E.E.; Knudsen, S.W.; Jorgensen, O.A.; Willerslev, E. Environmental DNA from Seawater Samples Correlate with Trawl Catches of Subarctic, Deepwater Fishes. PLoS ONE 2016, 11, e0165252. [Google Scholar] [CrossRef] [Green Version]
- Li, J.; Hatton-Ellis, T.W.; Lawson Handley, L.J.; Kimbell, H.S.; Benucci, M.; Peirson, G.; Hänfling, B. Ground-truthing of a fish-based environmental DNA metabarcoding method for assessing the quality of lakes. J. Appl. Ecol. 2019, 56, 1232–1244. [Google Scholar] [CrossRef]
- Lopes, C.M.; Baêta, D.; Valentini, A.; Lyra, M.L.; Sabbag, A.F.; Gasparini, J.L.; Dejean, T.; Haddad, C.F.B.; Zamudio, K.R. Lost and found: Frogs in a biodiversity hotspot rediscovered with environmental DNA. Mol. Ecol. 2021, 30, 3289–3298. [Google Scholar] [CrossRef]
- Taberlet, P.; Bonin, A.; Zinger, L.; Coissac, E. Environmental DNA for Biodiversity Research and Monitoring; Oxford University Press: Oxford, UK, 2018. [Google Scholar]
- Nichols, R.V.; Vollmers, C.; Newsom, L.A.; Wang, Y.; Heintzman, P.D.; Leighton, M.; Green, R.E.; Shapiro, B. Minimizing polymerase biases in metabarcoding. Mol. Ecol. Resour. 2018, 8, 927–939. [Google Scholar] [CrossRef] [PubMed] [Green Version]
- Li, W.; Hou, X.; Xu, C.; Qin, M.; Wang, S.; Wei, L.; Wang, Y.; Liu, X.; Li, Y. Validating eDNA measurements of the richness and abundance of anurans at a large scale. J. Anim. Ecol. 2021, 90, 1466–1479. [Google Scholar] [CrossRef]
- Strickler, K.M.; Fremier, A.K.; Goldberg, C.S. Quantifying effects of UV-B, temperature, and pH on eDNA degradation in aquatic microcosms. Biol. Conserv. 2015, 183, 85–92. [Google Scholar] [CrossRef]
- Lindahl, T. Instability and decay of the primary structure of DNA. Nature 1993, 362, 709–715. [Google Scholar] [CrossRef]
- Pilliod, D.S.; Goldberg, C.S.; Arkle, R.S.; Waits, L.P. Factors influencing detection of eDNA from a stream-dwelling amphibian. Mol. Ecol. Resour. 2014, 14, 109–116. [Google Scholar] [CrossRef] [PubMed]
- Heyer, R.; Donnelly, M.A.; Foster, M.; Mcdiarmid, R. Measuring and Monitoring Biological Diversity: Standard Methods for Amphibibas; Smithsonian Institution Press: Washington, DC, USA; London, UK, 1994; pp. 103–107. [Google Scholar]
- Rödel, M.O.; Ernst, R. Measuring and Monitoring Amphibian Diversity in Tropical Forests. I. An Evaluation of Methods with Recommendations for Standardization. Soc. Trop. Ecol. 2004, 10, 1–14. [Google Scholar]
- Li, Y.; Xu, F.; Guo, Z.; Liu, X.; Jin, C.; Wang, Y.; Wang, S. Reduced predator species richness drives the body gigantism of a frog species on the Zhoushan Archipelago in China. J. Anim. Ecol. 2011, 80, 171–182. [Google Scholar] [CrossRef]
- Ribeiro-Júnior, M.A.; Gardner, T.A.; Ávila-Pires, T.C.S. Evaluating the Effectiveness of Herpetofaunal Sampling Techniques across a Gradient of Habitat Change in a Tropical Forest Landscape. J. Herpetol. 2008, 42, 733–749. [Google Scholar] [CrossRef]
- Yiming, L.; Zhengjun, W.; Duncan, R.P. Why islands are easier to invade: Human influences on bullfrog invasion in the Zhoushan archipelago and neighboring mainland China. Oecologia 2006, 148, 129–136. [Google Scholar] [CrossRef]
- Yiming, L.I.; Niemelä, J.; Dianmo, L.I. Nested Distribution of Amphibians in the Zhoushan archipelago, China: Can Selective Extinction Cause Nested Subsets of Species? Oecologia 1998, 113, 557–564. [Google Scholar] [CrossRef]
- Liu, X.; Wang, S.; Ke, Z.; Cheng, C.; Wang, Y.; Zhang, F.; Xu, F.; Li, X.; Gao, X.; Jin, C.; et al. More invaders do not result in heavier impacts: The effects of non-native bullfrogs on native anurans are mitigated by high densities of non-native crayfish. J. Anim. Ecol. 2018, 87, 850–862. [Google Scholar] [CrossRef] [PubMed]
- Haitao, S.; Ermi, Z.; Lijun, W. Amphibians and Reptiles in Hainan; Science Press: Beijing, China, 2011. [Google Scholar]
- Bai, C.; Liu, X.; Fisher, M.C.; Garner, T.W.J.; Li, Y. Global and endemic Asian lineages of the emerging pathogenic fungus Batrachochytrium dendrobatidis widely infect amphibians in China. Divers. Distrib. 2012, 18, 307–318. [Google Scholar] [CrossRef]
- Wang, S.; Zhu, W.; Gao, X.U.; Li, X.; Yan, S.; Liu, X.; Yang, J.; Gao, Z.; Li, Y. Population size and time since island isolation determine genetic diversity loss in insular frog populations. Mol. Ecol. 2014, 23, 637–648. [Google Scholar] [CrossRef] [PubMed]
- Ficetola, G.F.; Coissac, E.; Zundel, S.; Riaz, T.; Shehzad, W.; Bessière, J.; Taberlet, P.; Pompanon, F. An in silico approach for the evaluation of DNA barcodes. BMC Genom. 2010, 11, 434. [Google Scholar] [CrossRef] [PubMed] [Green Version]
- Boyer, F.; Mercier, C.; Bonin, A.; Le Bras, Y.; Taberlet, P.; Coissac, E. Obitools: A unix-inspired software package for DNA metabarcoding. Mol. Ecol. Resour. 2016, 16, 176–182. [Google Scholar] [CrossRef]
- He, L.; Miao, X.; Lv, G.; Yang, P.; Wu, W.; Jia, L. Nutritional rehabilitation of mitochondrial aberrations in aplastic anaemia. Br. J. Nutr. 2011, 105, 1180–1187. [Google Scholar] [CrossRef] [Green Version]
- Valentin, R.E.; Maslo, B.; Lockwood, J.L.; Pote, J.; Fonseca, D.M. Real-time PCR assay to detect brown marmorated stink bug, Halyomorpha halys (Stal), in environmental DNA. Pest Manag. Sci. 2016, 72, 1854–1861. [Google Scholar] [CrossRef] [PubMed]
- Dejean, T. Improved detection of an alien invasive species through environmental DNA barcoding: The example of the Ameriacan bullfrog Lithobates catesbeianus. J. Appl. Ecol. 2012, 49, 953–959. [Google Scholar] [CrossRef]
- Goldberg, C.S. Critical considerations for the application of environmental DNA methods to detect aquatic species. Methods Ecol. Evol. 2016, 7, 1299–1307. [Google Scholar] [CrossRef]
- McKee, A.M. The effect of dilution and the use of a post-extraction nucleic acid purification column on the accuracy, precision, and inhibition of environmental DNA samples. Biol. Conserv. 2015, 183, 70–76. [Google Scholar] [CrossRef]
- Bálint, M.; Nowak, C.; Márton, O.; Pauls, S.U.; Wittwer, C.; Aramayo, J.L.; Jansen, M. Accuracy, limitations and cost efficiency of eDNA-based community survey in tropical frogs. Mol. Ecol. Resour. 2018, 18, 1415–1426. [Google Scholar] [CrossRef]
- Chao, A. Estimating the population size for capture-recapture data with unequal catchability. Biometrics 1987, 43, 783–791. [Google Scholar] [CrossRef]
- Chiu, C.H.; Wang, Y.T.; Walther, B.A.; Chao, A. An improved nonparametric lower bound of species richness via a modified good-turing frequency formula. Biometrics 2014, 70, 671–682. [Google Scholar] [CrossRef]
- R Core Team. R: A Language and Environment for Statistical Computing; R Foundation for Statistical Computing: Vienna, Austria, 2015; Available online: http://www.R-project.org/ (accessed on 3 May 2021).
- Oksanen, J.; Blanchet, F.G.; Friendly, M.; Kindt, R.; Legendre, P.; McGlinn, D.; Stevens, M.H.H. VEGAN: Community Ecology Package. R Package Version 2.4-1. 2016. Available online: https://CRAN.R-project.org/package=vegan (accessed on 3 May 2021).
- Dinno, A. Dunn. Test: Dunn’s Test of Multiple Comparisons Using Rank Sums. R Package Version 1.3.4. 2017. Available online: https://CRAN.R-project.org/package=dunn.test (accessed on 3 May 2021).
- Ficetola, G.F.; Boyer, F.; Valentini, A.; Bonin, A.; Meyer, A.; Dejean, T.; Gaboriaud, C.; Usseglio-Polatera, P.; Taberlet, P. Comparison of markers for the monitoring of freshwater benthic biodiversity through DNA metabarcoding. Mol. Ecol. 2021, 30, 3189–3202. [Google Scholar] [CrossRef]
- Zinger, L.; Donald, J.; Brosse, S.; Gonzalez, M.A.; Iribar, A.; Leroy, C.; Lopes, C.M. Advances and Prospects of Environmental DNA in Neotropical Rainforests; Academic Press: Cambridge, MA, USA, 2020; Volume 62, pp. 331–373. [Google Scholar]
- Tsuji, S.; Ushio, M.; Sakurai, S.; Minamoto, T.; Yamanaka, H. Water temperature-dependent degradation of environmental DNA and its relation to bacterial abundance. PLoS ONE 2017, 12, e0176608. [Google Scholar] [CrossRef] [PubMed]
- Cilleros, K.; Valentini, A.; Allard, L.; Dejean, T.; Etienne, R.; Grenouillet, G.; Iribar, A.; Taberlet, P.; Vigouroux, R.; Brosse, S. Unlocking biodiversity and conservation studies in high-diversity environments using environmental DNA (eDNA): A test with Guianese freshwater fishes. Mol. Ecol. Resour. 2019, 19, 27–46. [Google Scholar] [CrossRef] [PubMed] [Green Version]
- Sasso, T.; Lopes, C.M.; Valentini, A.; Dejean, T.; Zamudio, K.R.; Haddad, C.F.; Martins, M. Environmental dna characterization of amphibian communities in the brazilian atlantic forest: Potential application for conservation of a rich and threatened fauna. Biol. Conserv. 2017, 215, 225–232. [Google Scholar] [CrossRef] [Green Version]
Publisher’s Note: MDPI stays neutral with regard to jurisdictional claims in published maps and institutional affiliations. |
© 2021 by the authors. Licensee MDPI, Basel, Switzerland. This article is an open access article distributed under the terms and conditions of the Creative Commons Attribution (CC BY) license (https://creativecommons.org/licenses/by/4.0/).