Article

Characterization of Captive Breeders to Preserve the Residual Genetic Diversity of Adriatic Sturgeon (Acipenser naccarii)

1
Department of Biology, University of Padova, Via Ugo Bassi 58b, 35121 Padova, Italy
2
Department of Environmental and Prevention Sciences, University of Ferrara, Via L. Borsari 46, 44121 Ferrara, Italy
3
NBFC, National Biodiversity Future Center, 90133 Palermo, Italy
*
Author to whom correspondence should be addressed.
These authors contributed equally to this work.
Diversity 2022, 14(10), 829; https://doi.org/10.3390/d14100829
Submission received: 13 September 2022 / Revised: 28 September 2022 / Accepted: 29 September 2022 / Published: 2 October 2022
(This article belongs to the Special Issue Conservation Genetics of Sturgeons)

Abstract

:
Since 1996, the Adriatic sturgeon (Acipenser naccarii) has been inscribed on the IUCN Red List as “Critically Endangered and possibly extinct in the wild”. Nowadays, its survival totally depends on restocking programs conducted by releasing juveniles generated from adult breeders reared in aquaculture. Conducting accurate genetic characterizations of all individuals potentially involved in reproduction activities is therefore of primary importance to avoid inbreeding and to maximize the genetic diversity transmitted to following generations. Since all animals reared in captivity descend from a single stock of wild origin, this offers the ideal condition for carrying out relatedness analysis based on parentage allocations. In this study, we provided the most complete characterization of about 500 individuals representing the most diverse extant stock of Adriatic sturgeon. Through the analyses of mitochondrial d-loop and 15 microsatellite loci selected from 24 genotyped loci, we identified about 30 different familiar groups, updating data on breeding stocks, increasing the genetic information already available, and extending the analyses to animals never genotyped before. Given its completeness, it will represent a reference database for any future parental allocation of recaptured animals for the inclusion of all other stocks present, as well as for the development of a long-term breeding plan. The approach used has also been proven useful on individuals of unknown genealogy, allowing for the identification of family groups and thus being proven to be promising for the analysis of stocks of other tetraploid sturgeon species.

Graphical Abstract

1. Introduction

The latest IUCN (International Union for Conservation of Nature) sturgeon assessment, released on 21 July 2022, showed a worsening of the group of species, which was already at greatest risk of extinction in the world since 2010. Among these, the Adriatic sturgeon (Acipenser naccarii, Bonaparte 1836), endemic to the North Adriatic region, showed an opposite trend if compared to other sturgeon species. Indeed, it has had an improvement in its reclassification from “Critically Endangered and possibly extinct in the wild” to simply “Critically Endangered”. Its extinction has so far been avoided also thanks to captive breeding programs started in 1977, just before the species almost disappeared in nature, by transferring about 90 immature wild individuals (hereafter F0) from the Po River to a private aquaculture plant, the Azienda Agricola V.I.P. (Orzinuovi, Brescia, Italy). Fifty of these animals survived and reached sexual maturity after about 10 years. In 1988, the first successful reproduction of the species in captivity was obtained [1,2], paving the way for a constant propagation effort that allowed generating more than 30 F1 stocks in more than 30 years by crossing different F0 breeders [3]. Juveniles obtained were mostly used for reintroduction purposes, and over 500,000 animals were released under several independent and uncoordinated restocking programs [4]. Since then, occasional captures have been reported, but up to now, very few and indirect pieces of evidence of natural reproduction are available [5], and the persistence of the species in the wild still depends on reintroduction programs and on the proper management of residual genetic diversity.
After more than 40 years from its establishment, the F0 stock is now reduced to a few individuals, which represent the only living animals of certain wild origin. Now, mature F1s are being used for reproductions. In fact, part of the progenies from each F0 cross performed over the years has been retained in captivity as future breeders by different public authorities as well as by the Azienda Agricola V.I.P. itself. As expected, this stock resulted in a remarkably higher genetic diversity compared with all other stocks established by only using a very small number of sibling groups [3,6,7]. In any case, all animals bred in captivity in Italy and abroad descend directly from the F0 stock, potentially easing the genetic analysis required to reconstruct their pedigree but, nevertheless, the precise genealogy of each individual and the consequent degree of kinship is still unknown for most stocks. Therefore, a careful survey of all Adriatic sturgeons held in captivity in the different plants and an exhaustive assessment of the number and size of existing family groups are a priority to inform optimal strategies for the management of a living bank of Adriatic sturgeon.
In fact, the future of this species now relies on the correct management of F1 stocks with special attention to maximizing the level of genetic variation transmitted to future generations [3], thus maintaining the highest possible level of long-term adaptive potential. Recently, the Pan European Action Plan [8], approved by the Berne Convention and included in the Habitats Directive of the European Community, highlighted the importance of a coordinated effort to optimize conservation strategies, including the management of genetic heritage. Fortunately, the owners of the above-mentioned most biodiverse stock of this species, previously reared by the V.I.P. but currently acquired by the company “Sturgeon Ticino”, agreed to carry out a complete genotyping of their stocks, hopefully setting the basis for a complete genetic characterization of all A. naccarii individuals present in captivity. Most of these stocks are in Italy, but a few of them are in other European countries such as Spain [9]. The present work, by proposing a standardized approach to the analyses of genetic diversity in polyploid sturgeons, reports the results of this characterization aimed at identifying the number of family groups and their size, providing the information for a long-term crossbreeding plan.

2. Materials and Methods

2.1. Sampling and Molecular Markers Used

In the present work, the genetic diversity of a total of 42 individuals of wild origin (F0; 20 males and 22 females) and 505 individuals of first-generation (F1) of A. naccarii were analyzed through mitochondrial and nuclear markers.
For the historical 42 F0 and for 418 F1 individuals born along the last 20 years in captivity and sampled in 2011, the purification of genomic DNAs and a preliminary parental allocation, which was based on sequencing of the mitochondrial control region and genotyping of seven microsatellite loci (Table S1), were already performed [3].Here, the genotype information at an additional 17 microsatellite loci (Table S1) was obtained, eight of which (AnacB11, AnacB7 [10], Spl120 [11], AfuG132, AfuG112 [12], Anac_c15214 [13], AoxD161, and AoxD241 [14]; Table S1) yielded suitable information to be used in parental allocation. These were therefore added to the previously used seven loci to provide updated genealogy reconstructions based on 15 loci. A significant fraction of these 418 animals died in an unfortunate poisoning event some years ago, but we have decided to include them in the analyses anyway because the hundreds of thousands of animals released as juveniles in the past came from the same crosses, and a good representation of the diversity of all family groups generated in the last decades can facilitate genetic tagging of the recaptures. For the remaining 87 individuals born after 2011 that were never characterized before, all 24 microsatellite loci and mitochondrial d-Loop were aanalyzed (Table S1).
Genomic DNA was purified from fin clips with the EuroGOLD Tissue Mini Kit (EuroClone) and stored at −4 °C before the amplification. The mitochondrial control region was amplified using the Pro1F-Phe1R primer pair following the conditions described in the original reference [6]. After enzymatic purification with ExoSAP-ITTm (Usb), sequencing reactions were performed availing the Applied Biosystem Automatic Sequencer at the Eurofins Genomics sequencing service (Ebersberg, Germany, https://eurofinsgenomics.eu/, accessed on 13 September 2022), and chromatograms were analyzed with MEGAX software [15]. For microsatellite analyses, the seven loci previously used were amplified in single PCR reactions and then assembled for genotyping (Multiplex M0 in Table S1) following the same protocols used during past genetic characterization of the same stock [3]. The panel of 17 new loci was amplified in two multiplex reactions, M1 and M2 (Table S1), using the Multiplex PCR Master Mix (QIAGEN); the thermal profile was 15′ at 95 °C, 35 cycles of 30″ at 94 °C, 90″ at 60 °C, 60″ at 72 °C, and 30′ at 60 °C. Locus Afug113 was amplified in single touchdown PCR reaction and then assembled in M1; loci AoxD241, Afug112, and AnacB7 were also individually amplified and assembled to M2. Further information about loci used (e.g., primer sequences, size ranges, multiplexing, locus-specific thermal profiles, original references) are detailed in Table S1.
PCR products were genotyped at the BMR Genomics (external service, Padova, Italy, https://www.bmr-genomics.it/, accessed on 13 September 2022), and allele scoring was performed using GENEMARKER software version 1.95 (SoftGenetics LLS).

2.2. Parental Allocation Analysis

For a total of 505 individuals successfully genotyped, parental allocation was carried out to reconstruct genealogy and identify full sibs or half sibs. The final microsatellite panel included 15 loci selected among the 24 genotyped. Besides the seven old loci already used in the past and also included in the hereafter analyses, nine loci of the new panel of 17 were finally not included (Table S1) in the parental allocation for different reasons: (i) the loci 2589, Anac_c14336, and Spl168 showed a number of alleles greater than four in many individuals, suggesting duplication of the analyzed region or unreduced ploidy, and in any case were not suitable for one of the parental allocation procedures used; (ii) loci Anac_c3133, Afug113, Afug41, and Spl-163 showed discordances between the genotypes obtained in multiplex and in single amplification; and (iii) the loci Anac_c12159 and Anac_c6784 presented an electropherogram difficult to interpret in part of the animals and were prone to bias in allele scoring. The recovery of these discarded loci would have required further fine-tuning and single-locus amplification on many animals, but given the good informative power of the retained loci, it was considered not necessary.
Given the tetraploid genome of the Adriatic sturgeon, the inference of the real genotype at a certain locus is not always possible, and the allelic frequencies can only be estimated; therefore, parental allocation analyses were implemented by using the software BreedingSturgeons, specifically developed for tetraploid sturgeon species [3]. Two different algorithms are followed: the standard band-sharing measure and a weighted estimation of segregating alleles from different possible parent pairs and putative offspring. The first and simpler one compares the alleles observed in the multi-locus profile of each F1 individuals with the ones of all possible pairwise combinations of breeders (one male and one female). If all the F1 alleles are present in a breeders’ pair, the parental compatibility is accepted, or otherwise is rejected. This first method, however, does not check for the satisfaction of Mendelian segregation, which is on the contrary assessed by the second approach in which for the three individuals under comparison (the two possible breeders and the F1 to be allocated), all possible tetraploid genotypes are inferred from the allele profiles at each locus and the inheritance of two alleles from each parent at all loci is verified. Breeders’ pairs that at each locus equally contribute to the generation of the F1 profile are considered totally compatible with an allocation score of 1. This second approach may also accept the possibility of scoring errors or segregation anomalies tolerating up to two loci with imperfect inheritance. On the basis of the number of anomalies at these two loci, an allocation score is accordingly calculated and accepted above a threshold of 0.866 [3]. Accepting discrepancies at a small fraction of loci, the software indirectly accepts allocations of those F1 that show (at those loci) alleles absent in the profile of the parent pair (a scenario which is not tolerate by the first method). However, in these cases the compatibility score is decreased. The two methods were both used, and the results were compared.
Finally, the mitochondrial haplotype of the identified mother was compared with the mitochondrial haplotype of the associated offspring to verify its concordance.

2.3. Analyses and Visualization of Pairwise Genetic Distances

Brotherhood among F1 animals can be inferred through parental allocation to the same parent pairs when parents are available; on the contrary, when they are not, alternative methods are needed. With the aim of testing an alternative empirical approach, we performed an estimation of pairwise genetic distances among all F1 animals, assuming that the more related are two genomes the lower is their genetic distance. Due to the tetraploid condition that precludes the possibility of assessing the exact allele dosage, we used the presence/absence information of the different alleles to estimate Sørensen’s distances [16] with the R package “Ade4” [17]. Pairwise distances were then visualized through multi-dimensional scaling performed with R package “ggplot2” [18]. Groups composed of three or more individuals of known relatedness were analyzed to validate the reliability of the approach, before applying it on animals with unknown genealogies.

3. Results

3.1. Pedigree Reconstruction

All 505 animals were successfully analyzed at 15 loci, and 357 of which, 216 still alive, were unambiguously allocated to their parental pair, identifying a total of 29 family groups (Table 1 and Table S2).
Of these, 26 confirm the previous allocation, even increasing the number of loci from 7 [3] to 15, further supporting past results. The only exceptions are five animals of the familiar groups 09, 18, and 25, which, compared to their past allocation, are now assigned to the same dam but to a different sire (Table S2). In these cases, the compatibility index of the previously selected parent pair decreased below the threshold due to some incompatibilities in the newly genotyped loci, and the compatibility index of the new parent pair increased as alleles at all newly genotyped loci resulted in being compatible. This is somewhat expected in re-analyzing relatedness and reconstructing pedigree information by adding loci.
The remnant two family groups (28 and 29, in Table 1) were never identified previously, even though the respective F0 individuals involved were already represented in other familiar groups. Unfortunately, the size of families, already small in some cases, was further reduced after poisoning, resulting in two family groups completely lost and 11 composed of three or less individuals, at least in the Storione Ticino Stock.
Seven individuals remained multi-allocated (compatible with more than one parent pair), indicating that, although the allocation power is expected to increase by adding eight new loci, in some cases it may still not be sufficient.
Finally, 141 A. naccarii were not allocated, probably because progeny of one or both parents died before our first sampling occurred in 2004.
The contribution of the different breeders to the F1 stock was strongly unbalanced, with only four breeders contributing to than 40% of the still alive F1, and some other breeders with no progeny at all or very few F1 in this stock (Figure 1). Out of the 26 wild breeders (14 males out of 20 and 12 females out of 22) that were successfully reproduced in the past and for which at least one F1 is still available, 9 and 15 were, respectively, the parents of about 50% and 70% of the stock. Approximately the same percentages were valid for both the total and the alive stocks.

3.2. Multi-Dimensional Scaling and Relatedness Inference

MDS analysis (Figure 2) was performed to visualize pairwise genetic distances among individuals belonging to F1 families with at least three animals. For a simple matter of clarity, individuals were separately analyzed according to their mitochondrial haplotypes, and the results were reported in three different panels (Figure 2a–c). The graph with the simultaneous analysis of all individuals is reported in Figure S1 of the Supplementary Materials. Individuals with haplotypes 5 and 7 were grouped, as haplotype 7 was sporadically observed mainly in heteroplasmy with haplotype 5.
In general, the MDS graphical representations were concordant with the results of parental allocations, and animals allocated to the same parental pair formed clear groups of similarity. Families sharing one parent (half-sibs) also tended to cluster together, such as families 02, 14, and 28 (Figure 2a); families 10 and 12 (Figure 2b); families 05, 13, and 19 (Figure 2b); and families 08 and 11 (Figure 2c). However, when a second run of the same analysis was performed, considering separately each of these cluster of half-sibs, the underlying families became better distinguishable, as in the example reported in Figure 2d in which families 10 and 12, overlapping when analyzed with all individuals with haplotype 3 (Figure 2b), were clearly separated; moreover, the two fathers and the common mother of these families took a coherent position in the graph.
The results of the same approach used on animals of unknown genealogy, after having grouped them according to the mitochondrial haplotype, are shown in Figure 2e,f. Although it is not possible to verify the results using paternity analyzes for these individuals where the parents are unknown, it is evident that there are groups of similarities, probably consisting of groups of siblings or half-siblings.

4. Discussion

This genetic characterization allowed for the deepening of the research already conducted in the past with a lower number of loci and extended it to all mature individuals reared at the Storione Ticino farm that had never been characterized before. To our knowledge, this is the most complete genetic characterization performed so far on a captive stock of a sturgeon species, with the aim of planning an informed production of juveniles to be released into the wild.
The stock of the Storione Ticino farm confirmed the presence of a significant degree of genetic diversity when compared to other F1 A. naccarii stocks [7]. Even if 29 families were apparently low on the basis of the theoretically maximum possible number of families obtainable from 20 F0 males and 22 F0 females, the fact that 26 out of 42 adults were reproduced in the past testifies a careful commitment in differentiating the breeders used, in an attempt to maximize residual genetic diversity. It should also be considered that some of the animals never became available for reproduction. Moreover, given that for 141 F1 individuals, no pairs of F0 parents were found to be compatible, we can reasonably assume that additional breeders were used in the past to generate these families and died before our sample collection, leaving their genetic heritage in their progenies and making them bearers of added value in terms of biodiversity. Unfortunately, some of the family groups were composed of very few individuals, and in some cases by a single animal. This represents a serious problem, firstly because one single individual is not representative of the genetic diversity of their parents, and second because not all animals become available for reproduction, especially females that in this species ovulate every two, three, or sometimes more years [19], and the probability of permanently losing these genetic lines is relevant [3]. This highlights the relevance of saving an adequate number of animals from each crossing and the importance of distributing the animals of the different genealogical lines in different plants to decrease the probability of disappearance due to accidental events [8]. As already mentioned, however, there are other stocks of A. naccarii [9], all descendants of the F0 stock analyzed in this study. There is, therefore, hope that representatives of some under- or non-represented families are present elsewhere. In any case, individuals belonging to these residual families should be considered a priority in planning future crossings.
The information provided here can be used to select the breeders to pair as well as to perform genetic allocations to parents of origin. For this reason, we decided to also perform the characterization on the 170 animals already dead due to an accidental poisoning [3] as they might have been used to generate fingerlings released in the wild. Moreover, since part of the animals of the analyzed broodstock were used to produce commercial caviar, the method proposed could also be suitable to certify the origin of products in trade.
The fact that full- and half-sibs are often not completely distinguishable is somewhat expected as the average distance within a family depends on the similarity of the two parents, which can significantly vary across families. This implies that, if the method is applied to identify groups of relatedness in stock for which parents are not available, distinguishing full- from half-sibs may be difficult. However, in these cases, we have shown that a second MDS run, performed only on individuals identified as somehow related in the first run, can provide a finer resolution. In any case, whatever the degree of kinship, their genetic proximity suggests not to use individuals of the same group as reproductive partners. In the present paper, the MDS representation was applied to animals with the same haplotypes, allowing for the detection of full sibs and maternal half-sibs (sharing the same mother). In doing this, however, paternal half-sibs (sharing the same father) would not be detected if the two mothers had different mitochondrial haplotypes. These kinds of full sibs could be identified only if all animals were simultaneously analyzed. This was not our case, as the MDS analyses of all animals did not allow for the identification of multi-haplotype clusters (Figure S1). This limit was possibly due to the high number of families present in the stock and the consequent homogeneous distribution of pairwise Sørensen’s distances. In any case, we suggest a preliminary overall analysis that, in the case of stocks descending from a low number of parents, could also allow for the detection of paternal half-sibs.
The availability of the F0 generation, besides facilitating the analyses of relatedness, allowed for validation of the alternative approach on the basis of the presence/absence of the different alleles, which is especially useful in the case of tetraploid species in which it is not possible to infer the exact genotype [6].
Having at our disposal the genotypes of most of the wild founders, the analysis of the relatedness among F1 was much easier than for stocks whose origin is unknown; however, the reliability of the method used here in identifying the groups of relatedness, even in the case of the not-allocated animals, makes it particularly useful for the analysis of all sturgeon stocks whose composition is unknown. In particular, the approach adopted here is useful for sturgeon species with a high degree of ploidy, for which standard approaches based on the knowledge of the genotype cannot be used. In fact, in polyploid genomes, even markers that in diploids are considered co-dominant, such as microsatellites or single-nucleotide polymorphisms (SNPs), do not allow for a precise inference of the genotype, forcing the use of phenotypic information of the presence/absence of the different alleles. This approach could be very useful for all polyploid species on the brink of extinction in nature but for which significant captive stocks are available, and thus a careful assessment of purity and relatedness is required in order to inform restocking measures. For example, this was the case for the Dabry sturgeon (Acipenser dabryanus, Duméril, 1869), recently assessed by IUCN (2022) as extinct in the wild, or of the Chinese sturgeon (Acipenser sinensis, Gray, 1835), for which very few wild breeders survive [20].
The different genetic characterizations carried out on this species have shown that the genome of A. naccarii, as well as probably of all the other sturgeon species, has a variable level of ploidy. In fact, in addition to the loci here analyzed, which were selected for the presence of a maximum of four alleles for individuals (indicating a probable tetraploidy), loci with a higher number of alleles were observed [13]. This can be explained by the presence of duplicate regions or as a trace of an ancestral genomic duplication [21]. Recently, it was also observed that in A. naccarii, some loci follow a disomic segregation modality [22], indicative of a further differentiation of the chromosomes towards a diploid condition [23]. In summary, the coexistence of different ploidy levels in different regions of the genome makes the development of analytical methods for sturgeon species belonging to the group with 240 chromosomes challenging [21]. Relying on “phenotypic” data, therefore, remains the preferred approach for these of animals, as recently demonstrated also on the Chinese sturgeon (A. sinensis) [20].

5. Conclusions

Genetic erosion is inevitable in ex situ maintenance of a limited number of animals, but it could be mitigated by including animals coming from other stocks and planning crosses on the basis of accurate pedigree reconstructions [8]. In Europe, mainly in Italy and Spain [9], several stocks of A. naccarii exist, both public and private, which, even if all descending from the original F0 stock and generally made up of a small number of family groups, could have accidentally kept rare genetic lines, which should be reproduced with priority. The very recent publication of the new assessment of sturgeons and paddlefish by the IUCN denounces a serious deterioration in the conservation status of most of the populations and indicates the urgency of establishing genetically certified ex situ stocks. Thus, we claim the urgency of characterizing all existing captive stocks of A. naccarii, considering them as a unique meta-stock, reared in different plants, on which a breeding program is designed that contemplates the informed exchange of individuals or gametes between the different farms. The approach proposed does not require any preliminary information and can be applied to all the various polyploid sturgeon species for which conservation relies on the maintenance and reproduction of ex situ stocks.

Supplementary Materials

The following supporting information can be downloaded at https://www.mdpi.com/article/10.3390/d14100829/s1, Figure S1: MDS performed on pairwise Sørensen’s distance matrix among all 505 F1 animals colored according to their mitochondrial haplotype. Table S1: Details about all microsatellite loci analyzed in the present study [24,25]. Table S2: Pedigree information for each individual analyzed in the present study.

Author Contributions

Conceptualization, L.C. and E.B.; methodology, L.C. and E.B.; validation, F.B., S.D.P. and E.B.; formal analysis, F.B. and S.D.P.; investigation, F.B., S.D.P., C.S. and E.B.; software, L.S.; writing—original draft preparation, F.B.; writing—review and editing, E.B. and L.C.; supervision, E.B., G.C. and L.C.; project administration, L.C.; funding acquisition, L.C. All authors have read and agreed to the published version of the manuscript.

Funding

This research was funded by the National Biodiversity Future Centre (NBFC funded by the Italian Ministry of University and Research, PNRR, Missione 4 Componente 2, “Dalla ricerca all’impresa”, Investimento 1.4, Project CN00000033).

Institutional Review Board Statement

The animal study protocol was approved by the Institutional Ethics Committee of the University of Padova (OPBA) (protocol code 421922 of 14 October 2020).

Data Availability Statement

Not applicable.

Acknowledgments

We thank the Storione Ticino farm for providing samples, as well as the Giovannini family for their 50-year-long engagement in the conservation of the Adriatic sturgeon and for having conducted their activity under constant interaction with researchers in different disciplines.

Conflicts of Interest

The authors declare no conflict of interest.

References

  1. Arlati, G.; Bronzi, P.; Colombo, L.; Giovannini, G. Induzione della riproduzione nello storione italiano (Acipenser naccarii) allevato in cattività. Riv. Ital. Acquacol. 1988, 23, 94–96. [Google Scholar]
  2. Giovannini, G.; Colombo, L.; Bronzi, P.; Arlati, G. Growth of hatchery-produced juveniles of Italian sturgeon, Acipenser naccarii Bonaparte, reared intensively in fresh water. In Acipenser; Cemagref Publication: Bordeaux, France, 1991; pp. 401–404. [Google Scholar]
  3. Boscari, E.; Pujolar, J.M.; Dupanloup, I.; Corradin, R.; Congiu, L. Captive breeding programs based on family groups in polyploid sturgeons. PLoS ONE 2014, 9, e110951. [Google Scholar] [CrossRef] [Green Version]
  4. Arlati, G.; Poliakova, L. Restoration of Adriatic Sturgeon (Acipenser naccarii) in Italy: Situation and Perspectives. In Biology, Conservation and Sustainable Development of Sturgeons; Carmona, R., García-Gallego, M., Ruiz-Rejón, M., Eds.; Springer: Dordrecht, The Netherlands, 2009; Volume 14, pp. 237–238. [Google Scholar]
  5. Congiu, L.; Boscari, E.; Pagani, S.; Gazzola, M.; Bronzi, P. Resumption of natural reproduction of the Adriatic sturgeon in the River Po. Oryx 2021, 55, 816. [Google Scholar] [CrossRef]
  6. Congiu, L.; Pujolar, J.M.; Forlani, A.; Cenadelli, S.; Dupanloup, I.; Barbisan, F.; Galli, A.; Fontana, F. Managing polyploidy in ex situ conservation genetics: The case of the critically endangered Adriatic sturgeon (Acipenser naccarii). PLoS ONE 2011, 6, e18249. [Google Scholar] [CrossRef] [Green Version]
  7. Boscari, E.; Congiu, L. The need for genetic support in restocking activities and ex situ conservation programmes: The case of the Adriatic sturgeon (Acipenser naccarii Bonaparte, 1836) in the Ticino River Park. J. Appl. Ichthyol. 2014, 30, 1416–1422. [Google Scholar] [CrossRef]
  8. World Sturgeon Conservation Society; WWF. Pan-European Action Plan for Sturgeons. In Proceedings of the Convention on the Conservation of European Wildlife and Natural Habitats Standing Committee: 38th Meeting, Strasbourg, France, 27–30 November 2018. [Google Scholar]
  9. Cabrera-Castro, R.; Zabal, C.; Soriguer, M.C.; Domezain, A.; Hernando, J.A. Morphological development in the first phase of Adriatic sturgeon Acipenser naccarii under controlled conditions. J. Fish Biol. 2018, 92, 1956–1974. [Google Scholar] [CrossRef]
  10. Forlani, A.; Fontana, F.; Congiu, L. Isolation of microsatellite loci from the endemic and endangered Adriatic sturgeon (Acipenser naccarii). Conserv. Genet. 2007, 9, 461–463. [Google Scholar] [CrossRef]
  11. McQuown, E.C.; Sloss, B.L.; Sheehan, R.J.; Rodzen, J.; Tranah, G.J.; May, B. Microsatellite analysis of genetic variation in sturgeon: New primer sequences for Scaphirhynchus and Acipenser. Trans. Am. Fish. Soc. 2000, 129, 1380–1388. [Google Scholar] [CrossRef]
  12. Welsh, A.B.; Blumberg, M.; May, B. Identification of microsatellite loci in lake sturgeon, Acipenser fulvescens, and their variability in green sturgeon, A. medirostris. Mol. Ecol. Notes 2003, 3, 47–55. [Google Scholar] [CrossRef]
  13. Boscari, E.; Vidotto, M.; Martini, D.; Papetti, C.; Ogden, R.; Congiu, L. Microsatellites from the genome and the transcriptome of the tetraploid Adriatic sturgeon, Acipenser naccarii (Bonaparte, 1836) and cross-species applicability to the diploid beluga sturgeon, Huso huso (Linnaeus, 1758). J. Appl. Ichthyol. 2015, 31, 977–983. [Google Scholar] [CrossRef]
  14. Henderson-Arzapalo, A.; King, T.L. Novel microsatellite markers for Atlantic sturgeon (Acipenser oxyrinchus) population delineation and broodstock management. Mol. Ecol. Notes 2022, 2, 437–439. [Google Scholar] [CrossRef]
  15. Kumar, S.; Stecher, G.; Li, M.; Knyaz, C.; Tamura, K. MEGA X: Molecular evolutionary genetics analysis across computing platforms. Mol. Biol. Evol. 2018, 35, 1547. [Google Scholar] [CrossRef]
  16. Sørensen, T. A Method of Establishing Groups of Equal Amplitude in Plant Sociology Based on Similarity of Species Content and Its Application to Analyses of the Vegetation on Danish Commons. Biol. Skr. K. Dan. Vidensk. Selsk. 1948, 5, 1–34. [Google Scholar]
  17. Thioulouse, J.; Dray, S.; Dufour, A.-B.; Siberchicot, A.; Jombart, T.; Pavoine, S. Multivariate Analysis of Ecological Data with ade4; Springer: New York, NY, USA, 2018. [Google Scholar] [CrossRef]
  18. Wickham, H. ggplot2: Elegant Graphics for Data Analysis; Springer: New York, NY, USA, 2016; Available online: https://ggplot2.tidyverse.org (accessed on 5 September 2020)ISBN 978-3-319-24277-4.
  19. Tortonese, E. Acipenser naccarii (Bonaparte, 1836). In The Freshwater Fishes of Europe; Holcik, J., Ed.; AULA_Verlag: Wiesbaden, Germany, 1989; pp. 286–293. [Google Scholar]
  20. Boscari, E.; Wu, J.; Jiang, T.; Zhang, S.; Cattelan, S.; Wang, C.; Du, H.; Li, C.; Li, J.; Ruan, R.; et al. The last giants of the Yangtze River: A multidisciplinary picture of what remains of the endemic Chinese sturgeon. Sci. Total Environ. 2022, 843, 157011. [Google Scholar] [CrossRef]
  21. Fontana, F.; Congiu, L.; Mudrak, V.A.; Quattro, J.M.; Smith, T.I.; Ware, K.; Doroshov, S.I. Evidence of hexaploid karyotype in shortnose sturgeon. Genome 2008, 51, 113–119. [Google Scholar] [CrossRef]
  22. Palle, S.D.; Boscari, E.; Bordignon, S.G.; Muñoz-Mora, V.H.; Bertorelle, G.; Congiu, L. Different chromosome segregation patterns coexist in the tetraploid Adriatic sturgeon Acipenser naccarii. Diversity 2022, 14, 745. [Google Scholar] [CrossRef]
  23. Stift, M.; Berenos, C.; Kuperus, P.; Van Tienderen, P.H. Segregation models for disomic, tetrasomic and intermediate inheritance in tetraploids: A general procedure applied to Rorippa (yellow cress) microsatellite data. Genetics 2008, 179, 2113–2123. [Google Scholar] [CrossRef] [PubMed] [Green Version]
  24. May, B.; Krueger, C.C.; Kincaid, H.L. Genetic variation at microsatellite loci in sturgeon: Primer sequence homology in Acipenser and Scaphirhynchus. Can. J. Fish. Aquat. Sci. 1997, 54, 1542–1547. [Google Scholar] [CrossRef]
  25. Zane, L.; Patarnello, T.; Ludwig, A.; Fontana, F.; Congiu, L. Isolation and characterization of microsatellites in the Adri-atic sturgeon (Acipenser naccarii). Mol. Ecol. Notes 2022, 2, 586–588. [Google Scholar] [CrossRef]
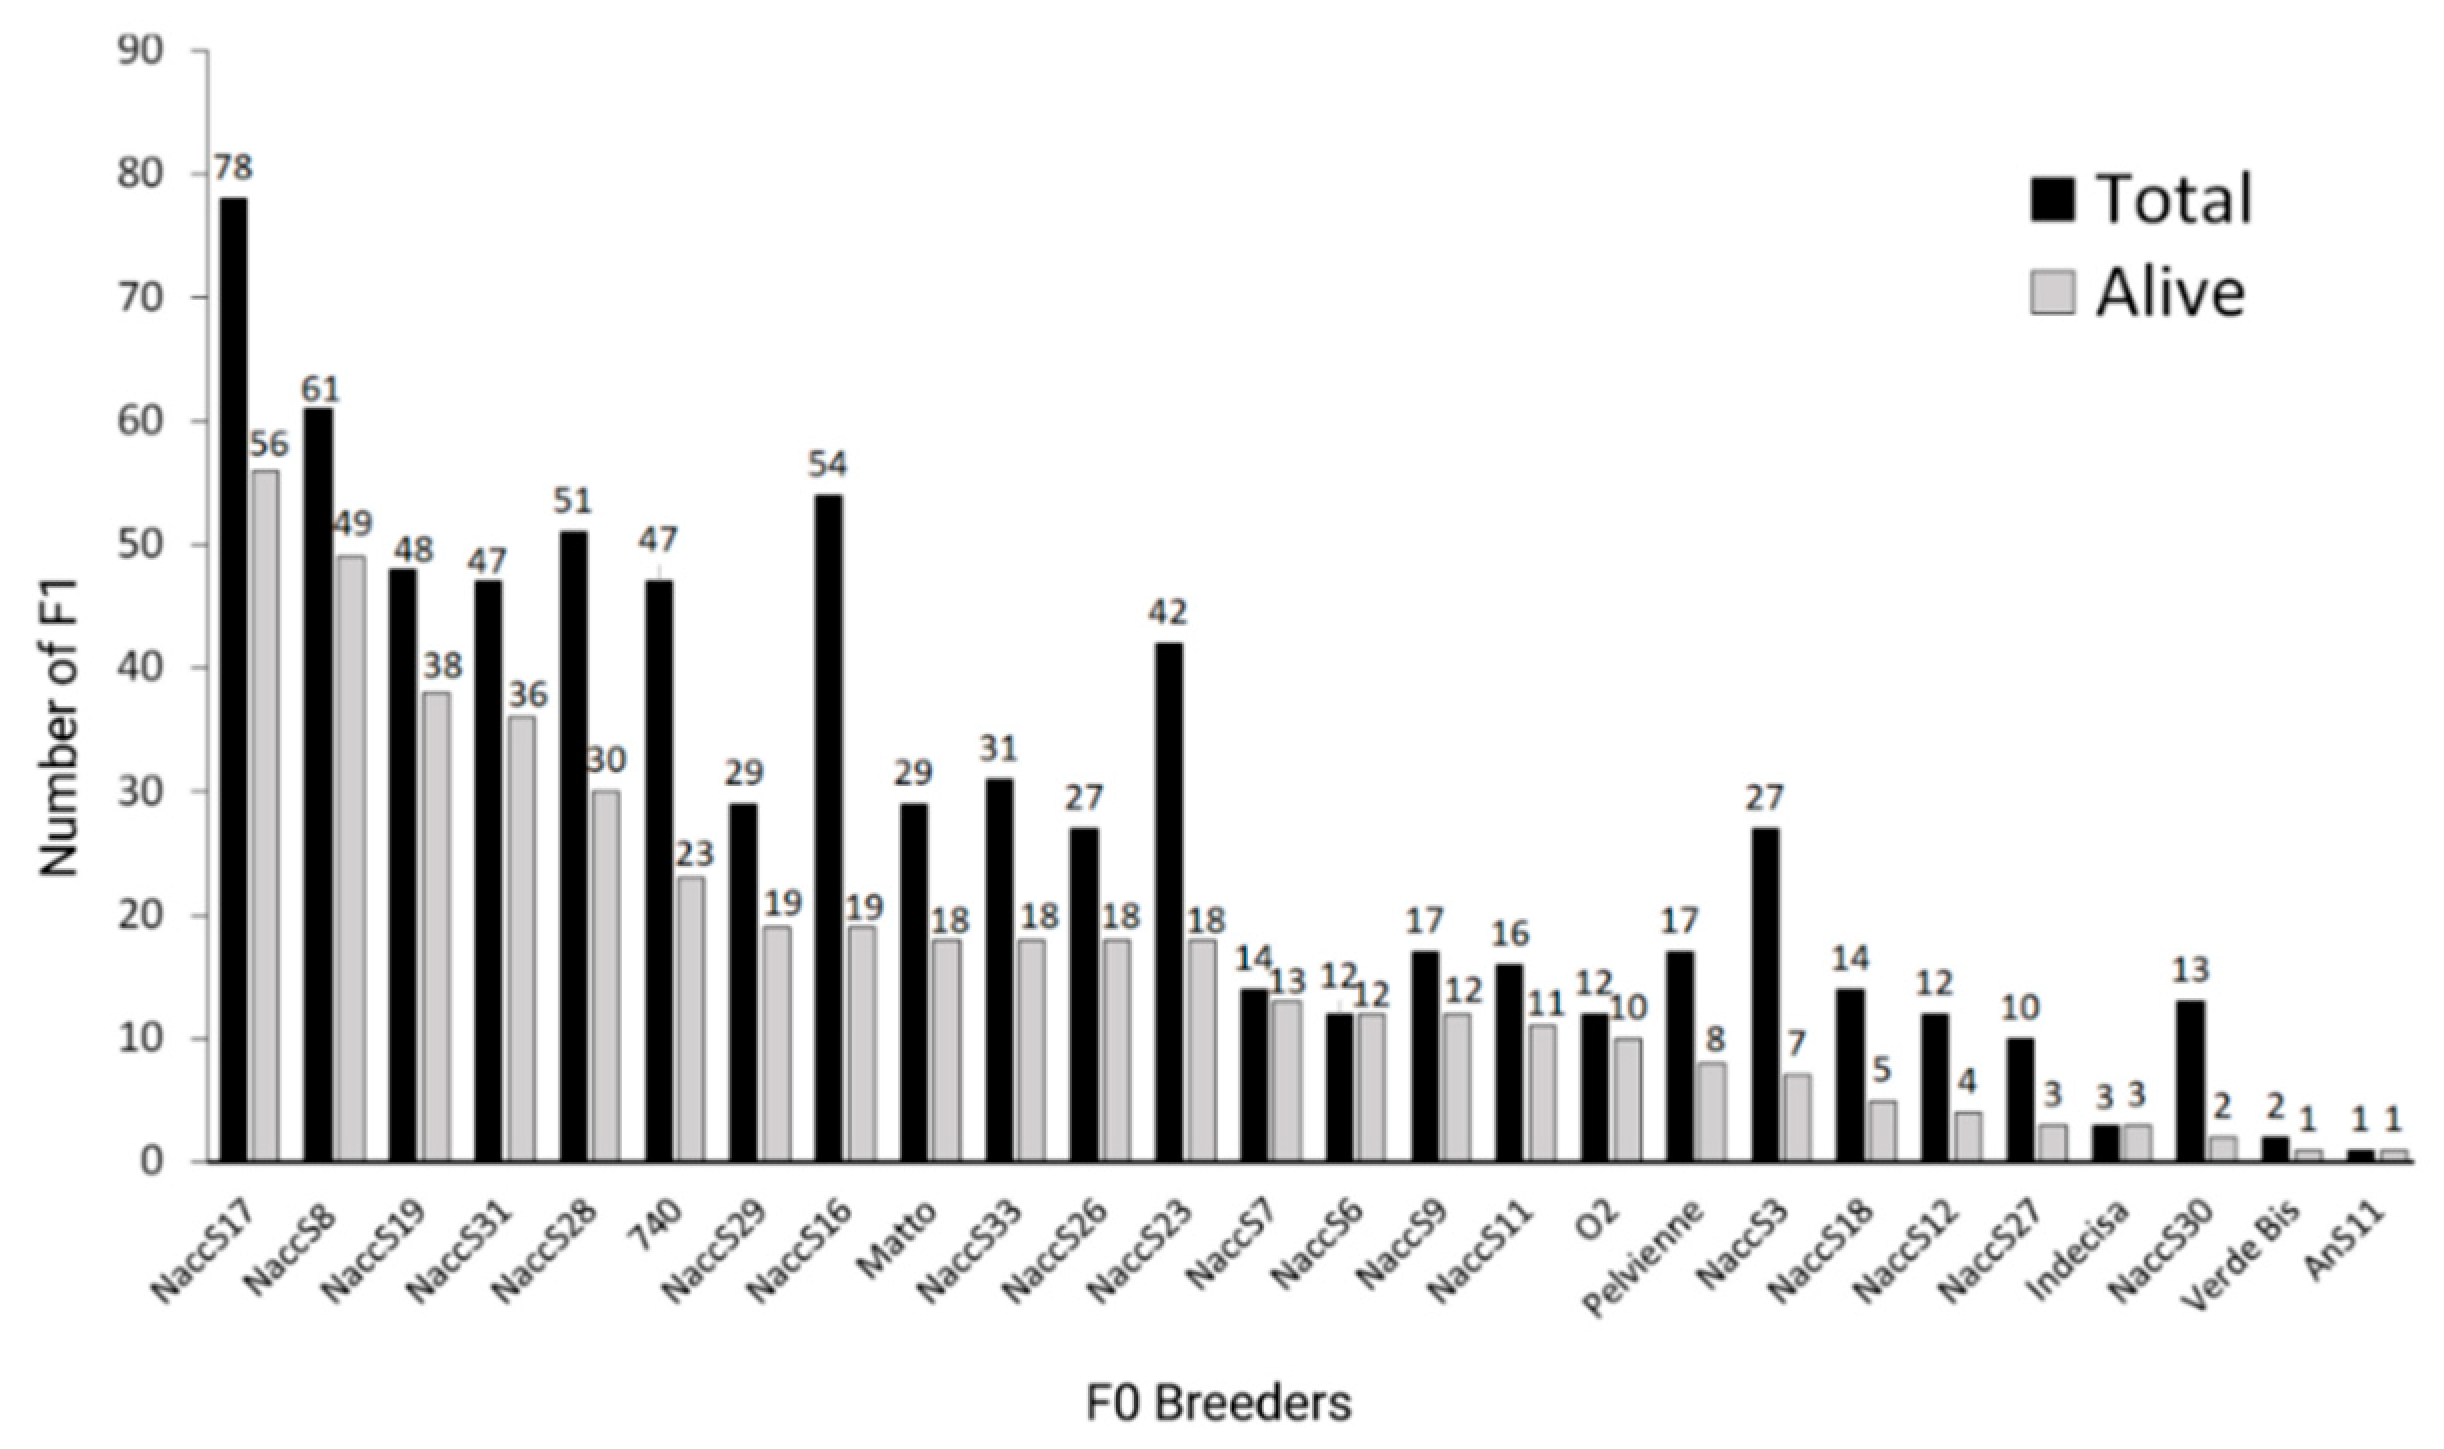
Figure 1. Contribution of the different F0 breeders to the F1 generation. For each breeder reproduced in the past, the total number of F1 in the analyzed stock and the ones still alive are reported (created with Biorender.com, accessed on 13 September 2022).
Diversity 14 00829 g001
Figure 2. Results of MDS analyses performed on pairwise Sørensen’s distance matrix among F0 and F1 with mitochondrial haplotype 2 (a); F0 and F1 with mitochondrial haplotype 3 (b) and F0 and mitochondrial haplotypes 5 and 7 (c). Individuals of two half-sib family groups (10 and 12), that in the first run were not distinguishable, were included in a second run, excluding all other F1s to show the usefulness of a hierarchical approach in also distinguishing related families; the common dam and the sires of the two families are also highlighted (d). The same approach was used on animals for which the parental information was not available, having mitochondrial haplotype 2 and 3 (e,f), respectively. In all figures, full and empty circles represent alive and dead animals, respectively (created with Biorender.com, accessed on 13 September 2022). NA = non-allocated.
Diversity 14 00829 g002
Table 1. Resumé of family groups identified with parental allocation analysis based on 15 microsatellite loci. For each family group, the parent pair, the total number of allocated animals, and the number of survived ones (in brackets) are reported as well as the maternal mitochondrial haplotype. The families 08 and 11 are composed of F1 animals carrying the mitochondrial haplotypes 5 or 7, and in some cases, animals showed heteroplasmy with both the mitochondrial variants. This was due to the heteroplasmic condition of the shared F0 female. Further details for each individual analyzed are reported in Table S2.
Family GroupParental PairN F1 Tot (Alive)mtDNA HaplotypeFamily GroupParental PairN F1 Tot (Alive)mtDNA Haplotype
01Pelvienne (F) × NaccS18 (M)14 (5)217NaccS8 (F) × 740 (M)21 (14)2
02NaccS8 (F) × Matto (M)9 (6)218NaccS3 (F) × Matto (M)5 (1)3
03NaccS7 (F) × NaccS6 (M)12 (12)319NaccS33 (F) × 740 (M)4 (2)3
04NaccS8 (F) × NaccS31 (M)17 (15)220NaccS7 (F) × VerdeBis (M)2 (1)3
05NaccS33 (F) × NaccS11 (M)10 (4)321NaccS12 (F) × NaccS17 (M)1 (1)2
06O2 (F) × Matto (M)12 (9)522Indecisa (U) × Matto (M)2 (2)2
07NaccS26 (F) × NaccS29 (M)27 (18)523Indecisa (U) × AnS11 (M)1 (1)2
08NaccS19 (F) × NaccS17 (M)18 (17)5/724NaccS12 (F) × Matto (M)1 (0)2
09NaccS28 (F) × NaccS17 (M)51 (30)325Naccs3 (F)–Naccs29 (M)1 (0)3
10NaccS16 (F) × NaccS23 (M)39 (15)326NaccS16 (F) × 740 (M)1 (1)3
11NaccS19 (F) × NaccS31 (M)30 (21)5/727NaccS16 (F) × NaccS29 (M)1 (1)3
12NaccS16 (F) × NaccS30 (M)13 (2)328Naccs8 (F)–Naccs11 (M)6 (6)2
13NaccS33 (F) × NaccS9 (M)17 (12)329Pelvienne (F)–Naccs23 (M)3 (3)2
14NaccS8 (F) × NaccS17 (M)8 (8)230Non-allocated141 (108)-
15NaccS12 (F) × NaccS27 (M)10 (3)231Multi-allocated7 (7)-
16NaccS3 (F) × 740 (M)21 (6)3
Publisher’s Note: MDPI stays neutral with regard to jurisdictional claims in published maps and institutional affiliations.