
Spatial and Temporal Patterns of Genetic Diversity and Structure in Danish Populations of the Alcon Blue Butterfly Phengaris alcon (Denis & Schiffermüller)

Abstract
:1. Introduction
2. Materials and Methods
2.1. Sampling
2.1.1. Museum Specimen Sampling
2.1.2. Sampling of Live Individuals
2.2. Laboratory Procedures
2.2.1. DNA Extraction
2.2.2. PCRs and Microsatellite Loci
2.3. Analysis
2.3.1. Distribution Maps
2.3.2. Genetic Data Preparation
2.3.3. Genetic Structuring
2.3.4. Distribution of Genetic Variance and Private Alleles
2.3.5. Isolation by Distance
2.3.6. Genetic Diversity
2.3.7. Effective Population Size
3. Results
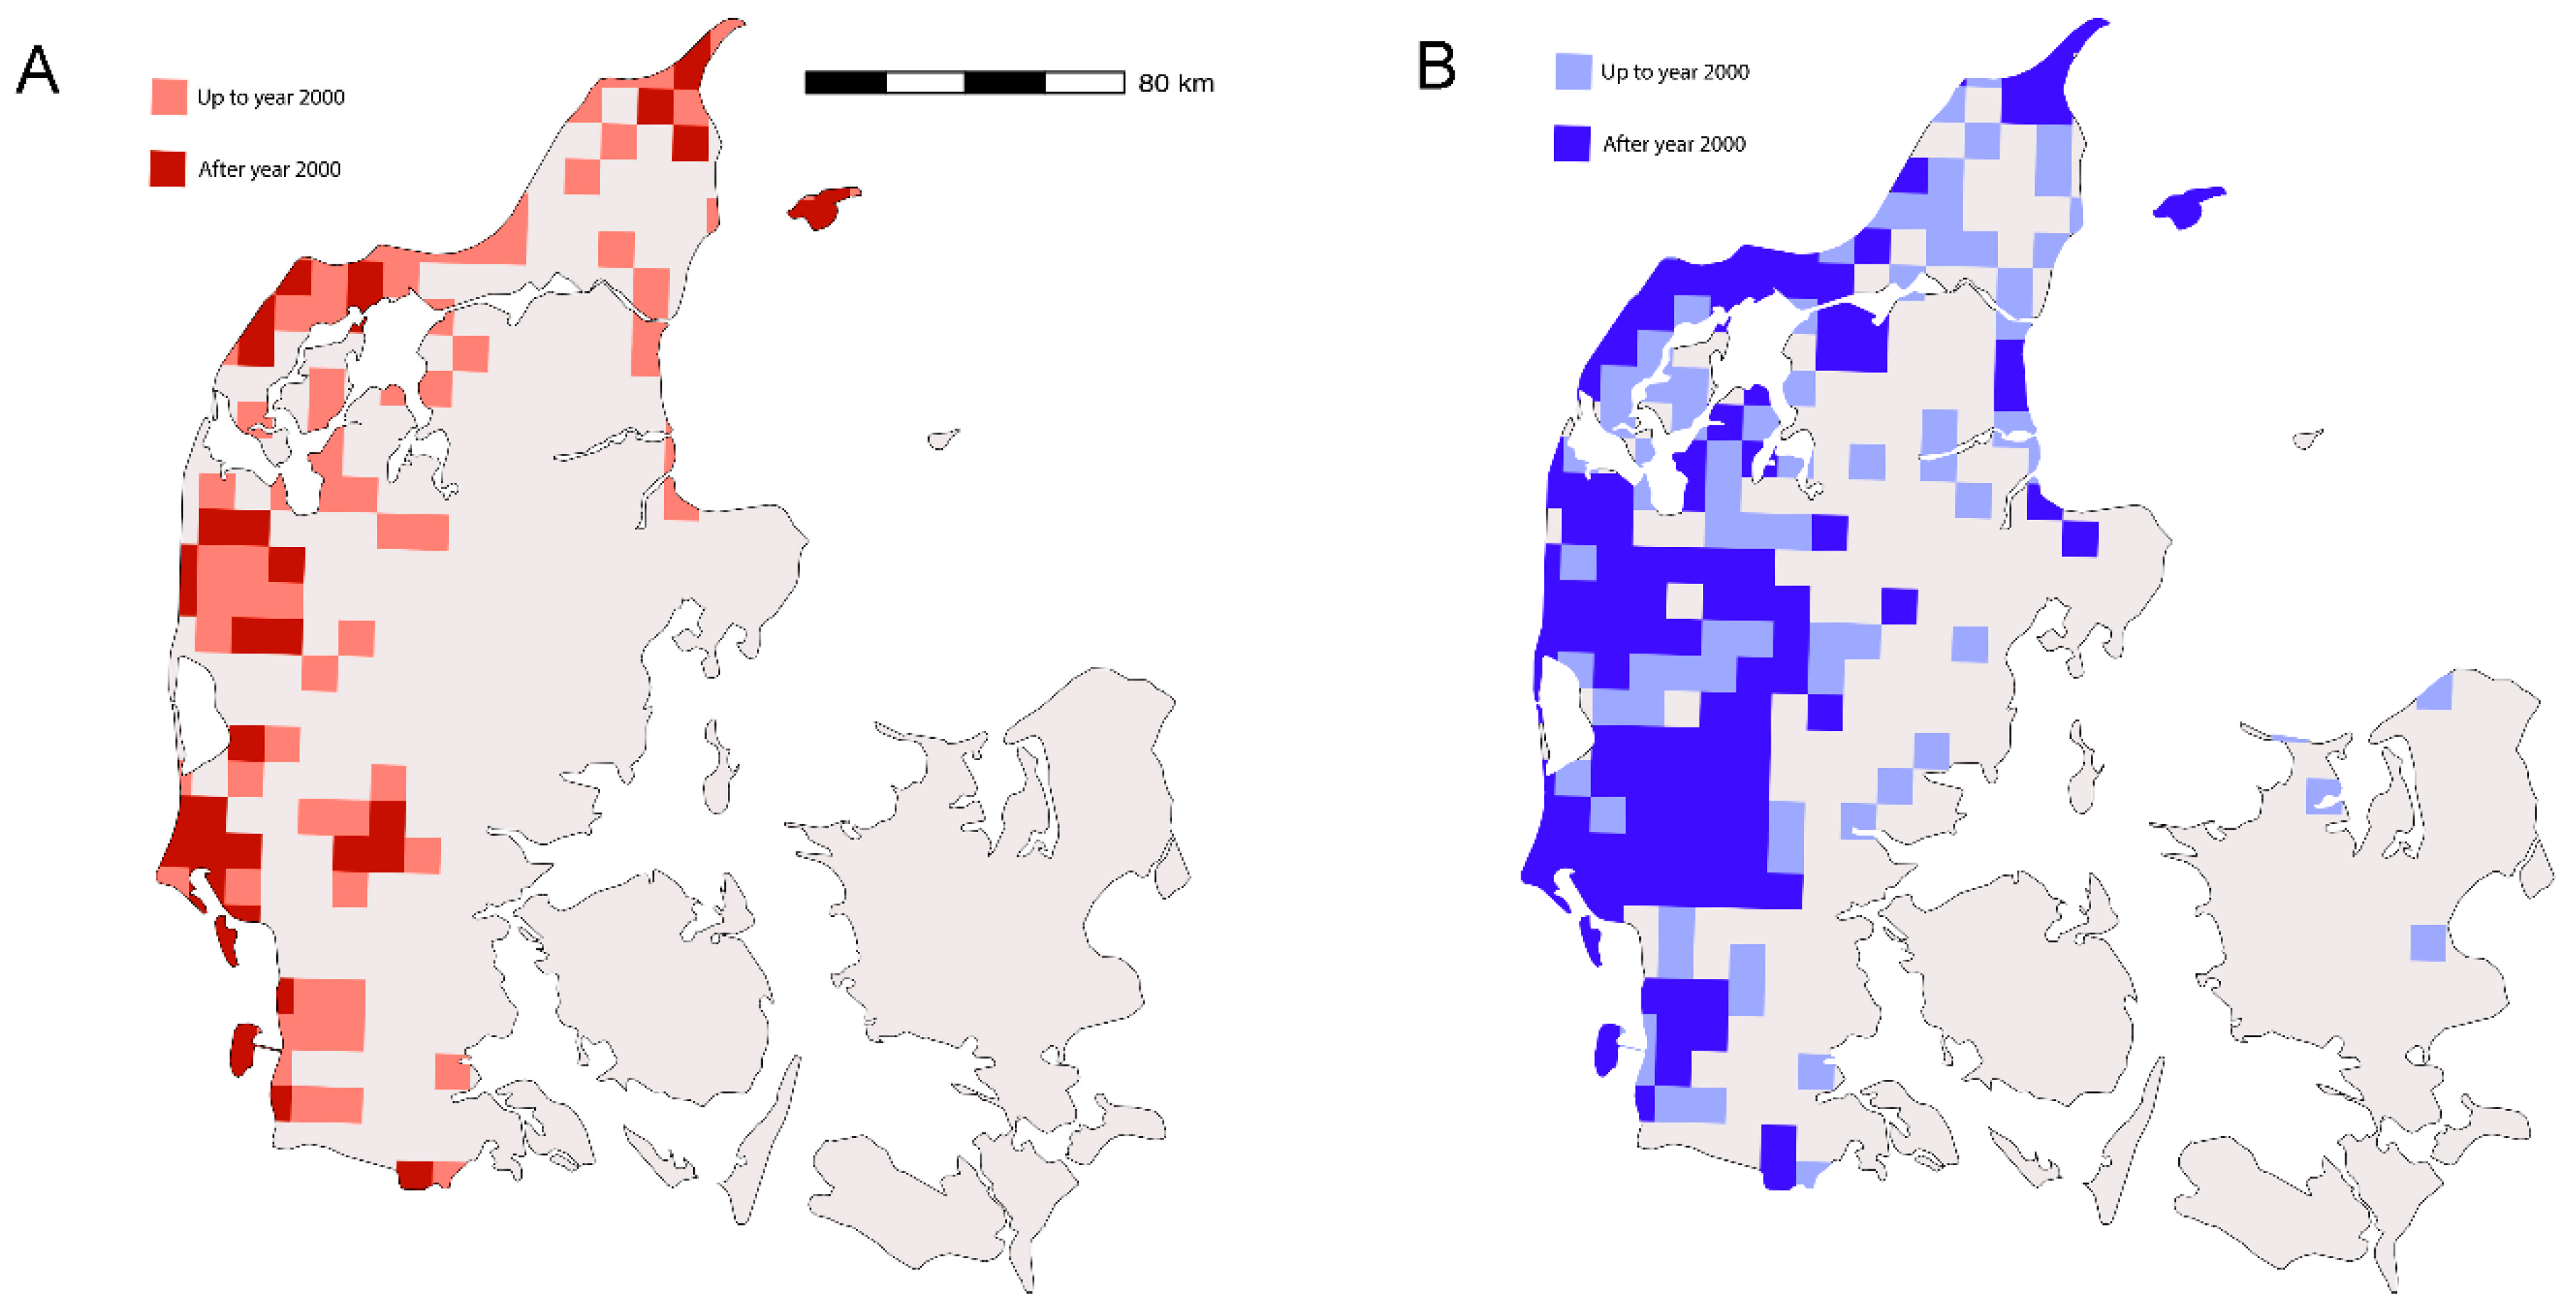
3.1. Distribution of P. alcon and G. pneumonanthe in Denmark
3.2. Samples and Data
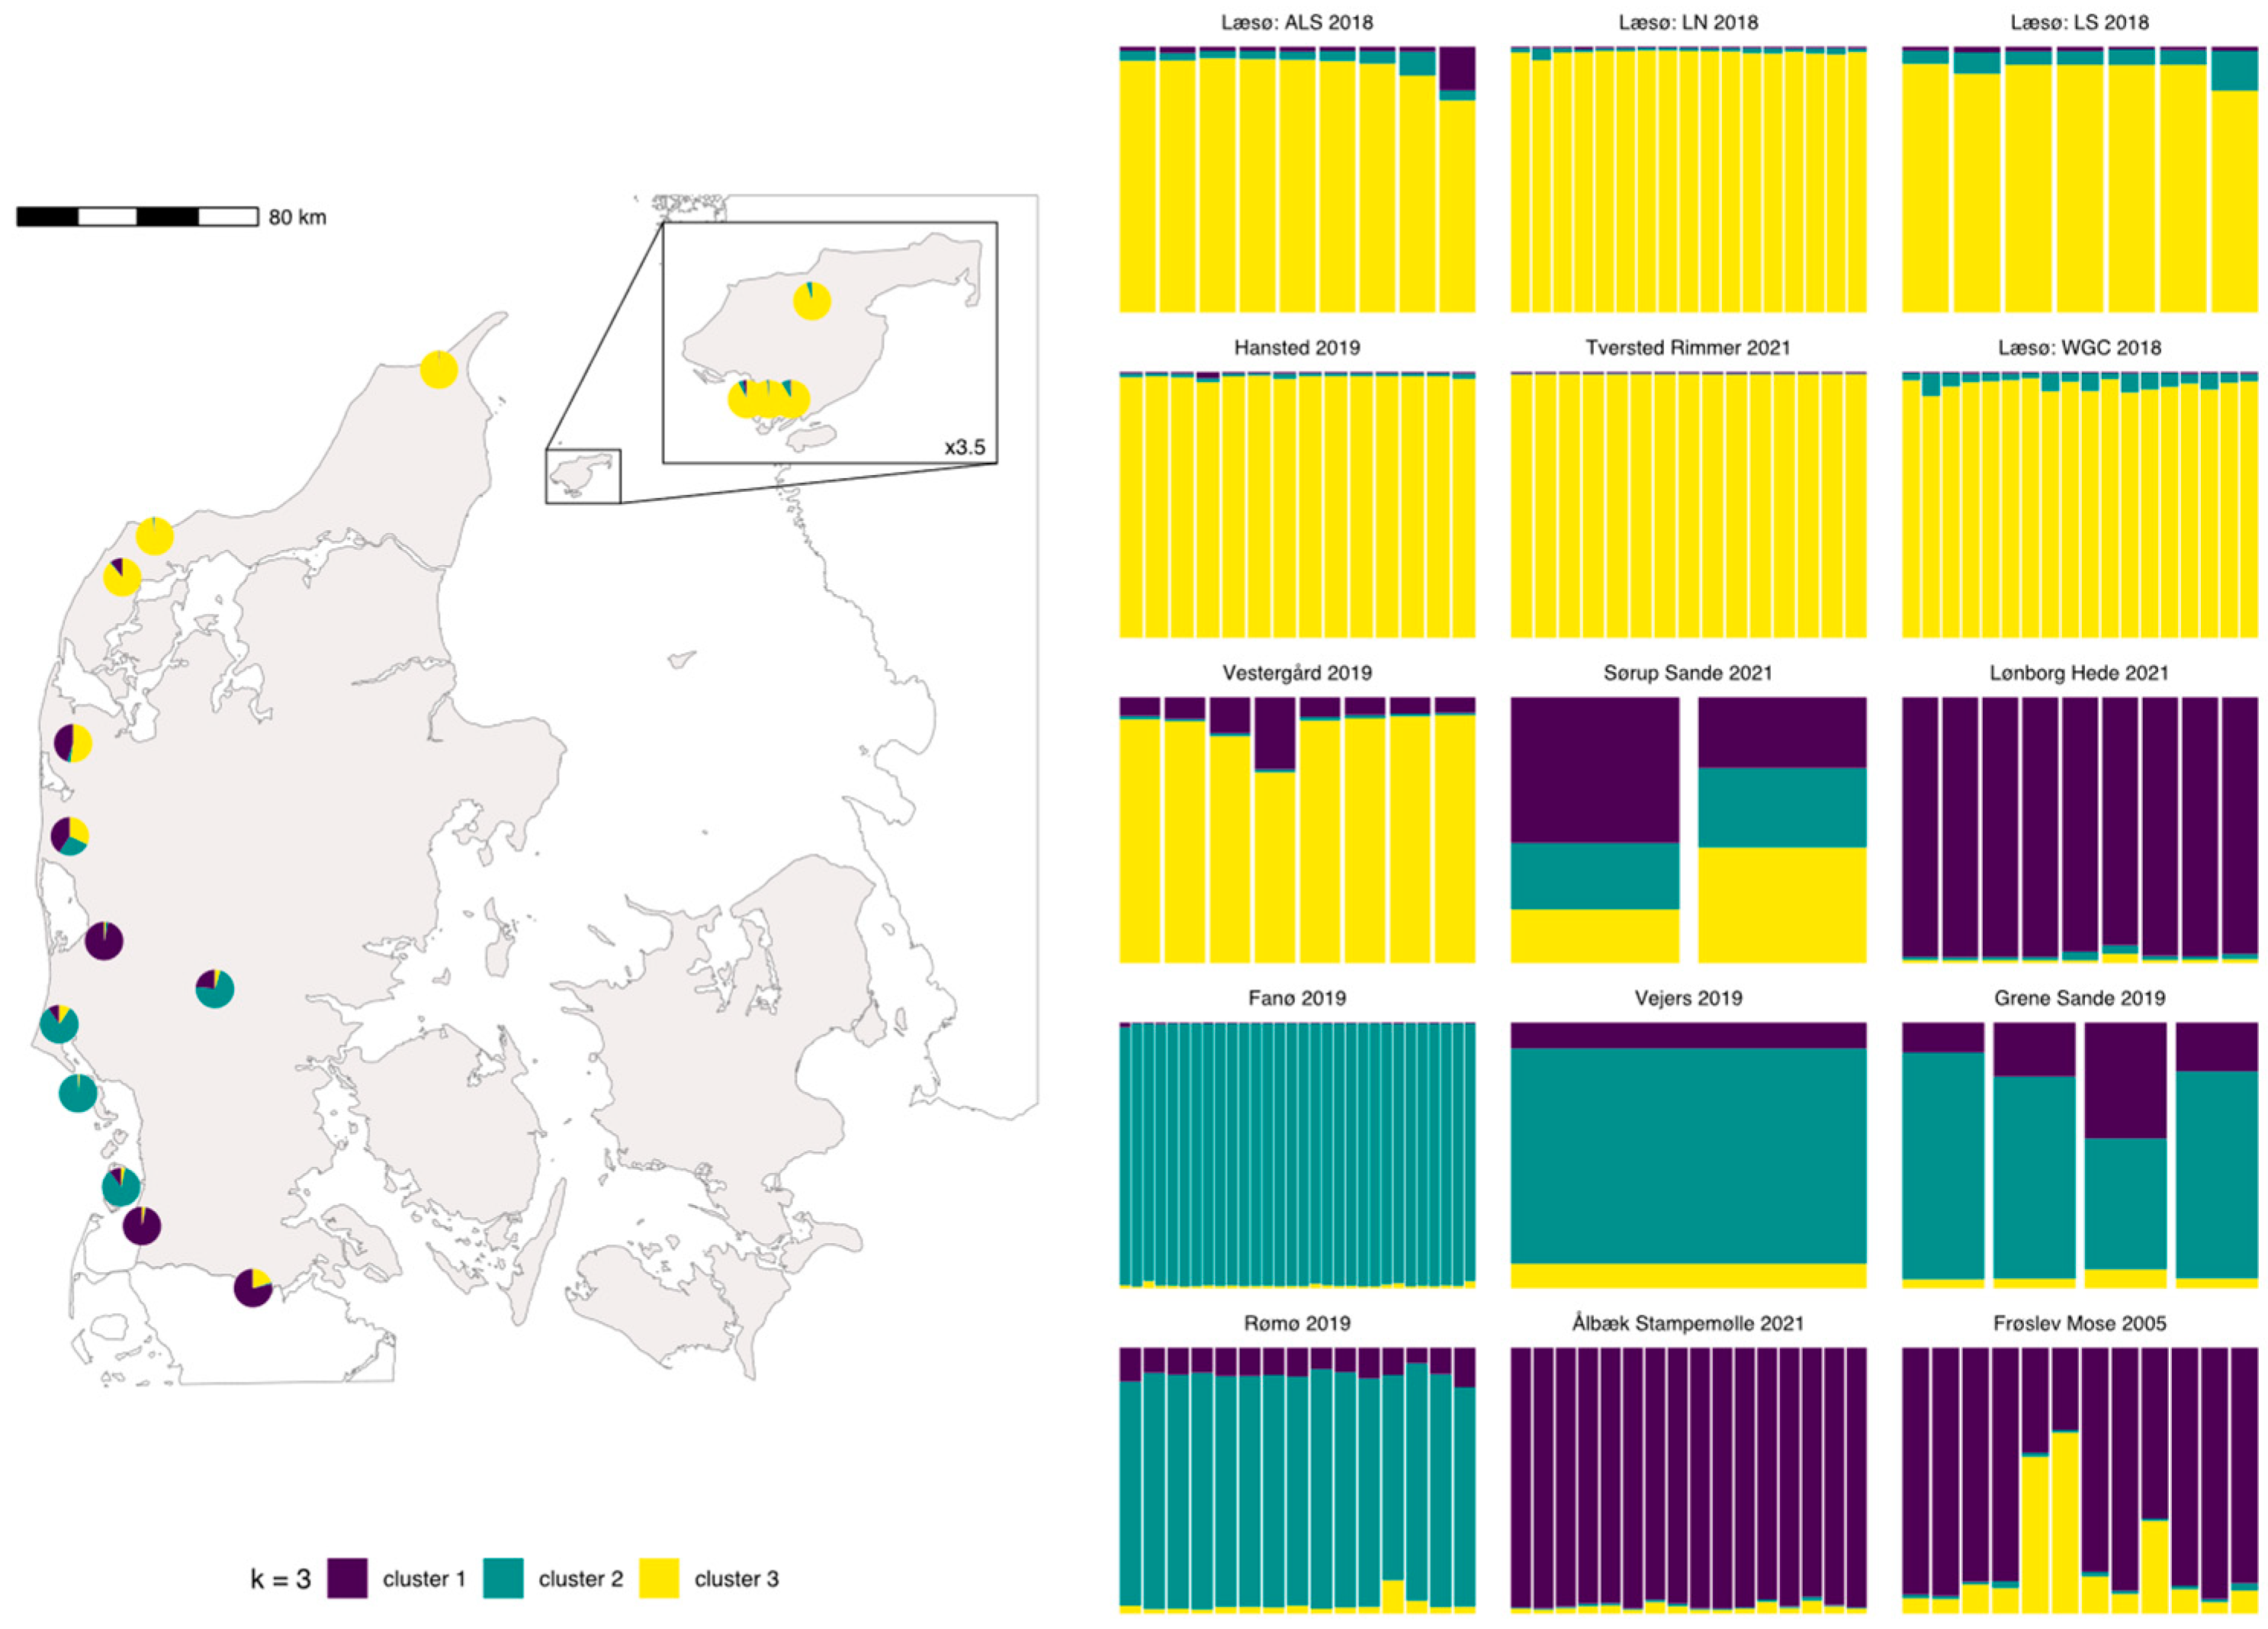
3.3. Genetic Structuring
3.4. AMOVA and Distribution of Private Alleles
3.5. Genetic Diversity
3.6. Effective Population Size
3.7. Isolation by Distance
4. Discussion
4.1. Genetic Structuring and Biogeographical Patterns
4.2. Genetic Diversity
4.3. Museum Specimens and Historical Population Genetics Assessments
4.4. Conservation Implications
5. Conclusions
Supplementary Materials
Author Contributions
Funding
Institutional Review Board Statement
Data Availability Statement
Acknowledgments
Conflicts of Interest
References
- Levin, G.; Normander, B. Arealanvendelse i Danmark Siden Slutningen af 1800-Tallet; Faglig rapport fra DMU 682; Danmarks Miljøundersøgelser: Aarhus, Denmark, 2008. [Google Scholar]
- Hansen, A.K.; Justesen, M.J.; Olsen, M.T.; Solodovnikov, A. Genomic population structure and conservation of the red listed Carabus arcensis (Coleoptera: Carabidae) in island-mainland habitats of Northern Europe. Insect Conserv. Divers. 2018, 11, 255–266. [Google Scholar] [CrossRef]
- Schmidt, I.K.; Riis-Nielsen, T. Lynghederne. In Naturen i Danmark: Det Åbne Land; Vestergaard, P., Ed.; Gyldendal: Copenhagen, Denmark, 2007; pp. 213–246. [Google Scholar]
- Brunbjerg, A.K.; Høye, T.T.; Eskildsen, A.; Nygaard, B.; Damgaard, C.F.; Ejrnæs, R. The collapse of marsh fritillary (Euphydryas aurinia) populations associated with declining host plant abundance. Biol. Conserv. 2017, 211, 117–124. [Google Scholar] [CrossRef]
- Sigaard, P.; Pertoldi, C.; Madsen, A.B.; Søgaard, B.; Loeschcke, V. Patterns of genetic variation in isolated Danish populations of the endangered butterfly Euphydryas aurinia. Biol. J. Linn. Soc. 2008, 95, 677–687. [Google Scholar] [CrossRef] [Green Version]
- Nielsen, O.F. De Danske Græshopper; Apollo Books: Stenstrup, Denmark, 2000; p. 192. [Google Scholar]
- Odgaard, B.V. Fra Bondestenalder til nutid. In Naturen i Danmark: Geologien; Sand-Jensen, K., Ed.; Gyldendal: Copenhagen, Denmark, 2006; pp. 333–360. [Google Scholar]
- Wandeler, P.; Hoeck, P.E.; Keller, L.F. Back to the future: Museum specimens in population genetics. Trends Ecol. Evol. 2007, 22, 634–642. [Google Scholar] [CrossRef] [PubMed] [Green Version]
- Holmes, M.W.; Hammond, T.T.; Wogan, G.O.U.; Walsh, R.E.; LaBarbera, K.; Wommack, E.A.; Martins, F.M.; Crawford, J.C.; Mack, K.L.; Bloch, L.M.; et al. Natural history collections as windows on evolutionary processes. Mol. Ecol. 2016, 25, 864–881. [Google Scholar] [CrossRef] [PubMed] [Green Version]
- Eskildsen, A.; Carvalheiro, L.G.; Kissling, W.D.; Biesmeijer, J.C.; Schweiger, O.; Høye, T.T. Ecological specialization matters: Long-term trends in butterfly species richness and assemblage composition depend on multiple functional traits. Divers. Distrib. 2015, 21, 792–802. [Google Scholar] [CrossRef]
- Stoltze, M. Danske Dagsommerfugle; Gyldendal: Copenhagen, Denmark, 1996; p. 383. [Google Scholar]
- Helsing, F. Dagsommerfugle. In Den Danske Rødliste 2019; Moeslund, J.E., Nygaard, B., Ejrnæs, R., Bell, N., Bruun, L.D., Bygebjerg, R., Carl, H., Damgaard, J., Dylmer, E., Elmeros, M., et al., Eds.; DCE—Nationalt Center for Miljø og Energi: Aarhus, Denmark, 2019. [Google Scholar]
- Fric, Z.; Wahlberg, N.; Pech, P.; Zrzavý, J. Phylogeny and classification of the Phengaris-Maculinea clade (Lepidoptera: Lycaenidae): Total evidence and phylogenetic species concepts. Syst. Entomol. 2007, 32, 558–567. [Google Scholar] [CrossRef]
- ICZN. Opinion 2399 (Case 3508)—Maculinea Van Eecke, 1915 (Lepidoptera: Lycaenidae): Precedence over Phengaris Doherty, 1891 not granted. Bull. Zool. Nomencl. 2017, 74, 117–119. [Google Scholar] [CrossRef]
- Maes, D.; Van Dyck, H. Habitat quality and biodiversity indicator performances of a threatened butterfly versus a multispecies group for wet heathlands in Belgium. Biol. Conserv. 2005, 123, 177–187. [Google Scholar] [CrossRef]
- Gilmer, M. Die Futterpflanze, das Ei und die junge Raupe von Lycaena alcon, F. Soc. Entomol. 1902, 17, 92–93. [Google Scholar]
- Wilcke, J. Nieuwe gegevens over de Biologie van Lycaena alcon F. Tijd Ent 1947, 87, 537–542. [Google Scholar]
- Nash, D.R.; Als, T.D.; Maile, R.; Jones, G.R.; Boomsma, J.J. A mosaic of chemical coevolution in a large blue butterfly. Science 2008, 319, 88–90. [Google Scholar] [CrossRef] [PubMed]
- Als, T.D.; Nash, D.R.; Boomsma, J.J. Geographical variation in host-ant specificity of the parasitic butterfly Maculinea alcon in Denmark. Ecol. Entomol. 2002, 27, 403–414. [Google Scholar] [CrossRef]
- Nash, D.R.; Andersen, A. MACULINEA-sommerfugle og stikmyrer på danske heder-coevolution i tid og rum. Flora Og Fauna 2015, 121, 133–141. [Google Scholar]
- Elmes, G.; Thomas, J.A.; Wardlaw, J. Larvae of Maculinea rebeli, a large-blue butterfly, and their Myrmica host ants: Wild adoption and behaviour in ant-nests. J. Zool. 1991, 223, 447–460. [Google Scholar] [CrossRef]
- Nash, D.R.; Als, T.D.; Boomsma, J.J. Survival and growth of parasitic Maculinea alcon caterpillars (Lepidoptera, Lycaenidae) in laboratory nests of three Myrmica ant species. Insectes Sociaux 2011, 58, 391–401. [Google Scholar] [CrossRef] [Green Version]
- Kaaber, S. Studies on Maculinea alcon (Schiff.) -rebeli (Hir.) (Lep. Lycaenidae) with Reference to the Taxonomy, Distribution, and Phylogeny of the Group. Entomol. Medd. 1964, 32, 277–319. [Google Scholar]
- Hirschke, H. Eine neue hochalpine Form der Lycaena Alcon F. aus den steirischen Alpen. Jahresber. Des Wien. Entomol. -Ver. 1904, 15, 109–111. [Google Scholar]
- Berger, L. Maculinea rebeli Hirschke, bona species. Lambillionea 1946, 46, 95. [Google Scholar]
- Kudrna, O.; Fric, Z.F. On the identity and taxonomic status of Lycaena alcon rebeli HIRSCHKE, 1905—a long story of confusion and ignorance resulting in the fabrication of a “ghost species” (Lepidoptera: Lycaenidae). Nachr. Des Entomol. Ver. Apollo 2013, 34, 117–124. [Google Scholar]
- Beuret, H. Contribution a l’ètude du groupe Maculinea alcon Schiff.-rebeli Hirschke (Lep. Lycaenidae). Bull. De La Soc. Entomol. De Mulhouse 1949, 1949, 1–6, 10–14, 17–21, 25–28, 33–36, 41–44, 50–51. [Google Scholar]
- Habeler, H. Die subalpin-alpinen Lebensräume des Bläulings Maculinea rebeli (HIRSCHKE, 1904) in den Ostalpen (Lepidoptera, Lycaenidae). Joannea Zool 2008, 10, 143–164. [Google Scholar]
- Pecsenye, K.; Bereczki, J.; Tihanyi, B.; Tóth, A.; Peregovits, L.; Varga, Z. Genetic differentiation among the Maculinea species (Lepidoptera: Lycaenidae) in eastern Central Europe. Biol. J. Linn. Soc. 2007, 91, 11–21. [Google Scholar] [CrossRef] [Green Version]
- Tartally, A.; Kelager, A.; Fürst, M.; Nash, D. Host plant use drives genetic differentiation in syntopic populations of Maculinea alcon. PeerJ 2016, 4, e1865. [Google Scholar] [CrossRef] [PubMed] [Green Version]
- Bereczki, J.; Pecsenye, K.; Peregovits, L.; Varga, Z. Pattern of genetic differentiation in the Maculinea alcon species group (Lepidoptera, Lycaenidae) in Central Europe. J. Zool. Syst. Evol. Res. 2005, 43, 157–165. [Google Scholar] [CrossRef]
- Als, T.D.; Vila, R.; Kandul, N.; Nash, D.R.; Yen, S.H.; Hsu, Y.; Mignault, A.; Boomsma, J.J.; Pierce, N.E. The evolution of alternative parasitic life histories in large blue butterflies. Nature 2004, 432, 386–390. [Google Scholar] [CrossRef]
- Ugelvig, L.V.; Vila, R.; Pierce, N.E.; Nash, D.R. A phylogenetic revision of the Glaucopsyche section (Lepidoptera: Lycaenidae), with special focus on the Phengaris-Maculinea clade. Mol. Phylogenetics Evol. 2011, 61, 237–243. [Google Scholar] [CrossRef]
- Sielezniew, M.; Rutkowski, R.; Ponikwicka-Tyszko, D.; Ratkiewicz, M.; Dziekańska, I.; Švitra, G. Differences in genetic variability between two ecotypes of the endangered myrmecophilous butterfly Phengaris (= Maculinea) alcon—the setting of conservation priorities. Insect Conserv. Divers. 2012, 5, 223–236. [Google Scholar] [CrossRef]
- Tartally, A.; Koschuh, A.; Varga, Z. The re-discovered Maculinea rebeli (Hirschke, 1904): Host ant usage, parasitoid and initial food plant around the type locality with taxonomical aspects (Lepidoptera, Lycaenidae). Zookeys 2014, 406, 25–40. [Google Scholar] [CrossRef]
- Tartally, A.; Thomas, J.; Anton, C.; Balletto, E.; Barbero, F.; Bonelli, S.; Bräu, M.; Casacci, L.; Csősz, S.; Czekes, Z.; et al. Patterns of host use by brood parasitic Maculinea butterflies across Europe. Philos. Trans. R. Soc. Lond. B Biol. Sci. 2019, 374, 20180202. [Google Scholar] [CrossRef] [Green Version]
- Bereczki, J.; Pecsenye, K.; Varga, Z.; Tartally, A.; TÓTH, J.P. Maculinea rebeli (Hirschke)—a phantom or reality? Novel contribution to a long-standing debate over the taxonomic status of an enigmatic Lycaenidae butterfly. Syst. Entomol. 2018, 43, 166–182. [Google Scholar] [CrossRef]
- Fraser, D.J.; Bernatchez, L. Adaptive evolutionary conservation: Towards a unified concept for defining conservation units. Mol. Ecol. 2001, 10, 2741–2752. [Google Scholar] [CrossRef] [PubMed]
- Ryder, O.A. Species conservation and systematics: The dilemma of subspecies. Trends Ecol. Evol. 1986, 1, 9–10. [Google Scholar] [CrossRef]
- Kelager, A. Biotic Interactions in Space and Time—The Social Parasitic Butterfly Maculinea alcon and its Hosts as Model System. PhD Thesis, University of Copenhagen, Copenhagen, Denmark, 2015. [Google Scholar]
- Colding-Jørgensen, C.T. Current Genetic Structure of M. alcon in Denmark. Bachelor Project Thesis, University of Copenhagen, Copenhagen, Denmark, 2020. [Google Scholar]
- Gadeberg, R.M.E.; Boomsma, J.J. Genetic population structure of the large blue butterfly Maculinea alcon in Denmark. J. Insect Conserv. 1997, 1, 99–111. [Google Scholar] [CrossRef]
- Vanden Broeck, A.; Maes, D.; Kelager, A.; Wynhoff, I.; WallisDeVries, M.F.; Nash, D.R.; Oostermeijer, J.G.B.; Van Dyck, H.; Mergeay, J. Gene flow and effective population sizes of the butterfly Maculinea alcon in a highly fragmented, anthropogenic landscape. Biol. Conserv. 2017, 209, 89–97. [Google Scholar] [CrossRef]
- Dziekańska, I.; Nowicki, P.; Pirożnikow, E.; Sielezniew, M. A Unique Population in a Unique Area: The Alcon Blue Butterfly and Its Specific Parasitoid in the Białowieża Forest. Insects 2020, 11, 687. [Google Scholar] [CrossRef]
- Hauge, M. Change in Genetic Variation of Maculinea alcon Populations Over Time. MSc Thesis, University of Copenhagen, Copenhagen, Denmark, 2016. [Google Scholar]
- Lomborg, A.E. Population Genetics of Maculinea Species in Southern Scandinavia. MSc Thesis, University of Copenhagen, Copenhagen, Denmark, 2006. [Google Scholar]
- Bijlsma, R.; Bundgaard, J.; Boerema, A. Does inbreeding affect the extinction risk of small populations? Predictions from Drosophila. J. Evol. Biol. 2000, 13, 502–514. [Google Scholar] [CrossRef]
- Saccheri, I.; Kuussaari, M.; Kankare, M.; Vikman, P.; Fortelius, W.; Hanski, I. Inbreeding and extinction in a butterfly metapopulation. Nature 1998, 392, 491–494. [Google Scholar] [CrossRef]
- Ugelvig, L.; Andersen, A.; Boomsma, J.; Nash, D. Dispersal and gene flow in the rare, parasitic Large Blue butterfly Maculinea arion. Mol. Ecol. 2012, 21, 3224–3236. [Google Scholar] [CrossRef]
- Ugelvig, L.; Nielsen, P.; Boomsma, J.; Nash, D. Reconstructing eight decades of genetic variation in an isolated Danish population of the large blue butterfly Maculinea arion. BMC Evol. Biol. 2011, 11, 201. [Google Scholar] [CrossRef] [Green Version]
- Hamm, C.A.; Aggarwal, D.; Landis, D.A. Evaluating the impact of non-lethal DNA sampling on two butterflies, Vanessa cardui and Satyrodes eurydice. J. Insect Conserv. 2010, 14, 11–18. [Google Scholar] [CrossRef]
- Meirmans, P. Genodive version 3.0: Easy-to-use software for the analysis of genetic data of diploids and polyploids. Mol. Ecol. Resour. 2020, 20, 1126–1131. [Google Scholar] [CrossRef] [PubMed] [Green Version]
- Pritchard, J.K.; Stephens, M.; Donnelly, P. Inference of population structure using multilocus genotype data. Genetics 2000, 155, 945–959. [Google Scholar] [CrossRef] [PubMed]
- Evanno, G.; Regnaut, S.; Goudet, J. Detecting the number of clusters of individuals using the software STRUCTURE: A simulation study. Mol. Ecol. 2005, 14, 2611–2620. [Google Scholar] [CrossRef] [Green Version]
- Wickham, H. Ggplot2—Elegant Graphics for Data Analysis; Springer New York: New York, NY, USA, 2009. [Google Scholar]
- Yu, G.; Smith, D.K.; Zhu, H.; Guan, Y.; Lam, T.T.Y. Ggtree: An R package for visualization and annotation of phylogenetic trees with their covariates and other associated data. Methods Ecol. Evol. 2017, 8, 28–36. [Google Scholar] [CrossRef]
- Kassambara, A. ggpubr: ‘ggplot2’ Based Publication Ready Plots, R package version 0.4.0; R Foundation for Statistical Computing: Vienna, Austria, 2020.
- Excoffier, L.; Smouse, P.E.; Quattro, J.M. Analysis of molecular variance inferred from metric distances among DNA haplotypes: Application to human mitochondrial DNA restriction data. Genetics 1992, 131, 479–491. [Google Scholar] [CrossRef]
- Chen, H.; Boutros, P. VennDiagram: A package for the generation of highly-customizable Venn and Euler diagrams in R. BMC Bioinform. 2011, 12, 35. [Google Scholar] [CrossRef] [Green Version]
- Michalakis, Y.; Excoffier, L. A generic estimation of population subdivision using distances between alleles with special reference for microsatellite loci. Genetics 1996, 142, 1061–1064. [Google Scholar] [CrossRef]
- Mantel, N. The detection of disease clustering and a generalized regression approach. Cancer Res. 1967, 27, 209–220. [Google Scholar]
- Thioulouse, J.; Dray, S.; Dufour, A.-B.; Siberchicot, A.; Jombart, T.; Pavoine, S. Multivariate Analysis of Ecological Data with Ade4; Springer New York: New York, NY, USA, 2018. [Google Scholar]
- R Core Team. R: A Language and Environment for Statistical Computing; Version 4.1.0; R Foundation for Statistical Computing: Vienna, Austria, 2021; Available online: https//www.R-project.org (accessed on 30 October 2022).
- Waples, R.S. A generalized approach for estimating effective population size from temporal changes in allele frequency. Genetics 1989, 121, 379–391. [Google Scholar] [CrossRef]
- Nei, M.; Tajima, F. Genetic drift and estimation of effective population size. Genetics 1981, 98, 625–640. [Google Scholar] [CrossRef] [PubMed]
- Do, C.; Waples, R.; Peel, D.; Macbeth, G.; Tillett, B.; Ovenden, J. NeEstimator v2: Re-implementation of software for the estimation of contemporary effective population size (Ne) from genetic data. Mol. Ecol. Resour. 2014, 14, 209–214. [Google Scholar] [CrossRef] [PubMed]
- Noe-Nygård, N.; Knudsen, K.-L.; Houmark-Nielsen, M. Fra istid til og med jægerstenalder. In Naturen i Danmark: Geologien; Sand-Jensen, K., Ed.; Gyldendal: Copenhagen, Denmark, 2006; pp. 303–332. [Google Scholar]
- Hansen, A. Gentianaceernes, Menyanthaceernes, Asclepiadaceernes og Apocynaceernes udbredelse i Danmark. In Danmarks Topografisk-Botaniske Undersøgelse; Dansk Botanisk Forening: Copenhagen, Denmark, 1958; Volume 24, pp. 305–332. [Google Scholar]
- Odgaard, B.V. The Holocene vegetation history of northern West Jutland, Denmark. Opera Bot. 1994, 123, 1–171. [Google Scholar] [CrossRef]
- Hansen, J.M.; Aagaard, T.; Stockmarr, J.; Møller, I.; Nielsen, L.; Binderup, M.; Larsen, J.H.; Larsen, B. Continuous record of Holocene sea-level changes and coastal development of the Kattegat island Læsø (4900 years BP to present). Bull. Geol. Soc. Den. 2016, 64, 1–55. [Google Scholar] [CrossRef]
- Hansen, A.K.; Justesen, M.J.; Kepfer-Rojas, S.; Byriel, D.B.; Pedersen, J.; Solodovnikov, A. Ecogeographic patterns in a mainland-island system in Northern Europe as inferred from the rove beetles (Coleoptera: Staphylinidae) on Laeso island. Eur. J. Entomol. 2018, 115, 256–263. [Google Scholar] [CrossRef] [Green Version]
- Rasmussen, S.; Nielsen, J.; Jones, O.; Berg, T.; Pertoldi, C. Genetic structure of the European hedgehog (Erinaceus europaeus) in Denmark. PLoS ONE 2020, 15, e0227205. [Google Scholar] [CrossRef] [Green Version]
- Pertoldi, C.; Ruiz-Gonzalez, A.; Bahrndorff, S.; Renee Lauridsen, N.; Nisbeth Henriksen, T.; Eskildsen, A.; Høye, T. Strong isolation by distance among local populations of an endangered butterfly species (Euphydryas aurinia). Ecol. Evol. 2021, 11, 12790–12800. [Google Scholar] [CrossRef]
- Meirmans, P.; Hedrick, P. Assessing population structure: F(ST) and related measures. Mol. Ecol. Resour. 2011, 11, 5–18. [Google Scholar] [CrossRef]
- Zhang, D.-X.; Hewitt, G.M. Nuclear DNA analyses in genetic studies of populations: Practice, problems and prospects. Mol. Ecol. 2003, 12, 563–584. [Google Scholar] [CrossRef]
- Bereczki, J.; Tóth, J.P.; Sramkó, G.; Varga, Z. Multilevel studies on the two phenological forms of Large Blue (Maculinea arion) (Lepidoptera: Lycaenidae). J. Zool. Syst. Evol. Res. 2014, 52, 32–43. [Google Scholar] [CrossRef]
- Dincă, V.; Dapporto, L.; Somervuo, P.; Vodă, R.; Cuvelier, S.; Gascoigne-Pees, M.; Huemer, P.; Mutanen, M.; Hebert, P.; Vila, R. High resolution DNA barcode library for European butterflies reveals continental patterns of mitochondrial genetic diversity. Commun. Biol. 2021, 4, 315. [Google Scholar] [CrossRef] [PubMed]
- Habel, J.C.; Schmitt, T. The genetic consequences of different dispersal behaviours in Lycaenid butterfly species. Bull. Entomol. Res. 2009, 99, 513–523. [Google Scholar] [CrossRef] [PubMed]
- Krauss, J.; Schmitt, T.; Seitz, A.; Steffan-Dewenter, I.; Tscharntke, T. Effects of habitat fragmentation on the genetic structure of the monophagous butterfly Polyommatus coridon along its northern range margin. Mol. Ecol. 2004, 13, 311–320. [Google Scholar] [CrossRef] [Green Version]
- Sielezniew, M.; Patricelli, D.; Rutkowski, R.; Witek, M.; Bonelli, S.; Buś, M.M. Population genetics of the endangered obligatorily myrmecophilous butterflyPhengaris(=Maculinea)arionin two areas of its European range. Insect Conserv. Divers. 2015, 8, 505–516. [Google Scholar] [CrossRef]
- Andersen, A. Population genetics of reintroduced and source populations of the socially parasitic Large Blue Butterfly Maculinea arion. MSc Thesis, Department of Biology, University of Copenhagen, Copenhagen, Denmark, 2012. [Google Scholar]
- Taberlet, P.; Luikart, G. Non-invasive genetic sampling and individual identification. Biol. J. Linn. Soc. 1999, 68, 41–55. [Google Scholar] [CrossRef]


| Locality | Sampling Year | # Sequenced | # Included | NA | NE | HO | HS | GIS |
|---|---|---|---|---|---|---|---|---|
| Læsø: WGC | 2018 | 20 | 18 | 3.2 | 2.31 | 0.36 | 0.52 | 0.3 |
| Læsø: ALS | 2018 | 10 | 9 | 3.3 | 2.52 | 0.48 | 0.58 | 0.17 |
| Læsø: LN | 2018 | 20 | 17 | 3.7 | 2.64 | 0.47 | 0.56 | 0.16 |
| Læsø: LS | 2018 | 10 | 7 | 3.2 | 2.36 | 0.53 | 0.57 | 0.07 |
| Tversted Rimmer | 2021 | 16 | 15 | 1.3 | 1.25 | 0.15 | 0.14 | −0.11 |
| Hansted | 2019 | 18 | 14 | 2.6 | 1.84 | 0.46 | 0.41 | −0.12 |
| Vestergård | 2019 | 8 | 8 | 2.7 | 2.08 | 0.26 | 0.49 | 0.48 |
| Klosterheden | 2021 | 7 | 7 | 2.6 | 2.07 | 0.39 | 0.49 | 0.21 |
| Sørup Sande | 2021 | 2 | 2 | 2.1 | 1.89 | 0.35 | 0.58 | 0.39 |
| Lønborg Hede | 2021 | 9 | 9 | 2.6 | 2.13 | 0.417 | 0.5 | 0.17 |
| Vorbasse | 2019 | 4 | 4 | 2.8 | 2.24 | 0.46 | 0.54 | 0.15 |
| Vejers | 2019 | 1 | 1 | - | - | - | - | - |
| Fanø | 2019 | 30 | 30 | 3.3 | 2.08 | 0.43 | 0.47 | 0.09 |
| Rømø | 2019 | 15 | 15 | 4.1 | 2.54 | 0.54 | 0.59 | 0.09 |
| Ålbæk Stampemølle | 2021 | 16 | 16 | 2.4 | 1.83 | 0.29 | 0.35 | 0.17 |
| Frøslev Mose | 2005 | 16 | 12 | 3 | 2.35 | 0.26 | 0.53 | 0.51 |
| Total | - | 202 | 184 |
| Locality | Sampling Year | # Sequenced | # Included | NA | NE | HO | HS | GIS |
|---|---|---|---|---|---|---|---|---|
| Læsø: WGC | 2018 | 20 | 20 | 3.25 | 2.52 | 0.39 | 0.59 | 0.33 |
| Læsø: ALS | 2018 | 10 | 10 | 2.5 | 2.23 | 0.49 | 0.58 | 0.14 |
| Læsø: LN | 2018 | 20 | 20 | 3.25 | 2.24 | 0.4 | 0.53 | 0.25 |
| Læsø: LS | 2018 | 10 | 10 | 3.25 | 2.29 | 0.45 | 0.58 | 0.22 |
| Læsø | 1934 | 6 | 6 | 1.67 | 1.64 | 0.6 | 0.33 | −0.8 |
| Læsø | 1956 | 16 | 6 | 2 | 1.89 | 0.41 | 0.53 | 0.22 |
| Læsø | 1964 | 13 | 13 | 2.33 | 1.43 | 0.42 | 0.27 | −0.69 |
| Læsø | 1976 | 13 | 13 | 2 | 1.59 | 0.29 | 0.36 | 0.19 |
| Lille Vildmose | 1941 | 1 | 1 | - | - | - | - | - |
| Udbyhøj | 1949 | 1 | 1 | - | - | - | - | - |
| Hammer Bakker | 1925 | 14 | 12 | 2.25 | 1.64 | 0.22 | 0.36 | 0.37 |
| Hammer Bakker | 1946 | 8 | 8 | 2.5 | 2.03 | 0.26 | 0.38 | 0.31 |
| Tversted Rimmer | 2021 | 16 | 15 | 1.25 | 1.25 | 0.1 | 0.13 | 0.23 |
| Hvims | 1961 | 15 | 15 | 2.75 | 2.22 | 0.32 | 0.49 | 0.34 |
| Kandestederne | 1971 | 16 | 15 | 3.25 | 2.29 | 0.55 | 0.52 | −0.07 |
| Slettestrand | 1941 | 15 | 15 | 2.5 | 1.82 | 0.21 | 0.46 | 0.54 |
| Hune | 1916 | 1 | 1 | - | - | - | - | - |
| Hune | 1932 | 1 | 0 | - | - | - | - | - |
| Lendrup | 1973 | 1 | 1 | - | - | - | - | - |
| Østerild | 1930 | 1 | 1 | - | - | - | - | - |
| Hansted | 1954 | 16 | 16 | 3.25 | 2.3 | 0.37 | 0.46 | 0.2 |
| Hansted | 1961 | 2 | 2 | 1.67 | 1.67 | 0 | 0.67 | 1 |
| Hansted | 2019 | 18 | 18 | 2.25 | 1.57 | 0.36 | 0.3 | −0.2 |
| Vestergård | 2019 | 8 | 8 | 2.25 | 1.89 | 0.13 | 0.4 | 0.69 |
| Legind Bjerge | 1961 | 14 | 14 | 2 | 1.91 | 0.55 | 0.49 | −0.13 |
| Lem Hede | 1961 | 12 | 11 | 2 | 1.69 | 0.39 | 0.43 | 0.09 |
| Havris Hede | 1961 | 8 | 6 | 3 | 2.07 | 0.58 | 0.53 | −0.09 |
| Venø | 1948 | 16 | 16 | 2.33 | 1.75 | 0.44 | 0.43 | −0.02 |
| Klosterheden | 1967 | 14 | 12 | 4 | 2.26 | 0.63 | 0.58 | −0.1 |
| Klosterheden | 2021 | 7 | 7 | 2.5 | 1.88 | 0.25 | 0.5 | 0.5 |
| Husby | 1980 | 16 | 15 | 3.5 | 2.76 | 0.43 | 0.63 | 0.32 |
| Sørup Sande | 2021 | 2 | 2 | 2.5 | 2.13 | 0.63 | 0.69 | 0.09 |
| Lønborg Hede | 2021 | 9 | 9 | 3 | 2.71 | 0.5 | 0.64 | 0.22 |
| Vorbasse | 2019 | 4 | 4 | 2.5 | 2.28 | 0.38 | 0.54 | 0.31 |
| Vejers | 2019 | 1 | 1 | - | - | - | - | - |
| Oksby | 1961 | 8 | 7 | 2.75 | 2.27 | 0.67 | 0.58 | −0.14 |
| Fanø | 1923 | 13 | 13 | 3.75 | 2.59 | 0.61 | 0.6 | −0.01 |
| Fanø | 1949 | 16 | 15 | 4.25 | 3.02 | 0.56 | 0.65 | 0.14 |
| Fanø | 2019 | 30 | 30 | 3.5 | 2.17 | 0.5 | 0.49 | −0.01 |
| Gånsager | 1938 | 3 | 3 | 2.67 | 2.31 | 0.67 | 0.67 | 0 |
| Rømø | 2019 | 15 | 15 | 4.25 | 2.39 | 0.47 | 0.6 | 0.23 |
| Ålbæk Stampemølle | 2021 | 16 | 16 | 3 | 2.43 | 0.44 | 0.56 | 0.2 |
| Frøslev Mose | 1934 | 11 | 11 | 2.75 | 2.56 | 0.38 | 0.59 | 0.36 |
| Frøslev Mose | 2005 | 16 | 16 | 3 | 2.04 | 0.24 | 0.52 | 0.55 |
| Visø Mose | 1968 | 7 | 6 | 3 | 2.26 | 0.46 | 0.58 | 0.21 |
| Total | - | 481 | 456 | - | - | - | - | - |
| Dataset | Source | Within | %var | F-Statistic | Value | p |
|---|---|---|---|---|---|---|
| Combined | Within individuals | - | 63.5 | FIT | 0.365 | - |
| Among individuals | Locations | 12.9 | FIS | 0.169 | <0.001 | |
| Among locations | Region | 15.1 | FSC | 0.165 | <0.001 | |
| Among regions | - | 8.5 | FCT | 0.085 | <0.001 | |
| Contemporary (12 loci) | Within individuals | - | 56.3 | FIT | 0.437 | - |
| Among individuals | Locations | 13.1 | FIS | 0.189 | <0.001 | |
| Among locations | Region | 17.8 | FSC | 0.204 | <0.001 | |
| Among regions | - | 12.9 | FCT | 0.129 | <0.001 | |
| Contemporary (4 loci) | Within individuals | - | 57.1 | FIT | 0.429 | - |
| Among individuals | Locations | 15.2 | FIS | 0.210 | <0.001 | |
| Among locations | Region | 18.1 | FSC | 0.200 | <0.001 | |
| Among regions | - | 9.7 | FCT | 0.097 | 0.002 |
| Dataset | Region | Mantel’s r | p |
|---|---|---|---|
| Contemporary | Denmark | +0.36 | <0.001 |
| (geographical) | West Jutland | +0.07 | 0.42 |
| North Jutland | +0.22 | 0.24 | |
| Læsø | +0.61 | 0.035 | |
| Contemporary | Denmark | +0.25 | 0.08 |
| (temporal) | |||
| Combined | Denmark | +0.10 | 0.09 |
| (geographical) | |||
| Combined | Denmark | +0.06 | 0.15 |
| (temporal) |
Publisher’s Note: MDPI stays neutral with regard to jurisdictional claims in published maps and institutional affiliations. |
© 2022 by the authors. Licensee MDPI, Basel, Switzerland. This article is an open access article distributed under the terms and conditions of the Creative Commons Attribution (CC BY) license (https://creativecommons.org/licenses/by/4.0/).
Share and Cite
Boe, A.M.B.; Simonsen, T.J.; Colding-Jørgensen, C.T.; Folman, P.H.; Jensen, T.T.; Spencer, K.J.; Thomsen, P.F.; Nash, D.R. Spatial and Temporal Patterns of Genetic Diversity and Structure in Danish Populations of the Alcon Blue Butterfly Phengaris alcon (Denis & Schiffermüller). Diversity 2022, 14, 1098. https://doi.org/10.3390/d14121098
Boe AMB, Simonsen TJ, Colding-Jørgensen CT, Folman PH, Jensen TT, Spencer KJ, Thomsen PF, Nash DR. Spatial and Temporal Patterns of Genetic Diversity and Structure in Danish Populations of the Alcon Blue Butterfly Phengaris alcon (Denis & Schiffermüller). Diversity. 2022; 14(12):1098. https://doi.org/10.3390/d14121098
Chicago/Turabian StyleBoe, Andreas M. B., Thomas J. Simonsen, Camilla T. Colding-Jørgensen, Philip H. Folman, Thomas T. Jensen, Kian J. Spencer, Philip F. Thomsen, and David R. Nash. 2022. "Spatial and Temporal Patterns of Genetic Diversity and Structure in Danish Populations of the Alcon Blue Butterfly Phengaris alcon (Denis & Schiffermüller)" Diversity 14, no. 12: 1098. https://doi.org/10.3390/d14121098