Article

Agricultural Land-Use Increases Floral Species Richness in Tropical Dry Forest and Savannah Ecosystems in West Africa

1
CIRAD, Forêts et Sociétés, 34398 Montpellier, France
2
Forêts et Sociétés, University Montpellier, CIRAD, 34090 Montpellier, France
3
Département de Botanique, Université de Lomé, LBEV, Lomé 1515, Togo
4
Faculté de Géographie, Université Paris-Diderot, LADYSS, 75013 Paris, France
*
Author to whom correspondence should be addressed.
Diversity 2022, 14(2), 106; https://doi.org/10.3390/d14020106
Submission received: 14 December 2021 / Revised: 25 January 2022 / Accepted: 28 January 2022 / Published: 1 February 2022
(This article belongs to the Section Biodiversity Conservation)

Abstract

:
The diversity and structure of plant communities are valuable indicators for assessing landscape quality. Land-use change is one of the main factors considered to affect and have the strongest impacts on biodiversity. In this study, we assessed the effects of the conversion of tropical dry forests and savannahs into agricultural lands on the floral diversity and the structure of the vegetation. For this purpose, we carried out vegetation surveys in 198 plots of 50 m × 50 m. Within each plot, we documented all herbaceous, shrubby, and tree species present. We calculated total, spatial, and local floral diversities by land-use types and characterized the structure of the plant communities. Our results show that the overall floral diversity of the study area remains quite high (483 species of vascular plants from 298 genera and 71 families) and was not strongly impacted by agricultural land use (Pareto inequality index is 23–77). Croplands had the highest spatial (9.4) and local diversities. There was no significant difference between the land-use types in terms of the native species richness while croplands harbored significantly the most alien species. Agricultural land use significantly affected the structure of the plant communities. Trees are very rare in croplands and are frequent in forests and savannahs. The clearing of Guinean dry forests and savannahs for cropping did not automatically lead to a loss of some aspects of ordinary floral diversity. For a better understanding of the effects of land-use change on biodiversity, it would then be more suitable to specify in the studies whether the species concerned are native, alien, generalist, or specialist.

1. Introduction

Biodiversity is a fundamental characteristic of the biosphere through the many services it provides. In the face of multiple assessments and reports documenting the huge loss of biodiversity, the preservation of biodiversity is one of the greatest environmental concerns of the century. Indeed, the current rate of extinction of species is at an “unprecedented” level and is expected to increase during the Anthropocene [1,2,3]. According to [2], 39% of all vascular plant species would be threatened with extinction.
Land-use change is one of the main drivers affecting and having the strongest impact on global biodiversity [1,4]. Over the last millennium, almost three-quarters of the Earth’s land surface has been modified by human activities [5]. In the current context of the biodiversity crisis, understanding the vegetation change under the effect of human activities has become a major challenge for ecology [6]. The understanding of human-mediated vegetation change should make it possible to identify risks associated with certain human activities (agricultural practices, introduction, and use of exotic plants), direct public policies towards more sustainable management practices, and establish scenarios for the future. Indeed, the clearing of natural landscapes for agriculture can significantly reduce the native biodiversity [7,8,9] and promote alien species that can spread and become invasive [10,11]. And yet, the link between species invasions and the extinction of native species is widely accepted, although the effects of alien plant invasions on the native plant species extinction are much less clear [12]. Some studies had also demonstrated that agricultural land use, by promoting other species, does not inevitably lead to a loss of local biodiversity [13].
In tropical West Africa, landscape change is mainly due to the development of extensive agriculture and deforestation [14,15]. In particular, semi-natural habitats—savannahs and forests within protected areas—are increasingly being cleared to accommodate food crops, Teak, and Palm plantations [16,17]. It is becoming necessary to implement more sustainable management practices that meet the needs of populations while limiting potential impacts on biodiversity.
As in other West African countries, semi-natural habitats in Togo are undergoing significant changes due to human activities such as agricultural expansion, illegal logging, and incursions into protected areas [18,19,20]. Over the last five decades, like in other West African countries, the Togodo Protected Area (TPA) in south-eastern Togo—whose primary purpose is biodiversity conservation—and surrounding areas underwent notable land-use and land cover changes [21]. Croplands, fallows, and teak or oil palm plantations were established at the expense of dry forests and savannahs. However, the effects of these land-use changes on the structure and floral diversity of plant communities in and around the Togodo protected area are still poorly understood.
Based on the aforementioned, this study aims to provide insights into how different land-use types affect the total floral diversity and plant communities’ heterogeneity; (2) the spatial and local floral diversities; and (3) the structure of plant formations. To that end, we compared floral diversities, native and exotic species richness, and the structure of plant communities between land-use types.
We hypothesized that, in and around the Togodo protected area, the conversion of forests and savannahs into agricultural land uses would affect the floral diversities and would have a characterizable influence on the vegetation structure.

2. Materials and Methods

2.1. Materials: The Study Area and Sampling
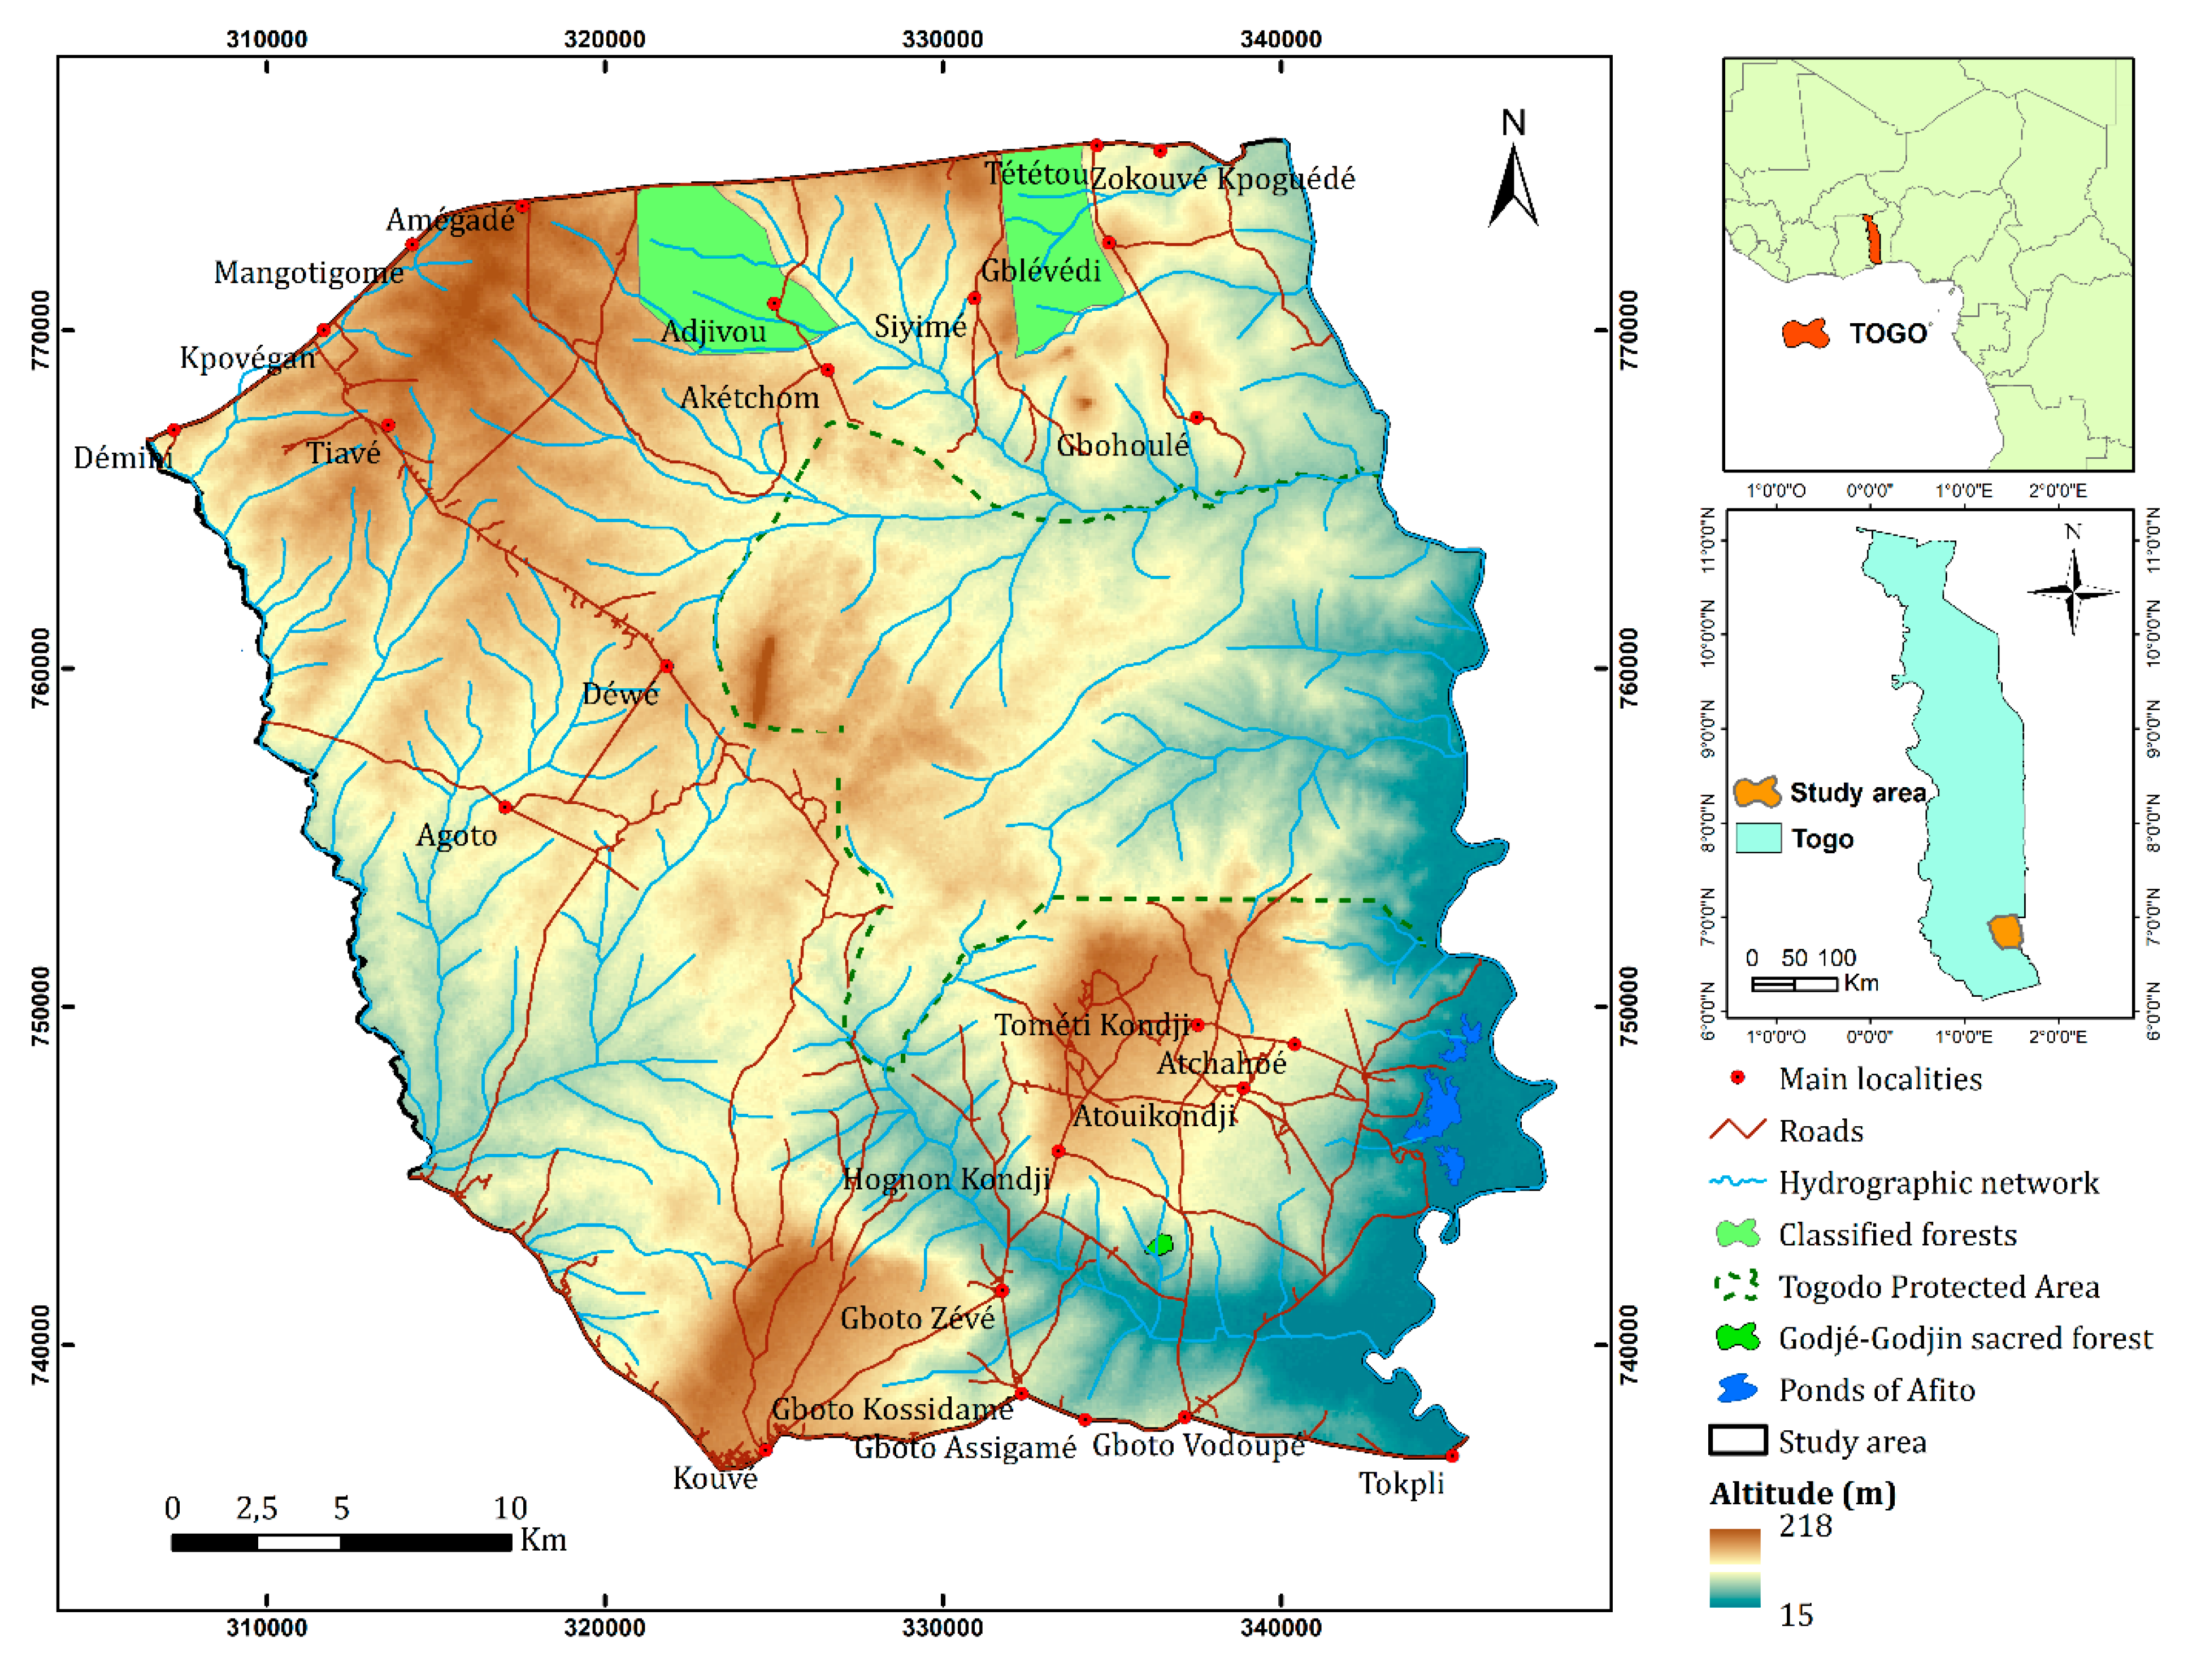
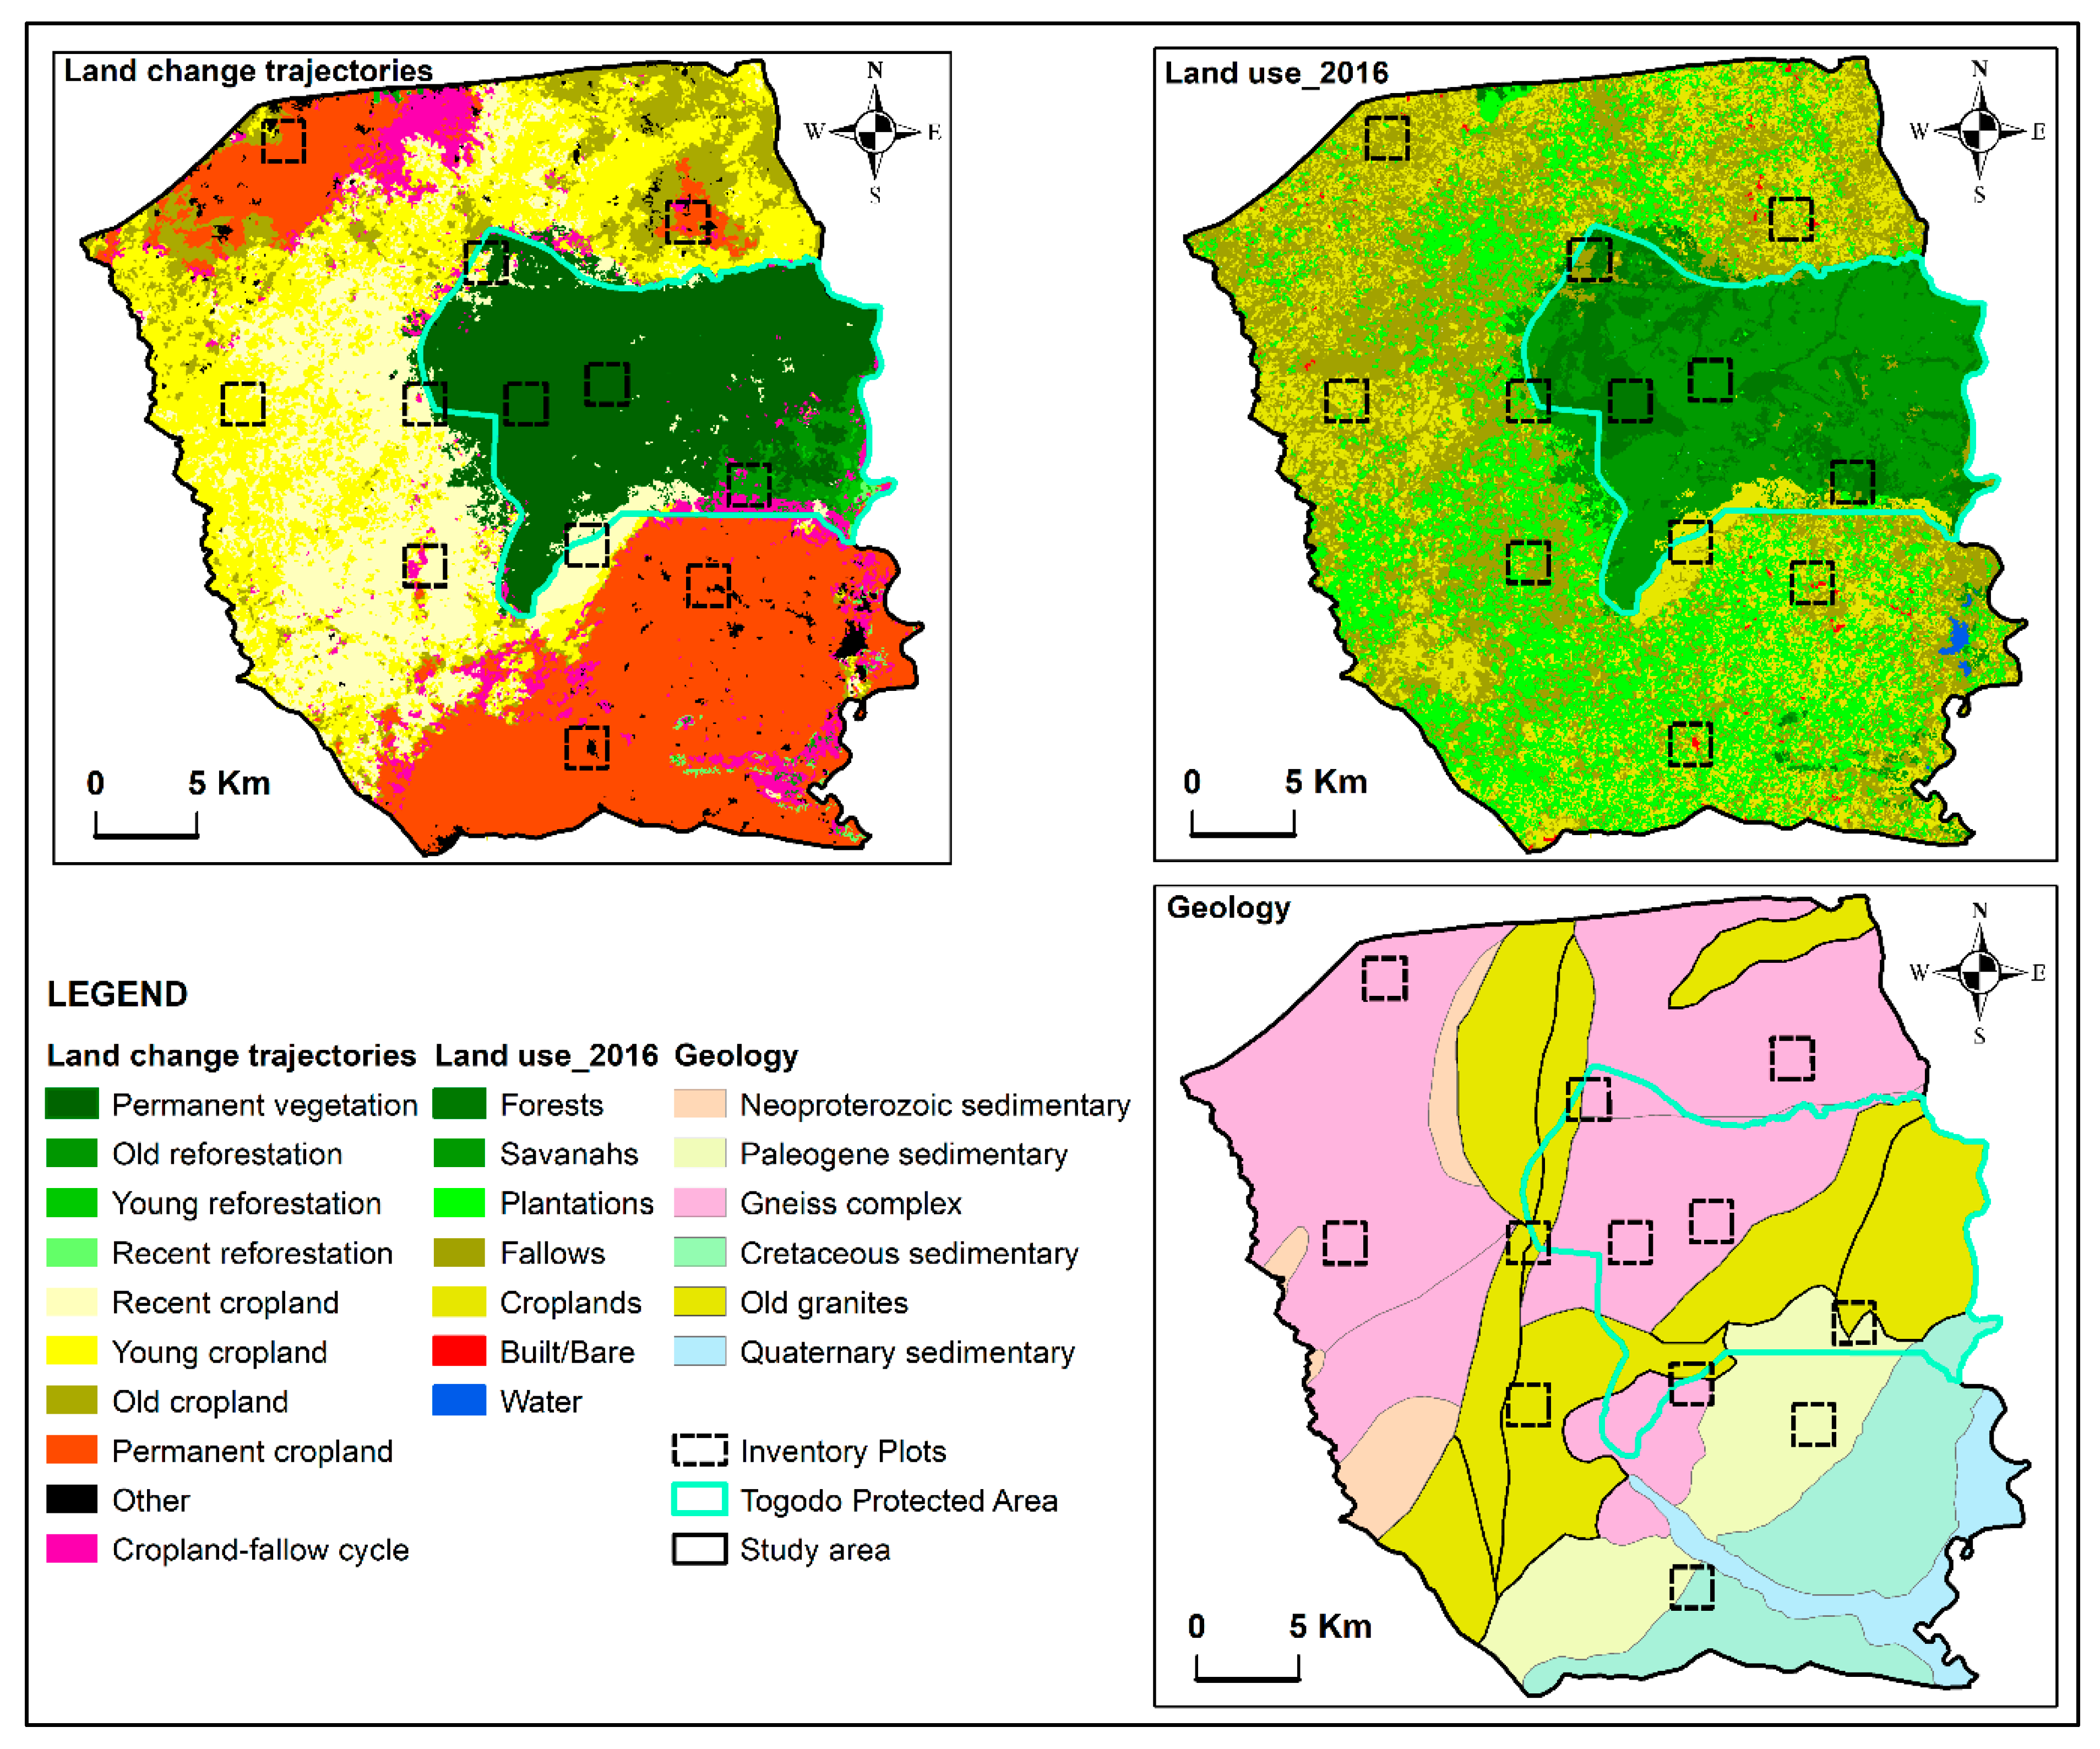
2.1.1. Study Area

The study area is located in south-eastern Togo (Figure 1), administratively straddling the prefectures of Haho in the north (plateau region) and Yoto in the south (maritime region). Geographically, it lies between 6°39′ and 7°0′ northern latitudes and between 1°14′ and 1°37′ eastern longitudes, covering an area of 1193 sq. km. It is established around the Togodo Protected Area, with the Asrama and Tététou classified forests in the north and the Godjé-Godjin sacred forest and the Afito ponds in the south. These ecosystems contain a rich diversity of plants and animals, including endangered species on the IUCN Red List [22].
The climate of the survey area is sub-equatorial or Guinean [23] with two rainy seasons, a large one from March to July (maximum in June) and a small one from August to October. The annual thermal amplitude varies a little. The average annual rainfall at the Tabligbo station, the closest to the study area, calculated over a series of 49 years of observations [24] is about 1061 mm with a standard deviation of 142 mm [21].
Consistent with the framework of [25], the temporal scale of the changes and the size make the Togodo protected area and surroundings a suitable area to analyze the effect of land-use changes on vegetation changes. Indeed, vegetation changes are the result of interactions between several drivers that operate at varying temporal and spatial scales [26]. However, at each of these scales, there is one factor that is a priori dominant. [25] proposed framework highlights the spatial scales at which the underlying drivers of vegetation change act and the temporal scale at which plant communities respond. According to that framework, at an intermediate spatial scale, the vegetation changes on a multi-decadal scale are mainly related to land-use changes caused by human activities [6,25].

2.1.2. Stratified Sampling

Data collection was carried out in November 2017. The sampling design of the vegetation survey was stratified [27]. The stratified sampling is well adapted to the discontinuous structures of the mosaic landscapes and for the studies of the relationships between vegetation and ecological descriptors [28].
The study area was then divided into several strata which are slightly heterogeneous based on the selected land-use map variables. The survey sites were selected based on land uses of 2016, land-use change trajectories identified between 1974, 1986, 2003, and 2016 [21]. In the framework of this study, we tried to consider, in a synchronic approach, the evolution over time of the ecosystems in the study area. Considering the trajectories of land-use change, the sampling was done in a way to have recently disturbed croplands, less recently disturbed fallows, and very few disturbed forests and savannahs. In addition to land uses, we distributed the plots to cover a range of the main bedrock types (Figure 2) based on an existing geological map [29].
A total of 12 blocks of 2 km × 2 km were surveyed (Figure 2). The conventional surface survey method [30,31,32,33] was used for data collection. Within each block, 50 m × 50 m (0.25 ha) survey plots were installed every 200 m along 2 km north-south and east-west transects (Figure 3) to cover most of the floral and ecological diversity [34,35]. The plots, whose center coordinates were previously recorded, were located using the GARMIN 64S GPS. We carried out phytosociological and ecological surveys on 198 plots. We noted all the plant species present per stratum (herbaceous, shrubby, and woody) with their abundance-dominance index according to the Braun-Blanquet index [36].
For each plot, we recorded other information such as the types of land uses (CH: croplands, FO: forests, HA: home gardens, JC: fallows, PA: palm oil plantations, SA: savannahs, and TK: teak plantations) and the degree of plant formation closure. The degree was noted according to whether one can run or walk through it (1: very low closure, can be run through, 2: low or medium closure, can be walked through, and 3: high closure, requires a cutlass to make a path through).
The determination of species names was based on the analytical flora of Togo [37] and the analytical flora of Benin [38]. Plant species whose identification was confusing in the field were photographed or collected to ensure their determination at the Laboratoire de Botanique et Écologie Végétale of the University of Lomé (Togo). To standardize species names, the taxonomy of “The Plant List” (version 1.1; http://www.theplantlist.org) (accessed on 13 December 2021) was used (i.e., synonyms were replaced by accepted scientific names) using the R package Taxonstand [39]. Families according to the APG III nomenclature were determined using the getTaxonomy function of the R BIOMASS package [40].

2.2. Methods: Data Analysis

2.2.1. Total, Spatial, and Local Floral Diversities

To assess the floral diversity in the whole study area and each land-use type, we calculated, with Brillouin’s index, the total diversity—diversity of all surveys in the study area, which is the equivalent of the classical gamma diversity—the spatial diversity (beta)- diversity of all surveys in each land-use type—and the local diversity (alpha) of each survey [41]. According to [42], the Shannon index, an approximation of diversity is based on estimated probabilities corresponding to relative frequencies calculated in a universe of infinite size, which is not the case in ecology. Thus, based on the identified biases, [43] recommended that the use of the Shannon index be discontinued as a basis for assessing diversity in ecological research. Nevertheless, to allow a comparison of our results with other studies, we also calculated the local diversity of each survey using the Shannon index.
Brillouin’s formula, which is based on Fisher’s exact probabilities [44,45], does not suffer from any estimation bias [46]. The Brillouin index [46,47,48], enables the calculation of biodiversity indices, including total, spatial and local diversity. The Brillouin index is given by Equation (1):
B = ( 1 / N ) × log 2 ( N ! / 1 s n i ! )
B is in Binons “the unity of B is the binon” or Shannon (International Information Unit), where
S = species richness (number of species identified in the survey),
N = total survey number (sum of absolute frequencies of all species), such as in Equation (2),
N = i = 1 S n i
ni = abundance (number of occurrences, absolute frequency) of species, such as in Equation (3)
ni! = factor of ni
n i = 1 × 2 × 3 × × n i
For the calculation of the floral diversities from the frequencies, the occurrences are obtained by replacing the Braun-Blanquet abundance score of each species with “1” (presence). The calculations of diversity were performed using the functions programmed into the DYALOG 16.0 software package (downloaded from https://www.dyalog.com) (accessed on 13 December 2021).
As the number of samples in each land-use type was unequal, we compared the spatial floral diversity of the different land-use types using interpolation (rarefaction) and extrapolation curves [49,50]. We used the R package iNEXT [51] to compute the interpolated and extrapolated spatial floral diversity.
We performed multiple comparisons of the average local floral diversities for pair-wise comparison between land-use types using the R package multcomp [52] and Wilcoxon multiple comparison tests with the most commonly used Bonferroni and BH (Benjamini and Hochberg) adjustments. The multcomp allows multiple comparisons in general parametric models, including linear, generalized linear, linear mixed-effects, and survival models [53]. To get a better view of the distribution and the standard error of local floral diversities of each land-use type, we performed canonical RDA (Redundancy Analysis) using the R package vegan [54].

2.2.2. Assessment of Plant Community Heterogeneity: The Species-Area Curve and the Concentration Curve or Pareto Curve

In phytosociology, one of the most widely used methods to assess heterogeneity of the plant communities is the species-area curve and concentration curve. The species-area curve [55], shows the increase in the number of species as a function of the increase in the surface area or sample size observed. Its generalization is based on the “uniform” model, which is better suited to structure analysis than the Poisson distribution or the Gaussian distribution [56]. To better assess the heterogeneity, we compared the ‘normal’ species-area curve that would have been observed by a uniform model to the two species-area curves observed when looking at the records from the beginning (first plot) to the end (last plot) and in reverse order (last plot to first plot) [56]. The closer these curves are to the normal, the more homogeneous the landscape, and the more these curves deviate from the normal, the more heterogeneous the landscape. In addition to the species-area curve, we computed the concentration or Pareto curve [48,57,58].

2.2.3. Assessment of the Vertical Structure of Plant Communities

To understand the effect of land use on the vertical structure of plant communities, we calculate the “exact” probability (in the Fisher sense) [44,59] of each contingency between two descriptors. We first analyzed the relationships between land-use and strata structure, i.e., the frequency of different strata (tree, shrub, and herbaceous). Then, we analyzed the relationships between land use and the level of closure of plant communities. The result is a table showing, in each box, the information provided by the difference between the observed value and the expected value given by a uniform model following a hypergeometric distribution [60], where the values would be independent.
We calculated the information following Fisher’s exact probabilities by applying the formula [41]:
I = log 2 ( 1 / P )
where P is the probability of the contingency table of collected observations.
This means that observation provides as much information as is unlikely a priori, and unexpected. Greater is the information calculated the more remarkable is the linkage, either because it is much stronger than its expected value (positive value), or because it is much weaker (negative value). Often used with small samples, Fisher’s exact test is more accurate and more transparent than the Chi-square test, an inferential statistic commonly used test for the dependency between variables analysis [61].

2.2.4. Analysis of Native and Alien Species

Using databases GloNAF (Global Naturalized Alien Flora) [62] and GISD (Global Invasive Species Database) of the IUCN (http://www.iucngisd.org/gisd) (accessed on 13 December 2021), we determined the native or alien status of our observed species. Then, we compared the native and alien species richness between land-use types using GLMs, with the post hoc Bonferroni multiple comparisons, using R 3.6.1 [63].

3. Results

3.1. Total Diversity and Plant Communities’ Heterogeneity

The species richness recorded in the plant formations of the Togodo protected area and surroundings includes 483 species of vascular plants from 298 genera and 71 families. The overall diversity of all occurrences in all surveys is 10.6 binons. This total diversity is close to those found in comparable situations in West Africa.
The two observed curves (in blue and green) of the species-area curve (Figure 4), which reflect the increase in the number of species when looking at the plots one after the other, in the order of their observation (from the first plot to the last plot) and reverse order (from the last plot to the first plot), were quite close to the “normal” curve (in red), although slightly below. The closeness of the observed curves to the normal curve suggests that, overall, our study site is weakly heterogeneous in terms of species richness. Thus, agricultural land use would not lead to a significant variation in species richness in our study area.
Figure 5 shows the concentration curve obtained from our surveys. The Pareto inequality index for our surveys is 23–77. This means that, in our studied landscape, 23% of the species account for 77% of the frequencies, and, conversely, 77% of non-dominant species share only 23% of the frequencies. Inequalities are therefore slightly higher than the classical 20–80, which is the most frequently encountered situation, and this is due to the relatively large number of dominant species in some agricultural land-uses.

3.2. Spatial Floral Diversity by Land-Use Type

The spatial diversities for the occurrences of the 7 land-use types (cropland CH, forest FO, home garden HA, fallow JC, palm plantation PA, savannah SA and teak plantation TK) are respectively: 9.4, 6.5, 6.7, 8.9, 7.2, 8.3 and 7.0. Therefore, forests have the lowest spatial diversity while cropland and fallow have the highest spatial diversity. The interpolation and extrapolation of the expected number of species show similar results. Cropland and fallow are the richest in species, while forest and teak plantations hold the lowest numbers of species (Figure 6).

3.3. Local Diversity by Land-Use Types

The box plot of local diversities for occurrences by survey and land-use types shows that there are few significant differences between land-use types in terms of their local species richness or diversity (Figure 7). The significant difference, at the threshold of 1 per thousand (0.001), is between croplands and savannahs.
The canonical redundancy analysis (Figure 8) shows that cropland is the only one of the 7 land-use types that are sufficiently distinct from the others. Most of the local diversities of the cropland surveys are the highest, while those of the savannah surveys are the lowest. In contrast to the multiple comparisons, it can therefore be stated that the fields are significantly richer in local floral diversity.
The three tests of average comparison (Appendix A) show, at the 5 percent (0.05) threshold, in addition to the difference between savannah and croplands, that the local diversities of croplands are higher than those of forests, palm oil plantations and savannahs. Similarly, fallows have a richer local diversity than savannahs.
The investigation of the relationship between the different strata and the land-use types (Table 1) shows that trees are very rare (almost 20 times less than if the distribution was uniform across all land-use types) in croplands and are frequent in forests and savannahs (6 times more than normal). Woody stratum is also common in teak plantations and is less frequent but not absent in home gardens and fallows. The shrub stratum is more frequent than expected in croplands and palm plantations. Herbaceous weeds are most common in croplands.
Similar to the strata organization, and in contrast to floral diversities, agricultural land uses had a strong effect on the closure of the plant communities in and around the Togodo protected area. The relationships between land-use types and the level of closure of plant communities (Table 2) show that croplands and home gardens almost had very low closure. Forests and palm plantations were very closed. Fallows rarely had a very low closure. Savannah and teak plantations had a low closure.

3.4. Native and Alien Species

Alien species richness varied significantly between land-use types (Figure 9A). Croplands and home gardens harbored significantly more alien species than other land-use types, while there were fewer alien species in savannahs and forests. However, there is no significant difference between the land-use types in terms of the native species richness (Figure 9B). This indicates that the significant difference observed between local diversities could be related to the difference in the terms of alien species richness.

4. Discussion

Despite the conversion of dry forests and Guinean savannahs into agricultural lands, the effects of these land-use changes on the floral diversity and the structure of plant communities are still poorly documented in and around the Togodo protected area. In this study, we addressed this dearth of knowledge. Thus, we assessed the impact of land uses on the floral diversities and the plant communities’ vertical structure within the Togodo protected area and its surroundings human-mediated landscapes.

4.1. Total Diversity and Plant Communities’ Heterogeneity

Despite human disturbance, the total floral diversity of the study area was not strongly impacted. The total floral diversity of the study area is close to the average observed in tropical West Africa [64]. The Pareto index value of 23–77 for our surveys (Figure 5) is close to the average value for moderately disturbed survey sets [56]. Indeed, the old-growth rainforest, one of the most regulated natural ecosystems, is at 20–80, exactly the two emblematic Pareto values, which means that competition has taken time to regulate itself between the species present [56]. According to Poissonet, the Pareto index of 20–80 characterizes vegetation in equilibrium [65]. Our results are consistent with those obtained in other moderate or lightly disturbed ecosystems. For instance, [66] found that the large majority of phytosociological surveys of different Brazilian plant formations show Pareto indices ranging from 28–72 to 22–78. Our concentration curve and species-area curve (Figure 4) suggest that, overall, the ecosystem of the study area was slightly heterogeneous in terms of species richness. Thus, agricultural land uses would not lead to a significant variation in terms of species richness [7,13]. However, disturbances resulting from agricultural land-uses can promote native species different from those of the savannahs and forests or even alien species that can spread and become invasive [10,11].

4.2. Agricultural Land-Uses Influence on Spatial and Local Diversities

Forests and teak plantations had the lowest spatial diversities, while in croplands and fallows the spatial diversities were the highest. In addition, the interpolation and extrapolation of the expected number of species by land-use type (Figure 6) confirmed this result. This seems paradoxical if one remembers that tropical forests and savannas were attributed to a very high species diversity [9,66,67]. However, since spatial diversity expresses the differences between surveys belonging to the same land-use type [56], the paradox is resolved. Indeed, it is understandable that surveys in undisturbed forests would be quite similar to each other, whereas surveys in croplands that had very different trajectories [21,68], characteristic of small family farming systems would be very different from each other. Thus, in agricultural landscapes, a combination of different land uses following different trajectories enhanced the overall species diversity [69]. Remarkably, this heterogeneity of croplands was maintained in the resulting fallows in our study site. Although teak plantations are a disturbed landscape by human activities, they had low spatial diversity. The low spatial diversity of teak plantations could be explained by their allelopathic character [70,71]. Thus, only some species, that are resistant to the chemicals secreted by teak trees, could be found in these plantations, which would therefore be floristically similar.
The local diversities in the croplands and fallows are the highest, while the savannahs and forests had the lowest (Figure 7, Figure 8 and Appendix A). Our results, which at first sight seems surprising, were in line with those of [13] who, in their study considering trees and herbaceous species, observed an increase in species richness with increasing land-use intensity. In contrast, our findings are at odds with those of [7,8,72] who instead observed a significant decrease in floral species richness with increasing agricultural intensity and anthropogenic disturbance. Indeed, it is generally agreed—particularly since [73], which considered “climax” ecosystems to be more diverse and more functional than artificial ecosystems—that natural vegetation clearing for agricultural land-use would inevitably lead to loss of biodiversity. Nevertheless, the high local floral diversities in croplands and fallows could be explained, on the one hand, by the arrival or the promotion of other species favored by anthropogenic disturbances [46], consistent with the intermediate disturbance hypothesis [74]. The Intermediate disturbance hypothesis predicts that the highest degree of species diversity is reached under disturbance regimes of medium intensity or frequency [75,76]. On the other hand, the low floral diversity in forests or savannahs could be due to the large-scale heterogeneity of vegetation, which is expressed by the “grain” of vegetation [77,78]. In fact, during the evolution of vegetation, the average size of individuals increases strongly. This increase leads to an increase in the area (often called “minimum area”) in which species diversity is commonly observed. By using the same plot size for our observations, the observed diversity could then be influenced especially in forests where the average size of individuals is very high. To take the vegetation grain size into account in detail, it would be necessary to sample at two scales: at the local scale (plot) and at the scale of the land use type [79]. However, our extrapolation analysis showed that, in larger areas, the floral diversity in the farmlands would still be higher than that found in the forests.

4.3. Effect of Agricultural Land-Use on the Vertical Structure of Plant Communities

Human disturbances had deeply altered the structure of plant strata and had a strong effect on the closure of the plant communities in and around the Togodo protected area. Tree density is high in forests, savannahs, and teak plantations, while the croplands are almost treeless. Besides the teak plantations, the agricultural land-uses led to a drastic decrease in the number of trees [69,80]. This observed decrease in tree density is consistent with the low carbon stocks of woody species often observed in agricultural landscapes in West Africa [7,81]. Indeed, in slash-and-burn farming systems, as is the case in the study area, farmers cleared large remnant trees [80]. In addition to the fact that the croplands were almost treeless, they were open, whereas forests were very closed. The modification of the structure of the vegetation induced by the conversion of forests and savannahs into agricultural lands would not be inconsequential for biodiversity. Indeed, trees and other woody species are key structures for biodiversity in agricultural landscapes [69]. According to [82], maintaining tree cover in agricultural landscapes enhanced the conservation of animal diversity.

4.4. Effect of Agricultural Land-Use on Native and Alien Species

Land use significantly influenced alien species richness, with more alien species in the most frequently disturbed landscapes, such as croplands and home gardens, compared to the least disturbed ones, such as savannahs and forests. Since these disturbed landscapes were more open, the richness of alien species could be due to a predominance of therophytes, which are mostly herbaceous. Indeed, disturbed habitats leave many empty ecological niches favorable to the growth of annual species such as therophytes [83,84]. Our results are in line with the increasing alien species richness observed under land-use intensification and the colonization of shade-intolerant species, especially graminoids, in open landscapes [13].
Our analysis shows no significant difference between land-use types in terms of native species richness (Figure 9B). This suggests that the significant difference observed between local diversities is related to the difference in the alien species richness. Thus, the agricultural land uses, by promoting alien species through their disturbances, contribute to an increase in the ordinary floral diversity—which concerns all species and not only those that are rare, endemic, and threatened with extinction—of the area [13,85], if the diversity is not limited to typical savannah or forest species. However, given the recognized invasive potential of alien species, it is questionable whether these species contribute to biodiversity [86].
Our analysis did not make it possible to determine whether the native species found in agricultural lands are the same as those found in forests and savannahs or whether they are other native species more adapted to disturbed habitats. Also, our analysis did not consider land-use trajectories. And yet, land-use or land-use change trajectories have proven effects on vegetation change [11,25]. Thus, to better understand the effects of agricultural land use on floral diversity, further studies considering species composition and land use trajectories would be needed.

5. Conclusions

The objective of this study was to analyze the floral diversities and the vertical structure of plant communities in relation to land-use types in and around the Togodo protected area. The overall floral diversity of the study area remains relatively high despite the disturbances induced by human activities. The croplands that are regularly disturbed by human activities have the highest spatial diversity and the highest alien species richness. Alien species, favored by human activities, become more established in the croplands. However, the vertical structure of the vegetation has been strongly modified by agricultural uses.
The present study demonstrates that certain aspects of ordinary plant diversity—which concern all species and not only those that are rare, endemic, and threatened with extinction—are not decreasing as a result of the clearing of the Guinean tropical forests and savannahs in our study area. On the contrary, the agricultural land-uses, by promoting alien species, contribute to an increase in the ordinary floral diversity in the study area. However, given the high diversity of alien plant species in agricultural landscapes around the Togodo protected area and their potentially known invasiveness, it would be valuable to study the establishment stage of these species. Knowing these stages would allow timely intervention to limit their invasion and impact on the biodiversity of the protected area.
To clarify the effects agricultural land-uses have on biodiversity, further works considering species composition and land-use trajectories would be needed.

Author Contributions

Conceptualization, A.A. and M.G.; methodology, A.A.; formal analysis, A.A. and M.G.; investigation, A.A.; data curation, A.A.; writing—original draft preparation, A.A. and M.G.; writing—review and editing, A.A. and M.G.; supervision, A.A.; project administration, A.A.; funding acquisition, A.A. All authors have read and agreed to the published version of the manuscript.

Funding

This work was supported by the Islamic Development Bank (IsDB) under his Merit Scholarship Program [N° 36/11210124 of 2015].

Institutional Review Board Statement

Not applicable.

Data Availability Statement

The data presented in this study are available on request from the corresponding author.

Acknowledgments

This article is part of the first author’s doctoral thesis work, which was funded by the Islamic Development Bank (IDB) Merit Scholarship Programme. We sincerely acknowledge Wouyo ATAKPAMA, Kossi Béssan AMEGNAGLO, and Kodjovi Mawuégnigan Léonard AGBODAN, from the University of Lomé (Togo), for their considerable support during the fieldwork and species determination. Our Acknowledgments also go to the forest guides and trackers who gave us full support during the fieldwork. We extend our thanks to Ayi Ségniagbéto for his careful proofreading of the manuscript. Thanks to the three reviewers for reading our manuscript carefully and providing very constructive feedback.

Conflicts of Interest

The authors declare no conflict of interest. The funders had no role in the design of the study; in the collection, analyses, or interpretation of data; in the writing of the manuscript, or in the decision to publish the results.

Appendix A

Two-by-two comparison tests of the mean local diversity between land-use types in and around the Togodo protected area.
Significance codes: *** 0.001; ** 0.01; * 0.05 CH: croplands; FO: forests; HA: home gardens; JC: fallows; PA: palm oil plantations; SA: savannahs; TK: teak plantations.; Pr multcomp: the adjusted probability of the multcomp test, Pr Wilco_bon: the probability of the Wilcoxon test with Bonferroni adjustment, Pr Wilco_BH: the probability of the Wilcoxon test with BH (Benjamini and Hochberg) adjustment.
PairsPr MultcompPr Wilco_bonPr Wilco_BH
FO-CH0.16560.024 *0.012 *
HA-CH0.923610.697
JC-CH0.07970.6960.099
PA-CH0.22420.1550.039 *
SA-CH<0.001 ***5.00 × 10⁻⁷ ***5.00 × 10⁻⁷ ***
TK-CH0.07540.6190.099
HA-FO0.90410.415
JC-FO0.972510.515
PA-FO0.999510.697
SA-FO0.939910.415
TK-FO110.95
JC-HA0.997310.697
PA-HA0.980310.51
SA-HA0.13320.5550.099
TK-HA0.859610.515
PA-JC0.999310.721
SA-JC0.0478 *0.10.033 *
TK-JC0.945410.51
SA-PA0.562510.214
TK-PA0.998910.721
TK-SA0.918910.51

References

  1. Díaz, S.; Settele, J.; Brondízio, E.; Ngo, H.; Guèze, M.; Agard, J.; Arneth, A.; Balvanera, P.; Brauman, K.; Butchart, S.; et al. Summary for Policymakers of the Global Assessment Report on Biodiversity and Ecosystem Services of the Intergovernmental Science-Policy Platform on Biodiversity and Ecosystem Services; IPBES: Bonn, Germany, 2019; p. 39. [Google Scholar]
  2. Humphreys, A.M.; Govaerts, R.; Ficinski, S.Z.; Nic Lughadha, E.; Vorontsova, M.S. Global Dataset Shows Geography and Life Form Predict Modern Plant Extinction and Rediscovery. Nat. Ecol. Evol. 2019, 3, 1043–1047. [Google Scholar] [CrossRef]
  3. Knapp, W.M.; Frances, A.; Noss, R.; Naczi, R.F.C.; Weakley, A.; Gann, G.D.; Baldwin, B.G.; Miller, J.; McIntyre, P.; Mishler, B.D.; et al. Vascular Plant Extinction in the Continental United States and Canada. Conserv. Biol. 2021, 35, 360–368. [Google Scholar] [CrossRef] [PubMed]
  4. Maxwell, S.L.; Fuller, R.A.; Brooks, T.M.; Watson, J.E. Biodiversity: The Ravages of Guns, Nets and Bulldozers. Nature 2016, 536, 143. [Google Scholar] [CrossRef] [PubMed]
  5. Luyssaert, S.; Jammet, M.; Stoy, P.C.; Estel, S.; Pongratz, J.; Ceschia, E.; Churkina, G.; Don, A.; Erb, K.; Ferlicoq, M. Land Management and Land-Cover Change Have Impacts of Similar Magnitude on Surface Temperature. Nat. Clim. Chang. 2014, 4, 389–393. [Google Scholar] [CrossRef] [Green Version]
  6. Fried, G. Apports Des Approches Fonctionnelles Pour l’évaluation Des Risques Associés Aux Changements de Végétation Induits Par Les Activités Humaines. HDR. Thesis, Université de Montpellier, Montpellier, France, 2019. [Google Scholar]
  7. Balima, L.H.; Nacoulma, B.M.I.; Bayen, P.; Kouamé, F.N.; Thiombiano, A. Agricultural Land Use Reduces Plant Biodiversity and Carbon Storage in Tropical West African Savanna Ecosystems: Implications for Sustainability. Glob. Ecol. Conserv. 2020, 21, e00875. [Google Scholar] [CrossRef]
  8. Tilman, D. Global Environmental Impacts of Agricultural Expansion: The Need for Sustainable and Efficient Practices. Proc. Natl Acad. Sci. USA 1999, 96, 5995–6000. [Google Scholar] [CrossRef] [PubMed] [Green Version]
  9. Searchinger, T.D.; Estes, L.; Thornton, P.K.; Beringer, T.; Notenbaert, A.; Rubenstein, D.; Heimlich, R.; Licker, R.; Herrero, M. High Carbon and Biodiversity Costs from Converting Africa’s Wet Savannahs to Cropland. Nat. Clim. Chang. 2015, 5, 481–486. [Google Scholar] [CrossRef]
  10. Pyšek, P.; Jarošík, V.; Hulme, P.E.; Kühn, I.; Wild, J.; Arianoutsou, M.; Bacher, S.; Chiron, F.; Didžiulis, V.; Essl, F. Disentangling the Role of Environmental and Human Pressures on Biological Invasions across Europe. Proc. Natl. Acad. Sci. USA 2010, 107, 12157–12162. [Google Scholar] [CrossRef] [Green Version]
  11. Vilà, M.; Ibáñez, I. Plant Invasions in the Landscape. Landsc. Ecol. 2011, 26, 461–472. [Google Scholar] [CrossRef]
  12. Bellard, C.; Cassey, P.; Blackburn, T.M. Alien Species as a Driver of Recent Extinctions. Biol. Lett. 2016, 12, 20150623. [Google Scholar] [CrossRef] [PubMed]
  13. Raveloaritiana, E.; Wurz, A.; Grass, I.; Osen, K.; Soazafy, M.R.; Martin, D.A.; Faliniaina, L.; Rakotomalala, N.H.; Vorontsova, M.S.; Tscharntke, T.; et al. Land-Use Intensification Increases Richness of Native and Exotic Herbaceous Plants, but Not Endemics, in Malagasy Vanilla Landscapes. Divers. Distrib. 2021, 27, 784–798. [Google Scholar] [CrossRef]
  14. Burgess, N.; Hales, J.; Underwood, E.; Dinerstein, E.; Olson, D.; Itoua, I.; Schipper, J.; Ricketts, T.; Newman, K. Terrestrial Ecoregions of Africa and Madagascar: A Conservation Assessment; Island Press: Washington, DC, USA; Covelo, CA, USA; London, UK, 2004; ISBN 1-55963-364-6. [Google Scholar]
  15. CILSS. Landscapes of West Africa: A Window on a Changing World; CILSS: Ouagadougou, Burkina Faso, 2016. [Google Scholar]
  16. Adjonou, K.; Djiwa, O.; Kombate, Y.; Kokutse, A.D.; Kokou, K. Etude de La Dynamique Spatiale et Structure Des Forêts Denses Sèches Reliques Du Togo: Implications Pour Une Gestion Durable Des Aires Protégées. Int. J. Biol. Chem. Sci. 2010, 4, 168–183. [Google Scholar] [CrossRef]
  17. Triplet, P. Manuel de Gestion des Aires Protégées d’Afrique Francophone; Awely: Paris, France, 2009. [Google Scholar]
  18. Atsri, H.K.; Konko, Y.; Cuni-Sanchez, A.; Abotsi, K.E.; Kokou, K. Changes in the West African Forest-Savanna Mosaic, Insights from Central Togo. PLoS ONE 2018, 13, e0203999. [Google Scholar] [CrossRef] [Green Version]
  19. Diwediga, B.; Agodzo, S.; Wala, K.; Le, Q.B. Assessment of Multifunctional Landscapes Dynamics in the Mountainous Basin of the Mo River (Togo, West Africa). J. Geogr. Sci. 2017, 27, 579–605. [Google Scholar] [CrossRef]
  20. Badjana, H.M.; Helmschrot, J.; Selsam, P.; Wala, K.; Flügel, W.-A.; Afouda, A.; Akpagana, K. Land Cover Changes Assessment Using Object-based Image Analysis in the Binah River Watershed (Togo and Benin). Earth Space Sci. 2015, 2, 403–416. [Google Scholar] [CrossRef] [Green Version]
  21. Akodéwou, A.; Oszwald, J.; Saïdi, S.; Gazull, L.; Akpavi, S.; Akpagana, K.; Gond, V. Land Use and Land Cover Dynamics Analysis of the Togodo Protected Area and Its Surroundings in Southeastern Togo, West Africa. Sustainability 2020, 12, 5439. [Google Scholar] [CrossRef]
  22. UICN/PACO. Evaluation de l’Efficacité de la Gestion des Aires Protégées: Aires Protégées du Togo; UICN-PACO: Ouagadougou, Burkina Faso, 2008; ISBN 978-2-8317-1130-0. [Google Scholar]
  23. Kottek, M.; Grieser, J.; Beck, C.; Rudolf, B.; Rubel, F. World Map of the Köppen-Geiger Climate Classification Updated. Meteorologische Zeitschrift 2006, 15, 259–263. [Google Scholar] [CrossRef]
  24. Harris, I.; Jones, P.D.; Osborn, T.J.; Lister, D.H. Updated High-Resolution Grids of Monthly Climatic Observations—The CRU TS3.10 Dataset. Int. J. Climatol. 2014, 34, 623–642. [Google Scholar] [CrossRef] [Green Version]
  25. Inderjit; Catford, J.A.; Kalisz, S.; Simberloff, D.; Wardle, D.A. A Framework for Understanding Human-driven Vegetation Change. Oikos 2017, 126, 1687–1698. [Google Scholar] [CrossRef]
  26. Theoharides, K.A.; Dukes, J.S. Plant Invasion across Space and Time: Factors Affecting Nonindigenous Species Success during Four Stages of Invasion. New Phytol. 2007, 176, 256–273. [Google Scholar] [CrossRef]
  27. Gounot, M. Méthodes d’étude Quantitative de la Végétation; Masson: Paris, France, 1969. [Google Scholar]
  28. Alexandre, F.; Genin, A.; Godron, M.; Lecompte, M. Distribution des plantes et organisation de la végétation. Espace Géographique 1998, 27, 228–238. [Google Scholar] [CrossRef]
  29. Sylvain, J.P.; Aregba, A.; Assih-Edeou, P.; Castaing, C.; Chèvremont, P.; Collart, J.; Monciardini, C.; Marteau, P.; Ouassane, I.; Tchota, K. Notice Explicative de la Carte Géologique à 1: 200,000 Feuille Lomé 1986.
  30. Adou Yao, C.Y.; N’Guessan, E.K. Diversité botanique dans le sud du parc national de Taï, Côte d’Ivoire. Afr. Sci. 2005, 1, 295–313. [Google Scholar]
  31. Cheek, M.; Cable, S. Plant Inventory for Conservation Management: The Kew-Earthwatch Programme in Western Cameroon, 1993–1996. In African rainforest and the conservation of biodiversity, Proceedings of the Limbe Conference, Limbe, Cameroun, 17–24 January 1997; Botanic Garden Meise: Cameroun, Africa, 1997; pp. 29–38. [Google Scholar]
  32. Hall, J.B.; Swaine, M.D. Distribution and Ecology of Vascular Plants in a Tropical Rain Forest. Forest Vegetation in Ghana. Springer: Dordrecht, The Netherlands, 1981. [Google Scholar]
  33. Hawthorne, W.D. Holes and the Sums of Parts in Ghanaian Forest: Regeneration, Scale and Sustainable Use. Proc. R. Soc. Edinb. Sect. B Biol. Sci. 1996, 104, 75–176. [Google Scholar] [CrossRef]
  34. Amégnaglo, K.B.; Dourma, M.; Akpavi, S.; Akodewou, A.; Wala, K.; Diwediga, B.; Atakpama, W.; Agbodan, K.M.L.; Batawila, K.; Akpagana, K. Caractérisation des formations végétales pâturées de la zone guinéenne du Togo: Typologie, évaluation de la biomasse, diversité, valeur fourragère et régénération. Int. J. Biol. Chem. Sci. 2018, 12, 2065–2084. [Google Scholar] [CrossRef]
  35. Wala, K. La Végétation de La Chaîne de l’Atakora Au Bénin: Diversité Floristique, Phytosociologie et Impact Humain. Acta Botanica Gallica 2010, 157, 793–796. [Google Scholar] [CrossRef] [Green Version]
  36. Braun-Blanquet, J.; Roussine, N.; Nègre, R. Les Groupements Végétaux de la France Méditerranéenne; Direction de la carte des groupements végétaux; CNRS: Montpellier, France, 1952. [Google Scholar]
  37. Brunel, J.-F.; Hiepko, P.; Scholz, H. Flore Analytique Du Togo: Phanérogames. Englera 1984, 4, 3–751. [Google Scholar] [CrossRef]
  38. Akoègninou, A.; Van der Burg, W.J.; Van der Maesen, L.J.G. Flore Analytique Du Bénin; Adjakidjè, V., Essou, J.P., Sinsin, B., Yédomonhan, H., Eds.; Backhuys Publishers: Cotonou, Benin; Wageningen, the Netherlands, 2006; ISBN 90-5782-181-8. [Google Scholar]
  39. Cayuela, L.; Stein, A.; Oksanen, J. Taxonstand: Taxonomic Standardization of Plant Species Names. R Package Version 2.1. R Foundation Stat. Comput. 2017, 2, 1–11. [Google Scholar]
  40. Réjou-Méchain, M.; Tanguy, A.; Piponiot, C.; Chave, J.; Hérault, B. Biomass: An R Package for Estimating Above-ground Biomass and Its Uncertainty in Tropical Forests. Methods Ecol. Evol. 2017, 8, 1163–1167. [Google Scholar] [CrossRef]
  41. Brillouin, L. Science and Information Theory, 2nd ed.; Academic Press: New York, NY, USA, 1962; ISBN 978-0-12-134950-9. [Google Scholar]
  42. Basharin, G.P. On a Statistical Estimate for the Entropy of a Sequence of Independent Random Variables. Theory Probab. Appl. 1959, 4, 333–336. [Google Scholar] [CrossRef]
  43. Strong, W.L. Biased Richness and Evenness Relationships within Shannon–Wiener Index Values. Ecol. Indic. 2016, 67, 703–713. [Google Scholar] [CrossRef]
  44. Barima, Y.S.S.; Assale, A.A.Y.; Andrieu, J. Caractérisation post conflits armés des perturbations dans la forêt classée du Haut-Sassandra en Côte d’Ivoire. Afr. Sci. 2016, 12, 66–82. [Google Scholar]
  45. Upton, G.J.G. Fisher’s Exact Test. J. R. Stat. Soc. Ser. A 1992, 155, 395–402. [Google Scholar] [CrossRef]
  46. Amandier, L.; Wolff, A.; Godron, M.; Kadik, L. Calculs Comparés de Biodiversité Dans Quelques Forêts de Provence. Forêt Méditerranéenne 2012, 33, 151. [Google Scholar]
  47. Kadik, L.; Godron, M. Contribution à l’étude de La” Dégradation” de La Végétation Dans Les Pineraies de Pinus Halepensis Mill. D’Algérie et Dans Les Formations Dérivées». J. Bot. Soc. Bot. France 2004, 27, 9–19. [Google Scholar]
  48. Godron, M.; Kadik, L. La Mesure de La Biodiversité Spatiale. Symbioses 2003, 2003, 67–75. [Google Scholar]
  49. Colwell, R.K.; Chao, A.; Gotelli, N.J.; Lin, S.-Y.; Mao, C.X.; Chazdon, R.L.; Longino, J.T. Models and Estimators Linking Individual-Based and Sample-Based Rarefaction, Extrapolation and Comparison of Assemblages. J. Plant Ecol. 2012, 5, 3–21. [Google Scholar] [CrossRef] [Green Version]
  50. Colwell, R.K.; Mao, C.X.; Chang, J. Interpolating, Extrapolating, and Comparing Incidence-Based Species Accumulation Curves. Ecology 2004, 85, 2717–2727. [Google Scholar] [CrossRef] [Green Version]
  51. Hsieh, T.C.; Ma, K.H.; Chao, A. INEXT: An R Package for Rarefaction and Extrapolation of Species Diversity (Hill Numbers). Methods Ecol. Evol. 2016, 7, 1451–1456. [Google Scholar] [CrossRef]
  52. Hothorn, T.; Bretz, F.; Westfall, P.; Heiberger, R.M. Multcomp: Simultaneous Inference for General Linear Hypotheses. 2012. R package version. Available online: http://CRAN.R-project.org/package=multcomp (accessed on 13 December 2021).
  53. Hothorn, T.; Bretz, F.; Westfall, P. Simultaneous Inference in General Parametric Models. Biom. J. 2008, 50, 346–363. [Google Scholar] [CrossRef] [Green Version]
  54. Oksanen, J.; Blanchet, F.G.; Friendly, M.; Kindt, R.; Legendre, P.; McGlinn, D.; Minchin, P.R.; O’Hara, R.B.; Simpson, G.L.; Solymos, P.; et al. Vegan: Community Ecology Package: Ordination Methods, Diversity Analysis and Other Functions for Community and Vegetation Ecologists. 2020. R Package Version. Available online: https://CRAN.R-project.org/package=vegan (accessed on 13 December 2021).
  55. Godron, M. Un Modèle Pour La Courbe Aire-Espèce. Le Naturaliste Canadien 1970, 97, 491–492. [Google Scholar]
  56. Godron, M. Écologie et Évolution Du Monde Vivant. L’échelle Crée Le Phénomène, Volume 2; L’Harmattan: Paris, France, 2012. [Google Scholar]
  57. Gosselin, M.; Laroussine, O. Biodiversité et Gestion Forestière: Connaître Pour Préserver: Synthèse Bibliographique; Cemagref; GIP Ecofor: Paris, France, 2004; ISBN 2-85362-620-2. [Google Scholar]
  58. Jacquard, P.; Daget, P.; Poissonnet, J.; Laroche, G. Expression de l’évolution du Potentiel de Production et la Composition Botanique d’une Formation Herbacée Dense; CNRS/CEPE: Montpellier, France, 1968. [Google Scholar]
  59. Daget, P.; Godron, M. Analyse Fréquentielle de l’écologie des Espèces Dans les Communautés, 1st ed.; Masson: Paris, France, 1982; ISBN 2-225-78090-0. [Google Scholar]
  60. Lafon, P. Sur la variabilité de la fréquence des formes dans un corpus. Mots 1980, 1, 127–165. [Google Scholar] [CrossRef] [Green Version]
  61. Connelly, L.M. Fisher’s Exact Test. MedSurg Nurs. 2016, 25, 58–60. [Google Scholar] [PubMed]
  62. Pyšek, P.; Pergl, J.; Essl, F.; Lenzner, B.; Dawson, W.; Kreft, H.; Weigelt, P.; Winter, M.; Kartesz, J.; Nishino, M.; et al. Naturalized Alien Flora of the World: Species Diversity, Taxonomic and Phylogenetic Patterns, Geographic Distribution and Global Hotspots of Plant Invasion. Preslia 2017, 89, 203–274. [Google Scholar] [CrossRef]
  63. R Development Core Team R: A Language and Environment for Statistical Computing; R Foundation for Statistical Computing: Vienna, Austria, 2019.
  64. Kokou, K.; Atato, A.; Bellefontaine, R.; Kokutse, A.D.; Caballe, G. Diversité des forêts denses sèches du Togo (Afrique de l’Ouest). Rev. Écol. (Terre Vie) 2006, 61, 225–246. [Google Scholar]
  65. Scheel-Ybert, R. Stabilité de l’Écosystème sur le littoral sud-est du Brésil à l’holocène supérieur (5500–1400 ans BP). Les Pêcheurs-Cueilleurs-Chasseurs et le Milieu végétal: Apports de l’Anthracologie. Ph.D. Thesis, Univ. Montpellier II, Montpellier, France, 1998. [Google Scholar]
  66. Blanc, L.; Florès, O.; Molino, J.-F.; Gourlet-Fleury, S.; Sabatier, D. Diversité spécifique et regroupement d’espèces arborescentes en forêt guyanaise. Rev. For. Française 2003, LV, 131–146. [Google Scholar] [CrossRef] [Green Version]
  67. Estes, L.D.; Searchinger, T.; Spiegel, M.; Tian, D.; Sichinga, S.; Mwale, M.; Kehoe, L.; Kuemmerle, T.; Berven, A.; Chaney, N.; et al. Reconciling Agriculture, Carbon and Biodiversity in a Savannah Transformation Frontier. Phil. Trans. R. Soc. B 2016, 371, 20150316. [Google Scholar] [CrossRef] [Green Version]
  68. Oszwald, J.; Antoine, L.; De Sartre, X.A.; Marcello, T.; Gond, V. Analyse Des Directions de Changement Des États de Surface Végétaux Pour Renseigner La Dynamique Du Front Pionnier de Maçaranduba (Brésil) Entre 1997 et 2006. Télédétection 2010, 9, 97–111. [Google Scholar]
  69. Jara, T.; Hylander, K.; Nemomissa, S. Tree Diversity across Different Tropical Agricultural Land Use Types. Agric. Ecosyst. Environ. 2017, 240, 92–100. [Google Scholar] [CrossRef]
  70. Krishna, A.; Manjunath, G.O.; Rathod, R.; Kannur, S. Allelopathic Effect of Four Agroforestry Tree Species Leaf Leachates on Seed Germination of Certain Vegetable Crops. Karnataka J. Agric. Sci. 2010, 16, 430–433. [Google Scholar]
  71. Lacret, R.; Varela, R.M.; Molinillo, J.M.G.; Nogueiras, C.; Macías, F.A. Anthratectone and Naphthotectone, Two Quinones from Bioactive Extracts of Tectona Grandis. J. Chem. Ecol. 2011, 37, 1341–1348. [Google Scholar] [CrossRef]
  72. Hending, D.; Andrianiaina, A.; Maxfield, P.; Rakotomalala, Z.; Cotton, S. Floral Species Richness, Structural Diversity and Conservation Value of Vanilla Agroecosystems in Madagascar. Afr. J. Ecol. 2020, 58, 100–111. [Google Scholar] [CrossRef]
  73. Odum, E.P.; Odum, H.T. Fundamentals of Ecology, 2nd ed; Saunders Company: Philadelphia, PA, USA, 1959; ISBN B0018QZMS0. [Google Scholar]
  74. Grime, J.P. Competitive Exclusion in Herbaceous Vegetation. Nature 1973, 242, 344–347. [Google Scholar] [CrossRef]
  75. Molino, J.-F.; Sabatier, D. Tree Diversity in Tropical Rain Forests: A Validation of the Intermediate Disturbance Hypothesis. Science 2001, 294, 1702–1704. [Google Scholar] [CrossRef] [PubMed] [Green Version]
  76. Mackey, R.L.; Currie, D.J. A Re-Examination of the Expected Effects of Disturbance on Diversity. Oikos 2000, 88, 483–493. [Google Scholar] [CrossRef]
  77. Godron, M. L’étude du «grain» de la structure de la vegetation. Application à quelques exemples méditerranéens. Ecmed 1982, 8, 191–195. [Google Scholar] [CrossRef]
  78. Alexandre, F.; Génin, A. Les niveaux d’organisation du couvert végétal, question géographique et écologique. In Proceedings of the Les échelles pour les géographes et les autres, Avignon, France, 3–4 June 2010; pp. 59–65. [Google Scholar]
  79. Godron, M.; Joly, H. Dictionnaire Du Paysage; CILF Les Dictio; Conseil International de la Langue Française: Paris, France, 2008. [Google Scholar]
  80. Shumi, G.; Schultner, J.; Dorresteijn, I.; Rodrigues, P.; Hanspach, J.; Hylander, K.; Senbeta, F.; Fischer, J. Land Use Legacy Effects on Woody Vegetation in Agricultural Landscapes of South-Western Ethiopia. Divers. Distrib. 2018, 24, 1136–1148. [Google Scholar] [CrossRef] [Green Version]
  81. Nacoulma, B.M.I.; Schumann, K.; Traoré, S.; Bernhardt-Römermann, M.; Hahn, K.; Wittig, R.; Thiombiano, A. Impacts of Land-Use on West African Savanna Vegetation: A Comparison between Protected and Communal Area in Burkina Faso. Biodivers Conserv. 2011, 20, 3341–3362. [Google Scholar] [CrossRef]
  82. Harvey, C.A.; Medina, A.; Sánchez, D.M.; Vílchez, S.; Hernández, B.; Saenz, J.C.; Maes, J.M.; Casanoves, F.; Sinclair, F.L. Patterns of Animal Diversity in Different Forms of Tree Cover in Agricultural Landscapes. Ecol. Appl. 2006, 16, 1986–1999. [Google Scholar] [CrossRef]
  83. Goudard, A. Fonctionnement Des Écosystèmes et Invasions Biologiques: Importance de La Biodiversité et Des Interactions Interspécifiques; Université Pierre et Marie Curie: Paris, France, 2007. [Google Scholar]
  84. Caillon, A.; Lavoué, M. Liste Hiérarchisée des Plantes Exotiques Envahissantes d’Aquitaine. Version 1.0; Conservatoire Botanique National Sud-Atlantique: Paris, France, 2016; p. 33. [Google Scholar]
  85. Grass, I.; Loos, J.; Baensch, S.; Batáry, P.; Librán-Embid, F.; Ficiciyan, A.; Klaus, F.; Riechers, M.; Rosa, J.; Tiede, J.; et al. Land-Sharing/-Sparing Connectivity Landscapes for Ecosystem Services and Biodiversity Conservation. People Nat. 2019, 1, 262–272. [Google Scholar] [CrossRef]
  86. Schlaepfer, M.A. Do Non-Native Species Contribute to Biodiversity? PLoS Biol. 2018, 16, e2005568. [Google Scholar] [CrossRef] [Green Version]
Figure 1. Location map of the Togodo protected area and its surroundings in southeastern Togo.
Diversity 14 00106 g001
Figure 2. Location map of the plots surveyed in the Togodo protected area and its surroundings in southeastern Togo.
Diversity 14 00106 g002
Figure 3. Sampling plan in each sampled block.
Diversity 14 00106 g003
Figure 4. Species-area curves of plant communities in and around the Togodo protected area. The two curves (blue and green), show the increase in the number of species when looking at the surveys from the beginning (first plot) to the end (last plot) and in reverse order (last plot to first plot). The red curve is the “normal” curve.
Diversity 14 00106 g004
Figure 5. The concentration curve of plant communities in and around the Togodo protected area.
Diversity 14 00106 g005
Figure 6. The expected number of plant species (solid lines = interpolated values; dashed lines = extrapolated values; colored areas = 95% confidence intervals) in and around the Togodo protected area. CH: croplands; FO: forests; HA: home gardens; JC: fallows; PA: palm oil plantations; SA: savannahs; TK: teak plantations.
Diversity 14 00106 g006
Figure 7. Comparison of local species richness (A) and Shannon index (B) between land-use types in and around the Togodo protected area. The box plots show the median (the horizontal line towards the middle) and within the box 50% of the values. The asterisks show the average value for each land-use type. Letters denote significant differences in pair-wise comparison after the post hoc Bonferroni. CH: croplands; FO: forests; HA: home gardens; JC: fallows; PA: palm oil plantations; SA: savannahs; TK: teak plantations.
Diversity 14 00106 g007
Figure 8. Correlation between local floral diversity and land-use types in and around the Togodo protected area. Dots (figure on the left) represent plots by land-use types. On the right figure, ellipsoids indicate the standard error of the weighted average local floral diversity for each land-use type. CH: croplands; FO: forests; HA: home gardens; JC: fallows; PA: palm oil plantations; SA: savannahs; TK: teak plantations.
Diversity 14 00106 g008
Figure 9. Comparisons of the alien species (A) and native species (B) richness between land-use types in and around the Togodo protected area. The asterisks show the average value for each land-use type. Letters denote significant differences in pair-wise comparison after the post hoc Bonferroni. CH: croplands; FO: forests; HA: home gardens; JC: fallows; PA: palm oil plantations; SA: savannahs; TK: teak plantations.
Diversity 14 00106 g009
Table 1. The link between land-use types and vegetation strata in and around the Togodo protected area.
CHFOHAJCPASATK
ABO−19633065
ABU6000300
HER6000000
(Numbers greater than 10 correspond to highly significant relationships and positive numbers indicate that the combination of row and column is more frequent than expected. Negative relationships indicate that the combinations are less frequent than expected). ABO: woody, ABU: shrubby, HER: herbaceous; CH: croplands; FO: forests; HA: home gardens; JC: fallows; PA: palm oil plantations; SA: savannahs; TK: teak plantations.
Table 2. The link between land-use types and the closure of vegetation in south-eastern Togo.
CHFOHAJCPASATK
114023−16−4−120
25−12−2640116
3−28225590−8
1: very weak closure; 2: weak closure; 3: strong closure; CH: croplands; FO: forests; HA: home gardens; JC: fallows; PA: palm oil plantations; SA: savannahs; TK: teak plantations.
Publisher’s Note: MDPI stays neutral with regard to jurisdictional claims in published maps and institutional affiliations.

