Article

Diurnal and Seasonal Patterns of Calling Activity of Seven Cuculidae Species in a Forest of Eastern China

1
Division of Life Sciences and Medicine, University of Science and Technology of China, 96 Jinzhai Road, Hefei 230026, China
2
Hefei Institutes of Physical Science, Chinese Academy of Sciences, 350 Shushanhu Road, Hefei 230031, China
*
Author to whom correspondence should be addressed.
Diversity 2022, 14(4), 249; https://doi.org/10.3390/d14040249
Submission received: 27 February 2022 / Revised: 21 March 2022 / Accepted: 23 March 2022 / Published: 28 March 2022
(This article belongs to the Special Issue Birds in Temperate and Tropical Forests)

Abstract

:
There is very little information on the diurnal and seasonal patterns of Cuculidae species’ calling activity in subtropical areas. In this study, we used passive acoustic monitoring to investigate the diurnal and seasonal patterns of calling activity of seven Cuculidae species at three sites in eastern China’s forest over a year. Our results showed that these species exhibited significant diurnal variations except for Cuculus micropterus. Eudynamys scolopaceus and Cuculus saturatus increased their vocal activity at dawn and dusk, whereas the other four species peaked their calling activity in the morning. Five species showed significant seasonal variations with a peak in vocal activities earlier in the season (late May or early June) and a gradual decline after that, except for Clamator coromandus, which displayed two peaks in seasonal calling activity. As for Cuculus micropterus, its calling activity was not significantly related to the season. Our study has provided basic knowledge about the calling patterns of seven Cuculidae species, and based on seasonal changes in vocal activity we propose that the breeding season of these species in east China begins in late May and ends in July.

1. Introduction

Birds sing to attract mates and defend territories, but their vocal signals are also important in maintaining group contacts, signaling food resources, making alarm calls in case of danger and begging for food sources [1,2,3,4]. It is therefore generally believed that birds have higher vocal activity earlier in the season when attracting mates and defending territories, and their acoustic activity decreases as the season progresses due to hormonal changes and parental care [1,5,6]. In addition, vocalizations of birds are also affected by several intrinsic (e.g., eye size, body size and breeding status) [5,7,8] and extrinsic factors (e.g., vegetation cover, moonlight, rainfall and temperature) [6,9,10].
Some studies have demonstrated a trade-off between singing and foraging activities [11,12]. Consequently, because vocal activity require a lot of energy [13,14], most bird species prefer to vocalize at dawn and dusk, when light levels and temperatures are lower, resulting in fewer foraging opportunities and increased song transmission [15,16]. Similarly, some birds sing in the evening to ensure safe roosting sites [17,18]. Therefore, studies of diurnal and seasonal patterns of bird vocal activity may improve our understanding of the function of vocalizations, breeding activities, and the focal species’ ecology [10,19]. However, despite having extensive knowledge of the vocalization patterns of passerines, there is relatively little information available on the diurnal and seasonal patterns of brood parasitic species that depend on hosts to provide parental care to their chicks [20,21].
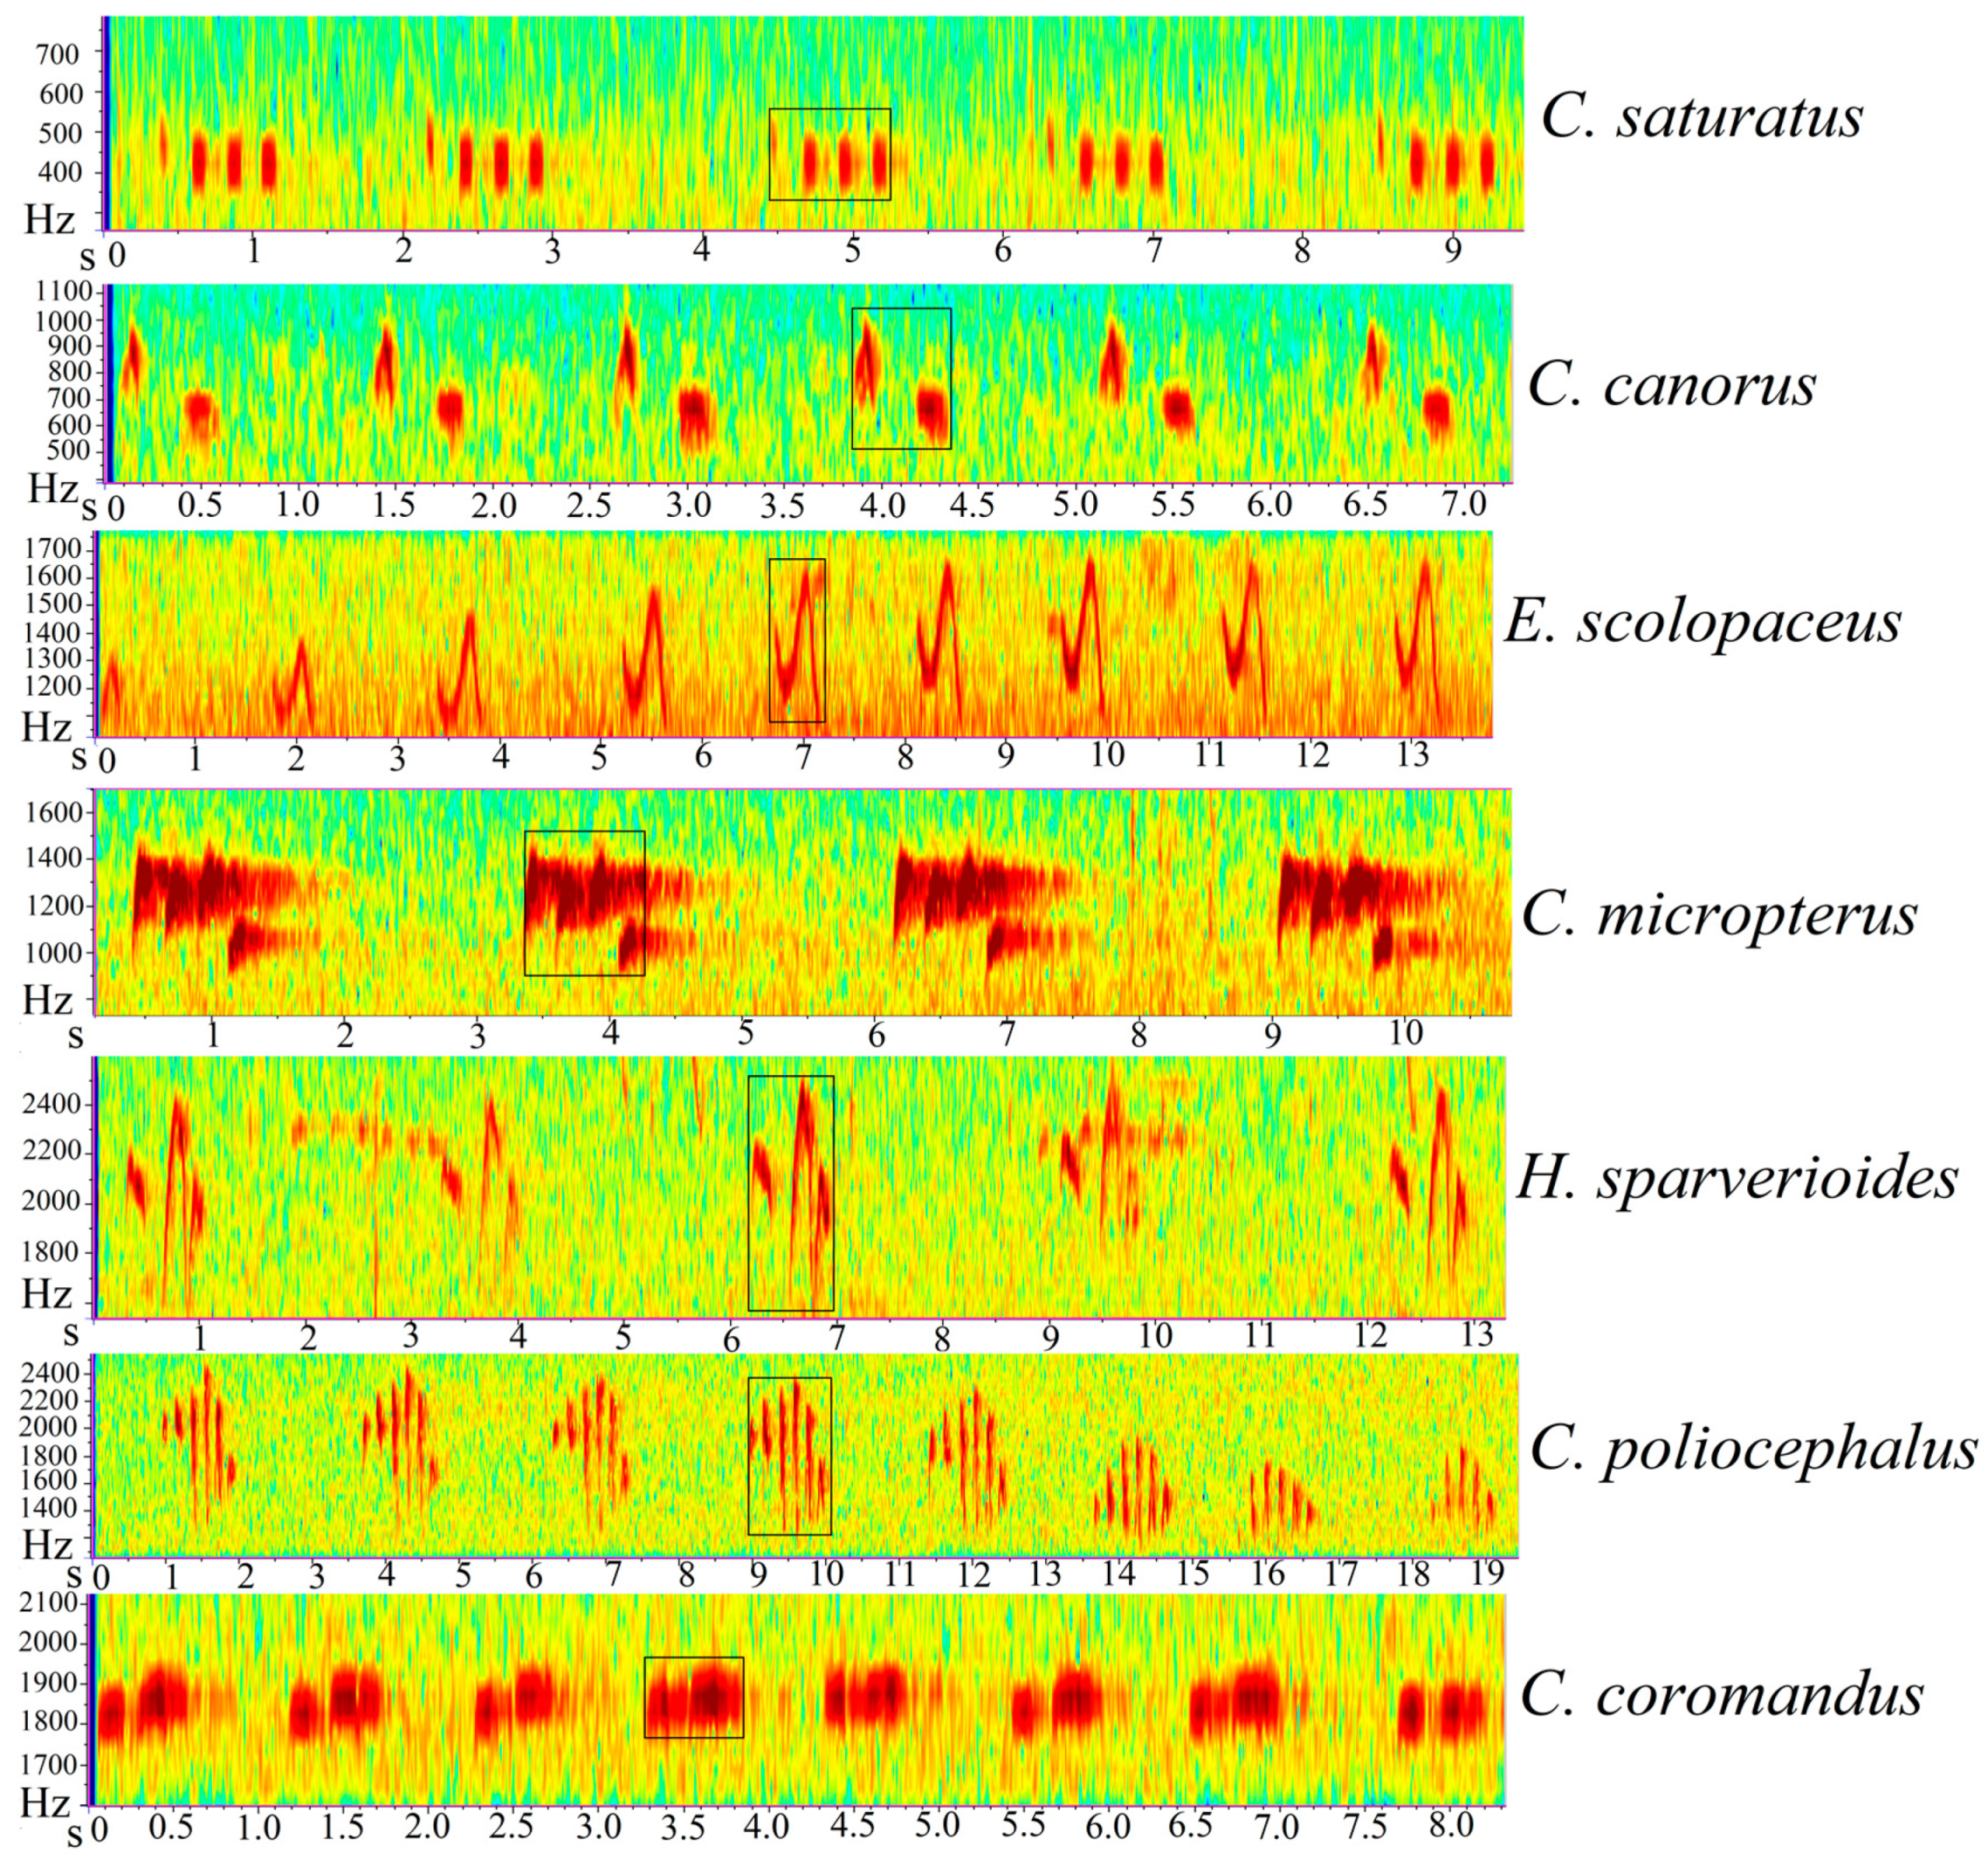
In the study, seven avian brood parasites were selected, they include Indian cuckoo (Cuculus micropterus), Himalayan cuckoo (Cuculus saturatus), Common cuckoo (Cuculus canorus), Lesser cuckoo (Cuculus poliocephalus), Asian koel (Eudynamys scolopaceus), Large hawk-cuckoo (Hierococcyx sparverioides), and Chestnut-winged cuckoo (Clamator coromandus). Unlike passerines, they do not have well-developed syringeal muscles so their vocalizations are simple and monotonous [22,23,24,25,26,27,28]. The spectrograms and frequency characteristics of the seven cuckoo species is shown in Figure 1. These are avian brood parasites that lay their eggs in the nests of the host species and rely on them to raise their young [22,23,24,25,26,27,28]. The females of several cuckoo species also call for conspecific and heterospecific communication and misdirecting host species, but their males produce a large number of calls over a complete breeding season. Thus, in our study we only focused on the male cuckoos’ calls. All these species are migratory and based on our acoustic data and some survey reports they arrive at our study sites during April and May [29].
Acoustic communication is also essential in avian brood parasites [2,31], and previous research has shown that the vocal activity of Cuculidae serve similar functions of attracting mates and defending territories like passerines [2,3]. For example, during a playback experiment, Moskát and Hauber (2019) found that both male and female common cuckoos responded strongly to unknown bubbling calls and males approached the speaker more frequently than females [2,3]. Furthermore, female common cuckoo calls play an important role in intraspecific communication or competition and divert host species’ attention away from nest defense [32,33,34,35,36]. In addition, although the calls of common cuckoo are simple and monotonous it is possible to identify individuals based on their call characteristics [37], suggesting that different individuals may have specific functions of calls during the breeding season and individuals may also benefit from accessing the quality and behavioral conditions of other birds [38]. Identification of individual calls is also helpful in accessing the life history and abundance of species in different areas [39]. Until now, several studies have used different parameters of cuckoo species’ calls to classify species and individuals to identify the functions of calls [2,21,37]. For example, Xia et al. (2019) identified significant differences in characteristics and functions of male common cuckoo’s two note and three note elements while Marton et al. (2021) demonstrated that bubbling calls of the female common cuckoo reduces host aggression to cuckoos at their nests [35]. Nevertheless, only a few studies have focused on the temporal and seasonal patterns of calling activity of different cuckoo species over the entire breeding season [20,40,41]. Unlike passerines, brood parasitic species do not have to decrease their vocal activity after pairing due to the lack of parental care. The temporal patterns of vocal activity may differ between passerines and non-passerines. Hence, more work is needed on non-passerine (brood parasitic species) in sub-tropics.
In addition, nocturnal calling behavior has also been observed in several brood parasitic species [20,40,41], but this behavior varies among species, with some species calling only early in the breeding season, while others do so throughout the breeding season [17,20], possibly due to different functions of the night calls. Nonetheless, the occurrence and function of avian nocturnal vocalizations are poorly understood [17]. Even though this type of research has now increased, with the use of acoustic recording technologies [19,42], we still need primary data from east Asia on the nocturnal calling of diurnal birds. Furthermore, these seven Cuculidae species overlap in geographical distribution and share similar food resources [43], which may result in seasonal partitioning in call frequency.
In the study, we employed passive acoustic monitoring technology to record the vocal activity of Cuculidae species over an entire annual cycle. The main objectives of the study were (1) to investigate the diurnal and seasonal patterns of calling activity of these species to gain insights into the ecology of these species, to understand the functions of vocalizations and to identify periods of high calling activity; and (2) to examine whether there is an overlap in the temporal distribution of seven species’ seasonal calling activity. Most of the cuckoo species’ calls are thought to be used for attracting mates and for territorial competition [2,20,44]. Based on this, we expected an increase in calling activity earlier in the season during mating, or two peaks, if the species breeds twice. Furthermore, vocal activity usually decreases after pairing in several bird species [1], we also expected a gradual decrease in calling activity as the breeding season advanced. Earlier investigations on the daily patterns of several cuckoo species have shown peaks in calling activity at dawn and dusk [20,41], we also expected an increase in calling activity of most species at dawn and dusk if the purpose of calling is to attract mates and advertise territory.

2. Materials and Methods

2.1. Study Area

The study was conducted in Yaoluoping National Nature Reserve (YNNR), Anhui province, East China (30°57′~31°06′ N, 116°02′~116°11′ E). We selected three sites located in the hinterland of the Ta-pieh Mountains (Table S1). The geographical location of the selected sites is shown in Figure S1. YNNR covers an area of 12,300 ha, and the highest point is located at about 1730 m.a.s.l., whereas the lowest site is situated at 500 m.a.s.l. This region is characterized as a subtropical monsoon climate, with humid air and moderate climate. The region’s average annual precipitation is 1400–2000 mm, and the average annual temperature is 12.7 °C. The main vegetation in the study area consists of mixed evergreen broad-leaved forests and temperate deciduous forests [45]. The forest coverage rate of the area exceeds 90%. According to the earlier studies, the study area has high biodiversity [46], with approximately 2000 kinds of vascular plants and over 200 terrestrial vertebrates including more than 162 species of birds.

2.2. Acoustic Data Collection

The audio data was collected from three sampling sites using Song Meter (SM4+, Wildlife Acoustics, Maynard, MA, USA) between 5 April 2019, and 30 March 2020. At each site, one recorder was tied to a tree trunk, and the distance between sites was kept at more than 1000 m to avoid acoustic overlapping. The recorders were set to record the first 5 min of every half-hour daily (from 0 to 24 h) at a sampling rate of 22,050 Hz and 16 bits per sample. All the audio data were saved in SD memory cards with WAV. stereo format and the recorders were inspected twice a month to replace the batteries and collect data.

2.3. Acoustic Data Analyses

Raven Pro 1.5 software [30] was used to listen to the acoustic data and visualize the spectrograms (Figure 1) of recordings with a Hann window (FFT = 512, overlap 50%, frame size 100%). Within each 5-min recording, we selected each species’ calls and parameterized its features manually. Additionally, the software also provided the peak frequency parameters for each call. Peak frequency is when peak power occurs within the selection [30]. Next, we counted the number of calls produced by each species in each 5-min recording. In this study, for C. canorus and C. poliocephalus, we only calculated the number of male calls as they were easier to identify.
We monitored all the data and found that our targeted species arrived in the study area during April and left in August. Therefore, we focused our analysis between April and August. To study the seasonal patterns of vocal activity, we divided each month into two parts. For example, the number of calls produced during the first 15 days of April was categorized as “4-1” while calls in the latter part of April as “4-2”. As SD cards and batteries were changed at different times among sites, there were various minor gaps in the recordings ranging from one to three days. These data that corresponded to those days with gaps were excluded from our analysis.

2.4. Statistical Analyses

All the analyses were performed with the R V. 3. 5. 1 software program and the significance level was set at α = 0.05 [47]. The negative binomial generalized additive models (GAM) were used to identify the variation in the vocal activity of each species between different hours of the day or different seasons of the annual cycle. We used the gam function of the mgcv package to make the model. We selected the model that can best predict the nonlinear trends in diurnal and seasonal patterns of vocal activity. Different distribution families (Gaussian, Poisson, quasi-Poisson, zero-inflated Poisson, and negative binomial) were tested on our data, and the AICs of different models were compared. In the end, we selected the negative binomial family with the lowest AIC, and we also checked the residuals visually (no patterns were detected). The response variable in all models was the mean number of calls detected per hour during each seasonal group (for each half-month) while recording hour, month and site were used as predictors. In order to account for the variable number of days per half month, we used the average number of calls detected per hour during each half month, rather than the number of calls detected per recording hour. To better capture the data the predictors recording hour and month were modeled following an independent spline smoothed function for each site. This method is good for making models that can accurately describe differences between different sites. To account for the necessary smooth pattern in calls over time of day, in that 23:59 and 00:00 should be almost the same once averaged over many days, we considered a cyclic cubic regression spline for the hour of day smooth term. Furthermore, according to Harrison [48] a factor should have at least five levels to be considered random. In our data, there were only three levels inside the factor (three sites); therefore, sites were not included as a random effect.
To determine the temporal distribution of calls, we calculated the average number of calls detected per hour in each half month. To quantify the overlapping of seasonal temporal distributions between species, we used the niche overlap function of the spaa package to calculate the overlap index [49]:
O i k = e j = 1 r ( P i j ln P k j ) j = 1 r ( P i j ln P i j )
where P i j and P k j are the proportions of number of calls within the j t h esource (in seasonal pattern it is the same half month) used by the i t h and the k t h species respectively. The significance tests were performed following the formula [50]:
U i k = 2 r ln ( O i k )
where U is chi-square distributed with r 1 degrees of freedom; if U i k > x 2 0.05 (p < 0.05) we can reject the null hypothesis that species i and species j have complete niche overlap. In our study, we aimed to determine whether the seasonal distributions of species are significantly different.

3. Results

We identified the calls of each species at each site and counted their number. The total number of calls analyzed were 140,445, which includes 74,035 calls of C. saturatus, 11,202 calls of C. poliocephalus, 9310 calls of H. sparverioides, 31,413 calls of E. scolopaceus, 9661 calls of C. canorus, 4388 calls of C. coromandus and 433 calls of C. micropterus. According to the results, the most dominant species in our study area was C. saturatus (with 52.72% of the total number of calls), followed by E. scolopaceus (22.37%), whereas the least dominant was C. micropterus with 0.31% calls (Table 1). The composition of species is different in different sites; the number of calls of C. saturatus was high at site-1 and site-3 while E. scolopaceus’ call numbers were high at site-2.

3.1. Diurnal and Seasonal Patterns

3.1.1. Diurnal and Seasonal Pattern of C. saturatus

On a diurnal scale, the maximum calling activity of C. saturatus was found during the daytime from 4:30 to 19:30 (Figure 2a). The diurnal pattern of vocal activity showed a clear bimodal pattern, with 30.7% of the calls detected between 05:00 and 07:00 and 23.2% of the calls at dusk (17:00–19:00) (Figure 2a, Table S2). The GAM showed that the diurnal pattern of vocal activity of C. saturatus varied among the recording hours at site-1 and site-3 (Table 2), with two peaks of vocal activity at 05:00 and 18:00 at both sites (Figure 2a). Furthermore, no calls of C. saturatus were detected at site-2 (Table S1), which might be due to the low altitude of site-2 (689 m).
The seasonal pattern of vocal activity of C. saturatus started in early April and ended in late June (Figure 2b). During the annual cycle, C. saturatus exhibited maximum values between late April and early June, the time period during which 94.4% of the total calls were heard (Figure 2b and Table S3). According to the GAM, the vocal activity of the species differed during different times of the year at sites-1 and sites-3 (Table 2). The diurnal pattern of vocal activity at different times of the season is shown in Figure S2.

3.1.2. Diurnal and Seasonal Pattern of C. poliocephalus

C. poliocephalus produced calls throughout the diurnal cycle as well as at night (Figure 2c). The diurnal pattern of vocal activity of C. poliocephalus was more concentrated during the night, with 50.4% of the calls detected between 03:00 and 04:00 (Figure 2c, Table S4). The GAM indicated that the diurnal pattern of vocal activity of C. poliocephalus differed among the recording hours in three sites (Table 3), with a peak in vocal activity at 04:00 (Figure 2c).
The vocal activity of C. poliocephalus started in early May and ended in early August (Figure 2d and Table S5). Despite being vocally active from May to August, the species displayed a unimodal pattern of activity, with maximum output occurring between early June and early July when about 86.6% of total calls were made (Figure 2d and Table S5). The GAM indicated that there is variation in the vocal activity of the species during the different times of the year in three sites (Table 3). C. poliocephalus was also calling throughout the daytime, but such calls were only recorded in the breeding season with high vocal activity levels (Figure S3).

3.1.3. Diurnal and Seasonal Pattern of H. sparverioides

H. sparverioides produced calls throughout the diurnal cycle, including night time (Figure 2e). However, about 37.7% of total calls were made between 03:00 and 05:00 (Figure 2e, Table S6). The GAM indicated that the diurnal pattern of vocal activity of H. sparverioides varied among the recording hours at site-1 and site-2 (Table 4), with a peak of vocal activity at 05:00 (14.88%) (Figure 2e), while no significant difference was found among the recording hours and months at site-3 (Table 4), which could be due to the low activity of species at this site (Tables S6 and S7).
The vocal activity of H. sparverioides started in late April and ended in late August (Figure 2f). According to the GAM, there is a significant variation in the vocal activity of the H. sparverioides during different times of the year at site-1 and site-2 (Table 4). The species showed a unimodal pattern of vocal activity during the annual cycle, with peak values in May when 83.66% of the total calls were detected (Figure 2f and Table S7). Diurnal pattern of vocal activity in different times of the season is shown in Figure S4.

3.1.4. Diurnal and Seasonal Pattern of E. scolopaceus

Most vocalization of E. scolopaceus was restricted to the daytime (4:00–19:30), and only a few calls were recorded during the night (Figure 2g). The diurnal pattern of vocal activity showed a bimodal pattern, with 48.2% of the calls detected between 04:00 and 08:00 and 18.7% of the calls detected at dusk (17:00–19:00) (Figure 2g, Table S8). The GAM showed that the diurnal pattern of vocal activity of E. scolopaceus varied among the recording hours at three sites (Table 5), with two peaks of vocal activity at 05:00 and 18:00 at both sites (Figure 2g).
The vocal activity of E. scolopaceus started in early May and ended in late August (Figure 2h). There was a unimodal pattern of vocal activity during the annual cycle with maximum values between late May and early July, a period during which 84.2% of the total calls were detected (Figure 2h and Table S9). According to the GAM, the vocal activity of the species differed among months at site-3 and site-2 (Table 5), whereas no significant difference was found in the seasonal pattern of vocal activity of species I at site-1 (Table 5). Furthermore, calls during the night time were recorded only during the times of peak vocal activity between late May and early July (Figure S5).

3.1.5. Diurnal and Seasonal Pattern of C. canorus

The vocal activity of C. canorus was almost restricted to the daytime (04:00–19:00), with very few calls recorded at night (Figure 2i). The diurnal pattern of vocal activity showed a unimodal pattern, with 30.03% of the calls detected between 05:00 and 06:00 (Figure 2i, Table S10). The total number of calls at site-2 was low (Tables S10 and S11) and the GAM indicated that there is no significant difference in the diurnal and seasonal pattern of vocal activity of C. canorus among the recording hours and months at site-2 (Table 6). However, the diurnal pattern of vocal activity of C. canorus varied significantly among the recording hours at site-1 and site-3 (Table 6), with a peak of vocal activity at 05:00 (Figure 2i).
The vocal activity of C. canorus started in early May and ended in late July (Figure 2j). The GAM indicated that there is variation in the vocal activity of the species during different times of the year at site-1 and site-3 (Table 6). The species showed a unimodal pattern of vocal activity in the annual cycle, with peak values in early June when 42.84% of the total calls were detected (Figure 2j and Table S11). Moreover, night time calls were detected only during the peak time of vocal activity of the species in early June (Figure S6).

3.1.6. Diurnal and Seasonal Pattern of C. coromandus

The vocal activity of the C. coromandus was mainly concentrated during the night between 19:00 and 04:00, and only a few calls were recorded during the daytime (Figure 2k). The diurnal pattern of vocal activity showed a unimodal pattern, with 64.45% of the calls detected between 23:00 and 02:00 (Figure 2k, Table S12). The GAM showed that the diurnal pattern of vocal activity of C. coromandus varied among the recording hours at three sites (Table 7), with a peak of vocal activity at 01:00 (Figure 2k).
The vocal activity of C. coromandus started in early May and ended in early August (Figure 2l). The total number of calls at site-1 was low (Tables S12 and S13), and the GAM indicated that there is no significant difference in the seasonal pattern of vocal activity of C. coromandus among recording months at site-1 (Table 7) while a significant difference among months in the vocal activity of C. coromandus exists at site-3 and site-2 (Table 7). The species showed a bimodal pattern of vocal activity during the annual cycle, with the first peak in early June (51.48%) and a second and lower peak in early July when 29.28% of the total calls were detected (Figure 2l and Table S13). The diurnal pattern of vocal activity at different times of the season is shown in Figure S7.

3.1.7. Diurnal and Seasonal Pattern of C. micropterus

The vocal activity of C. micropterus was distributed over the diurnal cycle (Figure 2m); however, a maximum number of calls, about 21.25% were produced at 4:00 (Table S14). The vocal activity of C. micropterus started in early May and ended in early July (Figure 2n). The total number of calls of C. micropterus recorded was low (Tables S14 and S15), and the GAM result indicated that the vocal activity of C. micropterus is evenly distributed in diurnal and seasonal patterns (Table 8). The diurnal pattern of vocal activity at different times of the season is shown in Figure S8.

3.2. Overlap of Seasonal Distribution

The vocal activity of all species reached the peak in the early season (late May or early June) and then decreased gradually, except for C. coromandus, which had two peaks in the seasonal calling activity. The degree of seasonal distribution overlap estimated by the petraitis index was largest between E. scolopaceus and C. canorus (0.849). The remaining pairwise groups that had complete niche overlap in seasonal distribution are shown in bold digits in Table 9. The seasonal distribution overlap from the petraitis index is consistent with the seasonal pattern of calling activity (Figure 3). Each group is represented by the half-month’s relative percentage of presence per species (Figure 3).

4. Discussion

This study indicated that all of the studied Cuculidae species exhibited diurnal and seasonal patterns of calling activity. Five species displayed a peak in vocal activity earlier in the season (late May or early June) and a gradual decline thereafter, except for C. coromandus, which displayed two peaks in seasonal calling activity. This coincides with the findings of an earlier study in Korea, which found a decreasing trend in seasonal calling activity of cuckoo populations [20] and suggested that the absence of parental care in cuckoo species may be a reason for such unimodal pattern [33]. Furthermore, bird calls are not made randomly; instead, they are used for establishing territories and attracting mates [2,51]. Therefore, one function of calling earlier in the season might be to establish territories; for example, an earlier study documented that males of some cuckoo species reach the breeding grounds earlier than the females and defend their territories by calling higher [20,52]. However, in the Cuculidae species, the concept of exclusive territory is ambiguous, and some studies demonstrate the dominance hierarchy system [53,54,55]. In any case, the availability of host nests at the appropriate stage is vital for avian brood parasitic species; hence, guarding to maintain exclusive access to host nests and reduce competition is highly important [33,56,57].
In addition, brood-parasitic cuckoos are usually polygamous, and they make pairs only during copulation [44,58]. In our study, we found that C. coromandus displayed two peaks in vocal activity in early June and early July, indicating that mate attraction is more important in this species, and they might call late in the season to attract additional females. In addition, this species produces two broods [44], which means that peaks in vocal activity in the late season could indicate mating occurring later in the season since some females remain sexually available throughout the entire breeding season [59].
Furthermore, at site-2, the number of calling activity of E. scolopaceus and H. sparverioides became higher earlier and decreased gradually later in the season compared to other sites. Differences in latitude may explain such variations in seasonal vocal patterns. For example, the vocal activity of these species were found to be lower in May at site-1 and site-3 compared to site-2, which is located at a lower elevation (Tables S7 and S9). Considering the temperature difference of at least 4 degrees between lower and higher sites [60], it is possible that more birds may arrive at site-1 and site-3 later in the season when the temperature becomes higher. In either case, as the number of sites is low and we have no data on bird density around recorders, it is difficult to conclude that low numbers of birds in late May caused decreased vocalizations.
Nonetheless, the vocal activity of C. micropterus did not display any variation in the seasonal pattern. A most probable explanation for a constant seasonal singing pattern would be that, unlike other cuckoo species, this species’ calls were detected on low numbers (0.31%) in the recording spectrograms (Table 1). Earlier studies have shown a positive relationship between vocal activity and population abundance of birds around recorders [61,62]. Unfortunately, we do not have actual data on bird abundance. Therefore, we have used data from our study area (supplementary material: birdreport.csv) from 30 reports available on the bird report center of China (http://www.birdreport.cn/home/search/page.html, accessed on 28 February 2022) between April and August and found that C. canorus, E. scolopaceus, H. sparverioides and C. coromandus appeared 10, 5, 4 and 1 time respectively, whereas the other three species appeared twice, which may indicate that the abundance of C. micropterus is not as low as estimated from the call number of species. We propose that this might be due to the heterogeneous distribution and abundance of host species [63,64]. For example, the hosts of C. micropterus include Cyanopica cyanus, Pycnonotus sinensis and Turdus merula [65,66]. Based on our personal experience, we know that the aforementioned host species prefer to stay in human dominated areas and the sampling sites we selected in YNNR have very little human activities. Alternatively, the singing rate of several passerine species decreases when they feed their nestlings, illustrating the trade-off between energy distribution and singing performance [67,68]. However, C. coromandus and C. micropterus are brood parasites and depend on hosts to rear their offspring. This might be the reason why these species call later in the season.
Likewise, the vocal output of some brood-parasitic species is also triggered by the host species’ vocal output [20] and they may time their activity to match the host species’ activity. To examine this, we checked the abundance of host species in different months in Li et al. (2017) [46], and found that none of the host species of the C. micropterus is dominant in our study area, and that the number of calls of these Cuckoo species is linked with host species’ abundance in the study area. For example, Phylloscopus reguloides is the host of C. saturates, and the seasonal distribution of the number of calls of C. saturates is consistent with the actual abundance of Phylloscopus reguloides, which is higher from April to June (see Table 2 in Li et al. 2017 for a review [46]). Similarly, peaks in calling activity of C. poliocephalus and C. canorus in earlier June correspond with the abundance of their host species Urocissa erythrorhyncha and Paradoxornis webbianus in the study area. Lastly, Garrulax canorus and Cettia fortipes are hosts of different cuckoo species and their actual abundance and number of calls lasts longer during the whole breeding season [10,46,65,66] (Table S16).
In this study, for C. canorus and C. poliocephalus, we only calculated the number of male calls. From Yoo et al. (2020) [20] we found that the diurnal pattern was similar in both species and both sexes. The peak seasonal vocal activity of females lagged behind that of males by approximately 2 weeks for C. canorus, and 1 week for C. poliocephalus. Therefore, there may be little bias of seasonal distribution in our results, but this bias would be small because males typically produce calls much more frequently than females [20].
Birds sing at dawn and dusk to attract mates or defend territories [10,40]. Our results indicated that all species exhibited significant variation during different hours except for C. micropterus, which did not exhibit any variation. The increased vocal activity of E. scolopaceus and C. saturatus was observed at dawn and dusk. In contrast, the other four species displayed a high peak in calling activity in the morning, consistent with the findings of earlier studies [10,20,40]. Furthermore, at these times, light levels are usually low for foraging, and low temperatures are also conducive to the transmission of songs, so these birds may take advantage of this time by singing as they have nothing to do [1,69]. In addition, several studies have shown that peak timings of activity act as a communication network [42,70], and birds can gather information about the quality, social rank, and age of other birds by eavesdropping on their vocal interactions. Because, at dawn and dusk, birds sing under standardized conditions involving temporary singing interactions among different territory owners these times may be more beneficial to birds in making subsequent decisions [71,72,73,74].
Bird species display varying nocturnal calling behaviors; some frequently call at night while others only sing infrequently at night [17,75]. In our study, we discovered that although most of the species were calling more frequently during the day from 4:00 to 20:00, they did not restrict their activity to this period; instead, some species (e.g., C. coromandus and C. poliocephalus Figures S3 and S7) called throughout the night, and some (e.g., C. canorus; Figure S6) sang during the night only earlier in the season. These variations in singing are often attributed to different functions of songs. For example, in Common Nightingales (Luscinia megarhynchos), unmated males sing nocturnal songs throughout the breeding season to attract females, whereas mating males stop night singing after pairing later in the season [5]. In addition to attracting migrating females, several other functions of the nocturnal song have also been hypothesized, including reduced acoustic competition, the favorable transmission of songs, increased illumination of moonlight and reduced predator exposure [76,77,78,79]. Further research using detailed field data to unravel the function of Cuculidae calls responsible for variation in calling patterns among species would be highly beneficial to understand how calls work.
The seven Cuculidae species occupy similar ecological niches and have similar food resources [43] so they may partition acoustic space. We counted the number of calls of each species in each site; the results indicated that the composition of species is different in different sites, and C. micropterus is the least dominant species followed by C. coromandus. The seasonal distributions of vocal activity of two pairwise groups (E. scolopaceus and C. micropterus, C. poliocephalus and C. coromandus) overlap, and they also display a similar frequency range (Figure S9). However, they do not overlap in temporal patterns of seasonal vocal activity, possibly due to C. micropterus’s and C. coromandus’s low activity. The other ten groups (Table 9) overlapped in the seasonal distribution of vocal activity but varied in frequency (Figure S9). Therefore, we can conclude that the vocal activity of species in a pairwise group would not overlap simultaneously in space, time, and frequency. These findings are consistent with previous research, which found that birds singing at the same frequency as insects alter their song start time to avoid acoustic masking [80]. For example, a study in Peruvian bird assemblage indicated the significant negative correlation between spectral and temporal overlap [81]. Another study demonstrated how four sympatric wren-warblers partitioned their acoustic signal space and song perch height, demonstrating that acoustic signal partitioning can occur along multiple axes [82]. Our results also confirm that Cuculidae species have a flexible mechanism to avoid acoustic overlap.
In conclusion, we show that automatic recording is a valuable technique for studying the diurnal and seasonal patterns of vocal activity of Cuculidae species. Our results provided important insights into the diurnal and seasonal patterns of calling activity. However, further research with different population data is needed to determine which of the seasonal and diurnal song hypotheses best describes calling activity in Cuculidae species. Our study also showed that these parasitic species exhibit temporal partitioning in the seasonal distribution of vocalizations.

Supplementary Materials

The following are available online at https://www.mdpi.com/article/10.3390/d14040249/s1. Table S1: the spatial location of the sampling sites. Figure S1: Study area with the Geographical location of the three sampling sites in Yaoluoping National Nature Reserve (China). Table S2: Number of C. saturatus calls detected per hour at three monitoring stations. The total number and percentage of calls detected per hour, with respect to the total number of calls, are also shown. Table S3: Number of C. saturatus calls detected per half month at three monitoring stations. The total number and percentage of calls detected per half month, with respect to the total number of calls, are also shown. Figure S2: Diurnal pattern of vocal activity of C. saturatus in different seasons in Yaoluoping National Nature Reserve (China). The diurnal pattern is expressed as the mean number of calls detected per hour at each half month. Table S4: Number of C. poliocephalus calls detected per hour at three monitoring stations. The total number and percentage of calls detected per hour, with respect to the total number of calls, are also shown. Table S5: Number of C. poliocephalus calls detected per half month at three monitoring stations. The total number and percentage of calls detected per half month, with respect to the total number of calls, are also shown. Figure S3: Diurnal pattern of vocal activity of C. poliocephalus in different seasons in Yaoluoping National Nature Reserve (China). The diurnal pattern is expressed as the mean number of calls detected per hour at each half month. Table S6: Number of H. sparverioides calls detected per hour at three monitoring stations. The total number and percentage of calls detected per hour, with respect to the total number of calls, are also shown. Table S7: Number of H. sparverioides calls detected per half month at three monitoring stations. The total number and percentage of calls detected per half month, with respect to the total number of calls, are also shown. Figure S4: Diurnal pattern of vocal activity of H. sparverioides in different seasons in Yaoluoping National Nature Reserve (China). The diurnal pattern is expressed as the mean number of calls detected per hour at each half month. Table S8: Number of E. scolopaceus calls detected per hour at three monitoring stations. The total number and percentage of calls detected per hour, with respect to the total number of calls, are also shown. Table S9: Number of E. scolopaceus calls detected per half month at three monitoring stations. The total number and percentage of calls detected per half month, with respect to the total number of calls, are also shown. Figure S5: Diurnal pattern of vocal activity of E. scolopaceus in different seasons in Yaoluoping National Nature Reserve (China). The diurnal pattern is expressed as the mean number of calls detected per hour at each half month. Table S10: Number of C. canorus calls detected per hour at three monitoring stations. The total number and percentage of calls detected per hour, with respect to the total number of calls, are also shown. Table S11: Number of C. canorus calls detected per half month at three monitoring stations. The total number and percentage of calls detected per half month, with respect to the total number of calls, are also shown. Figure S6: Diurnal pattern of vocal activity of C. canorus in different seasons in Yaoluoping National Nature Reserve (China). The diurnal pattern is expressed as the mean number of calls detected per hour at each half month. Table S12: Number of C. coromandus calls detected per hour at three monitoring stations. The total number and percentage of calls detected per hour, with respect to the total number of calls, are also shown. Table S13: Number of C. coromandus calls detected per half month at three monitoring stations. The total number and percentage of calls detected per half month, with respect to the total number of calls, are also shown. Figure S7: Diurnal pattern of vocal activity of C. coromandus in different seasons in Yaoluoping National Nature Reserve (China). The diurnal pattern is expressed as the mean number of calls detected per hour at each half month. Table S14: Number of C. micropterus calls detected per hour at three monitoring stations. The total number and percentage of calls detected per hour, with respect to the total number of calls, are also shown. Table S15: Number of C. micropterus calls detected per half month at three monitoring stations. The total number and percentage of calls detected per half month, with respect to the total number of calls, are also shown. Figure S8: Diurnal pattern of vocal activity of C. micropterus in different seasons in Yaoluoping National Nature Reserve (China). The diurnal pattern is expressed as the mean number of calls detected per hour at each half month. Figure S9: Median and quartile ranges (boxes) for peak frequency of calls from the seven species from eastern China. Table S16: Dominant host species in Yaoluoping Nature Reserve and corresponding avian brood parasitic cuckoo species. Combination of Li’s study Table 4 (The dominant bird species in 7 periods) and Yang’s study Appendix 1 (Parasitic cuckoo species and their hosts in China) [46,65].

Author Contributions

J.M., S.M.P. and M.W. conceived the idea designed the experiment and collected the data. J.M. and S.M.P. analyzed the data and wrote the draft. J.M., S.M.P., M.W. and F.L. revised the draft and edited the manuscript. F.L. provided funding for the data collection. All authors have read and agreed to the published version of the manuscript.

Funding

This research received no external funding.

Institutional Review Board Statement

Not applicable.

Informed Consent Statement

Not applicable.

Data Availability Statement

Not applicable.

Acknowledgments

We appreciate the assistance of Jingang Jiang and Ting Yang for their help at the initial stages of the study. Field surveys were conducted under the instruction of Jun Chu and forest managers of the Yaoluoping National Nature Reserve, to whom we are most grateful. This work was financially supported by the Hefei Institutes of Physical Science, the Chinese Academy of Sciences.

Conflicts of Interest

The authors declare no conflict of interest.

References

  1. Gil, D.; Llusia, D. The bird dawn chorus revisited. In Coding Strategies in Vertebrate Acoustic Communication; Springer: New York, NY, USA, 2020; pp. 45–90. [Google Scholar]
  2. Xia, C.; Deng, Z.; Lloyd, H.; Møller, A.P.; Zhao, X.; Zhang, Y. The function of three main call types in common cuckoo. Ethology 2019, 125, 652–659. [Google Scholar] [CrossRef]
  3. Moskát, C.; Hauber, M.E. Sex-specific responses to simulated territorial intrusions in the common cuckoo: A dual function of female acoustic signaling. Behav. Ecol. Sociobiol. 2019, 73, 60. [Google Scholar] [CrossRef] [Green Version]
  4. Budden, A.E.; Wright, J. Falling on deaf ears: The adaptive significance of begging in the absence of a parent. Behav. Ecol. Sociobiol. 2001, 49, 474–481. [Google Scholar] [CrossRef]
  5. Amrhein, V.; Korner, P.; Naguib, M. Nocturnal and diurnal singing activity in the nightingale: Correlations with mating status and breeding cycle. Anim. Behav. 2002, 64, 939–944. [Google Scholar] [CrossRef] [Green Version]
  6. Puswal, S.M.; Jinjun, M.; Liu, F. Effects of temperature and season on birds’ dawn singing behavior in a forest of eastern China. J. Ornithol. 2021, 162, 447–459. [Google Scholar] [CrossRef]
  7. Foerster, K.; Poesel, A.; Kunc, H.; Kempenaers, B. The natural plasma testosterone profile of male blue tits during the breeding season and its relation to song output. J. Avian Biol. 2002, 33, 269–275. [Google Scholar] [CrossRef] [Green Version]
  8. Thomas, R.J.; Szekely, T.; Cuthill, I.C.; Harper, D.G.C.; Newson, S.E.; Frayling, T.D.; Wallis, P.D. Eye size in birds and the timing of song at dawn. Proc. R. Soc. B Biol. Sci. 2002, 269, 831–837. [Google Scholar] [CrossRef] [Green Version]
  9. Kirschel, A.N.G.; Blumstein, D.T.; Cohen, R.E.; Buermann, W.; Smith, T.B.; Slabbekoorn, H. Birdsong tuned to the environment: Green hylia song varies with elevation, tree cover, and noise. Behav. Ecol. 2009, 20, 1089–1095. [Google Scholar] [CrossRef] [Green Version]
  10. Puswal, S.M.; Mei, J.; Wang, M.; Liu, F. Daily and seasonal patterns in the singing activity of birds in East China. Ardea 2022, 110, 5–14. [Google Scholar] [CrossRef]
  11. Hutchinson, J.M.C.; Mcnamara, J.M.; Cuthill, I.C. Song, Sexual Selection, Starvation and Strategic Handicaps. Anim. Behav. 1993, 45, 1153–1177. [Google Scholar] [CrossRef] [Green Version]
  12. Hutchinson, J.M.C. Two explanations of the dawn chorus compared: How monotonically changing light levels favour a short break from singing. Anim. Behav. 2002, 64, 527–539. [Google Scholar] [CrossRef] [Green Version]
  13. Clark, C.J. The role of power versus energy in courtship: What is the ‘energetic cost’ of a courtship display? Anim. Behav. 2012, 84, 269–277. [Google Scholar] [CrossRef]
  14. Thomas, R.J. The costs of singing in nightingales. Anim. Behav. 2002, 63, 959–966. [Google Scholar] [CrossRef] [Green Version]
  15. Avery, M.I.; Krebs, J.R. Temperature and Foraging Success of Great Tits Parus-Major Hunting for Spiders. Ibis 1984, 126, 33–38. [Google Scholar] [CrossRef]
  16. Larom, D.; Garstang, M.; Payne, K.; Raspet, R.; Lindeque, M. The influence of surface atmospheric conditions on the range and area reached by animal vocalizations. J. Exp. Biol. 1997, 200, 421–431. [Google Scholar] [CrossRef]
  17. La, V.T. Diurnal and Nocturnal Birds Vocalize at Night: A Review. Condor 2012, 114, 245–257. [Google Scholar] [CrossRef] [Green Version]
  18. Beauchamp, G. The evolution of communal roosting in birds: Origin and secondary losses. Behav. Ecol. 1999, 10, 675–687. [Google Scholar] [CrossRef] [Green Version]
  19. Pérez-Granados, C.; Schuchmann, K.-L. Passive Acoustic Monitoring of Chaco Chachalaca (Ortalis canicollis) Over a Year: Vocal Activity Pattern and Monitoring Recommendations. Trop. Conserv. Sci. 2021, 14. [Google Scholar] [CrossRef]
  20. Yoo, S.; Kim, H.N.; Lee, J.W.; Yoo, J.C. Seasonal and diurnal patterns of population vocal activity in avian brood parasites. Ibis 2020, 162, 1001–1011. [Google Scholar] [CrossRef]
  21. Deng, Z.Q.; Lloyd, H.; Xia, C.W.; Li, D.L.; Zhang, Y.Y. Within-season decline in call consistency of individual male Common Cuckoos (Cuculus canorus). J. Ornithol. 2019, 160, 317–327. [Google Scholar] [CrossRef] [Green Version]
  22. Payne, R.B.; Kirwan, G.M. Chestnut-winged Cuckoo (Clamator coromandus). In Birds of the World, 1st ed.; del Hoyo, J., Elliott, A., Sargatal, J., Christie, D.A., de Juana, E., Eds.; Cornell Lab of Ornithology: Ithaca, NY, USA, 2020. [Google Scholar] [CrossRef]
  23. Payne, R.B.; Kirwan, G.M. Himalayan Cuckoo (Cuculus saturatus). In Birds of the World, 1st ed.; Billerman, S.M., Keeney, B.K., Rodewald, P.G., Schulenberg, T.S., Eds.; Cornell Lab of Ornithology: Ithaca, NY, USA, 2020. [Google Scholar] [CrossRef]
  24. Payne, R.B.; Kirwan, G.M. Large Hawk-Cuckoo (Hierococcyx sparverioides). In Birds of the World, 1st ed.; del Hoyo, J., Elliott, A., Sargatal, J., Christie, D.A., de Juana, E., Eds.; Cornell Lab of Ornithology: Ithaca, NY, USA, 2020. [Google Scholar] [CrossRef]
  25. Payne, R.B.; Juana, E.D.; Kirwan, G.M. Lesser Cuckoo (Cuculus poliocephalus). In Birds of the World, 1st ed.; del Hoyo, J., Elliott, A., Sargatal, J., Christie, D.A., de Juana, E., Eds.; Cornell Lab of Ornithology: Ithaca, NY, USA, 2020. [Google Scholar] [CrossRef]
  26. Payne, R.B.; Christie, D.A.; Kirwan, G.M. Common Cuckoo (Cuculus canorus). In Birds of the World, 1st ed.; del Hoyo, J., Elliott, A., Sargatal, J., Christie, D.A., de Juana, E., Eds.; Cornell Lab of Ornithology: Ithaca, NY, USA, 2020. [Google Scholar] [CrossRef]
  27. Payne, R.B. Indian Cuckoo (Cuculus micropterus). In Birds of the World, 1st ed.; del Hoyo, J., Elliott, A., Sargatal, J., Christie, D.A., de Juana, E., Eds.; Cornell Lab of Ornithology: Ithaca, NY, USA, 2020. [Google Scholar] [CrossRef]
  28. Limparungpatthanakij, W.L. Asian Koel (Eudynamys scolopaceus). In Birds of the World, 1st ed.; Billerman, S.M., Keeney, B.K., Rodewald, P.G., Schulenberg, T.S., Eds.; Cornell Lab of Ornithology: Ithaca, NY, USA, 2020. [Google Scholar] [CrossRef]
  29. Wu, H.; Gu, C. Guide to the Birds of Anhui; Anhui Normal University Press: Anhui, China, 2017. [Google Scholar]
  30. Bioacoustics Research Program. Raven Pro. Interactive Sound Analysis Software, Version 1.5 Computer Software; The Cornell Lab of Ornithology: Ithaca, NY, USA, 2014. [Google Scholar]
  31. Moskát, C.; Taylor, D.M.; Hauber, M.E. Effective conspecific communication with aberrant calls in the common cuckoo (Cuculus canorus). Behav. Ecol. Sociobiol. 2021, 75, 7. [Google Scholar] [CrossRef]
  32. York, J.E.; Davies, N.B. Female cuckoo calls misdirect host defences towards the wrong enemy. Nat. Ecol. Evol. 2017, 1, 1520–1525. [Google Scholar] [CrossRef] [PubMed]
  33. Davies, N. Cuckoo: Cheating by Nature; Bloomsbury Publishing: London, UK, 2015. [Google Scholar]
  34. Zhang, C.; Jiang, X.; Li, M.; Liang, J.; Liu, J.; Liang, W. Female cuckoo calls elicit anti-predatory behavior in birds. J. Ethol. 2021, 39, 393–398. [Google Scholar] [CrossRef]
  35. Marton, A.; Fülöp, A.; Bán, M.; Hauber, M.E.; Moskát, C. Female common cuckoo calls dampen the mobbing intensity of great reed warbler hosts. Ethology 2021, 127, 286–293. [Google Scholar] [CrossRef]
  36. Jiang, X.; Zhang, C.; Liu, J.; Liang, W. Female cuckoo calls elicit vigilance and escape responses from wild free-range chickens. Ethol. Ecol. Evol. 2021, 33, 37–48. [Google Scholar] [CrossRef]
  37. Zsebők, S.; Moskát, C.; Bán, M. Individually distinctive vocalization in Common Cuckoos (Cuculus canorus). J. Ornithol. 2017, 158, 213–222. [Google Scholar] [CrossRef] [Green Version]
  38. Delgado, M.D.; Caferri, E.; Méndez, M.; Godoy, J.A.; Campioni, L.; Penteriani, V. Population Characteristics May Reduce the Levels of Individual Call Identity. PLoS ONE 2013, 8, e77557. [Google Scholar] [CrossRef] [Green Version]
  39. Li, Y.; Xia, C.; Lloyd, H.; Li, D.; Zhang, Y. Identification of vocal individuality in male cuckoos using different analytical techniques. Avian Res. 2017, 8, 21. [Google Scholar] [CrossRef] [Green Version]
  40. Huang, W.-P.; Xu, S.-T.; Liang, W.; Xia, C.-W. Daily Vocal Pattern of Large Hawk Cuckoo (Hierococcyx sparverioides). Chin. J. Zool. 2017, 52, 945–953. [Google Scholar] [CrossRef]
  41. Gong, Y.; Wang, M.; Zhou, B.; Deng, Z.; He, Y.; Xia, C. Daily Vocal Pattern of Female Common Cuckoo (Cuculus canorus). Chin. J. Zool. 2020, 55, 560–565. [Google Scholar]
  42. Hodgson, L.; Waas, J.R.; Foote, J.R. Early singers attend to conspecific but not heterospecific behavioural cues at dawn. J. Avian Biol. 2018, 49, e01749. [Google Scholar] [CrossRef]
  43. Lee, J.W.; Noh, H.J.; Lee, Y.; Kwon, Y.S.; Kim, C.H.; Yoo, J.C. Spatial patterns, ecological niches, and interspecific competition of avian brood parasites: Inferring from a case study of Korea. Ecol. Evol. 2014, 4, 3689–3702. [Google Scholar] [CrossRef] [PubMed]
  44. Payne, R.B.; Sorensen, M.D.; Klitz, K.; Megahan, J. The Cuckoos: Cuculidae; Oxford University Press: New York, NY, USA, 2005; Volume 15. [Google Scholar]
  45. Lin, G.; Rusong, X.; Jiaoxian, C.; Zongyun, Z. A preliminary study on the flore of Yaoluoping National Resources Reserve. J. Biol. 2002, 19, 32–34. [Google Scholar]
  46. Li, L.; Peng, C.; Haigen, X.; Yaqiong, W.; Fan, Y.; Yinxu, H.; Haohao, M.; Lei, Y. A Comparative Study of Bird Species Diversity in Breeding Season at Anhui Yaoluoping National Nature Reserve. Chin. J. Wildl. 2017, 38, 52–62. [Google Scholar] [CrossRef]
  47. R Development Core Team. A Language and Environment for Statistical Computing, R-3.5.1; R Foundation for Statistical Computing: Vienna, Austria, 2017. [Google Scholar]
  48. Harrison, X.A. A comparison of observation-level randomeffect and Beta-Binomial models for modelling overdispersion in Binomial data in ecology & evolution. PeerJ 2015, 3, e1114. [Google Scholar] [CrossRef] [Green Version]
  49. Petraitis, P.S. Likelihood measures of niche breadth and overlap. Ecology 1979, 60, 703–710. [Google Scholar] [CrossRef]
  50. Petraitis, P.S. The relationship between likelihood niche measures and replicated tests for goodness-of-fit. Ecology 1985, 66, 1983–1985. [Google Scholar] [CrossRef]
  51. Catchpole, C.K.; Slater, P.J. Bird Song: Biological Themes and Variations, 2nd ed.; Cambridge University Press: Cambridge, UK, 2008. [Google Scholar]
  52. Riddiford, N. Why Do Cuckoos Cuculus Canorus Use So Many Species of Hosts. Bird Study 1986, 33, 1–5. [Google Scholar] [CrossRef]
  53. Nakamura, H.; Miyazawa, Y. Movements, Space Use and Social Organization of Radio-tracked Common Cuckoos during the Breeeding Season in Japan. Jpn. J. Ornithol. 1997, 46, 23–54. [Google Scholar] [CrossRef] [Green Version]
  54. Vogl, W.; Taborsky, B.; Taborsky, M.; Teuschl, Y.; Honza, M. Habitat and space use of European cuckoo females during the egg laying period. Behaviour 2004, 141, 881–898. [Google Scholar] [CrossRef]
  55. Honza, M.; Taborsky, B.; Taborsky, M.; Teuschl, Y.; Vogl, W.; Moksnes, A.; Roskaft, E. Behaviour of female common cuckoos, Cuculus canorus, in the vicinity of host nests before and during egg laying: A radiotelemetry study. Anim. Behav. 2002, 64, 861–868. [Google Scholar] [CrossRef] [Green Version]
  56. Fiorini, V.D.; Tuero, D.T.; Reboreda, J.C. Shiny cowbirds synchronize parasitism with host laying and puncture host eggs according to host characteristics. Anim. Behav. 2009, 77, 561–568. [Google Scholar] [CrossRef]
  57. Geltsch, N.; Ban, M.; Hauber, M.E.; Moskát, C. When should Common Cuckoos Cuculus canorus lay their eggs in host nests? Bird Study 2016, 63, 46–51. [Google Scholar] [CrossRef] [Green Version]
  58. Jones, D.A.; Gibbs, H.L.; Matsuda, T.; Brooke, M.D.; Uchida, H.; Bayliss, M.J. The use of DNA fingerprinting to determine the possible mating system of an obligate brood parasitic bird, the Cuckoo Cuculus canorus. Ibis 1997, 139, 560–562. [Google Scholar] [CrossRef]
  59. Nakamura, H.; Miyazawa, Y.; Kashiwagi, K. Behavior of radio-tracked Common Cuckoo females during the breeding season in Japan. Ornithol. Sci. 2009, 4, 31–41. [Google Scholar] [CrossRef]
  60. Li, W.B.; Liu, N.Y.; Wu, Y.H.; Zhang, Y.C.; Xu, Q.; Chu, J.; Wang, S.Y.; Fang, J. Community composition and diversity of ground beetles (Coleoptera: Carabidae) in Yaoluoping National Nature Reserve. J. Insect Sci. 2017, 17, 114. [Google Scholar] [CrossRef] [Green Version]
  61. Laiolo, P.; Tella, J.L. Social determinants of songbird vocal activity and implications for the persistence of small populations. Anim. Conserv. 2008, 11, 433–441. [Google Scholar] [CrossRef] [Green Version]
  62. Pérez-Granados, C.; Bota, G.; Giralt, D.; Barrero, A.; Gómez-Catasús, J.; Bustillo-De La Rosa, D.; Traba, J. Vocal activity rate index: A useful method to infer terrestrial bird abundance with acoustic monitoring. Ibis 2019, 161, 901–907. [Google Scholar] [CrossRef]
  63. Devictor, V.; Julliard, R.; Clavel, J.; Jiguet, F.; Lee, A.; Couvet, D. Functional biotic homogenization of bird communities in disturbed landscapes. Glob. Ecol. Biogeogr. 2008, 17, 252–261. [Google Scholar] [CrossRef]
  64. Moskát, C.; Barta, Z.; Hauber, M.E.; Honza, M. High synchrony of egg laying in common cuckoos (Cuculus canorus) and their great reed warbler (Acrocephalus arundinaceus) hosts. Ethol. Ecol. Evol. 2006, 18, 159–167. [Google Scholar] [CrossRef]
  65. Yang, C.; Liang, W.; Antonov, A.; Cai, Y.; Stokke, B.G.; Fossøy, F.; Moksnes, A.; Røskaft, E. Diversity of parasitic cuckoos and their hosts in China. Chin. Birds 2012, 3, 9–32. [Google Scholar] [CrossRef]
  66. Liang, W.; Yang, C.; Møller, A.P. High diversity of brood parasites in China and coevolution between cuckoos and their hosts. In Avian Brood Parasitism: Behaviour, Ecology, Evolution and Coevolution; Soler, M., Ed.; Springer: Cham, Switzerland, 2017; pp. 251–267. [Google Scholar]
  67. Shutler, D. Sexual selection: When to expect trade-offs. Biol. Lett. 2011, 7, 101–104. [Google Scholar] [CrossRef] [PubMed]
  68. Birkhead, T.R.; Møller, A.P. Sperm Competition in Birds: Evolutionary Causes and Consequences; Academic Press: New York, NY, USA, 1992. [Google Scholar]
  69. Wiley, R.H.; Richards, D.G. Physical constraints on acoustic communication in the atmosphere: Implications for the evolution of animal vocalizations. Behav. Ecol. Sociobiol. 1978, 3, 69–94. [Google Scholar] [CrossRef]
  70. Burt, J.M.; Vehrencamp, S.L. Dawn Chorus as an Interactive Communication Network; Animal Communication Networks; Cambridge University Press: Cambridge, UK, 2005. [Google Scholar]
  71. Peake, T.M.; Terry, A.M.R.; McGregor, P.K.; Dabelsteen, T. Do great tits assess rivals by combining direct experience with information gathered by eavesdropping? Proc. R. Soc. B Biol. Sci. 2002, 269, 1925–1929. [Google Scholar] [CrossRef] [Green Version]
  72. Mennill, D.J.; Ratcliffe, L.M.; Boag, P.T. Female eavesdropping on male song contests in songbirds. Science 2002, 296, 873. [Google Scholar] [CrossRef]
  73. Welling, P.; Koivula, K.; Lahti, K. The Dawn Chorus Is Linked with Female Fertility in the Willow Tit Parus-Montanus. J. Avian Biol. 1995, 26, 241–246. [Google Scholar] [CrossRef]
  74. Otter, K.; Chruszcz, B.; Ratcliffe, L. Honest advertisement and song output during the dawn chorus of black-capped chickadees. Behav. Ecol. 1997, 8, 167–173. [Google Scholar] [CrossRef] [Green Version]
  75. Perrault, K.; Lobert, L.M.; Ehnes, M.; Foote, J.R. Nocturnal singing in a temperate bird community. J. Ornithol. 2014, 155, 1059–1062. [Google Scholar] [CrossRef]
  76. Alessi, M.G.; Benson, T.J.; Ward, M.P. Nocturnal Social Cues Attract Migrating Yellow-breasted Chats. Wilson J. Ornithol. 2010, 122, 780–783. [Google Scholar] [CrossRef]
  77. Fuller, R.A.; Warren, P.H.; Gaston, K.J. Daytime noise predicts nocturnal singing in urban robins. Biol. Lett. 2007, 3, 368–370. [Google Scholar] [CrossRef]
  78. Yorzinski, J.L.; Platt, M.L. The difference between night and day: Antipredator behavior in birds. J. Ethol. 2012, 30, 211–218. [Google Scholar] [CrossRef]
  79. Pérez-Granados, C.; Schuchmann, K.-L.; Marques, M.I. Vocal activity of the Ferruginous pygmy-owl (Glaucidium brasilianum) is strongly correlated with moon phase and nocturnal temperature. Ethol. Ecol. Evol. 2021, 33, 62–72. [Google Scholar] [CrossRef]
  80. Stanley, C.Q.; Walter, M.H.; Venkatraman, M.X.; Wilkinson, G.S. Insect noise avoidance in the dawn chorus of Neotropical birds. Anim. Behav. 2016, 112, 255–265. [Google Scholar] [CrossRef]
  81. Planqué, R.; Slabbekoorn, H. Spectral Overlap in Songs and Temporal Avoidance in a Peruvian Bird Assemblage. Ethology 2008, 114, 262–271. [Google Scholar] [CrossRef]
  82. Chitnis, S.S.; Rajan, S.; Krishnan, A. Sympatric wren-warblers partition acoustic signal space and song perch height. Behav. Ecol. 2020, 31, 559–567. [Google Scholar] [CrossRef]
Figure 1. Spectrograms of seven Cuculidae birds from eastern China. The X-axis represents the time in seconds, and the Y-axis represents the frequency in kHz. The sound files can be found in Supplementary Materials and the Spectrograms were made by Raven Pro Version 1.5 software [30]. Examples of calls are shown in black box.
Diversity 14 00249 g001
Figure 2. Pattern of diurnal and seasonal vocal activity of Cuculidae species in Yaoluoping National Nature Reserve (China). Different lines indicate patterns of calling activity at three different sites. The diurnal pattern is expressed as the mean number of calls detected per hour at each site on the Y-axis and hours of the day on the X-axis. The seasonal pattern is expressed as the mean number of calls detected per hour at each site on the Y-axis and time of the season every half month on the X-axis.
Diversity 14 00249 g002
Figure 3. Seasonal distribution of calling activity of the different species during the year. Each group is represented by the half-month’s relative percentage of presence per species. The longer the rectangle, the more likely the presence of the species in this half-month is.
Diversity 14 00249 g003
Table 1. Number of calls identified for each species at three sites in Yaoluoping National Nature Reserve (YNNR).
C. saturatusC. poliocephalusH. sparverioidesE. scolopaceusC. canorusC. coromandusC. micropterus
Site-151,0304379144914310485834
Site-20803772422,2393052796158
Site-323,0096019137903183081009271
total74,03911,201931031,41396614388433
%52.727.986.6322.376.883.120.31
Table 2. The table below summarizes a negative binomial GAM model that was used to examine the effect of recording time and month on C. saturatus’s activity. The recording hour and month were modeled independently with smoothed function for each monitored site, while the cyclic predictor was modeled using a cyclic cubic regression spline. Reference degrees of freedom was used to calculate test statistics and p-values are represented by Ref. df whereas Edf (Effective degrees of freedom) indicates the curviness of the relationship.
Parametric CoefficientsEstimateStandard ErrorZp
Intercept−29.624.88−6.07<0.001 *
Site-3−0.900.10−8.60<0.001 *
Smooth terms EdfRef. dfχ2p
s(hour): site-18.548.88126.60<0.001 *
s(hour): site-35.555.91315.70<0.001 *
s(month): site-18.288.6856.63<0.001 *
s(month): site-35.075.66171.44<0.001 *
* p < 0.05.
Table 3. The table below summarizes a negative binomial GAM model used to examine the effect of recording time and month on C. poliocephalus’s activity. The recording hour and month were modeled independently with smoothed function for each monitored site, while the cyclic predictor was modeled using a cyclic cubic regression spline. Reference degrees of freedom was used to calculate test statistics and p-values are represented by Ref. df, whereas Edf (Effective degrees of freedom) indicates the curviness of the relationship.
Parametric CoefficientsEstimateStandard ErrorZp
Intercept−4.371.39−3.150.002 *
site-30.380.261.440.151
site-2−1.520.32−4.78<0.001 *
Smooth terms EdfRef. dfχ2p
s(hour): site-15.626.7459.27<0.001 *
s(hour): site-35.957.0597.39<0.001 *
s(hour): site-21.001.009.410.002 *
s(month): site-14.845.4266.09<0.001 *
s(month): site-35.786.6170.82<0.001 *
s(month): site-23.724.4441.44<0.001 *
* p < 0.05.
Table 4. The table below summarizes a negative binomial GAM model used to examine the effect of recording time and month on H. sparverioides’s activity. The recording hour and month were modeled independently with smoothed function for each monitored site, while the cyclic predictor was modeled using a cyclic cubic regression spline. Reference degrees of freedom was used to calculate test statistics and p-values are represented by Ref. df, whereas Edf (Effective degrees of freedom) indicates the curviness of the relationship.
Parametric CoefficientsEstimateStandard ErrorZp
Intercept−4.560.73−6.28<0.001 *
site-3−1.740.43−4.10<0.001 *
site-22.310.278.43<0.001 *
Smooth terms EdfRef. dfχ2p
s(hour): site-15.226.2540.36<0.001 *
s(hour): site-31.001.003.820.051
s(hour): site-25.696.8252.45<0.001 *
s(month): site-15.096.1247.39<0.001 *
s(month): site-34.314.763.280.705
s(month): site-25.586.49160.83<0.001 *
* p < 0.05.
Table 5. The table below summarizes a negative binomial GAM model used to examine the effect of recording time and month on E. scolopaceus’s activity. The recording hour and month were modeled independently with smoothed function for each monitored site, while the cyclic predictor was modeled using a cyclic cubic regression spline. Reference degrees of freedom was used to calculate test statistics and p-values are represented by Ref. df, whereas Edf (Effective degrees of freedom) indicates the curviness of the relationship.
Parametric CoefficientsEstimateStandard ErrorZp
Intercept−6.450.54−11.88<0.001 *
site-33.960.3312.12<0.001 *
site-25.040.3215.51<0.001 *
Smooth terms EdfRef. dfχ2p
s(hour): site-11.001.004.370.037 *
s(hour): site-37.598.51125.60<0.001 *
s(hour): site-27.978.59197.70<0.001 *
s(month): site-13.384.295.150.315
s(month): site-36.197.18126.60<0.001 *
s(month): site-27.347.89228.40<0.001 *
* p < 0.05.
Table 6. The table below summarizes a negative binomial GAM model used to examine the effect of recording time and month on C. canorus’s activity. The recording hour and month were modeled independently with smoothed function for each monitored site, while the cyclic predictor was modeled using a cyclic cubic regression spline. Reference degrees of freedom was used to calculate test statistics and p-values are represented by Ref. df, whereas Edf (Effective degrees of freedom) indicates the curviness of the relationship.
Parametric CoefficientsEstimateStandard ErrorZp
Intercept−5.670.94−6.00<0.001 *
site-32.140.297.35<0.001 *
site-2−1.090.38−2.900.004 *
Smooth terms EdfRef. dfχ2p
s(hour): site-14.635.6812.190.046 *
s(hour): site-36.897.5185.38<0.001 *
s(hour): site-22.673.376.020.143
s(month): site-13.073.4416.110.001 *
s(month): site-35.516.18115.78<0.001 *
s(month): site-23.704.567.440.148
* p < 0.05.
Table 7. The table below summarizes a negative binomial GAM model used to examine the effect of recording time and month on C. coromandus’s activity. The recording hour and month were modeled independently with smoothed function for each monitored site, while the cyclic predictor was modeled using a cyclic cubic regression spline. Reference degrees of freedom was used to calculate test statistics and p-values are represented by Ref. df, whereas Edf (Effective degrees of freedom) indicates the curviness of the relationship.
Parametric CoefficientsEstimateStandard ErrorZp
Intercept−6.411.53−4.20<0.001 *
site-30.340.460.730.465
site-21.720.424.06<0.001 *
Smooth terms EdfRef. dfχ2p
s(hour): site-13.183.9315.330.004 *
s(hour): site-32.883.5616.280.002 *
s(hour): site-23.694.5434.74<0.001 *
s(month): site-12.843.305.990.081
s(month): site-35.015.9853.63<0.001 *
s(month): site-25.215.8130.15<0.001 *
* p < 0.05.
Table 8. The table below summarizes a negative binomial GAM model used to examine the effect of recording time and month on C. micropterus’s activity. The recording hour and month were modeled independently with smoothed function for each monitored site, while the cyclic predictor was modeled using a cyclic cubic regression spline. Reference degrees of freedom was used to calculate test statistics and p-values are represented by Ref. df, whereas Edf (Effective degrees of freedom) indicates the curviness of the relationship.
Parametric CoefficientsEstimateStandard ErrorZp
Intercept−9.122.21−4.13<0.001 *
site-34.101.952.110.035 *
site-23.561.961.820.069
Smooth terms EdfRef. dfχ2p
s(hour): site-11.001.000.110.739
s(hour): site-34.245.209.770.115
s(hour): site-21.001.001.710.191
s(month): site-11.742.200.160.955
s(month): site-33.354.218.550.063
s(month): site-23.394.004.080.392
* p < 0.05.
Table 9. The values of the petraitis index showing the degree of seasonal distribution overlap among the seven species in eastern China. Bold digits represent those groups that have high overlap in seasonal distributional pattern.
C. saturatusC. poliocephalusH. sparverioidesE. scolopaceusC. canorusC. coromandus
C. poliocephalus0.039
H. sparverioides0.683 *0.083
E. scolopaceus0.702 *0.695 *0.468 *
C. canorus0.2640.702 *0.2070.849 *
C. coromandus0.2160.545 *0.1060.554 *0.705 *
C. micropterus0.3730.746 *0.2360.752 *0.755 *0.636 *
*: p > 0.05.
Publisher’s Note: MDPI stays neutral with regard to jurisdictional claims in published maps and institutional affiliations.

