Article

The Spatial Distribution of Soil Nitrogen Storage and the Factors That Influence It in Central Asia’s Typical Arid and Semiarid Grasslands

1
Xinjiang Institute of Ecology and Geography Chinese Academy of Sciences, Urumqi 830011, China
2
University of Chinese Academy of Sciences, Beijing 100049, China
3
National Engineering Technology Research Center for Desert-Oasis Ecological Construction, Urumqi 830000, China
4
State Key Laboratory of Desert and Oasis Ecology, Xinjiang Institute of Ecology and Geography, Chinese Academy of Sciences, Urumqi 830000, China
5
Department Forest Resource and Forestry, Saken Seifullin Kazakh Agrotechnical University, Nursultan 010000, Kazakhstan
*
Author to whom correspondence should be addressed.
These authors contributed equally to this work.
Diversity 2022, 14(6), 459; https://doi.org/10.3390/d14060459
Submission received: 4 May 2022 / Revised: 3 June 2022 / Accepted: 4 June 2022 / Published: 8 June 2022

Abstract

:
Using a structural equation model (SEM), this paper investigates the response of soil nitrogen content of five typical grasslands in the middle line countries of China’s “Belt and Road” initiative to the changes of climate variables, soil pH value, and normalized vegetation index, and employs the principal component analysis method to determine the spatial variation characteristics and influencing factors of nitrogen reserves in different grasslands. Pontiac grassland (PS), Middle East grassland (MES), Kazakh grassland (KS), Kazakh forest grassland (KFS), and Kazakh semi-desert grassland (KFS) are the five grasslands in the research region (KSD). The results indicated that (1) the nitrogen reserves of the five grassland soils (0–100 cm) in the research area were 7.49 Pg, or approximately 5.7 percent of the total world nitrogen reserves. The sum of the five grasslands’ 0–30 cm and 0–50 cm N reserves accounted for 36.3 percent and 63.1 percent, respectively, of the total 0–100 cm N reserves. The density of nitrogen in the soil (0–100 cm) varied significantly between grasslands, ranging from 1.47 to 3.87 kg/m2, with an average of 3.10 kg/m2. (2) PCA analysis revealed a substantial positive correlation between soil N and MAP (p < 0.01), a negative correlation between soil N and Srad (p < 0.01), and a high degree of similarity between the three grassland samples, KFS, KS, and KSD. (3) The decision tree algorithm determined that MAP had the most relative importance for changes in soil nitrogen content in PS, MES, and KFS, whereas Srad had the greatest relative importance for changes in soil nitrogen content in KS and KSD. The pH showed the least proportional impact for variations in soil N concentration in all five grasslands. (4) Different factors influence the change in soil N content across diverse grasslands. The principal positive driving factor of soil N content in KS and KSD is Srad, with loads of −0.39 and −0.44, respectively. The principal negative driving factor of soil N content in PS and MES is Map, with loads of 0.38 and 0.2, respectively. In the SEM model of soil nitrogen content in KFS, no environmental variables had a significant effect on N content, and the model’s R2 value was 0.08, indicating an average fit.

1. Preface

With humans having an increasing impact on the planet, the interactions between the nitrogen cycle, the carbon cycle, and the climate are expected to become an increasingly important determinant of the Earth’s system [1], and the carbon and nitrogen cycles are inextricably intertwined. Nitrogen is a critical ecological element in ecosystems [2], and even minor changes in the nitrogen cycle can have a large effect on fundamental carbon cycling processes in ecosystems [3]. Grassland ecosystems encompass approximately 30% of the world’s land area and 70% of its agricultural land [4], and as one of the most extensively dispersed ecosystem types in terrestrial ecosystems, they are critical for global climate regulation and carbon cycling [2,5]. Thus, a thorough understanding of the spatial distribution patterns of nitrogen stocks in grassland ecosystems and the factors that influence them is critical for accurately forecasting the carbon cycle in terrestrial ecosystems and its feedback relationships with climate change in the context of continued global warming [6].
Numerous studies have been conducted over the last few decades to ascertain the distribution of global nitrogen stocks [7] and the effect of global change variables on N stocks in distinct ecosystems [5]. Soil is the main reservoir of nitrogen in terrestrial ecosystems, where there is a substantially higher concentration of nitrogen than in vegetation [8]. Grassland soils contain 94 percent and 99 percent of the carbon and nitrogen in the ecosystem, respectively [9]. At present, research on grassland nutrient cycling has focused mostly on the impacts of grazing on soil carbon and nitrogen changes in grassland ecosystems at the sample plot scale [10]. Desert grassland ecosystems are a significant type of ecosystem in arid and semiarid regions, but they are intrinsically sensitive and vulnerable to global climate change due to soil erosion and the consequences of drought and desertification. As a result, the assessment of carbon and nitrogen stocks in desert grassland ecosystems is currently fraught with ambiguity [11].
Central Asia is abundant in grassland varieties characteristic of dry and semiarid grasslands, including highland grasslands, semi-desert grasslands, forest grasslands, and mountain grasslands. Central Asia is also home to the world’s largest desert steppe environment. Grassland ecosystems are critical for human life and development on a global scale, as well as in Central Asia in particular. Assessing variations in soil nitrogen levels and the factors impacting them has become a critical component of sustainable grassland usage and management [8,12]. Thus, quantifying the N reserves of Central Asian grasslands can aid in resource allocation and is critical for assessing N dynamics and productivity under gas changes, as well as providing a reference for managing soil N content changes during grassland restoration and providing a theoretical foundation and basic data on grassland soil fertility and quality changes. Five typical grasslands with vast areas along the middle-line countries of China’s “Belt and Road” initiative were examined in this study: the Pontic Steppe (PS), the Middle East Steppe (MES), and the Kazakh Steppe (KS). The purpose of this study was to examine the factors that influence soil carbon and nitrogen changes in steppe soils and to forecast the fundamental characteristics of soil N change in the context of global change. The objectives of this study were to investigate the spatial variability of soil nitrogen content distribution in five representative arid and semiarid steppes in Central Asia, to estimate the N stocks in the steppes’ various soil layers, and to investigate the drivers of spatial variability in soil nitrogen content in the steppes.

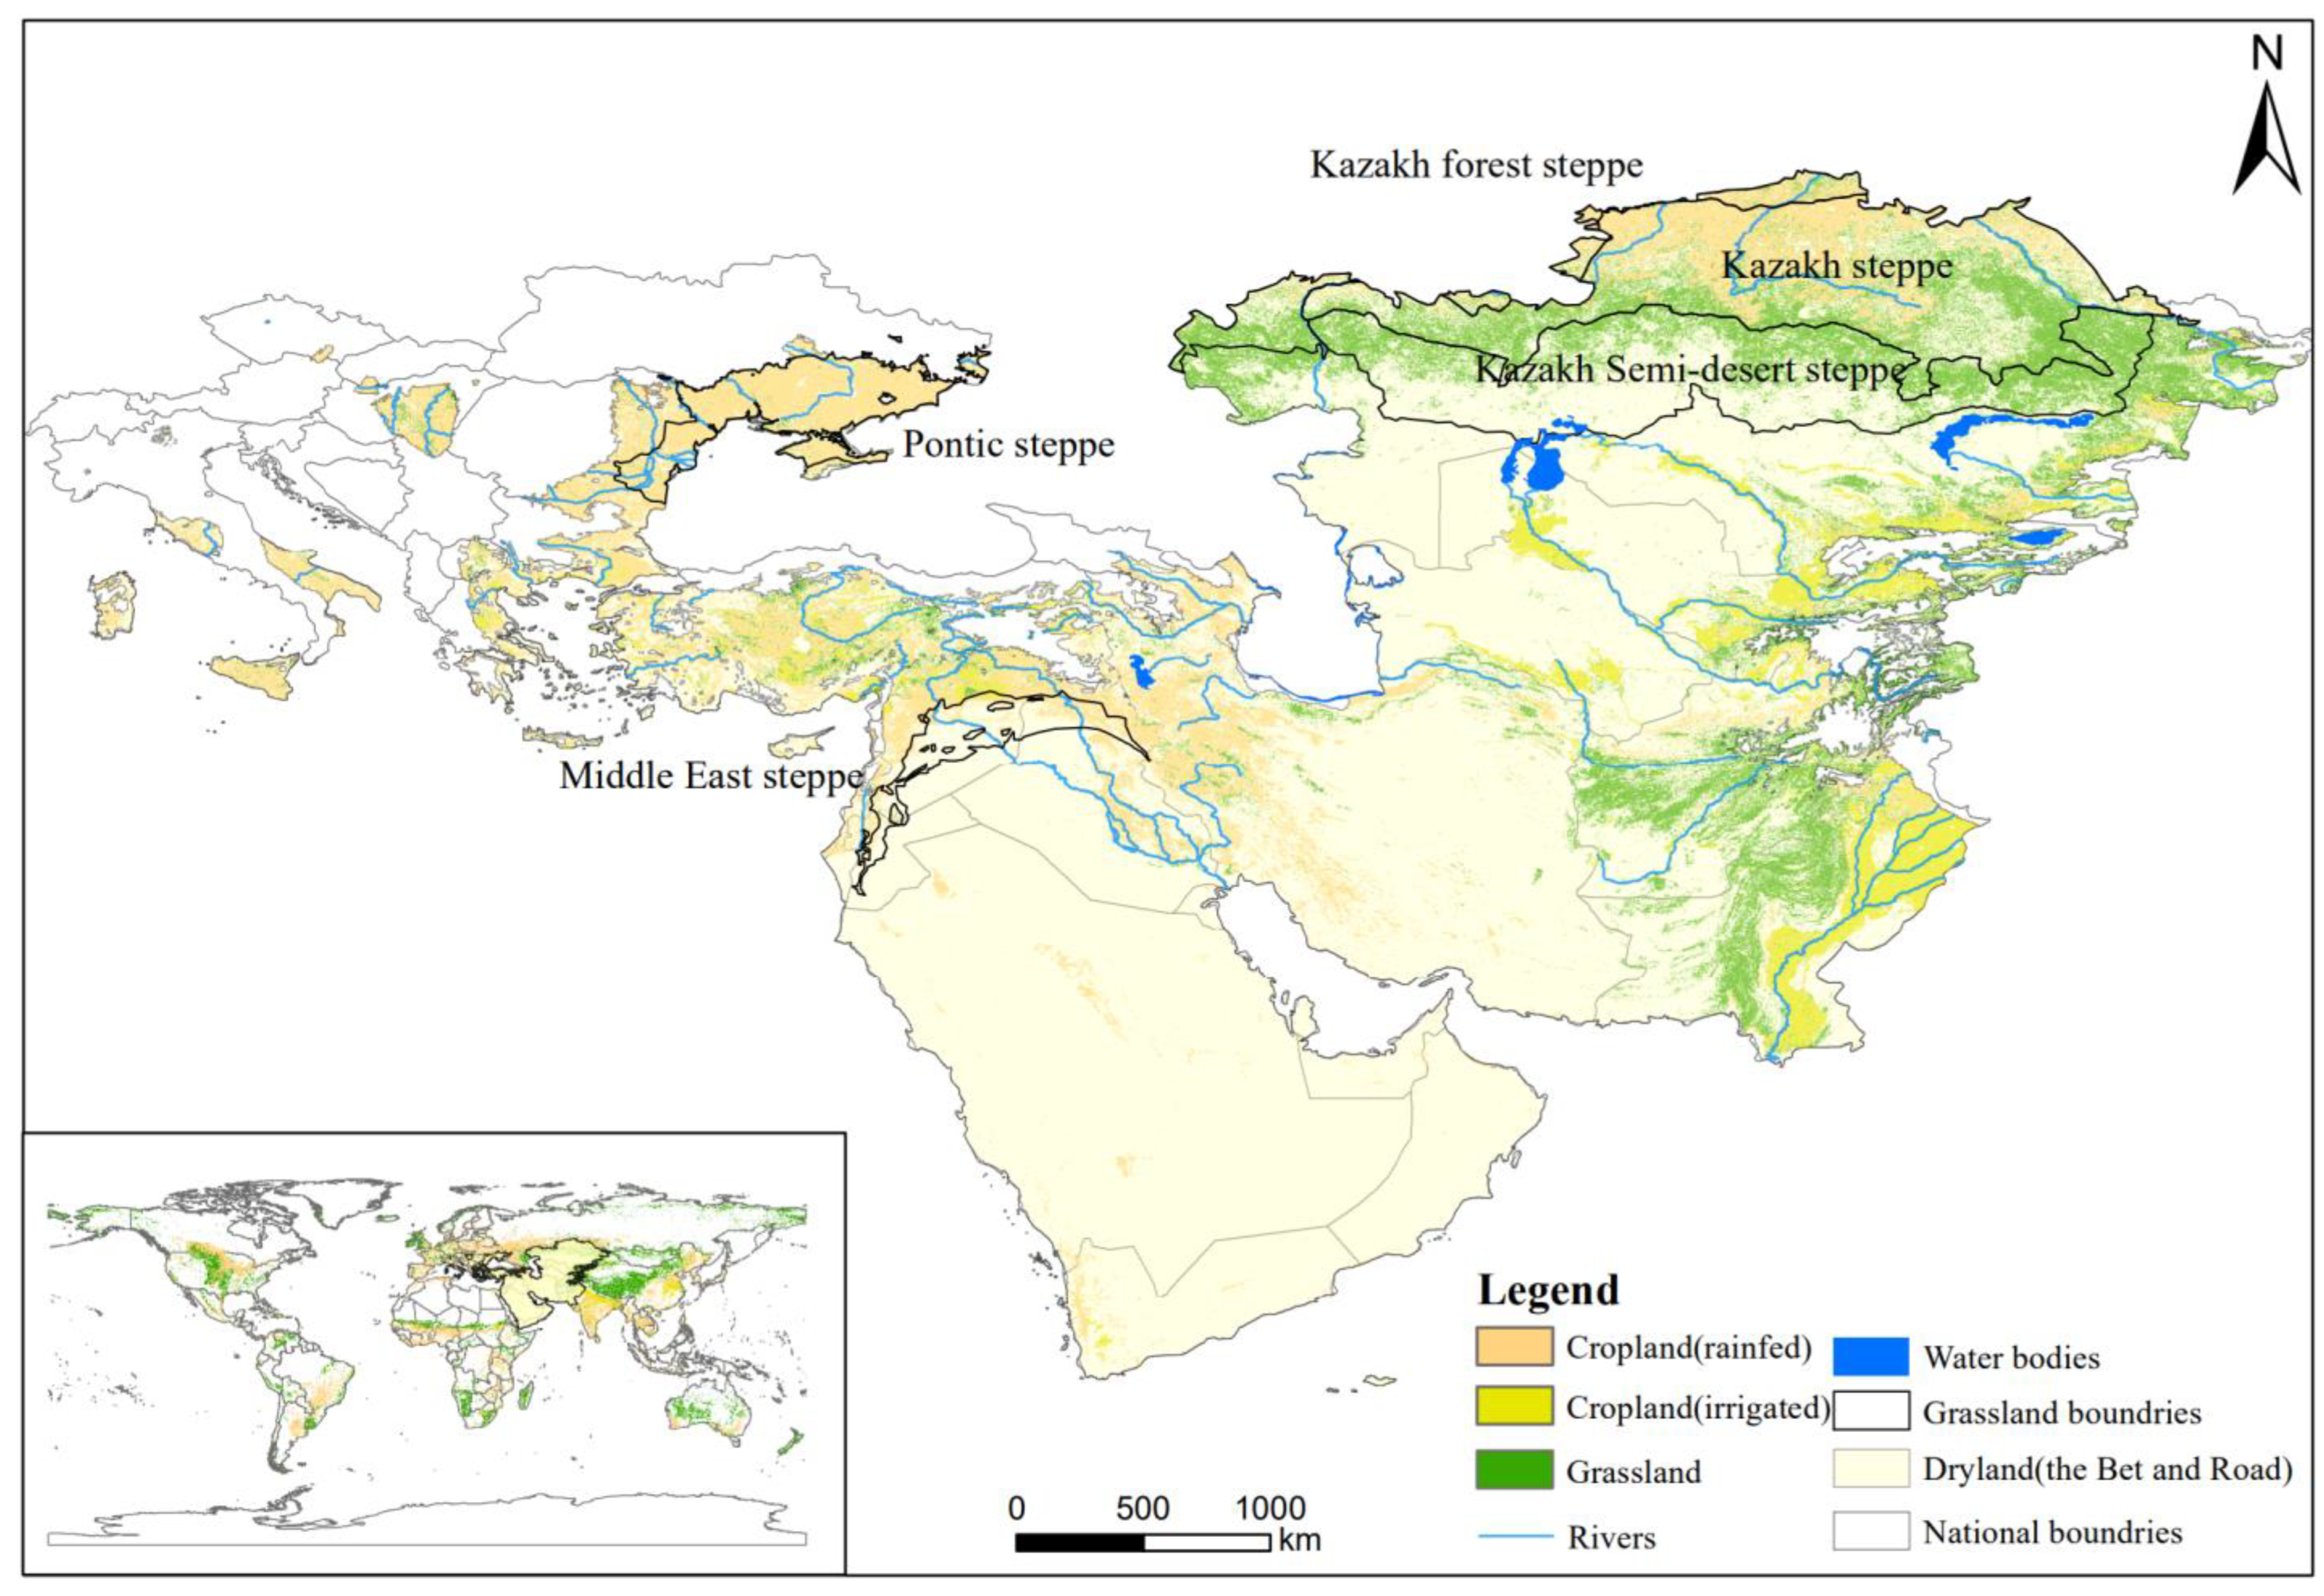
2. Scope of the Study Area

The research region is located in the five typical grasslands (26.7°~83.0° E, 29.0°~55.6° N) in the nations along the strategic middle line of the “Belt and Road” (Figure 1). It encompasses an area of approximately 1.89 × 10 6 square kilometers in Central Asia. These grasslands are the Pontiac grassland (PS), the Middle East grassland (MES), the Kazakh grassland (KS), the Kazakh forest grassland (KFS), and the Kazakh semi-desert steppe (KSD). The entire region belongs to a typical zone of temperate continental climate. The temperature difference between winter and summer is significant, the yearly average temperature is 4~8 °C, there is abundant sunshine, the annual average precipitation is 100~400 mm, and the annual average evaporation is approximately 900~1000 mm [13]. The primary source of water is the melting of several glaciers and snow in Central Asia. It is a vital agricultural and animal husbandry development zone in the surrounding nations.

3. Materials and Methods

3.1. Data Sources

The ISRI-WISE database was used to obtain data on nitrogen content, bulk and soil depth, and soil pH for the various soil layers in the five grasslands studied; temperature data (MAT) were obtained from the MOD11A global temperature grid data in Modis Data, and the MOD11A1 V6 product provides daily surface temperature (LST) and emissivity values in a 1 km grid. The NDVI values were determined using Landsat remote sensing imagery with a spatial resolution of 30 meters. The grassland boundary data comes from Dixon et al. global grassland type distribution map. In 2014, the Journal of Ecological Geography published a paper on this topic.

3.2. Calculation of TN Density and Storage Capacity

We first downloaded raster data for each grassland from the ISRI-WISE database and calculated the nitrogen content of several soil layers at the same spatial location. The average physicochemical parameters of the soil profiles were then determined by weighing the layers according to their depth. The TN density (Density) of individual soil profiles with layers was determined as follows [14]:
D e n s i t y = i = 1 n B i D i C i i = 1 n D i
where Bi (bulk density) indicates the soil capacity data in (g/cm3) at different points; Di (depth) indicates the depth of the soil in (cm); Ci (content) indicates the TN content of the soil in the horizontal layer (%).
Spatial interpolation was used to construct a spatial distribution of TN encompassing the entire grassland using the standard kriging method. The surface was then created as a raster layer with a resolution of 300 m, with each grid square having a density value (kg/m2) and an area value (m2). Then, using the following equation, we determined the TN storage capacity (STN) [15].
STN = i = 1 n D e n s i t y i A r e a i

3.3. Analysis Methods

Using ArcGIS software (version 10.2), we mapped the nitrogen content of five grasslands in the research area and tallied the spatial distribution changes of nitrogen content; concurrently, we calculated the changes of various subtypes of dry areas in the dry area. To determine the relationship between grassland soil nitrogen concentration and meteorological components in the study area, the "factoextra" module of the R programming language is used to conduct a linear model-based dimension reduction analysis. PCA can be used to reduce the dimension of data, but as much of the original data’s statistical information should be preserved as possible. The "ggplot" module is utilized to plot the results of two-dimensional sorting. We use the "rapart" module in the R programming language to rank the significance of environmental variables affecting grassland nitrogen content, and we combine origin (version 2021) with a bar composite chart to illustrate the significance of environmental variables affecting grassland nitrogen content. Under the influence of meteorological circumstances, the SEM model was utilized to investigate the direct or indirect effects of several environmental variables on grassland N content..

4. Results

4.1. Descriptive Statistical Analysis of Soil N Content and Environmental Variables

As demonstrated in Table 1, the nitrogen concentration and environmental variable factors varied significantly between grasslands. The mean N content of MES soil was the lowest at 0.88 g/kg; the mean N content of KFS soil was the greatest at 3.13 g/kg; the coefficient of variation was the highest among the five grasslands (CV = 0.55); and there was significant regional variability in soil N content. KFS soil capacity was the lowest, at 1.15 N/m2, whereas MES soil capacity was the highest, at 1.49 N/m2. The coefficients of variation for the five grassland soil tolerances ranged between 0.02 and 0.07, demonstrating that soil tolerances had low geographical variability. The mean annual MAT differed significantly between the five grasslands, ranging from KFS (1.80) to KS (3.13), KSD (7.03), PS (12.46), and MES (26.64), and the coefficient of variation of MAT ranged from 0.08 to 0.57. The MAP values of the five grasslands also varied significantly, ranging from as low as KSD (208.32) to as high as MES (277.26), KS (309.27), KFS (371.56), and PS (413.01), with a coefficient of variation of 0.08 to 0.52. Srad varied less between grasslands, except for NES, where the mean Srad was higher at 213.31 and the coefficient of variation ranged between 0.02 and 0.06. Except for KFS, where the soil appeared to be somewhat acidic (pH = 6.76), the grassland soils were mildly alkaline. PS had the highest mean NDVI value (0.20), which was more than twice as high as that of KSD, which had the lowest mean NDVI value (0.10).

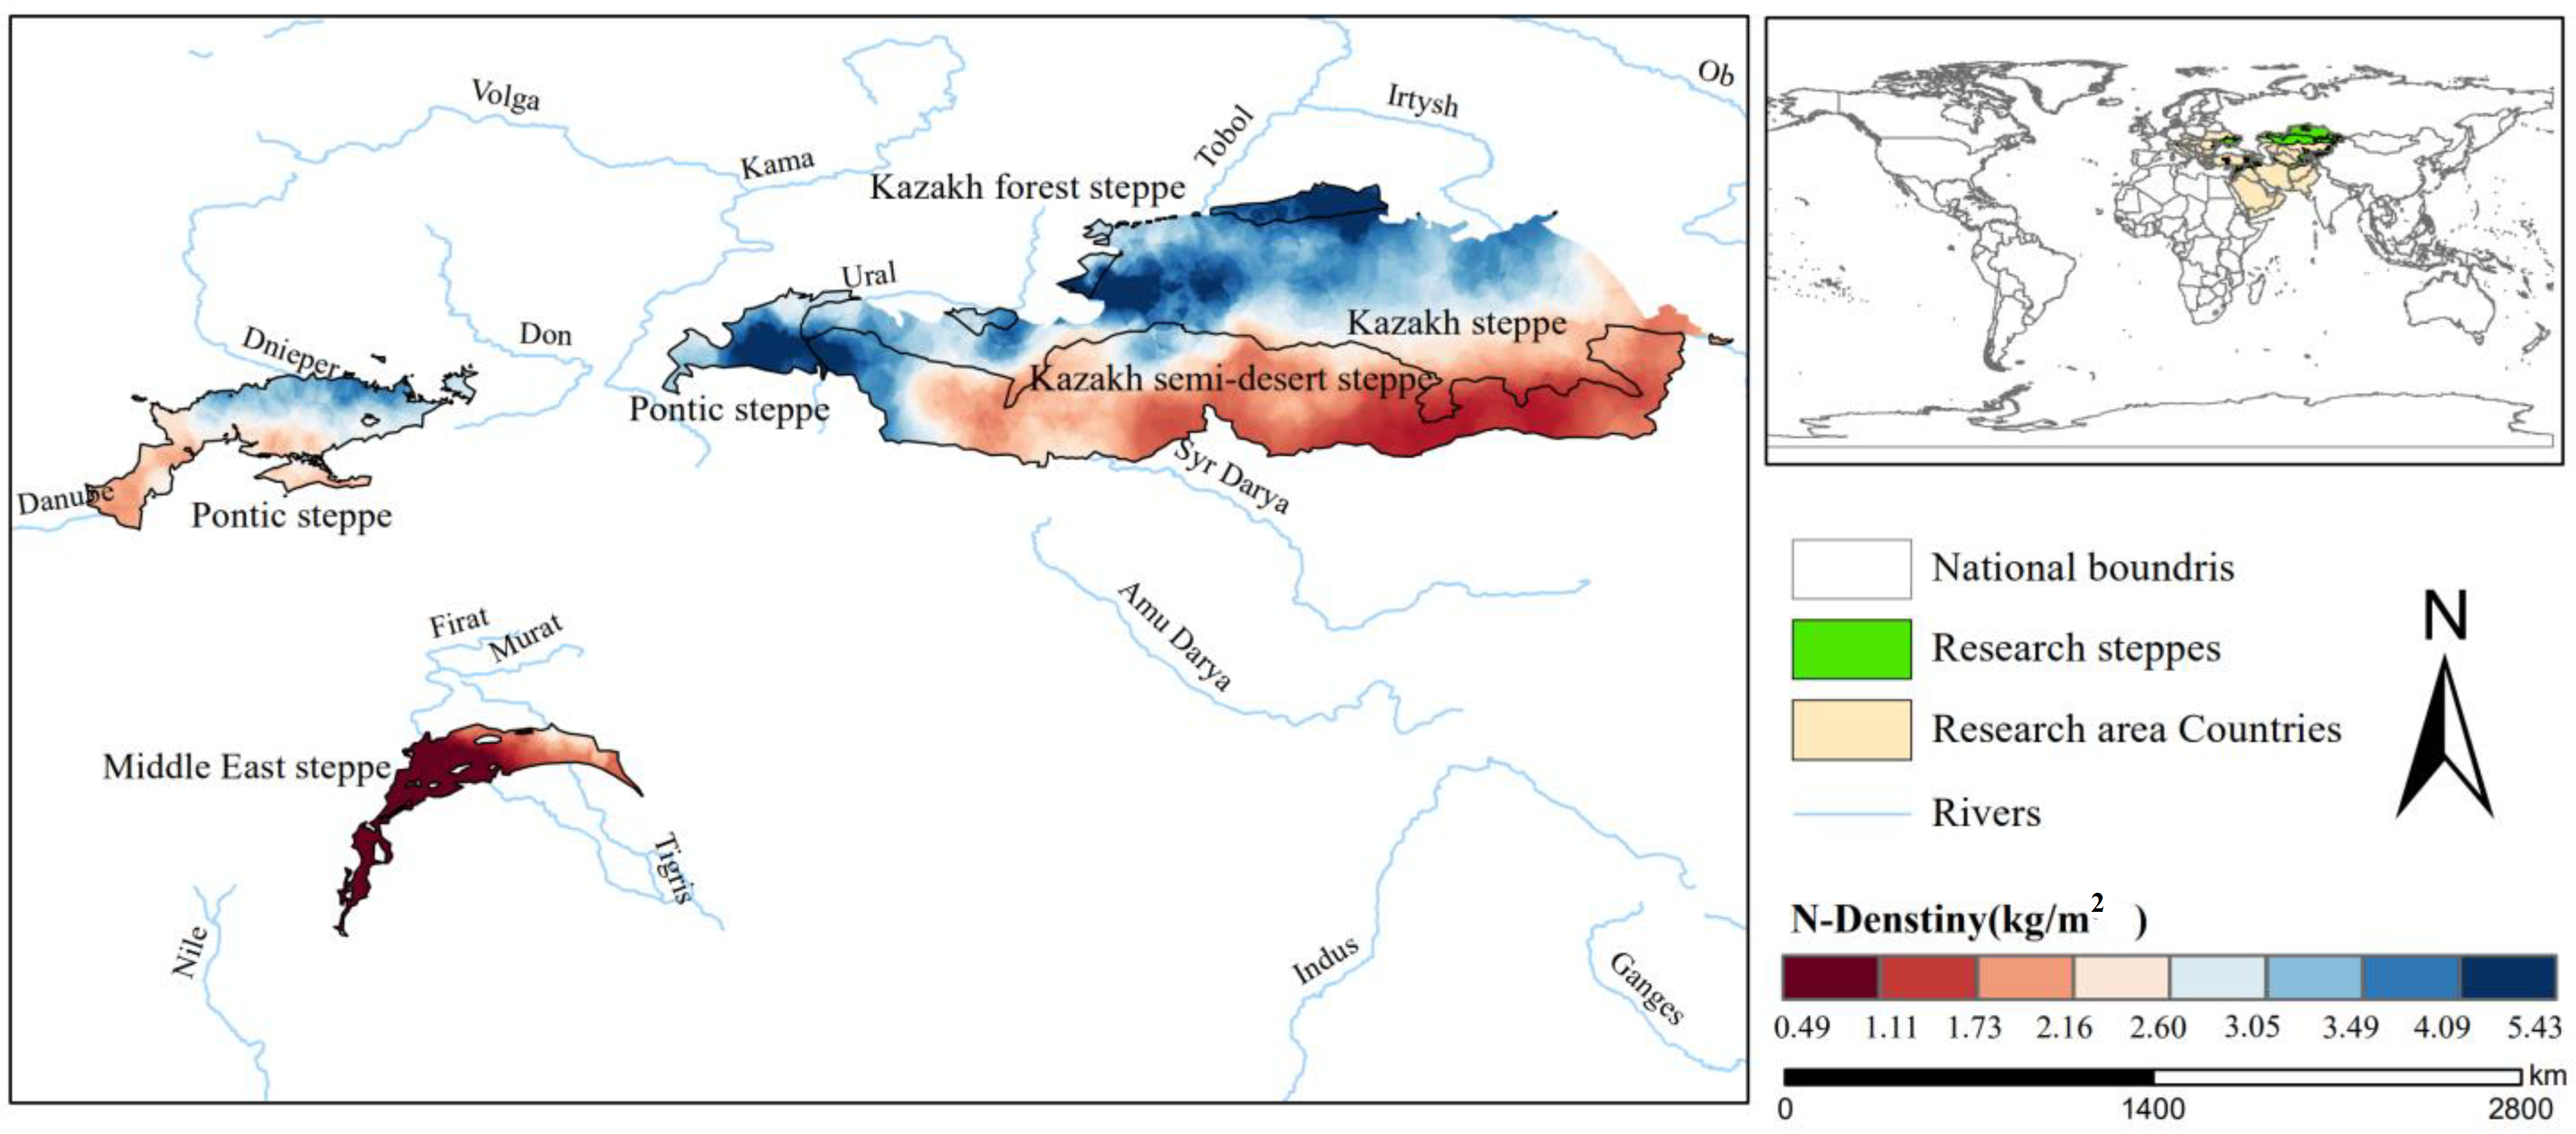
4.2. Spatial Distribution Patterns of Soil N Stocks and N Content (0–100 cm) in Typical Central Asian Grasslands

The nitrogen content, density, and storage of nitrogen in distinct soil layers of five typical Central Asian grasslands are listed in Table 2. The N voxel density of soils (0–100 cm) differed significantly between grasses, ranging from 1.47 to 3.87 kg/m2 on average. The sum of 0–30 cm and 0–50 cm N reserves in five grasses accounted for 36.3 percent and 63.1 percent of total 0–100 cm N reserves, respectively.
As illustrated in Figure 2, the soil nitrogen content of PS was mostly concentrated between 1.38–1.95 g/kg and 2.71–2.39 g/kg, and the overall trend in the spatial distribution of nitrogen content indicated a large rise from west to east. The soil nitrogen content of MES was primarily concentrated between 0.33 and 0.63 g/kg and 1.11 and 1.68 g/kg, and the spatial distribution of N content indicated a progressive increase from west to east. The nitrogen level of KSD soils was primarily between 0.92 and 1.60 g/kg, with certain regions having a higher nitrogen content of 2.57 to 3.57 g/kg. The typical pattern in soil nitrogen content distribution is that it declines steadily from west to east. The regional distribution of nitrogen content in KS soils likewise demonstrated a considerable decline from west to east, with the majority of nitrogen content concentrated in the 2.73–3.43 g/kg and 1.45–2.18 g/kg ranges. The spatial distribution of soil nitrogen in the KFS is distinct from that of the grasslands discussed previously, with a trend toward decreasing and then increasing from west to east, with the primary concentration at 3.32–3.72 g/kg.

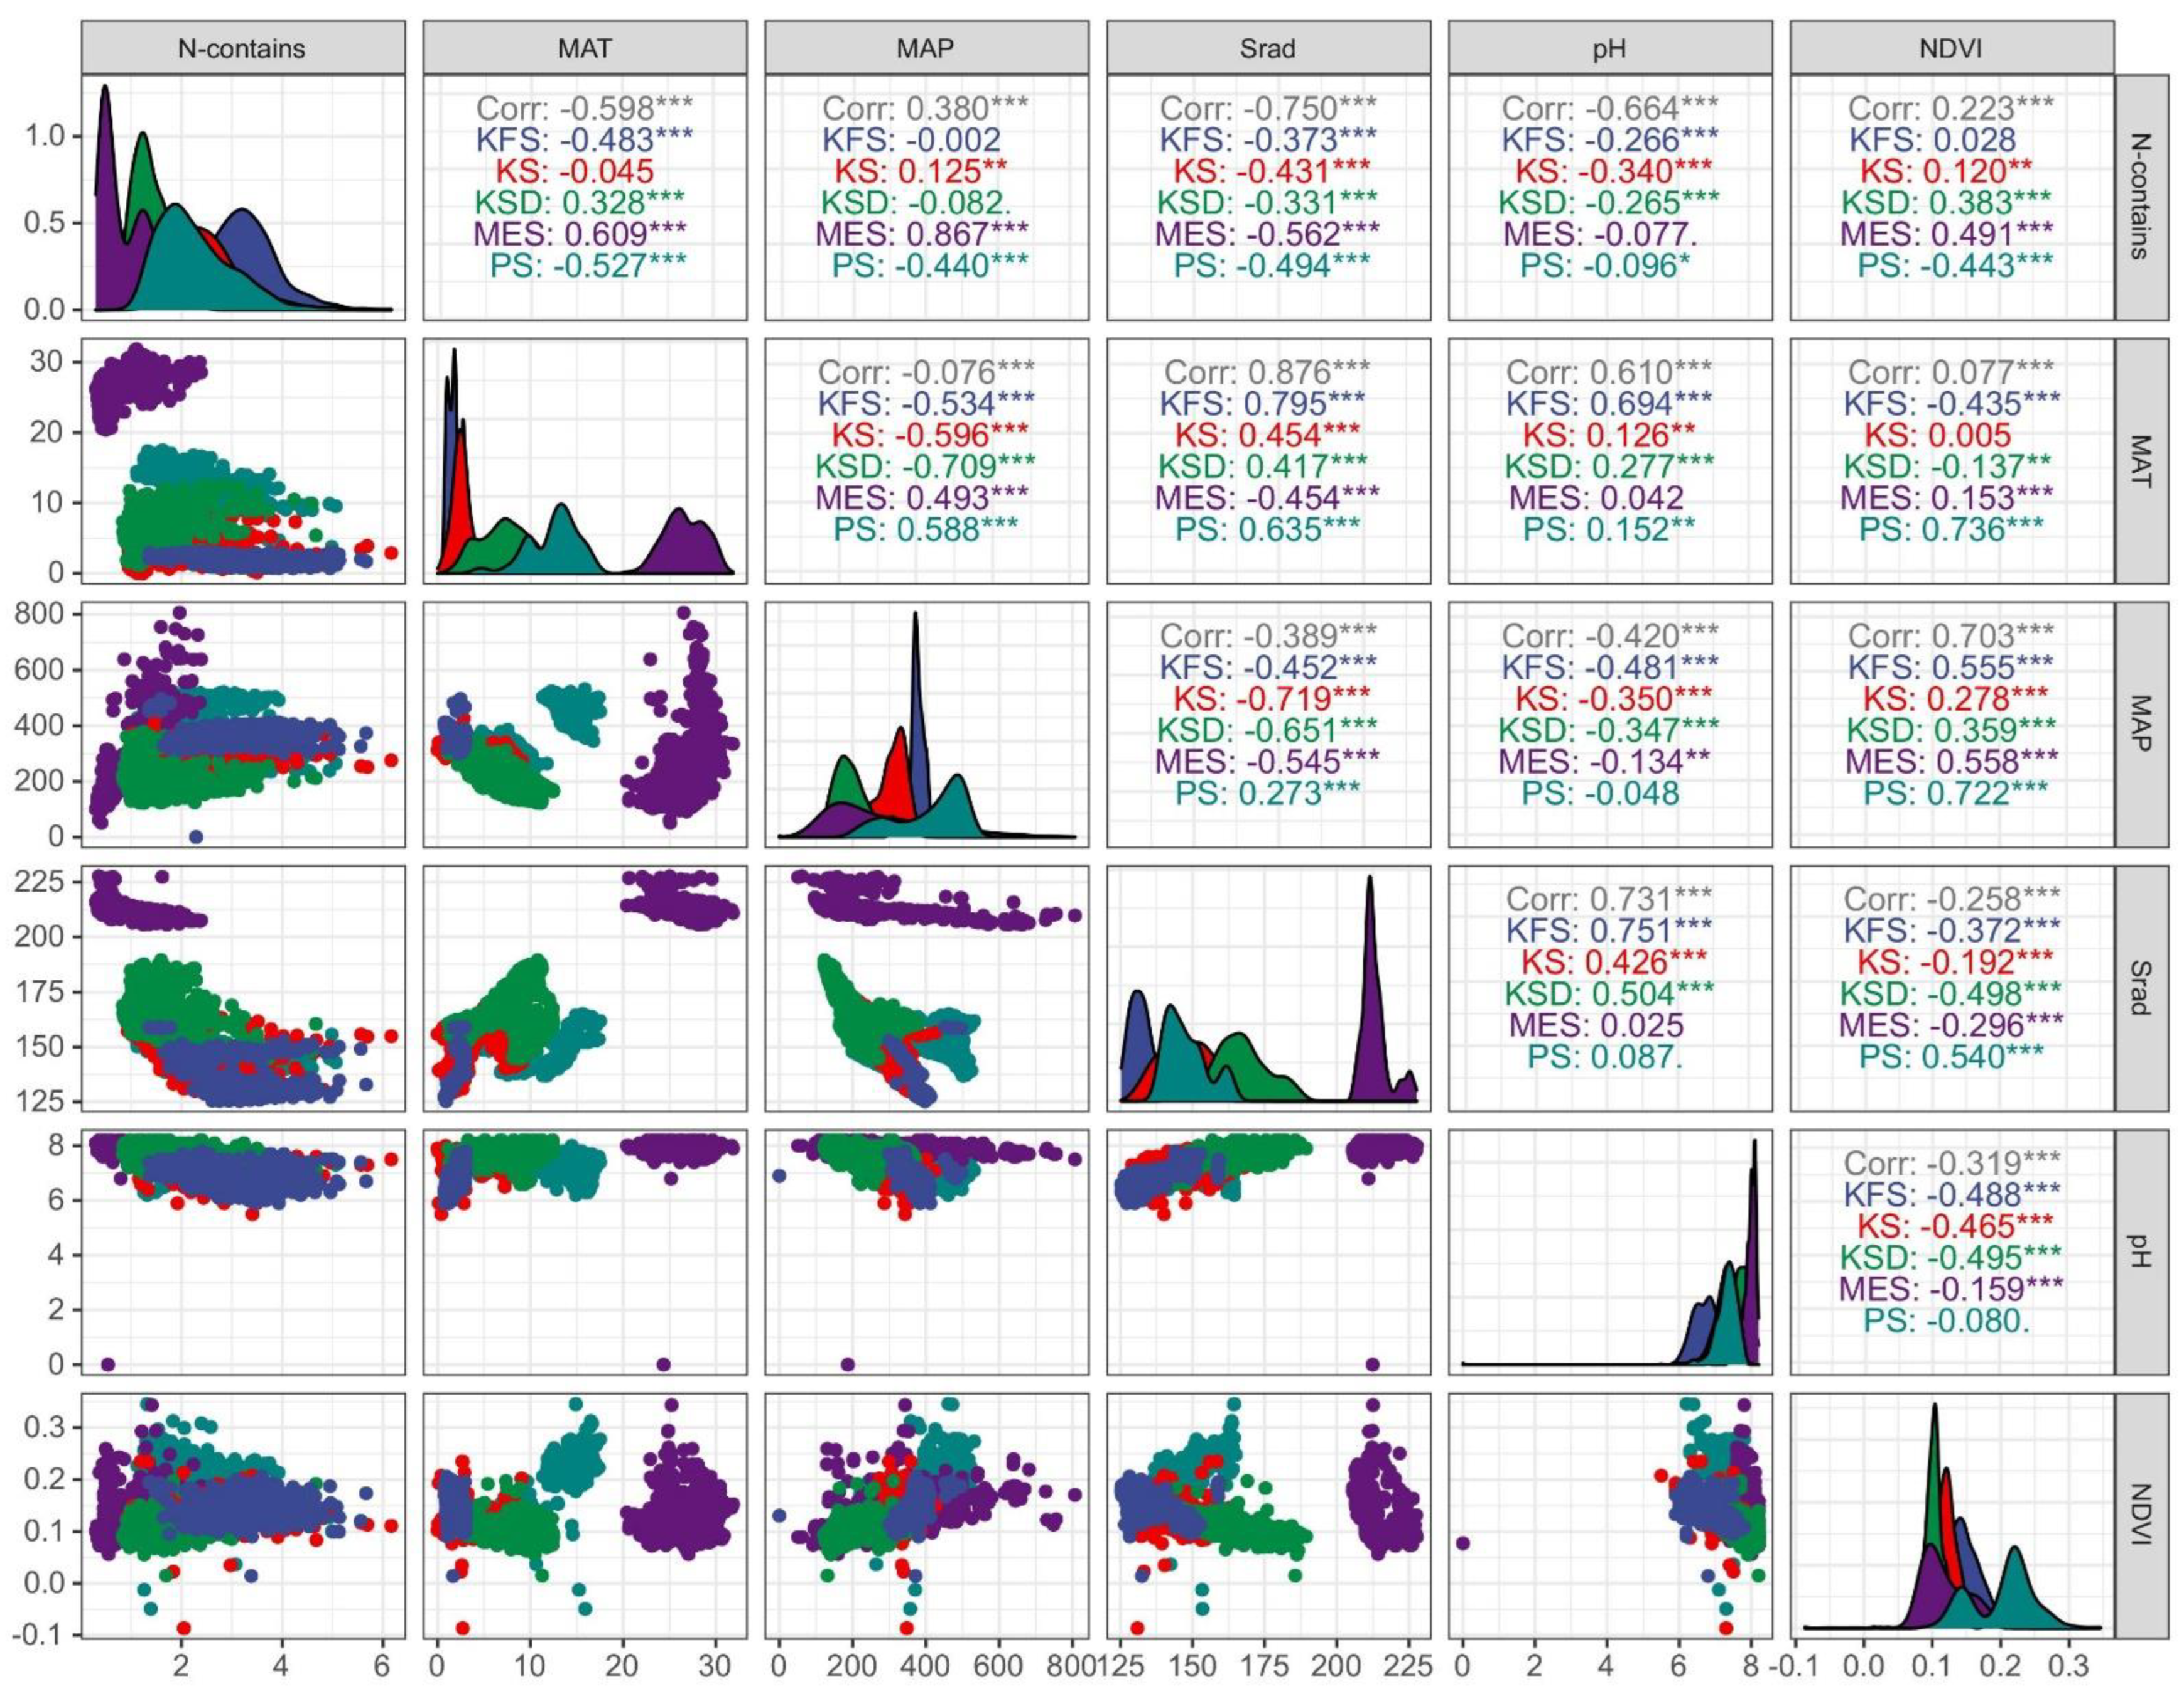
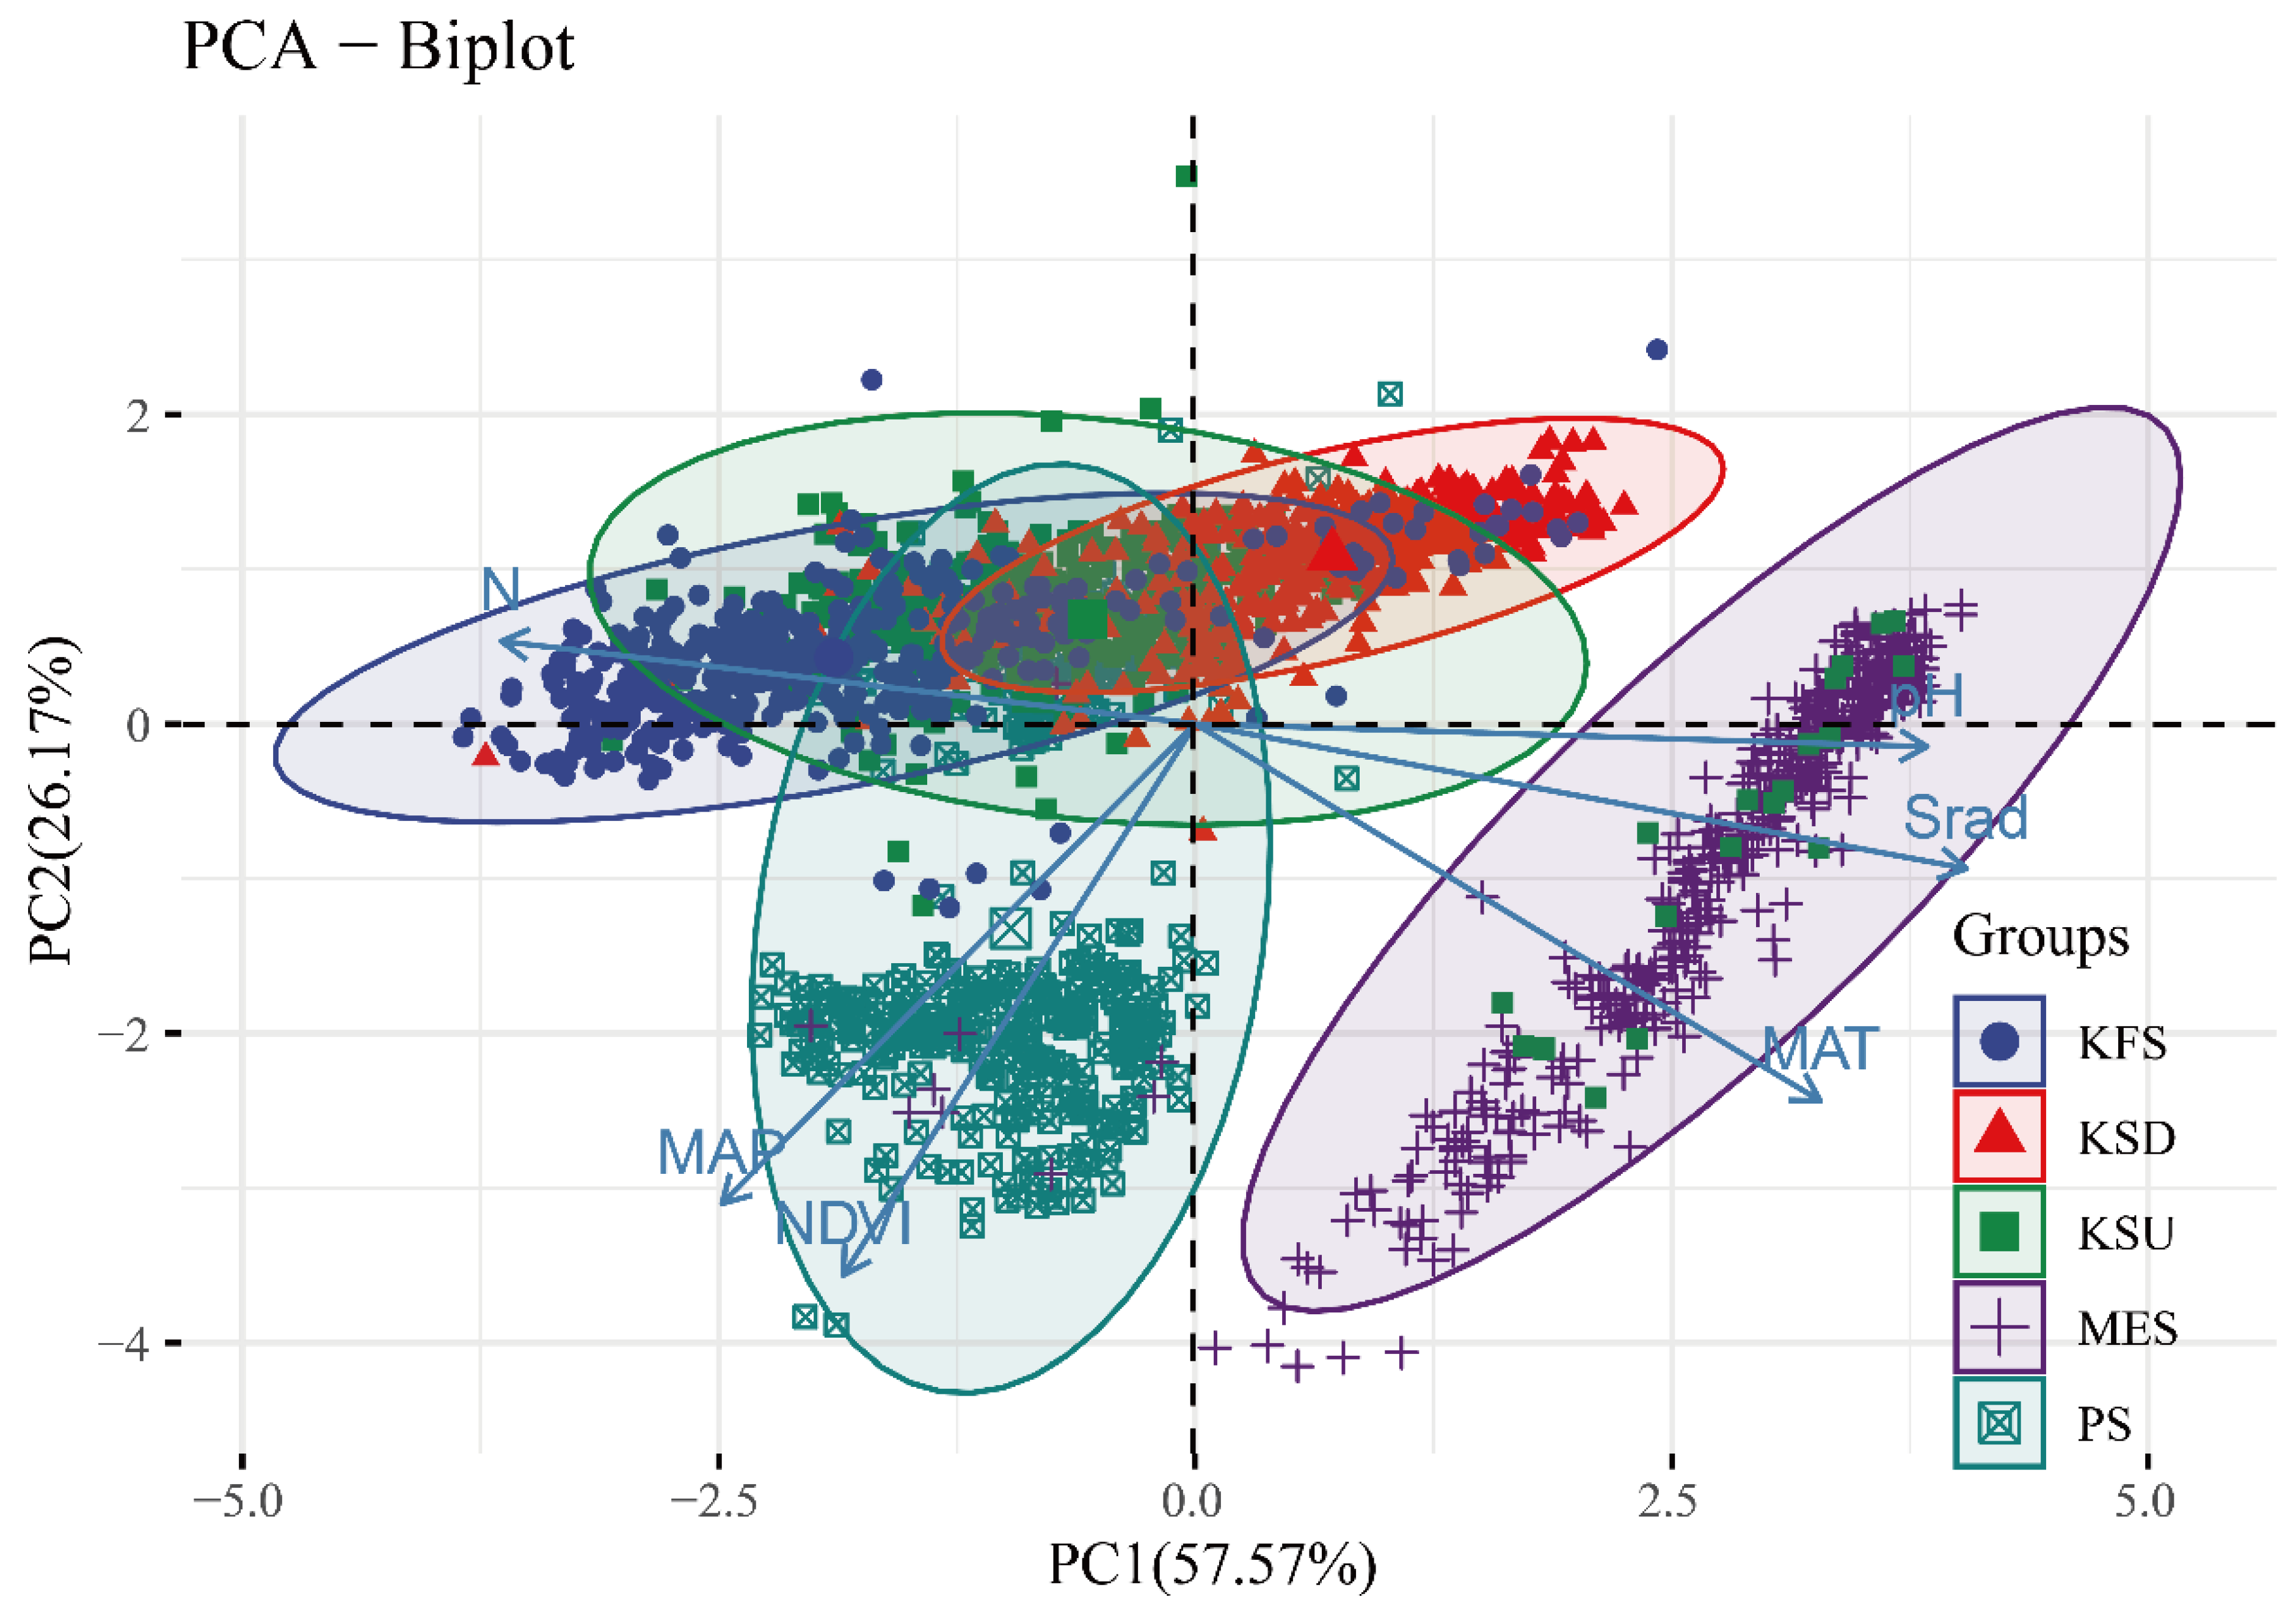
4.3. Soil N Content in Relation to Environmental Factors

Climate, the physical and chemical qualities of the soil, and the degree of vegetation cover on the ground all influence the soil nitrogen content in grassland ecosystems. The many forms of nitrogen in soil are converted by microorganisms and are regulated by climatic factors such as temperature, precipitation, and sunlight, as well as soil pH, which has a significant effect on the soil’s nitrogen concentration. To quantify the effect of these factors on soil nitrogen content, a comparative analysis was conducted between the N content of soil layers ranging from 0 to 100 cm depth and the various influencing factors in the five grasslands in the research area.
The correlation coefficient between PS soil N content and MAP was −0.44 (Figure 3), indicating a highly significant negative correlation (p < 0.01); the correlation coefficient between MES soil N content and MAP was 0.87 (Figure 4), indicating a highly significant positive correlation (p < 0.01); and the correlation coefficient between KS soil N content and MAP was 0.87 (Figure 3), indicating a highly significant positive correlation (p < 0.01). The correlation value was 0.13, indicating a significant positive association (p < 0.006), although soil N content in both KSD and KFS did not correlate significantly with MAP. According to Figure 3, the soil N content in PS and KFS demonstrated a highly significant negative correlation coefficient of −0.527 and −0.438 with a significant negative correlation (p < 0.01), respectively; the soil N content in MES and KSD demonstrated a highly significant positive correlation coefficient of 0.609 and 0.328, with a significant positive correlation (p < 0.01), respectively; and the soil N content in KS demonstrated no significant correlation with the annual mean temperature (Figure 3). There was a strong positive association between the soil nitrogen content in MES, KSD, and NDVI (p < 0.01), with correlation coefficients of 0.491 and 0.383, respectively (Figure 3). There was no association between the nitrogen concentration of the soil in KS and KFS and the NDVI. Figure 3 demonstrates a significant negative correlation between soil nitrogen content and pH in KS, KSD, and KFS, with correlation coefficients of −0.465, −0.498, and −0.488; Figure 3 demonstrates a significant negative correlation between soil nitrogen content and solar radiation in the five grasslands, with correlation coefficients of −0.372, −0.192, −0.498, −0.296, and −0.54, respectively.
To further analyze the factors that influence soil nitrogen content and the ability of different factors to influence soil nitrogen content, we used the principal component analysis method to analyze the relationship between soil nitrogen content and various factors in the five grasslands, and we adopted the decision tree algorithm to rank the importance of various environmental variables associated with soil TN change. Finally, using a structural equation model, the driving factors of soil nitrogen content and their contributions to the changes in soil nitrogen content were quantified.
The PCA results were used to characterize various grassland soil nitrogen and environmental factor variables (Figure 4). PCs 1–6 account for the 100.0 percent range in soil nitrogen content, which may be divided into the following values: 57.57 percent, 26.17 percent, 6.30 percent, 4.79 percent, 4.30 percent, and 0.23 percent, as shown in Table 3. PC1 and PC2 account for the majority of the variation in the variables, accounting for 57.6 percent and 26.2 percent, respectively, for a total of 83.8 percent of the cumulative information that can be explained, suggesting that the two axes are almost vertical and have a high degree of confidence (Table 4).
By analyzing the PCA ranking plots of environmental variables and soil N content (Figure 4), it was discovered that the angles between soil N content and MAP and NDVI were all positive at an acute angle, with the shortest angle between N and MAP, showing the strongest association with both (p < 0.01). Conversely, there was a negative correlation (p < 0.05) between soil N content and pH, Srad, and MAT, with the largest angle between N and Srad (p < 0.01) indicating the strongest correlation; the majority of sample points clustered together in KFS, KSU, and KSD, indicating a high degree of similarity between these three grassland samples.
As illustrated in Figure 5, a decision tree algorithm was used to rank the relative importance of each environmental variable for soil TN variation. The results indicated that MAP had the highest relative importance for soil TN variation in PS, MES, and KFS, while Srad had the highest relative importance for soil TN variation in the Kazakh Steppe and Kazakh Semi-Desert Steppe. In all five grasslands, the relative impact of pH change for soil TN variation was the lowest.
The SEM model study revealed that the model explained 27%, 36%, 15%, 31%, and 8% of the TN content in the five grasslands, respectively (Figure 6). The SEM model of TN in the Pontiac Savannah found that MAP had the highest effect on TN, with a load of 0.38, followed by Srad (−0.31), MAT (−0.17), and NDVI (0.13) in that order, with pH having the weakest effect on TN, with a load of only 0.01. With a load of 0.59, MAP had the largest effect on TN in the SEM model of TN in the Middle East Steppe. MAT (−0.23) was followed by Srad (−0.07) and NDVI (0.07), with pH having the weakest effect on TN, with a load of only −0.01. Srad had the strongest influence on TN in the SEM model of TN on the Kazakh Steppe, with a load of −0.39. This was followed by, in order, MAP (0.28), pH (−0.17), and NDVI (0.13), while MAT had the weakest effect on TN, with a load of only 0.09. Srad had the strongest influence on TN in the SEM model of TN in the Kazakh Semi-Desert Steppe, with a load of −0.48. This was followed by MAT (0.41), NDVI (0.21), and MAP (0.20), in that order, whereas pH had the weakest effect on TN, with a load of only −0.06. In the SEM model of the TN in the Kazakh Forest Steppe, MAP had the largest effect on the TN, with a load of −0.05, followed by Sard (0.04) and MAT (0.02), in that order, while pH and NDVI had the weakest effects on the TN, with loads of only −0.01 or 0.01.

5. Discussion

5.1. Estimates and Percentages of Soil N Stocks in Five Typical Grasslands in Central Asia

The sum of the nitrogen stocks in the first 30 cm and the first 50 cm of the five grasslands accounted for 36.3 percent and 63.1 percent, respectively, of the total nitrogen stocks in the first 100 cm, which is consistent with the global average (36–71 percent and 55–81 percent) [16,17]. The total amount of nitrogen stored in the soils (0–100 cm) of the five grasslands was 7.49 Pg, accounting for approximately 5.7 percent of global nitrogen reserves [18,19]. It was estimated that China’s soil (0–100 cm) N reserves were 7.4 Pg [20,21,22,23], but China’s land area is approximately 9.6 million km2, while the five grasslands cover 1.89 million km2, and it was deduced that the average soil N density of the grasslands is five times that of Chinese soils, indicating that the grassland soil N density and storage are greater. Grassland habitats should receive adequate attention in future studies of the worldwide soil nitrogen cycle.
The soil nitrogen concentration of the five grasslands varied greatly, with MES having the lowest mean value of 0.99 g/kg and KFS having the highest mean value of 3.63 g/kg, which was 3.7 times that of MES. Additionally, the distribution of soil nitrogen content within the same grassland varied significantly, exhibiting considerable spatial variation. The aforementioned phenomenon may be explained by the significant changes in meteorological parameters amongst grasslands or by the spatial patterns of the same grassland. MAP is the most significant and dynamic factor affecting the soil N concentration, with rainfall intensity exerting a particularly large effect [8,21]. Additionally, this work demonstrates, through the use of a decision tree algorithm, that MAP is critical for the dynamics of soil N. As a result, it is vital to strengthen the monitoring of soil nitrogen dynamics in arid and semiarid grasslands in the event of significant future changes in rainfall patterns.

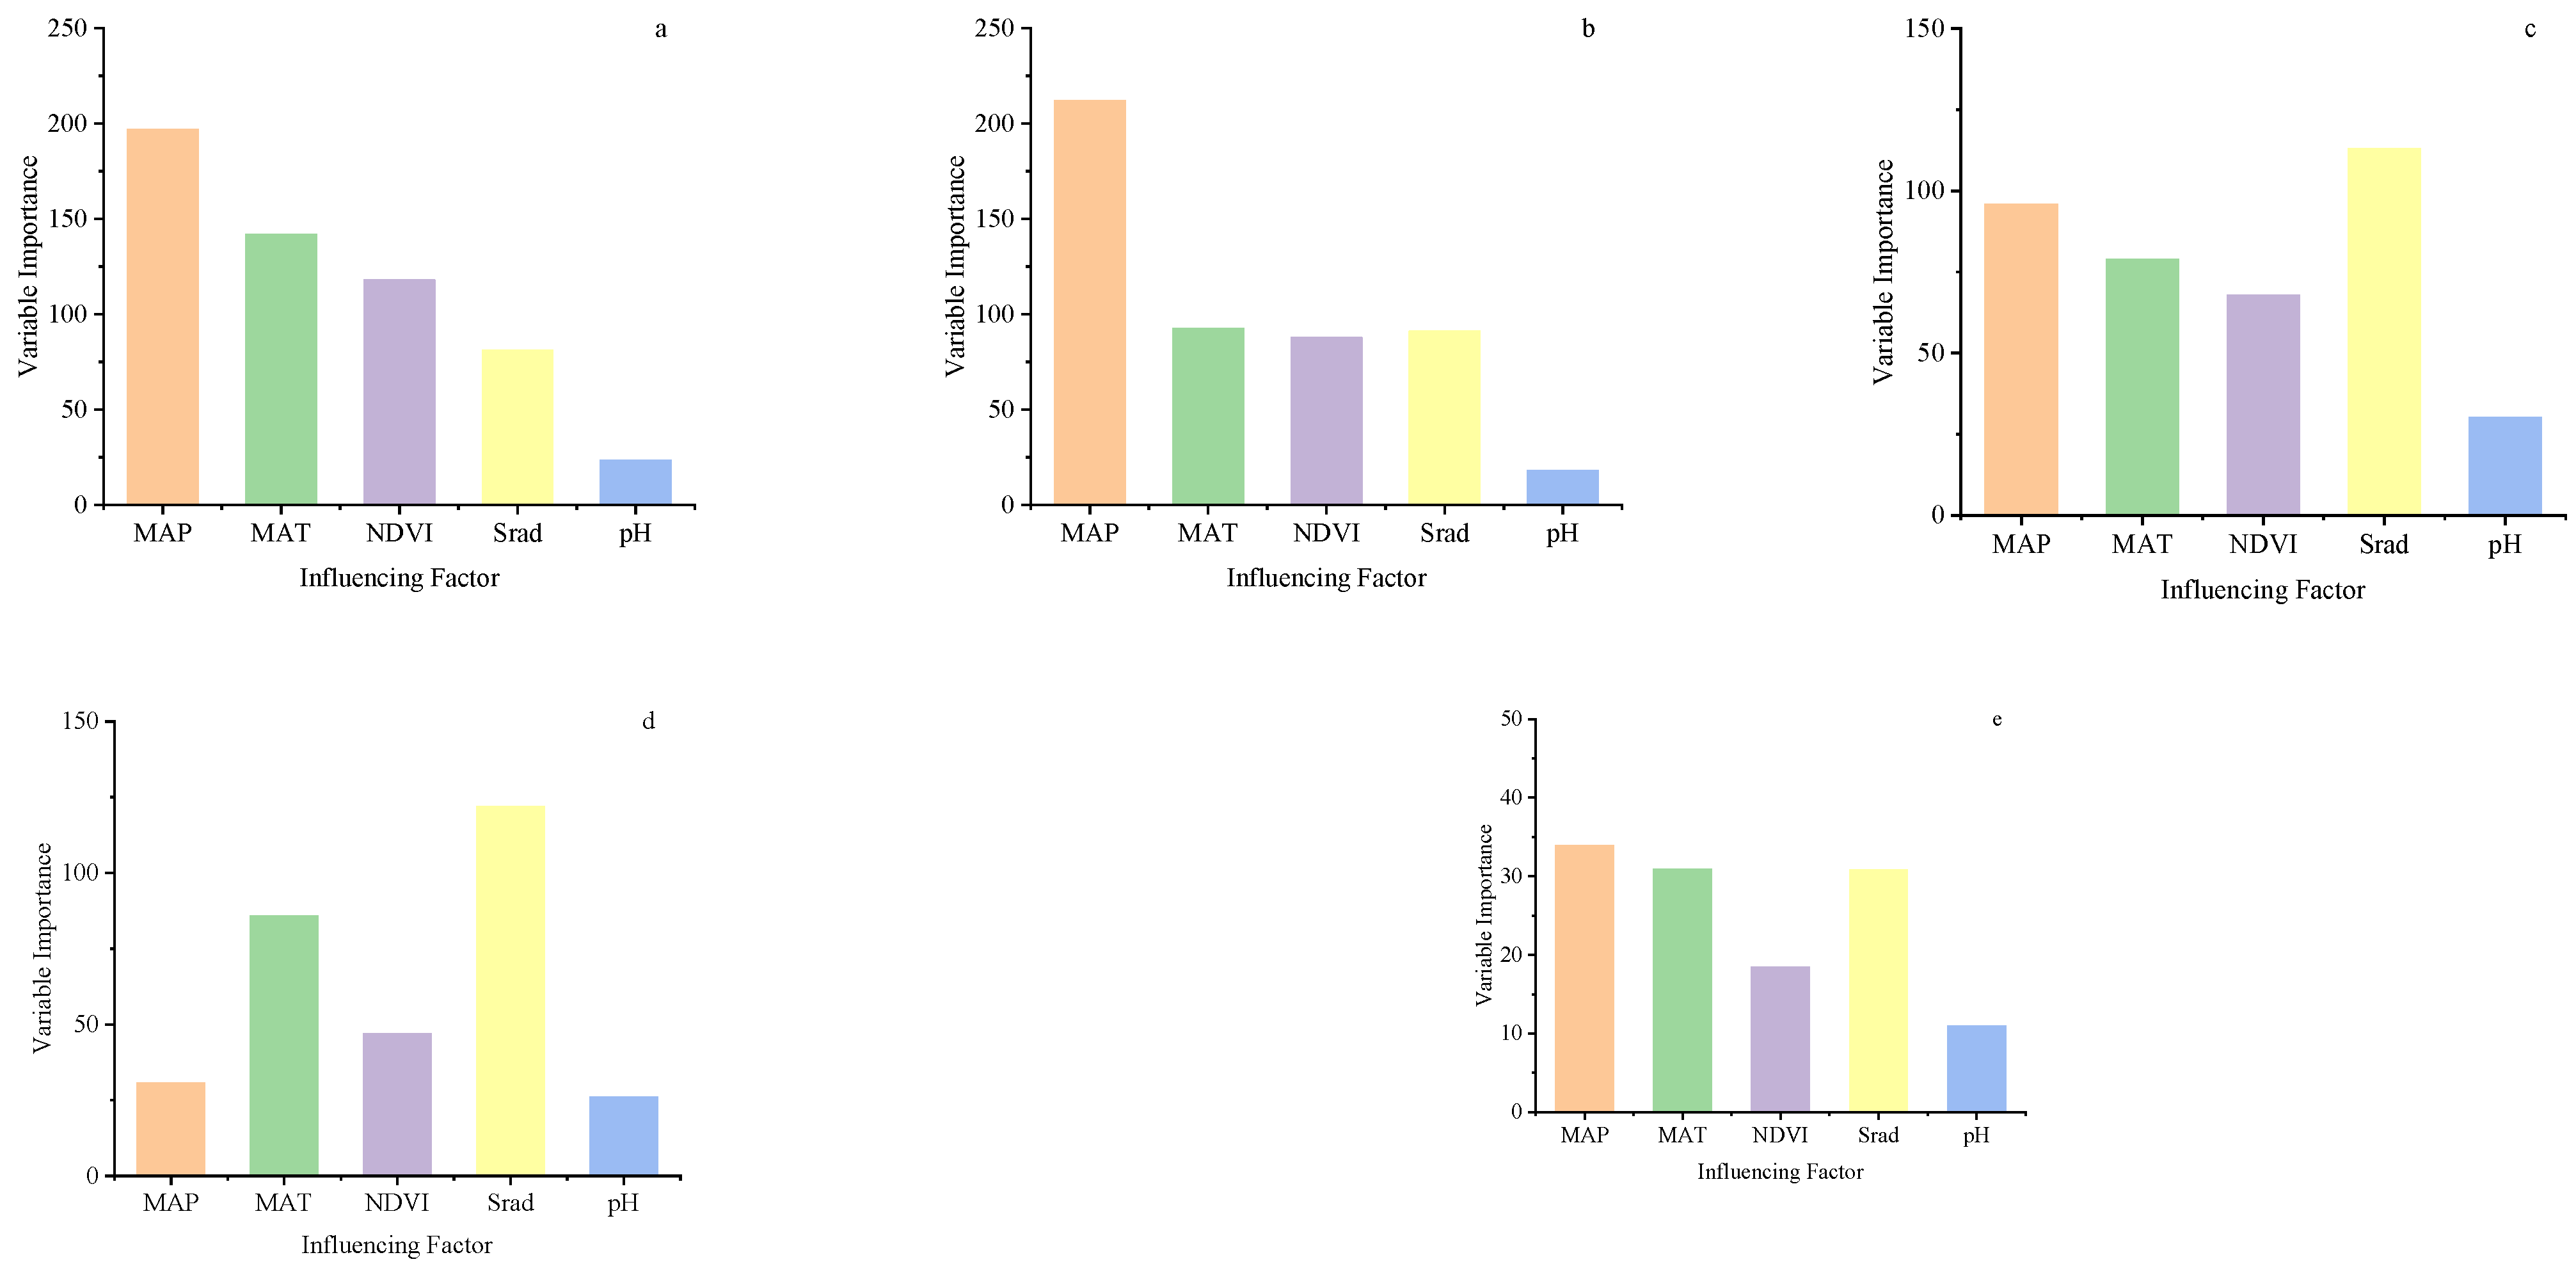
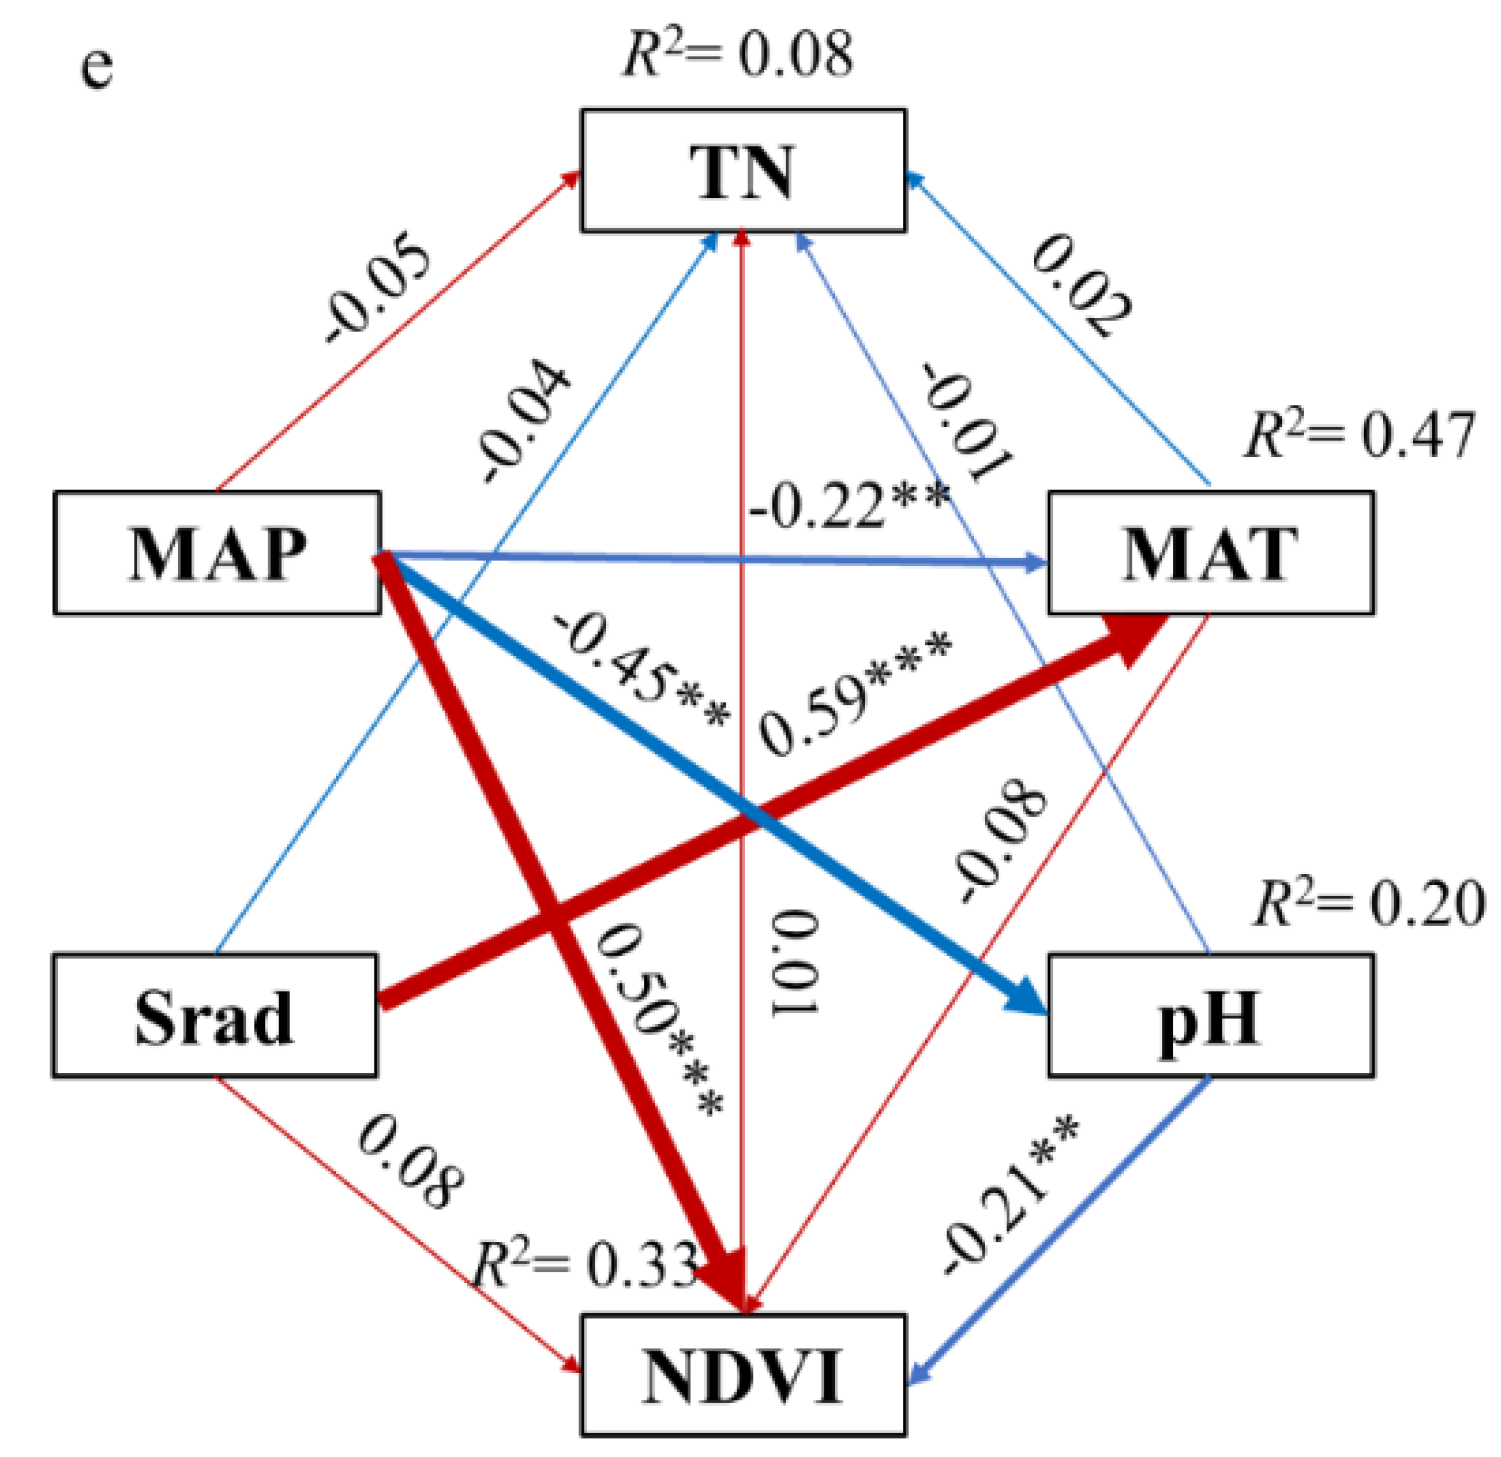
5.2. Drivers of Change in Soil N Content in Five Typical Central Asian Grasslands

It was discovered that the drivers of soil nitrogen content change were not uniform across grasslands. MAP was the primary driver of soil N in PS and MES, and MAP had a considerable beneficial effect on the change in soil N content in these two grasslands. MAP has been identified as a major cause of change in soil N content [22,23], and numerous studies have demonstrated that soil N content is positively correlated with MAP and negatively correlated with MAT on a regional scale [24,25,26,27]. The beneficial effect of MAP on soil nitrogen levels could be attributed to two factors: (1) a higher MAP promotes vegetation production [28] and may also accelerate soil nitrogen accumulation in grasslands; (2) soil moisture is frequently regarded as a critical limiting element in a variety of terrestrial ecosystem processes. It directly affects the nitrogen cycle by its impacts on soil moisture, which is a critical factor in determining the composition of microbial communities and governs soil nitrification and denitrification processes [29,30,31]. Drought has been demonstrated to impair the efficiency of soil nitrogen in global drylands and to deplete the organic nitrogen pool in these ecosystems [32,33]. By modulating soil moisture, MAP can have an effect on soil N stores. The global definition of dry zones includes these five grasslands [34,35]. In the dry zone, increasing MAP improved soil moisture and prevented the ecosystem from depleting its organic N reserves owing to drought, indicating that MAP had a major positive influence on soil N content.
In KS and KSD, the most significant driver of soil N was Srad, which had a highly substantial negative effect on variations in soil N content, for which we suggest the following reasons: Srad had a significant positive influence on MAT in each of the five grasslands, whereas the soil N concentration has been found to be inversely linked with MAT [36]. Within a certain temperature range, an increase in MAT promotes the growth of the AOA community and increases the rate of ammonia oxidation (ammonia oxidation is the rate-limiting step of nitrification and a critical indicator for assessing soil N cycling) [37,38], thereby increasing soil microorganisms’ consumption of soil organic N, avN, such that MAT has a strongly negative correlation with soil N content. As Srad grows, MAT can be greatly enhanced, resulting in a reduction in the soil N concentration.

6. Conclusions

Grassland is one of the most widespread types of vegetation on Earth. The grassland ecosystem accounts for around 30 percent of the world’s land area and 70 percent of the world’s agricultural land, contributing significantly to the wellbeing of over 800 million people. Soil is the biggest source of nitrogen (N) in the terrestrial ecosystem, containing more N than plants. Climate change is a major factor influencing soil ecosystem N reserves. For instance, annual average temperature (MAT) and annual average precipitation (MAP) may have a substantial impact on soil N stores. Understanding these climate control mechanisms would aid in predicting the potential effects of global warming on human activities and minimize uncertainty in the calculation of global soil nitrogen stocks.
This paper uses structural equation modeling (SEM) to examine the response of soil nitrogen content of five typical grasslands in the middle line countries of China’s “Belt and Road” initiative to changes in climate variables, soil pH, and normalized vegetation index, and principal component analysis to determine the spatial variation characteristics and influencing factors of nitrogen storage in various grasslands. Pontiac grassland (PS), Middle East grassland (MES), Kazakh grassland (KS), Kazakh forest grassland (KFS), and Kazakh semi-desert grassland (KFS) are the five grasslands in the research region (KSD). The results indicate the following:
(1) The nitrogen reserves of the five grassland soils (0–100 cm) in the research area were 7.49 Pg, or approximately 5.7 percent of the total world nitrogen reserves. The sum of the five grasslands’ 0–30 cm and 0–50 cm N reserves accounted for 36.3 percent and 63.1 percent, respectively, of the total 0–100 cm N reserves. The density of nitrogen in the soil (0–100 cm) varied significantly between grasslands, ranging from 1.47 to 3.87 kg/m2, with an average of 3.10 kg/m2.
(2) PCA analysis revealed a substantial positive correlation between soil N and MAP (p < 0.01), a negative correlation between soil N and Srad (p < 0.01), and a high degree of similarity between the three grassland samples, KFS, KS, and KSD.
(3) The decision tree algorithm determined that MAP had the most relative importance for changes in soil nitrogen content in PS, MES, and KFS, whereas Srad had the greatest relative importance for changes in soil nitrogen content in KS and KSD. The pH showed the least proportional impact for variations in soil N concentration in all five grasslands.
(4) Different factors influence the change in soil N content across diverse grasslands. The principal positive driving factor of soil N content in KS and KSD is Srad, with loads of −0.39 and −0.44, respectively. The principal negative driving factor of soil N content in PS and MES is MAP, with loads of 0.38 and 0.2, respectively. In the SEM model of soil nitrogen content in KFS, no environmental variables had a significant effect on N content, and the model’s R2 value was 0.08, indicating an average fit.
This study evaluated the regional heterogeneity and driving factors of soil nitrogen storage in five Central Asian grasslands. It can also serve as a resource for enhancing the ecological environment quality of the desert steppe and mitigating the issue of global warming.

Author Contributions

Y.C. and S.Z. made the same contribution to this article in data processing, paper writing, and other projects. Y.C. and S.Z. are the co first authors of this article. T.A., D.S., Z.Z., and Y.W.: formal analysis. All authors have read and agreed to the published version of the manuscript.

Funding

Yongdong Wang, a native of Qitai County, Xinjiang, is now a senior engineer of Xinjiang Institute of Ecology and Geography, Chinese Academy of Sciences. He has presided over a number of scientific research projects. His cellular phone number is +86 139-9915-0554 and this is his email address: [email protected]. With the help of Yongdong Wang, this research has been supported by the strategic priority research project of Chinese Academy of Sciences (No. XDA20030102) and the key technical talent project of Chinese Academy of Sciences (Research on desertification technology along the “Belt and Road“).

Institutional Review Board Statement

The study was conducted in accordance with the Declaration of Helsinki, and approved by the Institutional Review Board (or Ethics Committee) of NAME OF INSTITUTE.

Data Availability Statement

Conflicts of Interest

All authors declare that this research was completed without any commercial relationships and with no conflict of interest. The authors declare no conflict of interest.

References

  1. Gruber, N.; Galloway, J.N. An Earth-system perspective of the global nitrogen cycle. Nature 2008, 451, 293–296. [Google Scholar] [CrossRef]
  2. Yang, Y.H.; Ma, W.H.; Mohammat, A.; Fang, J.-Y. Storage, Patterns and Controls of Soil Nitrogen in China. Pedosphere 2007, 17, 776–785. [Google Scholar] [CrossRef]
  3. Zeng, Q.; Lal, R.; Chen, Y.; Quanchao, Z. Soil, Leaf and Root Ecological Stoichiometry of Caragana korshinskii on the Loess Plateau of China in Relation to Plantation Age. PLoS ONE 2017, 12, e0168890. [Google Scholar] [CrossRef] [PubMed] [Green Version]
  4. Luo, Y.Q.; Su, B.; Currie, W.S.; Dukes, J.S.; Finzi, A.; Hartwig, U.; Hungate, B.; McMurtrie, R.E.; Oren, R.; Parton, W.J.; et al. Progressive nitrogen limitation of ecosystem responses to rising atmospheric carbon dioxide. Bioscience 2004, 54, 731–739. [Google Scholar] [CrossRef] [Green Version]
  5. Shi, X.M.; Li, X.G.; Long, R.J.; Singh, B.P.; Li, L.T.; Li, F.M. Dynamics of soil organic carbon and nitrogen associated with phys-ically separate fractions in a grassland-cultivation sequence in the Qinghai-Tibet plateau. Biol. Fertil. Soils 2010, 46, 103–112. [Google Scholar] [CrossRef]
  6. in’t Zandt, D.; Brink, A.; de Kroon, H.; Visser, E.J.W. Plant-soil feedback is shut down when nutrients come to town. Plant Soil 2019, 439, 541–551. [Google Scholar] [CrossRef] [Green Version]
  7. Schimel, D.S. Terrestrial ecosystems and the carbon cycle. Glob. Chang. Biol. 1995, 1, 77–91. [Google Scholar] [CrossRef]
  8. Pinder, R.W.; Bettez, N.D.; Bonan, G.B.; Greaver, T.L.; Wieder, W.R.; Schlesinger, W.H.; Davidson, E.A. Impacts of human al-teration of the nitrogen cycle in the US on radiative forcing. Biogeochemistry 2013, 114, 25–40. [Google Scholar] [CrossRef] [Green Version]
  9. Harpole, W.S.; Potts, D.L.; Suding, K.N. Ecosystem responses to water and nitrogen amendment in a California grassland. Glob. Chang. Biol. 2007, 13, 2341–2348. [Google Scholar] [CrossRef]
  10. Hodgson, J. Grazing Management; John Willey and Sons Inc.: New York, NY, USA, 1990. [Google Scholar]
  11. Batjes, N.H. Total carbon and nitrogen in the soils of the world. Eur. J. Soil Sci. 2014, 65, 10–21. [Google Scholar] [CrossRef]
  12. Tian, H.Q.; Wang, S.Q.; Liu, J.; Pan, S.; Chen, H.; Zhang, C.; Shi, X. Patterns of soil nitrogen storage in China. Glob. Biogeochem. Cycles 2006, 20. [Google Scholar] [CrossRef]
  13. Suo, Y.X.; Wang, Z.X.; Liu, C.; Yu, B. Relationship between NDVI and precipitation and temperature in middle Asia during 1982–2002. Resour. Sci. 2009, 31, 1422–1429. [Google Scholar]
  14. Lal, R. Soil Carbon Sequestration Impacts on Global Climate Change and Food Security. Science 2004, 304, 1623–1627. [Google Scholar] [CrossRef] [Green Version]
  15. Nasholm, T.; Ekblad, A.; Nordin, A.; Giesler, R.; Högberg, M.; Högberg, P. Boreal forest plants take up organic nitrogen. Nature 1998, 392, 914–916. [Google Scholar] [CrossRef]
  16. Liu, S.; Qin, T.; Dong, B.; Shi, X.; Lv, Z.; Zhang, G. The Influence of Climate, Soil Properties and Vegetation on Soil Nitrogen in Sloping Farmland. Sustainability 2021, 13, 1480. [Google Scholar] [CrossRef]
  17. Huang, F.; Wang, P.; Zhang, J. Grasslands changes in the Northern Songnen Plain, China during 1954–2000. Env. Monit Assess 2012, 184, 2161–2175. [Google Scholar] [CrossRef] [PubMed]
  18. Breuer, L.; Huisman, J.; Keller, T.; Frede, H.-G. Impact of a conversion from cropland to grassland on C and N storage and related soil properties: Analysis of a 60-year chronosequence. Geoderma 2006, 133, 6–18. [Google Scholar] [CrossRef]
  19. Freschet, G.T.; Violle, C.; Bourget, M.Y.; Scherer-Lorenzen, M.; Fort, F. Allocation, morphology, physiology, architecture: The multiple facets of plant above- and below- ground responses to resource stress. New Phytol. 2018, 219, 1338–1352. [Google Scholar] [CrossRef]
  20. Nie, X.Q.; Xiong, F.; Yang, L.C.; Li, C.; Zhou, G. Soil Nitrogen Storage, Distribution, and Associated Controlling Factors in the Northeast Tibetan Plateau Shrublands. Forests 2017, 8, 416. [Google Scholar] [CrossRef] [Green Version]
  21. Zhang, C.; Wang, Y.; Jia, X.; Shao, M. Estimates and determinants of soil organic carbon and total nitrogen stocks up to 5 m depth across a long transect on the Loess Plateau of China. J. Soils Sediments 2021, 21, 748–765. [Google Scholar] [CrossRef]
  22. Cheng, Y.; Wang, J.; Mary, B.; Zhang, J.-B.; Cai, Z.-C.; Chang, S.X. Soil pH has contrasting effects on gross and net nitrogen mineralizations in adjacent forest and grassland soils in central Alberta, Canada. Soil Biol. Biochem. 2013, 57, 848–857. [Google Scholar] [CrossRef]
  23. Brunson, M.W.; Steel, B.S. Sources of variation inattitudes and beliefs about federal grassland management. J. Rangel. Manag. 1996, 49, 69–75. [Google Scholar] [CrossRef] [Green Version]
  24. Jobbágy, E.G.; Jackson, R.B. The vertical distribution of soil organic carbon and its relation to climate and vegetation. Ecol. Appl. 2000, 10, 423–436. [Google Scholar] [CrossRef]
  25. Miller, A.J.; Amundson, R.; Burke, I.; Yonker, C. The effect of climate and cultivation on soil organic C and N. Biodegradation 2004, 67, 57–72. [Google Scholar] [CrossRef]
  26. Lv, H.; Zhan, T.; Ma, J. Effect of lime and calcium-magnesium phosphate fertilizers on baking tobacco production and soil acidity regulation. Ecol. Environ. Sci. 2004, 13, 379–381. [Google Scholar]
  27. Delgado-Baquerizo, M.; Maestre, F.T.; Gallardo, A. Decoupling of nutrient cycles as a function of aridity in globa2l dryland soils. Nature 2013, 502, 672–676. [Google Scholar] [CrossRef]
  28. Wu, H.; Guo, Z.; Peng, C. Distribution and storage of soil organic carbon in China. Glob. Biogeochem. Cycles 2003, 17. [Google Scholar] [CrossRef]
  29. Chen, Y.; Xu, Z.; Hu, H.; Hu, Y.; Hao, Z.; Jiang, Y.; Chen, B. Responses of ammonia-oxidizing bacteria and archaea to nitrogen fertilization and precipitation increment in a typical temperate steppe in Inner Mongolia. Appl. Soil Ecol. 2013, 68, 36–45. [Google Scholar] [CrossRef]
  30. Wieder, W.; Bonan, G.B.; Allison, S.D. Global soil carbon projections are improved by modelling microbial processes. Nat. Clim. Chang. 2013, 3, 909–912. [Google Scholar] [CrossRef]
  31. Zhang, Y. Research advance on soil erosion in loess hilly-gully region. J. Soil Water Conserv. 2001, 15, 121–128. [Google Scholar]
  32. Wu, J.; Liu, X.; Xiong, Z. Soil characteristics and their relationship with tobacco quality in Fujian’s tobacco areas. Acta Tab. Sin. 1996, 6, 49–53. [Google Scholar]
  33. Plaza, C.; Zaccone, C.; Sawicka, K.; Méndez, A.M.; Tarquis, A.; Gascó, G.; Heuvelink, G.B.M.; Schuur, E.A.G.; Maestre, F.T. Soil resources and element stocks in drylands to face global issues. Sci. Rep. 2018, 8, 1–8. [Google Scholar] [CrossRef]
  34. Adhikari, K.; Owens, P.R.; Libohova, Z.; Miller, D.M.; Wills, S.A.; Nemecek, J. Assessing soil organic carbon stock of Wisconsin, USA andits fate under future land use and climate change. Sci. Total Environ. 2009, 667, 833–845. [Google Scholar] [CrossRef] [PubMed]
  35. Fierer, N.; Carney, K.M.; Horner-Devine, M.C.; Megonigal, J.P. The biogeography of ammonia-oxidizing bacterial communities in soil. Micro. Ecol. 2009, 58, 435–445. [Google Scholar] [CrossRef]
  36. Mcgill, W.B. The physiology and biochemistry of soil organisms. In Soil Microbiology, Ecology and Biochemistry, 3rd ed.; Academic Press: Cambridge, MA, USA, 2007; pp. 231–256. [Google Scholar]
  37. Schlesinger, W.H. Biogeochemistry: An Analysis of Global Change. Sea 1991, 254–293. [Google Scholar] [CrossRef]
  38. Kang, L.; Han, X.; Zhang, Z.; Sun, O. Grassland ecosystems in China: Review of current knowledge and research advancement. Philos. Trans. R. Soc. B Biol. Sci. 2007, 362, 997–1008. [Google Scholar] [CrossRef] [PubMed]
Figure 1. Grassland distribution along the Central Route’s “Belt and Road” countries. The map is based on the standard map No.GS(2021)5453 downloaded from the map technology review center of Ministry of natural resources, the standard map is not modified.
Diversity 14 00459 g001
Figure 2. Pattern of spatial distribution of nitrogen concentration in five typical Central Asian steppe soils (0–100 cm). The map is based on the standard map No.GS(2021)5453 downloaded from the map technology review center of Ministry of natural resources, the standard map is not modified.
Diversity 14 00459 g002
Figure 3. The distribution of soil nitrogen content and the values associated with each contributing factor in various grasslands. Note: PS: Pontic Steppe; MES: Middle East Steppe; KS: Kazakh Steppe; KSD: Kazakh Semi-Desert Steppe; KFS: Kazakh Forest Steppe; MAT: mean annual temperature; MAP: mean annual precipitation; Srad: solar radiation; pH: soil pH; NDVI: Normalized Difference Vegetation Index.***: Extremely significant correlation; **:significant correlation.
Diversity 14 00459 g003
Figure 4. Principal component analysis (PCA) of soil nitrogen and environmental variables for various grassland types. Note: PS: Pontic Steppe; MES: Middle East Steppe; KS: Kazakh Steppe; KSD: Kazakh Semi-Desert Steppe; KFS: Kazakh Forest Steppe; MAT: mean annual temperature; MAP: mean annual precipitation; Srad: solar radiation; pH: soil pH; NDVI: Normalized Difference Vegetation Index.
Diversity 14 00459 g004
Figure 5. Different environmental variables’ relative role in determining the distribution of soil TN content. Note: PS: Pontic Steppe; MES: Middle East Steppe; KS: Kazakh Steppe; KSD: Kazakh Semi-Desert Steppe; KFS: Kazakh Forest Steppe; MAT: mean annual temperature; MAP: mean annual precipitation; Srad: solar radiation; pH: soil pH; NDVI: Normalized Difference Vegetation Index. (a): Influence of different climatic conditions on soil TN fluctuation in Pontic Steppe; (b): Influence of different climatic conditions on soil TN fluctuation in Middle East steppe; (c): Influence of different climatic conditions on soil TN fluctuation in Kazakh Steppe; (d): Influence of different climatic conditions on soil TN fluctuation in Kazakh Semi-Desert steppe; (e): Influence of different climatic conditions on soil TN fluctuation in Kazakh Forest steppe.
Diversity 14 00459 g005
Figure 6. The results of an examination of the direct and indirect effects of various environmental variables on soil nitrogen content. Note: TN: total nitrogen content; MAT: mean annual temperature; MAP: mean annual precipitation; Srad: solar radiation; pH: soil pH; NDVI: Normalized Difference Vegetation Index; (a), PS:TN (χ2 = 0.127, P = 0.881, GFI = 0.998, AGFI = 0.977, CFI = 1.000, RMSEA = 0.021); (b), MES:TN (χ2 = 0.015, P = 0.904, GFI = 1.000; AGFI = 0.977, CFI = 1.000, RMSEA = 0.013); (c), KS:TN(χ2 = 0.127, P = 0.881, GFI = 0.999; AGFI = 0.978, CFI = 1.000, RMSEA=0.000); (d), KSD(χ2 = 0.152, P = 0.137, GFI = 0.901, AGFI = 0.921, CFI = 1.000, RMSEA = 0.000); (e), KFS(χ2 = 0.127, P = 0.881, GFI = 0.998; AGFI = 0.977, CFI = 1.000, RMSEA = 0.000), C. The red line denotes a beneficial effect and the blue line denotes a detrimental effect. The various widths of the arrows correspond to the load factor in-dicated by the arrow. rmsea is the root mean square of the approximation error. ***, p < 0.001; **, p < 0.01; *, p < 0.05.
Diversity 14 00459 g006aDiversity 14 00459 g006b
Table 1. Descriptive statistics on the nitrogen concentration and environmental variables in five representative Middle Eastern grasslands.
Grassland NameParameterN (g/kg)Bulk (N/m3)MAT (°C)MAP (mm)Srad (W/m2)pHNDVI
PSMean2.28 ± 0.741.29 ± 0.0712.46 ± 2.72413.01 ± 90.78148.04 ± 7.327.32 ± 0.290.20 ± 0.05
Max5.061.5017.51531.38165.058.000.35
Min1.111.033.68198.86136.976.20−0.05
CV0.330.050.220.220.050.040.24
MESMean0.88 ± 0.481.49 ± 0.0326.64 ± 2.20277.26 ± 145.09213.31 ± 4.647.96 ± 0.390.13 ± 0.04
Max2.391.6131.85806.29227.688.200.34
Min0.301.3620.4051.19205.540.000.06
CV0.550.020.080.520.020.050.33
KSMean2.26 ± 0.801.25 ± 0.063.13 ± 1.77309.27 ± 37.81147.93 ± 9.327.26 ± 0.330.12 ± 0.02
Max6.161.429.07425.81172.448.000.24
Min0.910.96−0.02202.29128.395.50−0.09
CV0.350.050.570.120.060.050.19
KSDMean1.57 ± 0.621.35 ± 0.067.03 ± 2.60208.32 ± 58.48166.94 ± 9.307.72 ± 0.260.10 ± 0.02
Max4.671.5012.46378.71189.388.200.20
Min0.840.951.14122.14144.476.600.01
CV0.390.040.370.280.060.030.17
KFSMean3.13 ± 0.721.15 ± 0.081.80 ± 0.68371.56 ± 28.15135.64 ± 7.856.76 ± 0.380.15 ± 0.02
Max5.661.343.07496.52159.157.800.21
Min1.360.720.71298.90125.285.900.01
CV0.230.070.380.080.060.060.16
Note: PS: Pontic Steppe; MES: Middle East Steppe; KS: Kazakh Steppe; KSD: Kazakh Semi-Desert Steppe; KFS: Kazakh Forest Steppe; MAT: mean annual temperature; MAP: mean annual precipitation; Srad: solar radiation; pH: soil pH; NDVI: Normalized Difference Vegetation Index.
Table 2. Nitrogen content, nitrogen density, and nitrogen storage in different soil layers (0–30, 0–50, and 0–100 cm) in a typical Central Asian steppe.
Contents (g/kg)Density (kg/m3)Storage (Pg)
Grassland NameSquare (km2)0–300–500–1000–300–500–1000–300–500–100
PS2873843.763.373.024.814.293.870.480.631.11
MES1326001.101.020.991.641.511.470.060.120.19
KS7369323.303.002.774.093.723.430.901.642.53
KSD6885502.322.301.943.112.812.600.641.161.79
KFS448844.143.853.634.744.394.150.641.181.87
Note: PS: Pontic Steppe; MES: Middle East Steppe; KS: Kazakh Steppe; KSD: Kazakh Semi-Desert Steppe; KFS: Kazakh Forest Steppe.
Table 3. Decomposition of total variance for principal component analysis.
ComponentEigenvaluePV(%)CPV(%)
11.8657.5757.57
21.2526.1783.74
30.626.3090.04
40.544.7994.83
50.514.3099.13
60.230.86100
Note: PV and CPV are, respectively, the cumulative values of the variance explained by each component as a percentage of the total variance and the variance explained by each component as a percentage of the total variance.
Table 4. Basic characteristics of the first 2 axes of PCA sorting.
ParameterPC1PC2
Eigenvalue0.5760.262
Cumulative(%)57.5783.75
N0.930.45
MAT1.59−1.99
MAP1.270.45
Srad0.27−2.29
pH0.680.07
NDVI0.92−1.7
Note: MAT: mean annual temperature; MAP: mean annual precipitation; Srad: solar radiation; pH: soil pH; NDVI: Normalized Difference Vegetation Index.
Publisher’s Note: MDPI stays neutral with regard to jurisdictional claims in published maps and institutional affiliations.

