Article

Effects of Clothianidin Pesticide Application on the Strength of Honey Bee Colonies and Stress-Related Genes in the Vicinity of Rice Fields in the Republic of Korea

1
Department of Agricultural Biology, National Institute of Agricultural Science, Wanju 55365, Republic of Korea
2
Jeollanamdo Agricultural Research and Extension Services, Naju 57214, Republic of Korea
3
Institute of Agricultural Research for Development (IRAD), Buea PMB 25, Cameroon
*
Author to whom correspondence should be addressed.
These authors contributed equally to this work.
Diversity 2023, 15(12), 1217; https://doi.org/10.3390/d15121217
Submission received: 30 October 2023 / Revised: 12 December 2023 / Accepted: 13 December 2023 / Published: 14 December 2023
(This article belongs to the Special Issue Aspects of Honey Bee Colonies Losses)

Abstract

:
The honey bee, a crucial organism that provides ecological and economic value to humans, is currently facing threats from various environmental factors including pesticides. Numerous studies have been conducted to demonstrate the risks associated with neonicotinoid pesticides, but research on their occurrence in actual field conditions has not been identified. Therefore, in this study, we observed changes in honey bee (Apis mellifera) colonies located near rice cultivation areas as they progressed beyond the rice pesticide application period. Furthermore, we collected honey bees exposed to the clothianidin and analyzed their stress-related gene expression. The results showed that the foraging behavior of honey bee colonies located near rice cultivation areas did not exhibit significant differences between the treatment sites (Cheongyang and Gimje) and the control site (Wanju) during the experimental period. However, it was observed that the expression levels of stress-related genes in honey bees collected from the treatment group were significantly higher than those in the control. Most of the stress-related genes were associated with detoxification processes in response to pesticides. As a result, pesticide treatment in proximity to rice cultivation areas did not cause direct damage to honey bees but had an indirect impact, suggesting the potential for ongoing chronic damage.

1. Introduction

Animal pollinators, including honey bees (Apis mellifera Linnaeus), play a crucial role in the pollination of the majority of angiosperms in the natural ecosystem [1], and they exert a significant influence on the productivity of crops essential for human food [2,3,4]. Honey bees are the most economically valuable managed pollinators not only for their ecological significance but also within the industrial insect market [5,6,7]. However, recent issues, such as colony collapse disorder (CCD) and unexplained disappearances of honey bees during overwintering, have highlighted challenges in identifying their underlying causes [8,9,10]. Researchers suggest that these issues are caused by a combination of various factors that are collectively influencing the phenomenon [11,12,13]. Factors threatening honey bee colonies include abnormal climate, pesticides, and pests. Abnormal climate is a significant factor in the reduction in honey bee populations, causing issues such as bees not returning to the hive due to sudden temperature changes during foraging activities [14,15]. Especially, pesticides could be a primary factor leading to the collapse of honey bee colonies. Pesticides used in the cultivation of crops near apiaries can have adverse effects on honey bees [16,17,18].
Neonicotinoid pesticides are systemic insecticides that exist in absorbed form within plants, potentially being transmitted to honey bees through nectar and pollen [19]. Neonicotinoid-based pesticides have a high potential for long-term persistence, leading to a likelihood of causing chronic toxicity to honey bees [20]. For these reasons, in order to protect natural pollinators, including wild pollinators [21,22], neonicotinoid-based pesticides have been banned for use in Europe. However, in the domestic context, neonicotinoid-based pesticides are still being used extensively across a wide range of agricultural sectors. Among neonicotinoid-based pesticides, clothianidin is primarily applied as seed treatment [23] and, in the domestic context, it is used in rice cultivation through drone aerial spraying [24,25]. The risks of clothianidin to honey bees have already been demonstrated in numerous studies. According to Prisco et al. [26] it is known to affect the immune function of honey bee and promote the development of viral pathogens (diseases). Furthermore, it may also reduce the number of worker bees returning to the colony after foraging due to loss of memory [27]. Thus, there is a substantial risk of clothianidin pesticide exposure for domestic beekeepers around croplands, including rice cultivation. Therefore, there is ample need for research on exposure control and alternative pesticides around croplands within the vicinity of apiaries.
While there has been extensive laboratory-based research to establish the risks posed by clothianidin to honey bees, knowledge on its impact on honey bees associated with field conditions is scanty. Therefore, in this study, we investigated the influence of neonicotinoid pesticide application in rice cultivation areas on the strength of nearby honey bee colonies and their stress-related genes. To accomplish this, we monitored the strength of colonies located near rice cultivation areas and collected worker bees on days of neonicotinoid pesticide treatment and one month later for the analysis of stress-related gene expression levels. We investigated the exposure of rice flowers to pesticides and the effects on honey bees that forage on rice fields.

2. Materials and Methods

2.1. Study Site

The test species used in the experiment were honey bees (A. mellifera) reared at the experimental apiary of the National Institute of Agricultural Sciences in Wanju, Jeollabuk-do, Republic of Korea. The experiment was conducted in three different locations, including the control group in Wanju, Jeollabuk-do (35°49′41.1″ N 127°02′47.6″ E), and the treatment groups in Gimje, Jeollabuk-do (35°46′17.8″ N 126°58′59.6″ E) and Cheongyang, Chungcheongnam-do (36°23′27.0″ N 126°46′11.7″ E). All experimental locations were situated in proximity to rice (Oryza sativa) cultivation areas, with a total of 18 honey bee colonies, six in each study site. The treatment site is a region where rice cultivation is traditionally practiced. Pesticide application was typically conducted in two stages: the first application was carried out just before the rice flowering stage (Gimje: 8 August, Cheongyang: 14 August), and the second application took place when the rice flowers were in bloom, with more than 50% of the flowers bloomed (Gimje: 21 August, Cheongyang: 28 August). The pesticide treatment involved aerial spraying using a drone, with a solution of 2% clothianidin and 4% flubendiamide suspension concentrate, diluted to 0.8 ℓ/10 a. The control site did not undergo any pesticide application.

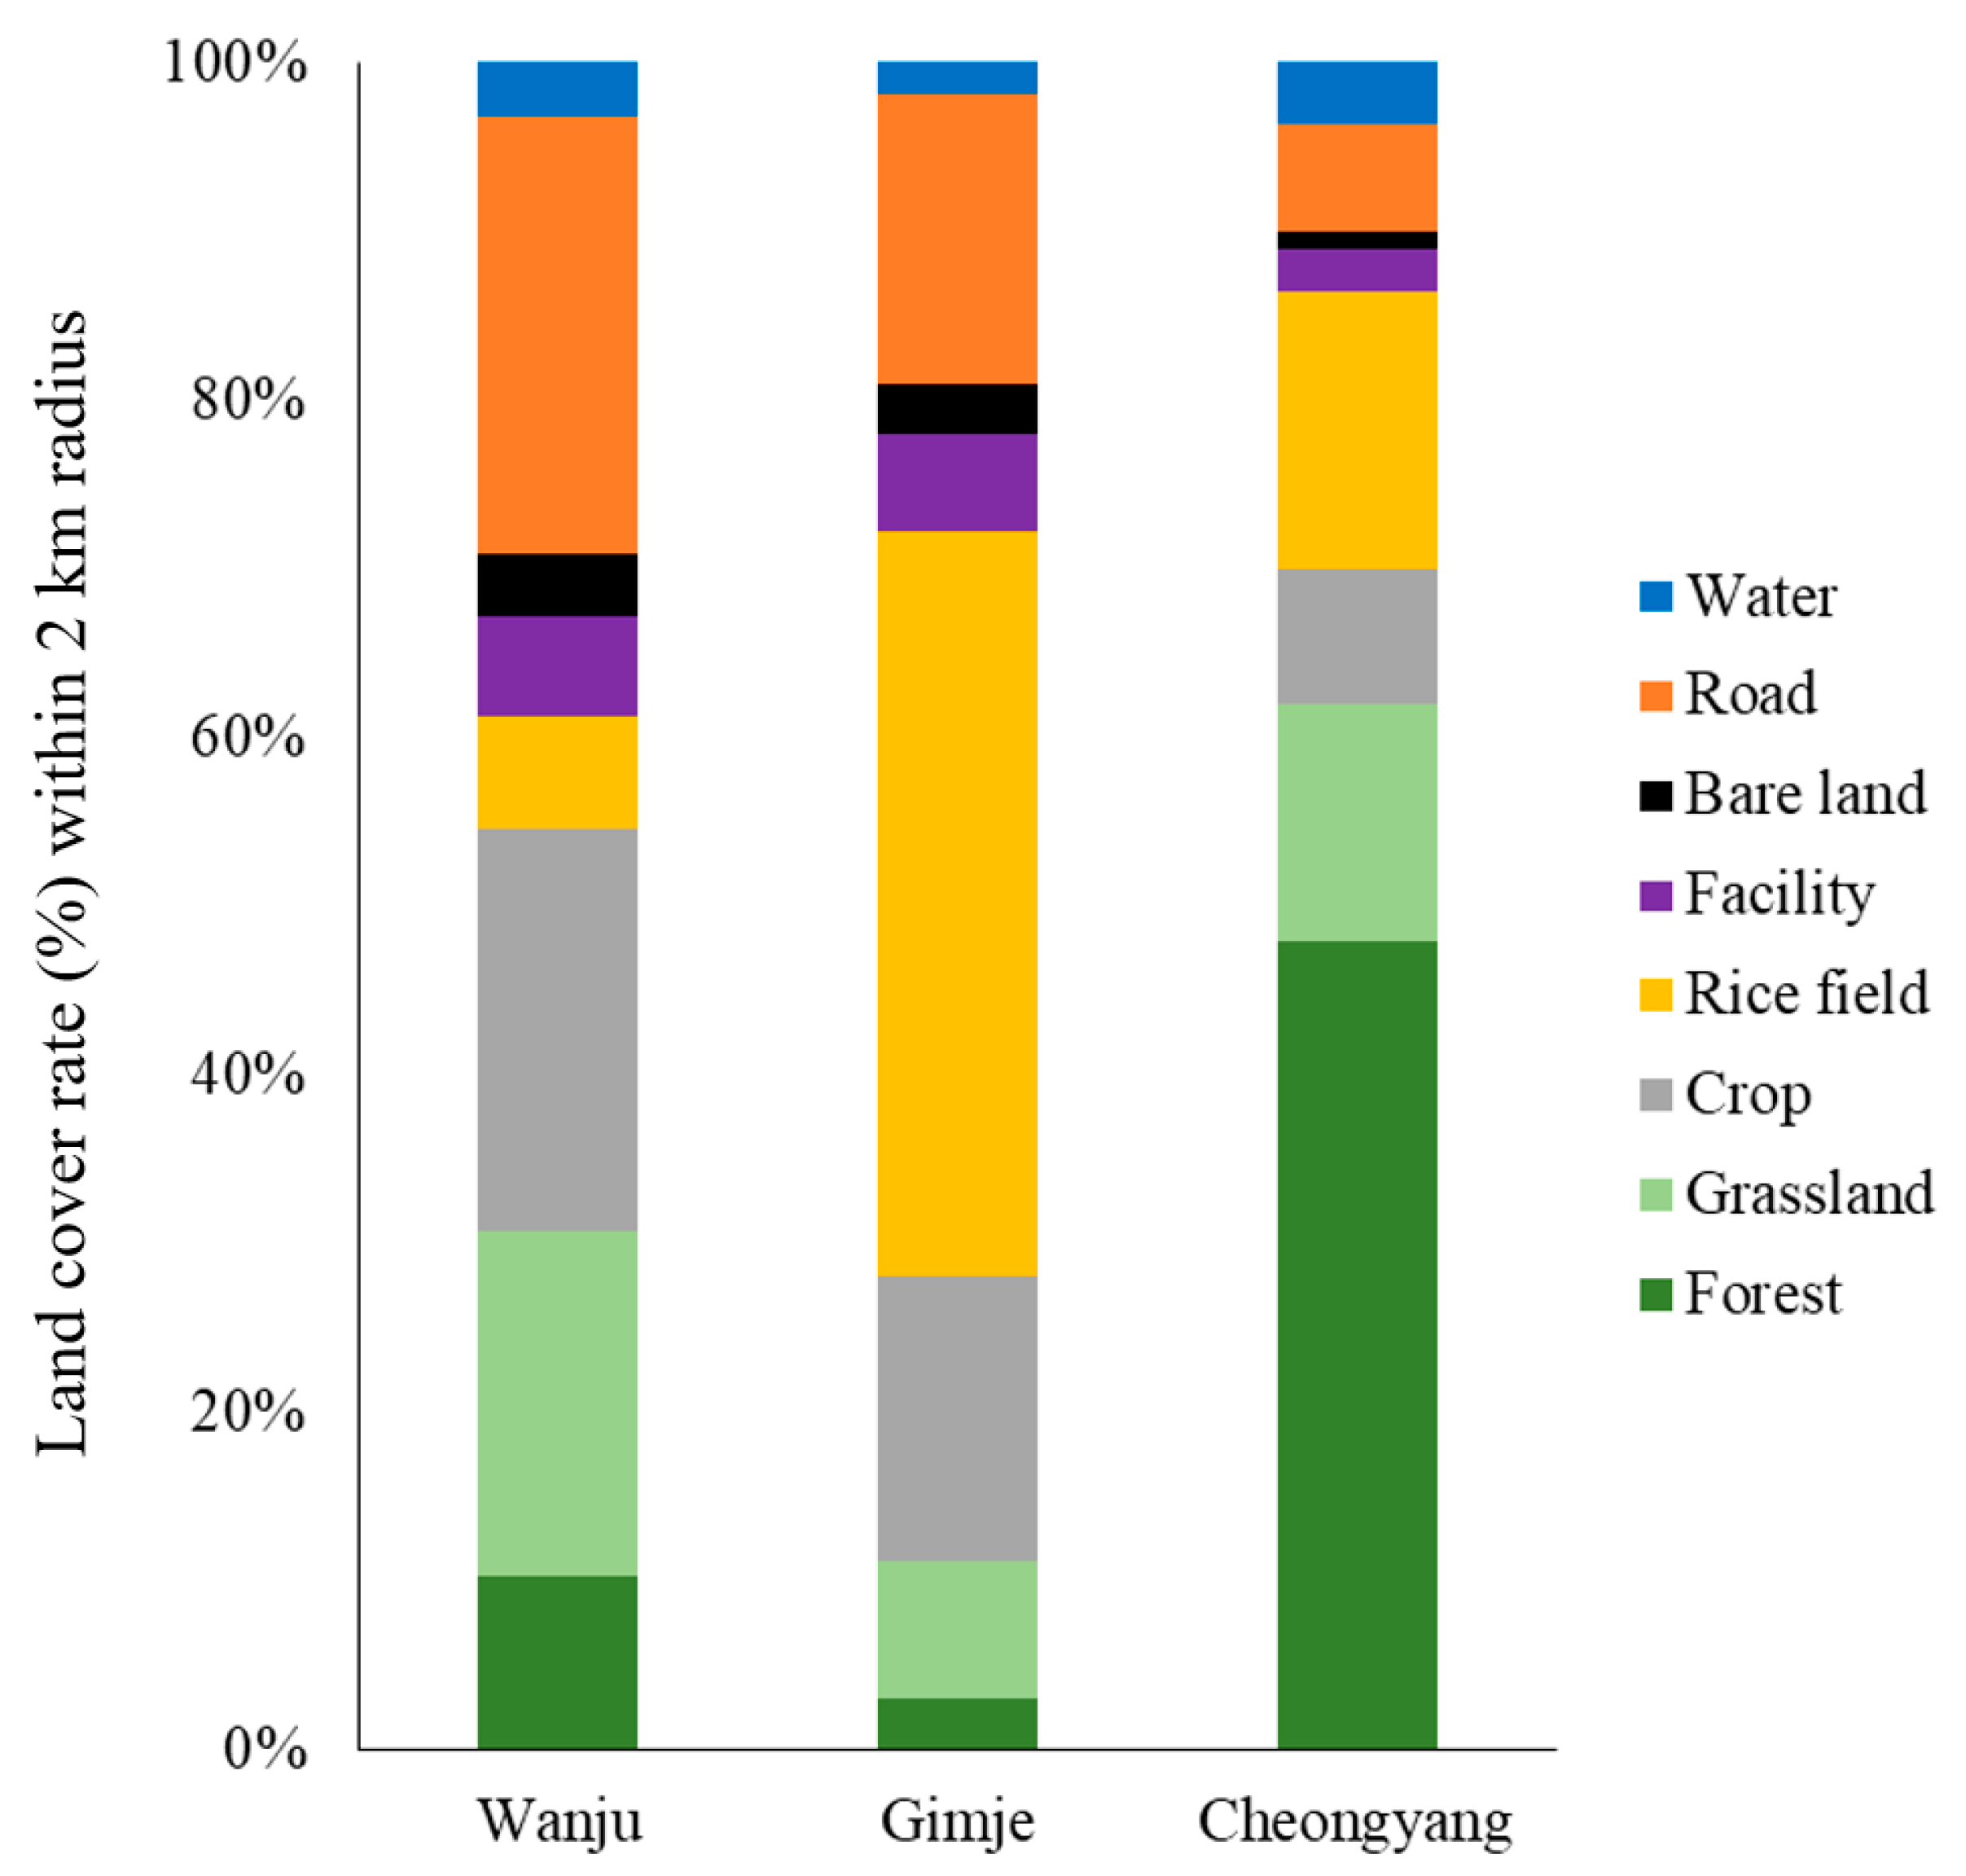
2.2. Landscape Analysis

To assess the regional landscape factors, a landscape analysis was conducted. The landscape within a 2 km radius around each colony installation site was analyzed. The landscape was categorized into a total of 8 factors (forest, grassland, crop, rice field, facility, bare land, road, water). Map data were obtained and utilized from the Environmental Geographic Information service provided by the Ministry of Environment, Republic of Korea [28]. Calculation of landscape factors was conducted using QGIS 3.28 [29].

2.3. Analysis of Plant Species Composition in Pollen

To confirm that rice pollen penetrated into the honey bee colonies, pollen collectors were installed at the entrances to three beehives at each study site. Afterward, pollen collected in early June before rice flowers bloomed and in mid-August when rice flowers were in bloom, using pollen collectors, were analyzed for the composition of plant species. Net weights of 2.5 g of the pollen were randomly extracted and placed in a conical tube, and homogenized by adding 20 mL of 95% glacial acetic acid. After drying in a hood for 10 min, the samples were vortexed and centrifuged at 3080 rpm for 2 min. The supernatants were removed, and 20 mL of an acetic acid-degrading mixture, composed of acetic anhydride and 99% sulfuric acid in a 9:1 ratio, was slowly added to the samples. The reaction was initiated by placing the mixture in an oven heated to 80 °C for 10 min. The samples were subsequently taken out, cooled, and centrifuged at 3080 rpm for 2 min, after which the supernatants were removed. The samples were stained using 20 mL of Safranin-O solution. After mixing with the addition of 20 mL of 95% ethanol, centrifugation was performed at 3080 rpm for 2 min, and the supernatant removal process was repeated twice. The slide samples were prepared by mixing them with a Polyvinyl Alcohol (PVA) mounting medium solution, followed by heating in an oven at 60 °C until solidification. Subsequently, the prepared slides were observed under a microscope. Identification of plant species was performed through consultation with experts and reference guides [30]. The proportions of each plant species were determined using a hemocytometer (TC20, BIO-RAD, Hercules, CA, USA).

2.4. Analysis of Pesticide Residual in Pollen

Residual pesticide analysis was conducted after collecting pollen from the pollen collector installed at the entrance of each beehive. The same pollen used for the analysis of plant species composition was incorporated for the analysis of pesticide residual in the pollen. The analytical instrument used was an HPLC-MS/MS system (API-5000, AB SCIEX, Framingham, MA, USA), and a column with dimensions of 4.6 × 100, 2.7 μm (Zobax C18, Agilent, Santa Clara, CA, USA) was employed. Pollen used for residual pesticide analysis was collected in three replicates, with each replicate consisting of 10 g per beehive. In a 50 mL conical tube, 10 mL of distilled water was added and mixed. Subsequently, 10 mL of acetonitrile and 1 g each of sodium chloride, sodium citrate, sodium sesquihydrate, and 4 g of magnesium sulfate were added, followed by vortexing. The resulting mixture was centrifuged at 4000 rpm for 5 min. After purifying the upper layer with 1.5 mL of magnesium sulfate (150 mg), PSA (25 mg), and C18 (25 mg), the resulting mixture was centrifuged at 12,000 rpm for 3 min. After allowing this solution to stand at −18 °C for 12 h, it was filtered through a syringe filter (0.22 μm) and then injected into LC-MS/MS. The area of peaks observed in the chromatogram was measured, and the contained concentrations were calculated using the standard calibration curve. The minimum detection limit was set at 1 ppb.

2.5. Monitoring the Strength of Honey Bee Colonies

The survey was conducted weekly from 20 July 2023, to 4 October 2023. The strength of honey bee colonies was set at an average of 4 ± 1.5 combs in a single brood chamber. The scale representing the strength of honey bee colonies was determined based on the number of worker bees, capped brood, and larvae cells attached to the combs. The methods for measuring each of these were conducted following the procedures outlined by Delaplane et al. [31]. The number of worker bees was calculated by measuring the ratio of worker bees covering a single comb, and it was calculated to be 2500 when it reached 100%. The number of larvae and capped brood cells was determined by dividing one side of the comb into 32 equal sections and calculating at a rate of 100 individual cells per section.

2.6. Quantitative Real-Time PCR

To test the specificity of major bio-marker genes involved in detoxification, stress response and development of honey bees, quantitative real-time PCR (qPCR) was conducted. Total RNA was extracted from ten honey bee abdomens of three biological replicates from each group using TRIzol® reagent (ambion, Foster, CA, USA) according to the manufacturer’s instructions. The RNA extract was treated with DNase I (GenDEPOT, Barker, TX, USA). After DNase I treatment, the first strand cDNA was synthesized from 2.0 μg of total RNA to cDNA with EcoDry™ (TAKARA Korea Biomedical Inc., Seoul, Republic of Korea) at 42 °C for 60 min. qPCR was performed using QuantStudio5 (Applied biosystems, Foster, CA, USA). The cycling conditions were as follows: 95 °C for 5 min, 38 cycles of 95 °C for 30 s, 57 °C for 30 s, and 72 °C for 30 s. The amplification mixtures (total volume 20 µL) for all assays contained 10 µL of AccuPower® 2X GreenStar™ qPCR Master Mix (Bioneer, Seoul, Republic of Korea) and 100 ng of Template DNA. The tested genes’ transcription levels and two reference genes were evaluated. The tested genes included: Cytochrome P450 9Q1 (CYP9Q1), 9Q2 (CYP9Q2), 9Q3 (CYP9Q3), 6AS3 (CYP6A3), and 336A1 (CYP336A1), carboxylesterase (CbE), and Esterase E4 (Este4) as the phase I detoxification genes; Glutathione S-transferase (GST) D1 (Gstd1), S1 (GstS1), and S4 (GstS4) as the phase II detoxification genes; ATP-binding cassette (ABC) transporter subfamily C member Sur (Sur), subfamily D member 1 (ABCD1), and G family member 20 (ABCG2) as the phase III detoxification genes; Heat shock protein (Hsp) 70Ab-like (Hsp70) and 90 (Hsp90) as the heat stress response genes; Catalase (Cat), phospholipid hydroperoxide glutathione peroxidase (Gtpx2), Nitric oxide synthase (Nos), Superoxide dismutase (Sod), peroxiredoxin 1 (Tpx1) as the oxidative stress response genes, Juvenile hormone esterase (JhE), Serine/threonine-protein kinase mTOR (mTOR), Insulin receptor substrate 1-B (IRS), Forkhead box protein O (FoxO), and Vitellogenin (Vg) as the metabolism and development-related genes; and 40S ribosomal protein S18 (rpS18) and actin related protein 1 (Actin) as the reference genes [32]. The Primer information is listed (Table S1).

2.7. Data Analysis

All data analysis was conducted using the software R version 4.1.2 (1 November 2021) [33]. During the monitoring period, the mean strength of honey bee colonies by region was tested using Two-way ANOVA. Throughout the entire monitoring period, the comparison of mean cumulative strength of honey bee colonies among regions was tested using One-way ANOVA and Duncan multiple range test. At each point in time of pesticide treatment, the mean changes in the strength of honey bee colonies between the treatment groups from two different regions and control were compared using the Kruskal–Wallis rank sum test. Subsequently, a post-hoc analysis was performed using the Conover–Iman test.

3. Results

3.1. Analysis of Landscape Factors within a 2 km Radius of the Honey Bee Colonies’ Establishment Sites

The results of landscape analysis for the three selected sites are presented in Figure 1. In Wanju, the control site, the land cover within a 2 km radius showed that crops had the widest coverage at 23.9%, while water exhibited the lowest rate at 3.2%. Rice fields were found to cover 6.5% of the area. In the case of Gimje, the land cover of rice fields showed the highest rate at 44.2%, whereas forests and bare lands had the lowest rates at 3.0%. For Cheongyang, the land cover of forests was the highest at 47.9%, and bare land was the lowest at 1.1%. The land cover of rice fields was determined to be 16.4%. Consequently, Gimje exhibited the highest percentage of rice-field coverage in both control and treatment areas, followed by Cheongyang and Wanju.

3.2. Composition of Plant Species and Residual Pesticides in Pollen

In each study site, the plant species composition of the pollen in the pollen collector installed in the beehive for each period is shown in Figure 2. Pollen composition was identified for 11 taxa, excluding other species. In June, rice pollen was absent in all study sites, with chestnut pollen dominating in Gimje and Cheongyang. However, during the flowering period of rice flowers in mid-August, the rice pollen composition was the highest in all study sites except Gimje, where it represented the second-highest composition. The rice-field cover rate of Gimje was the highest but the rice pollen collected was the second highest. Residual pesticide analysis was conducted on pollen collected from the pollen collector during the rice flowering period (Table 1). In Wanju (control), neither clothianidin nor flubendiamide was detected during any of the time periods. Clothianidin was detected on the 17 and 28 of August in both Gimje and Cheongyang, with the highest concentration observed on the 17 of August in Gimje at 2.1 ± 1.51 ppb/10 g. Flubendiamide was detected in Gimje and Cheongyang during all periods except June, with the highest concentration observed on the 17 of August in Cheongyang at 3.3 ± 0.71 ppb/10 g.

3.3. Monitoring the Strength of Honey Bee Colonies in Nearby Rice Fields

During the study period, monitoring the strength of honey bee colonies revealed no significant differences in the number of adult bees, larvae and capped broods among the three regions (Table 2; Figure 3). Throughout the monitoring period, the comparison of the overall cumulative strength of honey bee colonies showed that Cheongyang had the highest number of adult bees (Figure 4). However, no statistically significant difference was observed (F = 0.4082, p = 0.6720). Regarding the number of larvae, Wanju had the highest count, but there was no statistically significant difference (F = 0.2959, p = 0.7481). As for capped broods, Gimje had the highest count, with no statistically significant difference found (F = 0.2333, p = 0.7948). Results of the comparison between Wanju and each treatment group showed a significant difference (χ2 = 7.2417, p = 0.0268) in the number of adult bees after the first pesticide application in Gimje, in contrast to Cheongyang and Wanju (Table 3).

3.4. Genomic Analysis of Honey Bee Stress Responses

On the day of pesticide application, the Cheongyang and Gimje displayed lower expression levels than Wanju (Figure 5). The transcription levels of ABCG20, HSP70, Catalase, Nos, Sod, JhE, and Vg increased. The highest expressions were observed in Catalase, Juvenile hormone esterase (JhE) and Superoxide dismutase (Sod). In detoxification phases (phase I, II and III), transcription of detoxification phase I (CYP336A1, CYP6AS3, CYP9Q1, CYP9Q2, CYP9Q3, CbE, Este4) showed lower expressions. One month after treatment, it exhibited higher expression levels than Wanju. The transcription levels of all oxidative stress, metabolism and development-related genes were highest in Gimje as was the case with GstS1. The site in Gimje displayed higher expression levels than Wanju. The highest expression was observed in Vitellogenin (Vg), peroxiredoxin 1 (Tpx1) and Insulin receptor substrate 1-B (IRS). Also, Cheongyang displayed Glutathione S-transferase (GST) S1 (GstS1), peroxiredoxin 1 (Tpx1) and Superoxide dismutase (Sod). In this study, toxic stress conditions affected the transcription of detoxification, stress response and development in honey bee colonies.

4. Discussion

In proximity to the rice cultivation area, beehives for honey bees were installed, and the strength of honey bee colonies was monitored from 20 July to 4 October in 2023. In two treatment areas (Cheongyang and Gimje), the neonicotinoid pesticide Clothianidin was conventionally applied, and a comparison was conducted with the control area (Wanju) on the strength of honey bee colonies. As a result, there was no significant difference in the strength of the honey bee colonies. According to Yao et al. [20], experiments have shown that treatment with clothianidin has minimal impact on the survival rate of adult bees. Orcic et al. [34] also suggested a tendency for chronic toxic responses in honey bees, such as weakening their immune system, rather than acute toxicity. However, clothianidin is relatively well-known for its high toxicity, with a 24 h lethal dose 50% (LD50) of 22 ng bee1, even among neonicotinoid pesticides [35]. This indicates that some level of control can be achieved through low-dose clothianidin treatment. The clothianidin used in this study was applied at a rate of approximately 5 g/10 a, a level that is considered not to significantly impact honey bee survival rates compared to previous studies [10,20,36]. Additionally, since this study did not involve direct treatment of honey bees with pesticides, the acute toxicity risk is expected to be low.
The primary risk factor associated with neonicotinoid pesticides is chronic toxicity, and this underscores the chronic toxicity risk to honey bees [37,38,39]. When exposed to neonicotinoid pesticides, honey bees experience a range of complex issues, with the most immediate impact being on the flight activity of adult bees [40]. If the wings fail to function properly, it can lead to issues with temperature regulation within the hive and foraging activities [41,42]. Particularly when difficulties in temperature regulation arise during the winter season, the likelihood of colony collapse is higher [43]. The use of neonicotinoid pesticides can also have a significant impact on honey bee queens. According to Williams et al. [37] neonicotinoid pesticides, when honey bee queens are exposed to them, can cause damage to the stored sperms in the queen’s spermatheca, ultimately significantly impacting the oviposition rate. As a result, there may be a deficiency of worker bees, leading to challenges in maintaining the colony. Based on these findings, it is necessary to expand the discussion of neonicotinoid pesticide exposure in honey bees to a more chronic context.
We established honey bee hives in proximity to rice cultivation areas and subjected the treatment group to two rounds of clothianidin pesticide treatment. On the day of the pesticide application, we observed a decrease in the transcription levels of Hsp90 and mTOR. In light of these results, it is worth noting that a reduction in mTOR levels through RNA interference leads to an increased sensitivity to heat shock. This effect was also associated with a diminished capacity to synthesize heat shock proteins (HSPs), including Hsp70, Hsp90, and Hsp11 [44]. Conversely, we observed an increase in the transcription levels of ABCG20, HSP70, Catalase, Nos, Sod, JhE, and Vg—genes known to trigger the heat shock response (HSR). Hsps, which are involved in the HSR, can serve as stress markers for the detection and quantification of cellular stress [45]. Furthermore, Vitellogenin (Vg) has been suggested as a plausible candidate for a stress marker, as it plays a protective role against oxidative stress and is regulated by the juvenile hormone, which is also considered to be associated with stress responses [46,47].
One month after treatment, there was a significant up-regulation in catalase activity in Gimje, where a higher concentration of imidacloprid (20 ppb) was applied. In contrast, Sod2 was down-regulated in the same area. Furthermore, on day 20 of the feeding process, only two antioxidant genes were observed to be down-regulated, namely Cat and TrxR1. Catalase plays an active role in protecting cells from oxidative damage caused by reactive oxygen species (ROS) [48]. Additionally, heat shock and brood-rearing suppression led to the over-transcription of Vg [49], and Vg has been proposed as a potential molecular stress marker [50]. In particular, some cellular stress responses, such as the expression levels of heat shock proteins (Hsps) and corticotropin-releasing hormone-binding protein (CRH-BP), have more recently been utilized to assess stress in honey bees exposed to various stressors, including capture, transport, confinement, cold, heat, and UV light [51].
Our findings indicate that the application of clothianidin insecticide in rice fields near apiary sites may impact the stress-related genes of honey bees. According to Alptekin et al. [52], when the expression levels of honey bee stress-related genes were analyzed after exposure to the same neonicotinoid insecticide, thiacloprid, it showed a similar pattern to that observed in this study among the insecticide treatment groups. As such, it is known that honey bee larvae are exposed to neonicotinoid-based insecticides at low concentrations, which are sub-lethal, through specific pathways [53]. Subsequently, these larvae develop abnormalities when they become adult bees. This leads to various other problems. For instance, problems such as reduced memory and flight ability compared to ordinary adults [41,54] may arise. It is also suggested that the bees’ ability to resist pests is weakened by affecting their immune-related systems [26,55]. Above all, it can also have a detrimental effect on the oviposition behavior of the queen bee, a crucial factor in maintaining the strength of the honey bee population. According to Chaimanee et al. [56], experiments have demonstrated that chemicals such as pesticides affect the survival rate of sperm stored in the queen’s spermatheca. In summary, chronic exposure of honey bee colonies to insecticides, despite being low in toxicity, raises the likelihood of developing a range of issues compared to normal populations, hinting at the potential for population decline.

5. Conclusions

In this study, we analyzed the impact of the neonicotinoid pesticide, clothianidin, on the strength of honey bee colonies residing in the vicinity of rice cultivation areas. The results indicate that the direct harm inflicted on honey bee colonies by rice pesticide treatment appears to be low. However, the analysis of honey bee genes revealed that bees in the treatment area generally exhibited higher expression levels of stress-related genes. Furthermore, one month later, there was a great increase, indicating the potential progression towards chronic effects. Further research is needed to investigate the actual routes of pesticide intrusion into honey bee hives or their contact with honey bees. The findings of this study may serve as a basis tool for regulating the use of neonicotinoid pesticides.

Supplementary Materials

The following supporting information can be downloaded at: https://www.mdpi.com/article/10.3390/d15121217/s1, Table S1: Primer of the genes for qPCR [32].

Author Contributions

Conceptualization, M.S., J.K. and B.-S.P.; Methodology, M.S., J.K. and B.-S.P.; Software, B.-S.P. and Y.-S.C.; Validation, C.-H.L. and D.K.; Formal Analysis, M.S. and P.N.A.; Investigation, M.S., J.K. and B.-S.P.; Resources, D.K. and Y.-S.C.; Data Curation, D.O. and B.-S.P.; Writing—Review and Editing, M.S., J.K., P.N.A. and B.-S.P.; Visualization, M.S., J.K. and D.O.; Supervision, P.N.A.; Project Administration, M.S., Y.-S.C. and B.-S.P.; Funding Acquisition, M.S., Y.-S.C. and B.-S.P. All authors have read and agreed to the published version of the manuscript.

Funding

This study was conducted with support from a project (RS-2021-RD009796) by the Rural Development Administration (RDA), National Institute of Agricultural Sciences (NIAS), Republic of Korea.

Institutional Review Board Statement

Not applicable.

Data Availability Statement

The data presented in this study are within the manuscript and publicly available.

Acknowledgments

We are grateful to the bee breeding laboratory, NIAS, for their collaboration during this study. We appreciate the technical assistance of beekeepers in the bee breeding laboratory at RDA.

Conflicts of Interest

The authors declare no conflict of interest. The sponsors had no role in the design, execution, interpretation, or writing of the study, or in the decision to publish the results.

References

  1. Koch, V.; Zoller, L.; Bennett, J.M.; Knight, T.M. Pollinator dependence but no pollen limitation for eight plants occurring north of the Arctic Circle. Ecol. Evol. 2020, 10, 13664–13672. [Google Scholar] [CrossRef]
  2. Potts, S.G.; Biesmeijer, J.C.; Kremen, C.; Neumann, P.; Schweiger, O.; Kunin, W.E. Global pollinator declines: Trends, impacts, and drivers. Trends Ecol. Evol. 2010, 25, 345–353. [Google Scholar] [CrossRef]
  3. Aslan, C.E.; Liang, C.T.; Galindo, B.; Hill, K.; Topete, W. The role of honey bees as pollinators in natural areas. Nat. Areas J. 2016, 36, 478–488. [Google Scholar] [CrossRef]
  4. Hung, K.J.; Kingston, J.M.; Albrecht, M.; Holway, D.A.; Kohn, J.R. The worldwide importance of honey bees as pollinators in natural habitats. Proc. R. Soc. B Biol. Sci. 2018, 285, 20172140. [Google Scholar] [CrossRef] [PubMed]
  5. Klatt, B.K.; Holzschuh, A.; Westphal, C.; Clough, Y.; Smit, I.; Pawelzik, E.; Tscharntke, T. Bee pollination improves crop quality, shelf life and commercial value. Proc. R. Soc. B Biol. Sci. 2014, 281, 20132440. [Google Scholar] [CrossRef] [PubMed]
  6. Francuski, L.; Beukeboom, L.W. Insects in production—An introduction. Entomol. Exp. Appl. 2020, 168, 422–431. [Google Scholar] [CrossRef]
  7. Osterman, J.; Aizen, M.A.; Biesmeijer, J.C.; Bosch, J.; Howlett, B.G.; Inouye, D.W.; Jung, C.; Martins, D.J.; Medel, R.; Pauw, A.; et al. Global trends in the number and diversity of managed pollinator species. Agric. Ecosyst. Environ. 2021, 322, 107653. [Google Scholar] [CrossRef]
  8. Brodschneider, R.; Moosbeckhofer, R.; Crailsheim, K. Surveys as a tool to record winter losses of honey bee colonies: A two-year case study in Austria and South Tyrol. J. Apic. Res. 2010, 49, 23–30. [Google Scholar] [CrossRef]
  9. vanEngelsdorp, D.; Traynor, K.S.; Andree, M.; Lichtenberg, E.M.; Chen, Y.; Saegerman, C.; Cox-Foster, D.L. Colony collapse disorder (CCD) and bee age impact honey bee pathophysiology. PLoS ONE 2017, 12, e0179535. [Google Scholar] [CrossRef]
  10. Lee, C.; Jeong, S.; Jung, C.; Burgett, M. Acute oral toxicity of neonicotinoid insecticides to four species of honey bee Apisflorea, A. cerana, A. mellifera, and A. dorsata. J. Apic. 2016, 31, 51–58. [Google Scholar]
  11. Highfield, A.C.; Nagar, A.E.; Mackinder, L.C.M.; Noel, L.M.-L.J.; Hall, M.J.; Martin, S.J.; Schroeder, D.C. Deformed wing virus implicated in overwintering honeybee colony losses. Appl. Environ. Microbiol. 2009, 75, 7212–7220. [Google Scholar] [CrossRef]
  12. Staveley, J.P.; Law, S.A.; Fairbrother, A.; Menzie, C.A. A causal analysis of observed declines in managed honey bees (Apis mellifera). Hum. Ecol. Risk Assess. 2014, 20, 566–591. [Google Scholar] [CrossRef]
  13. Doke, M.A.; Frazier, M.; Grozinger, C.M. Overwintering honey bees: Biology and management. Curr. Opin. Insect Sci. 2015, 10, 185–193. [Google Scholar] [CrossRef]
  14. Genersch, E.; Ohe, W.V.D.; Kaatz, H.; Schroeder, A.; Otten, C.; Buchler, R.; Berg, S.; Ritter, W.; Muhlen, W.; Gisder, S.; et al. The German bee monitoring project: A long term study to understand periodically high winter losses of honey bee colonies. Apidologie 2010, 41, 332–352. [Google Scholar] [CrossRef]
  15. Lee, S.; Kim, S.; Lee, J.; Kang, J.; Lee, S.; Park, H.J.; Nam, J.; Jung, C. Impact of ambient temperature variability on the overwintering failure of honeybees in South Korea. J. Apic. 2022, 37, 331–347. [Google Scholar]
  16. Johnson, R.M.; Ellis, M.D.; Mullin, C.A.; Frazier, M. Pesticides and honey bee toxicity—USA. Apidologie 2010, 41, 312–331. [Google Scholar] [CrossRef]
  17. Calatayud-Vernich, P.; Calatayud, F.; Simo, E.; Suarez-Varela, M.M.; Pico, Y. Influence of pesticide use in fruit orchards during blooming on honeybee mortality in 4 experimental apiaries. Sci. Total Environ. 2016, 541, 33–41. [Google Scholar] [CrossRef]
  18. McArt, S.H.; Fersch, A.A.; Milano, N.J.; Truitt, L.L.; Boroczky, K. High pesticide risk to honey bees despite low focal crop pollen collection during pollination of a mass blooming crop. Sci. Rep. 2017, 7, 46554. [Google Scholar] [CrossRef] [PubMed]
  19. Kim, C.J.; Yuan, X.; Kim, M.; Kyung, K.S.; Noh, H.H. Monitoring and risk analysis of residual pesticides drifted by unmanned aerial spraying. Sci. Rep. 2023, 13, 10834. [Google Scholar] [CrossRef] [PubMed]
  20. Yao, J.; Zhu, Y.C.; Adamczyk, J. Responses of honey bees to lethal and sublethal doses of formulated clothianidin alone and mixtures. J. Econ. Entomol. 2018, 111, 1517–1525. [Google Scholar] [CrossRef]
  21. Gross, M. EU ban puts spotlight on complex effects of neonicotinoids. Curr. Biol. 2013, 23, R462–R464. [Google Scholar] [CrossRef]
  22. Epstein, Y.; Chapron, G.; Verheggen, F. What is an emergency? Neonicotinoids and emergency situations in plant protection in the EU. Ambio 2022, 51, 1764–1771. [Google Scholar] [CrossRef] [PubMed]
  23. Cutler, G.C.; Scott-Dupree, C.D. Exposure to clothianidin seed-treated canola has no long-term impact on honey bees. Ecotoxicology 2007, 100, 765–772. [Google Scholar] [CrossRef]
  24. Choi, Y.; Kwon, C.; Yun, T.; Lee, Y. Persistence of the insecticide clothianidin in paddy and upland soils. Korean J. Environ. Agric. 2014, 33, 290–297. [Google Scholar] [CrossRef]
  25. Kim, S.K.; Seong, M.; Lee, S.H. The effects of Flupyradifurone exposure on honey bee physiology. J. Apic. 2023, 38, 33–40. [Google Scholar]
  26. Prisco, G.D.; Cavaliere, V.; Annoscia, D.; Varricchio, P.; Caprio, E.; Nazzi, F.; Gargiulo, G.; Pennacchio, F. Neonicotinoid clothianidin adversely affects insect immunity and promotes replication of a viral pathogen in honey bees. Proc. Natl. Acad. Sci. USA 2018, 110, 18466–18471. [Google Scholar] [CrossRef] [PubMed]
  27. Tison, L.; Rößner, A.; Gerschewski, S.; Menzel, R. The neonicotinoid clothianidin impairs memory processing in honey bees. Ecotox. Environ. Saf. 2019, 180, 139–145. [Google Scholar] [CrossRef]
  28. Ministry of Environment. Environmental Geographic Information Service. Available online: https://egis.me.go.kr/ (accessed on 2 October 2023).
  29. QGIS Development Team. QGIS Geographic Information Systems. Available online: https://www.qgis.org (accessed on 15 September 2023).
  30. Chang, N.M.; Rim, Y.D. Morphological Studies on the Pollen of Flowering Plants in Korea; Seoul National University Press: Seoul, Republic of Korea, 1979. [Google Scholar]
  31. Delaplane, K.S.; Van Der Steen, J.; Guzman-Novoa, E. Standard methods for estimating strength parameters of Apis mellifera colonies. J. Apic. Res. 2013, 52, 1–12. [Google Scholar] [CrossRef]
  32. Cho, S.; Lee, S.H.; Kim, S. Determination of the optimal maturation temperature for adult honey bee toxicity testing. Comp. Biochem. Physiol. C Toxicol. Pharmacol. 2022, 257, 109359. [Google Scholar] [CrossRef]
  33. R Core Team. R: A Language and Environment for Statistical Computing; R Foundation for Statistical Computing: Vienna, Austria, 2018; Available online: https://www.R-project.org/ (accessed on 3 September 2023).
  34. Orcic, S.M.; Celic, T.V.; Purac, J.S.; Vukasinovic, E.L.; Kojic, D.K. Acute toxicity of sublethal concentrations of thiacloprid and clothianidin to immune response and oxidative status of honey bees. Apidologie 2022, 53, 50. [Google Scholar] [CrossRef]
  35. Iwasa, T.; Motoyama, N.; Ambrose, J.T.; Roe, R.M. Mechanism for the differential toxicity of neonicotinoid insecticides in the honey bee, Apis mellifera. Crop Prot. 2004, 25, 371–378. [Google Scholar] [CrossRef]
  36. Ulziibayar, D.; Jung, C. Comparison of acute toxicity of different groups of pesticides to honey bee workers (Apis mellifera L.). J. Apic. 2019, 34, 305–313. [Google Scholar] [CrossRef]
  37. Williams, G.R.; Troxler, A.; Retschnig, G.; Roth, K.; Yanez, O.; Shutler, D.; Neumann, P.; Gauthier, L. Neonicotinoid pesticides severely affect honey bee queens. Sci. Rep. 2015, 5, 14621. [Google Scholar] [CrossRef] [PubMed]
  38. Brandt, A.; Gorenflo, A.; Siede, R.; Meixner, M.; Buchler, R. The neonicotinoids thiacloprid, imidacloprid, and clothianidin affect the immunocompetence of honey bees (Apis mellifera L.). J. Insect Physiol. 2016, 86, 40–47. [Google Scholar] [CrossRef] [PubMed]
  39. Tsvetkov, N.; Samson-Robert, O.; Sood, K.; Patel, H.S.; Malena, D.A.; Gajiwala, P.H.; Maciukiewicz, P.; Fournier, V.; Zayed, A. Chronic exposure to neonicotinoids reduces honey bee health near corn crops. Science 2017, 365, 1395–1397. [Google Scholar] [CrossRef]
  40. Tosi, S.; Burgio, G.; Nieh, J.C. A common neonicotinoid pesticide, thiamethoxam, impairs honey bee flight ability. Sci. Rep. 2017, 7, 1201. [Google Scholar] [CrossRef] [PubMed]
  41. Tosi, S.; Demares, F.J.; Nicolson, S.W.; Medrzycki, P.; Pirk, C.W.W.; Human, H. Effects of a neonicotinoid pesticide on thermoregulation of African honey bees (Apis mellifera scutellate). J. Insect Physiol. 2016, 93, 56–63. [Google Scholar] [CrossRef]
  42. Meikle, W.G.; Corby-Harris, V.; Carroll, M.J.; Weiss, M.; Snyder, L.A.; Meador, C.A.D.; Beren, E.; Brown, N. Exposure to sublethal concentrations of methoxyfenozide disrupts honey bee colony activity and thermoregulation. PLoS ONE 2019, 14, e0204635. [Google Scholar] [CrossRef]
  43. Fahrenholz, L.; Lamprecht, I.; Schricker, B. Thermal investigations of a honey bee colony: Thermoregulation of the hive during summer and winter and heat production of members of different bee castes. J. Comp. Physiol. B Biochem. Syst. Environ. Physiol. 1989, 159, 551–560. [Google Scholar] [CrossRef]
  44. Chou, S.; Prince, T.; Gong, J.; Calderwood, S.K. mTOR is essential for the proteotoxic stress response, HSF1 activation, and heat shock protein synthesis. PLoS ONE 2012, 7, e39679. [Google Scholar] [CrossRef]
  45. Verghese, J.; Abrams, J.; Wang, Y.; Morano, K.A. Biology of the heat shock response and protein chaperone: Budding yeast (Saccharomyces cerevisiae) as a model system. Microbiol. Mol. Biol. Rev. 2012, 76, 115–158. [Google Scholar] [CrossRef]
  46. Amdam, G.V.; Omholt, S.W. The hive bee to forager transition in honeybee colonies: The double repressor hypothesis. J. Theor. Biol. 2003, 223, 451–464. [Google Scholar] [CrossRef] [PubMed]
  47. Seehuus, S.; Norberg, K.; Gimsa, U.; Amdam, G.V. Reproductive protein protects functionally sterile honey bee workers from oxidative stress. Proc. Natl. Acad. Sci. USA 2006, 103, 962–967. [Google Scholar] [CrossRef]
  48. Gregorc, A.; Alburaki, M.; Sampson, B.; Knight, P.R.; Adamczyk, J. Toxicity of selected acaricides to honey bees (Apis mellifera) and varroa (Varroa destructor Anderson and Trueman) and their use in controlling varroa within honey bee colonies. Insects 2018, 9, 55. [Google Scholar] [CrossRef] [PubMed]
  49. Kim, S.; Kim, K.; Lee, J.H.; Han, S.H.; Lee, S.H. Differential expression of acetylcholinesterase 1 in response to various stress factors in honey bee workers. Sci. Rep. 2019, 9, 10342. [Google Scholar] [CrossRef] [PubMed]
  50. Dainat, B.; Evans, J.D.; Chen, Y.P.; Gauthier, L.; Neumann, P. Predictive markers of honey bee colony collapse. PLoS ONE 2012, 7, e32151. [Google Scholar] [CrossRef]
  51. Even, N.; Devaud, J.; Barron, A.B. General stress responses in the honey bee. Insects 2012, 3, 1271–1298. [Google Scholar] [CrossRef] [PubMed]
  52. Alptekin, S.; Bass, C.; Nicholls, C.; Paine, M.J.I.; Clark, S.J.; Field, L.; Moores, G.D. Induced thiacloprid insensitivity in honeybees (Apis mellifera L.) is associated with up-regulation of detoxification genes. Insect Mol. Biol. 2016, 25, 171–180. [Google Scholar] [CrossRef]
  53. Wu, M.; Chang, Y.; Lu, K.; Yang, E. Gene expression changes in honey bees induced by sublethal imidacloprid exposure during the larval stage. Insect Biochem. Mol. Biol. 2017, 88, 12–20. [Google Scholar] [CrossRef]
  54. Belzunces, L.; Tchamitchian, S.; Brunet, J. Neural effects of insecticides in the honey bee. Apidologie 2012, 43, 348–370. [Google Scholar] [CrossRef]
  55. Gauthier, M.; Aras, P.; Paquin, J.; Boily, M. Chronic exposure to imidacloprid or thiamethoxam neonicotinoid causes oxidative damages and alters carotenoid-retinoid levels in caged honey bees (Apis mellifera). Sci. Rep. 2018, 8, 16274. [Google Scholar] [CrossRef] [PubMed]
  56. Chaimanee, V.; Evans, J.D.; Chen, Y.; Jackson, C.; Pettis, J.S. Sperm viability and gene expression in honey bee queens (Apis mellifera) following exposure to the neonicotinoid insecticide imidacloprid and the organophosphate acaricide coumaphos. J. Insect Physiol. 2016, 89, 1–8. [Google Scholar] [CrossRef] [PubMed]
Figure 1. Landscape cover rate (%) of each beehive (control: Wanju, treatment: Gimje and Cheongyang) establishment, located within a 2 km radius.
Diversity 15 01217 g001
Figure 2. Mean composition rate (%) of plant species in pollen per 2.5 mg collected through the pollen collector from honey bee colonies located in Wanju, Gimje, and Cheongyang in 2023. The error bars represent the standard deviation.
Diversity 15 01217 g002
Figure 3. Monitoring analysis of the strength of honey bee (A. mellifera) colonies (indicating the following from top to bottom: mean number of adult bees, larvae and capped broods) installed in each treatment (Gimje and Cheongyang) and control (Wanju) area from 20 July 2023, to 4 October 2023. Blue arrow represents the pesticide treatment day in Gimje, while red corresponds to Cheongyang. The error bars represent the standard deviation.
Diversity 15 01217 g003
Figure 4. Mean number of cumulative strength of honey bee (A. mellifera) colonies established in treated (Cheongyang and Gimje) and control (Wanju) sites from 20 July to 4 October 2023. The error bars represent the standard deviation. NS = No significant difference. Means of the three regions were compared through one-way ANOVA (p < 0.05).
Diversity 15 01217 g004
Figure 5. q-PCR results of genes related to detoxification, the heat shock response, the oxidative stress response and the development of honey bees (A. mellifera) on the day and one month after pesticide application in Cheongyang (AE) and Gimje (FJ). The error bars represent the standard deviation.
Diversity 15 01217 g005
Table 1. Amount of residual pesticides (Mean ± SD ppb/10 g) in pollen collected from beehives equipped with pollen collectors after clothianidin and flubendiamide pesticide application from 20 June to 4 October in 2023, at each monitoring site.
Collecting DaysWanju (Control)GimjeCheongyang
Clothianidin
30 June<LOQ<LOQ<LOQ
17 August<LOQ2.1 ± 1.511.3 ± 1.07
28 August<LOQ1.5 ± 1.260.9 ± 0.64
Flubendiamide
30 June<LOQ<LOQ<LOQ
17 August<LOQ1.8 ± 1.353.3 ± 0.71
28 August<LOQ0.5 ± 0.732.5 ± 1.89
Table 2. Statistical values of two-way ANOVA comparing the mean strength of honey bee (A. mellifera) colonies by region during the monitoring period.
EffectVariable *F Valuedfp Value
LocationA2.1320.12
L1.000.37
C0.890.41
DateA1.5990.12
L1.760.13
C1.800.07
Location:DateA0.47180.97
L1.210.26
C0.540.94
* A: Adult bee, L: Larvae, C: Capped brood.
Table 3. Comparison of changes in the strength of honey bee (A. mellifera) colonies (mean ± SE) by pesticide application day in each treatment group (Cheongyang and Gimje). We used the Kruskal–Wallis rank sum test to compare the means, followed by post-hoc analysis using the Conover–Iman test.
WanjuGimjeCheongyangχ2p
Gimje 1st spray (8 August)
Adult bee−951.9 ± 942.4 b1456.7 ± 305.1 a383.3 ± 430.9 b7.24170.0268
Larvae483.2 ± 1117.9 a650.0 ± 656.5 a783.3 ± 665.6 a0.12600.9389
Capped brood−666.7 ± 302.5 a216.7 ± 675.1 a−150.0 ± 569.0 a0.85730.6514
Gimje 2nd spray (21 August)
Adult bee1552.5 ± 782.2 a−172.5 ± 402.7 a325.8 ± 657.5 a1.90840.3851
Larvae−166.7 ± 892.1 a−350.0 ± 592.9 a1550.0 ± 1506.8 a0.57430.7504
Capped brood1633.3 ± 1027.0 a1200.0 ± 703.2 a3433.3 ± 1430.0 a0.79320.6726
Cheongyang 1st spray (14 August)
Adult bee−651.7 ± 788.2 a95.8 ± 724.5 a824.2 ± 464.3 a2.49930.2866
Larvae483.3 ± 1117.9 a650.0 ± 656.5 a783.3 ± 665.6 a0.12600.9389
Capped brood−666.7 ± 302.5 a216.7 ± 675.1 a−150.0 ± 569.0 a0.85730.6514
Cheongyang 2nd spray (28 August)
Adult bee−38.3 ± 371.3 a−766.7 ± 564.5 a268.3 ± 587.4 a1.72580.4219
Larvae766.74 ± 1163.2 a−16.7 ± 398.2 a−2116.7 ± 940.3 a4.64330.0981
Capped brood−516.7 ± 784.0 a250.0 ± 273.6 a116.7 ± 899.2 a0.71420.6997
In a row, means with different small letters are significantly different at p = 0.05.
Disclaimer/Publisher’s Note: The statements, opinions and data contained in all publications are solely those of the individual author(s) and contributor(s) and not of MDPI and/or the editor(s). MDPI and/or the editor(s) disclaim responsibility for any injury to people or property resulting from any ideas, methods, instructions or products referred to in the content.

