Abstract
This study aimed to confirm the hypothesis of a floristic identity between the southeastern Barents Sea and the southwestern Kara Sea. We conducted integrated studies of pelagic microalgae communities including microscope cell counting and taxonomical identification as well as photosynthetic pigments determination and defining of hydrological and hydrochemical characteristics during a cruise in late August and the first half of September 2020. As far as we are concerned, no such observations had been carried out in this region at this time of the year before. During our observations, 35 species were identified, 14 (40%) of which were present in both water bodies. The communities of both regions were in a state corresponding to the autumn stage of the annual succession cycle. In the southeastern Barents Sea, the mean abundance of organisms in the water column varied from 10.650 to 41.840 cells per liter with a biomass of 71.04 to 300.55 µg/L. In the southwestern Kara Sea, these values were 3.510–28.420 cell/L and 16.31–66.96 µg/L, respectively. In general, the results of a comparative analysis suggest that the pelagic algal communities in the regions under comparison, despite the difference in hydrological parameters, demonstrate similar qualitative and quantitative characteristics and thus may belong to the same phytogeographic region.
1. Introduction
Phytoplankton is a base for marine food webs and has great impacts both on the whole world’s oceanic ecosystem and the entire biosphere because it produces more than 45% of the net primary production of Earth’s photosynthesis [1]. An important issue in studying the life of pelagic algal communities is the cyclical processes happening in them and their ties with the variability of different environmental factors. The latter seems obvious to be determined mainly by the timing of the onset and duration of phases of the seasonal evolution, which in their turn depend on the biogeographic status of the ecosystem [2,3].
Biogeographic studies on marine phytoplankton have more than a century of history, however, to date, no unified methodological approach to exploring this field of hydrobiology has evolved [4]. Previous researchers have observed that the phytoplankton community structure in the Barents Sea is structured by abiotic water mass properties [5]. As a result, major fronts in hydrographic conditions may control the dispersal and development of different phytoplankton communities [6]. This can be related to the ‘Biotope’ concept outlined in [7], which implies the identification of some abiotic characteristics between relatively homogeneous water masses which then are considered phytogeographic regions, based on the similarity of the characteristics identified.
There also exists an opposite perspective on floristic research that identifies similar water areas by comparing all the taxonomic inventories of microalgae available in the literature [8,9]. It looks more relevant to the task of this work but has the same drawback as the above-described “biotopic” one, i.e., it artificially divides the environment and biota. As a result, the overall high species diversity and vast habitats of major organisms entail conclusions that could hardly be considered proper. This manifests in attempts to identify biogeographic regions in the Arctic Basin. Almost all phytoplankton communities inhabiting vortexes of Greenland, Norwegian, Barents, and southwestern Kara Sea largely originate from the same source, namely the large-scale subarctic circulation located in the North Atlantic, south of Greenland [10]. Intrusions of rich cosmopolitan marine flora from the North Atlantic into the Arctic result in high taxonomic similarity [3]. Then, based only on the species composition, one can make a counterintuitive conclusion that we are dealing with the same algal community in all the above-mentioned regions. A similar point of view can be found in Guillard & Kilham [11], Heimdal [12]; moreover, Williams et al. [13] put forth the concept that the entire World Ocean can be considered as one and the same habitat and the ocean’s phytoplankton as one and the same community.
In this situation, a comparison of the algal flora in adjacent areas geographically belonging to different water masses seems the most promising. The southeastern Barents Sea (SEBS) and the southwestern Kara Sea (SWKS) are notable examples of such seawater areas. The question of the unity of their biogeographic statuses was discussed earlier in Druzhkov & Makarevich [14]. The background for this assumption had been provided by both above-described approaches: these areas are characterized by high similarity of hydrological and ice regimes and microalgae taxa [15,16,17,18,19]. Low inter-annual variability of both abiotic and biological parameters in both regions also has great importance [20,21,22,23].
To avoid the above-mentioned disadvantages, when making such a comparison, a prerequisite should be the use of methodological techniques of terrestrial phytocoenology. In pelagic ecosystems, representatives of the dominant phytoplankton groups act as edificators. Being the main primary producers of organic matter, they determine the overall productivity of the water area, cause bloom events, and also affect most hydrochemical parameters due to various metabolism processes. Ultimately, they appear to be an environment-forming factor for the rest of the biological community components, shaping a system of consortium ties and, to a large extent, the entire structure of the ecosystem [24].
Choosing the right research season is also important. The above-mentioned taxonomic similarity of Arctic algal communities is a characteristic feature of the winter stage dominated by cryoflora and the spring stage when the biomass maximum is contributed by a single set of sea-ice-associated and neritic diatom species [25]. Therefore, for a reliable comparison of the microalgae composition to be made, observations should be carried out during the final phase of the annual growth cycle, i.e., in late summer and autumn [26].
Our work aimed to confirm the possible unity of the phytogeographic statuses of two geographically different seawater areas, the southeastern Barents Sea and the southwestern Kara Sea, based on a comparative analysis of phytoplankton communities in these bodies of seawater at the end of the growing season.
2. Materials and Methods
Observations were carried out in the first half of September 2020 during a cruise on the R/V “Dalnie Zelentsy” to the southeastern Barents Sea and the southwestern Kara Sea (Figure 1).
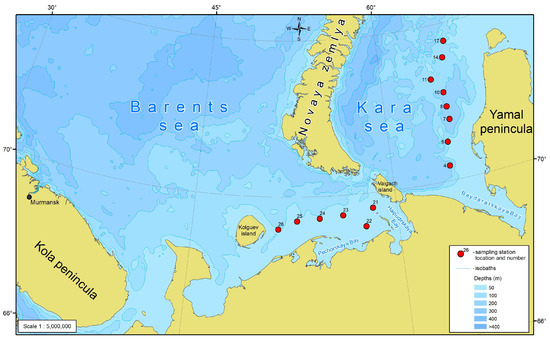
Figure 1.
Study area and the location of sampling stations. For this and further schemes, gridded bathymetry data for the Arctic Ocean area (IBCAO) from GEBCO Digital Atlas (version 2.12) were used.
Oceanographic parameters of water masses (temperature, salinity, turbidity, and fluorescence) were determined by a conductivity-temperature-depth (CTD) continuously profiling the water column surface to bottom using for this purpose an SBE 19 plus sonde equipped with a fluorometer. The data acquired were processed using SBE 19 SEACAT PROFILER manufacturer’s software according to the “SBE 19 SEACAT PROFILER. UserManual, Bellevue, WA, USA”. Seawater samples for phytoplankton, chlorophyll-a, and biogenic elements were collected with 10-L Niskin bottles mounted on a HydroBios multi-water sampler MWS-12. The sampling was carried out at 6 stations in the SEBS and 8 stations in the SWKS at the surface, pycnocline, and near-bottom water levels (the depth of the layers are in Appendix A).
The material collected was processed according to the standard hydrobiological methods: 2 L phytoplankton samples were concentrated by reverse osmosis to a final volume of 4–5 mL and fixed with a 40% formaldehyde solution to a final concentration of 2–4% for subsequent microscopy [27,28]. Taxonomic identification of organisms and cell counts were performed on an Amplival light microscope at a magnification of 400× in a 0.05 mL Nageotte counting chamber according to the standard methodology [29]. The names of species and systematic groups are given according to the nomenclature adopted in electronic sources: AlgaeBase, 2022 [30]; WORMS, 2022 [31]. Biomass was calculated using tables of microalgae mean cell volumes [32].
Seawater sampling, for further chlorophyll-a determination, was sampled in three layers—surface, pycnocline, and near-bottom. The Carousel Water Sampler and “Hydrobios” bathometers (Kiel, Germany) were used. In total, 42 samples were taken and processed. We used methodological recommendations [33,34], based on the classical method for the determination of chlorophyll-a by UNESCO [35]. No deviations from the method were allowed. Water samples with a volume of 5 L for each horizon were filtered immediately in the ship’s laboratory on a vacuum filtration unit. Membrane filters with a diameter of 47 mm and pore size of 0.6 µm were used. After filtration, the filters, folded in half with the sediment inward, were stored in a silica gel desiccator in a freezer at −20 °C. Further processing of samples was carried out in a stationary hydrochemical laboratory. In addition, 90% acetone was used. After homogenizing the filters, the precipitate was centrifuged at 8000 rpm. The concentration of chlorophyll-a in the extract was determined spectrophotometrically on a UV–Visible spectrophotometer Nicolet Evolution 500 (Spectronic Unicam, Cambridge, UK).
Simultaneously, hydrochemical studies were conducted: an assessment of the content of dissolved oxygen and mineral forms of major biogenic elements was carried out. Dissolved oxygen concentration was determined by the Winkler method [36]. Nitrite, nitrate, phosphate, and silicate concentrations were measured on a PE-5300VI spectrophotometer (Ecroskhim Co., Saint Petersburg, Russia). Inorganic dissolved phosphorus (P-PO4) was determined by the Murphy–Riley method, dissolved silicon (Si-SiO3) was measured by the Korolev method, and nitrite (N-NO2) and nitrate (N-NO3) nitrogen was estimated using the Bendschneider–Robinson method [37,38,39].
3. Results
3.1. Hydrological and Hydrochemical Parameters
Distribution of seawater temperature and salinity at investigated transects is shown in Figure 2 and Figure 3. The SWKS was characterized by pronounced pycnocline located at depths of 10–15 m in the mouth of Baydaratskaya Bay (St. 4 and 6) and depths of 25–30 m in the rest stations along the transect. Total temperature and salinity ranges were −1.51–+11.39 °C and 29.08–34.38 ppt, respectively; minimum temperature and salinity values in the upper mixed layer were +8.85 °C and 32.87 ppt, respectively. A layer of seawater with negative temperatures and slightly decreased salinities was detected at all stations at depths ranging from 35 to 60 m, except for stations 4 and 6. This layer is formed by Kara Sea water emerging from convective mixing during winter [40,41]. Below are warmer and saltier waters, most likely of Barents Sea origin [41,42].
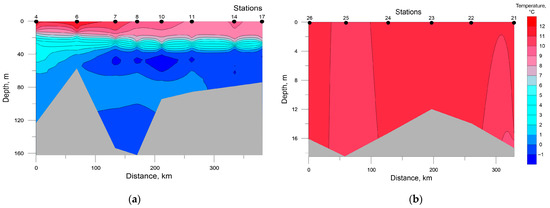
Figure 2.
Distribution of seawater temperature at the investigated transects in the southwestern Kara Sea (a) and the southeastern Barents Sea (b).
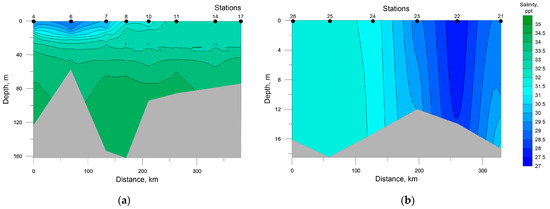
Figure 3.
Distribution of salinity at the investigated transects in the southwestern Kara Sea (a) and the southeastern Barents Sea (b).
In the SEBS, due to shallow depths, the distribution of temperature and salinity was almost homogenous; their values varied in the ranges of 8.81–10.94 °C and 27.52–31.56 ppt, respectively. The minimum values of temperature and maximum values of salinity were recorded at the near-bottom level at station 21 and all the water column at stations 25 and 26.
A salient feature of the distribution of nutrients in SWKS waters was the presence of a significant vertical gradient of values with an intermediate minimum in the pycnocline layer and a maximum at the bottom (Figure 4).
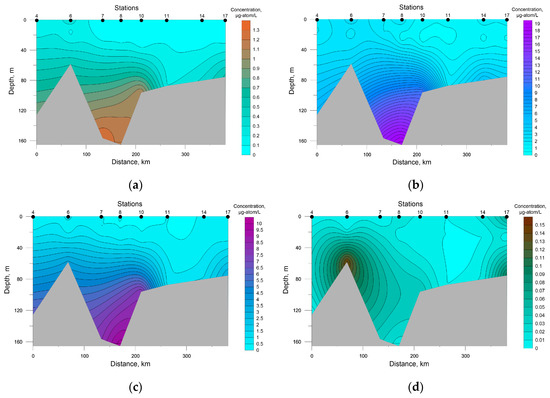
Figure 4.
Distribution of nutrients concentration at the investigated transects in the southwestern Kara Sea; (a) P-PO4, (b) Si-SiO2, (c) N-NO3, (d) N-NO2.
Surface silicon concentration ranged from 0.70 to 1.91 μg-atom/L; its highest value was recorded at station 8, the deepest in this area. The rest of the investigated biogenic elements were characterized by low values at the sea surface with a decrease in the density-jump layer to analytical zero, which must have been a result of the photosynthetic activity of autotrophic biota.
The average concentration in SWKS waters of biogenic elements was: 0.30 ± 0.07 μg-atom/L for phosphates; 0.02 ± 0.01 μg-atom/L for nitrites; 2.15 ± 0.55 μg-atom/L for nitrates; 3.95 ± 1.11 μg-atom/L for silicates. For the upper seawater layer (0–5 m), a significant correlation coefficient between nitrate and phosphate was revealed. The relationship between nitrate and phosphate was almost linear (R2 = 0.96), and the ratio was below 4.0 on average (Figure 5). Nitrate nitrogen was the limiting factor for phytoplankton; an excess of phosphates and silicates at zero nitrate levels was observed. The minimum value of the N/P ratio (0.04) was recorded in the surface layer (station 10) with a low level of silicates of 0.89 μg-atom/L. The distribution of nutrients in this water area had a patchy character; low surface concentrations of both phosphates and nitrates were recorded at stations 7 and 8, while at station 6 surface phosphate and nitrate concentrations were the greatest. At the same time, the Si/P ratio at stations 7 and 8 and station 6 averaged 51.8 and 9.5, respectively. Such a situation indicates the presence of different water masses in these areas [43,44].
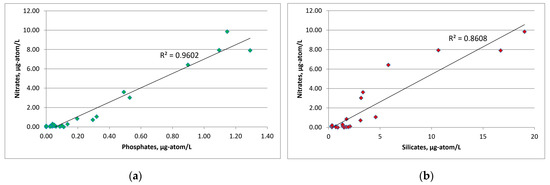
Figure 5.
Graphs of the dependence of nitrates on phosphates (a) and nitrates on silicates (b) over the entire water area under investigation.
In the SEBS, biogenic elements were characterized by low values and homogenous spatial distribution (Figure 6). The average value of the weighted average for phosphates over the SEBS water area was 0.14 ± 0.03 μg-atom/L, for silicates it was 3.79 ± 0.79 μg-atom/L, for nitrites it amounted to 0.01 μg-atom/L, and for nitrates it equaled 0.13 ± 0.03 μg-atom/L. The maximum concentrations were recorded in the east of the water area under study at stations 22 and 23, in the zone of freshwater runoff. The most significant correlations were found between salinity and phosphates (r = −0.79, R2 = 0.62) and between salinity and silicates (r = −0.71, R2 = 0.52). The N/P ratio was on average low (0.60), which indicates a deficiency in nutrients [39]. At stations 25 and 26, zero values of nitrites and nitrates were recorded at the surface and near-bottom water levels with the lowest silicon concentrations of 1.73 μg-atom/L and 0.65 μg-atom/L on the surface and at the bottom, respectively.
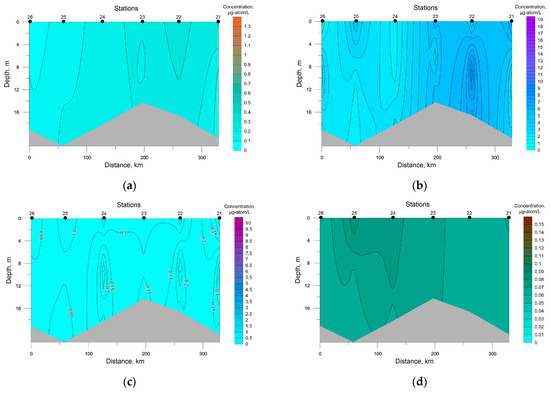
Figure 6.
Distribution of nutrients concentration at the investigated transects in the southeastern Barents Sea; (a) P-PO4, (b) Si-SiO2, (c) N-NO3, (d) N-NO2. Note: The value bar for this figure and Figure 4 is unified.
Surface chlorophyll-a concentration in the SWKS (maximum observed values 0.45 mg/m3) did not exceed 0.45 mg/m3 (0.22 ± 0.15 mg/m3 on average). In the pycnocline zone, its values ranged from 0.15 to 0.41 mg/m3, with some stations exhibiting values below the level of detectability for the method applied. At the bottom water level, a similar situation was observed at most stations with chlorophyll-a concentration ranging from 0.07 to 0.12 mg/m3 (Figure 7).
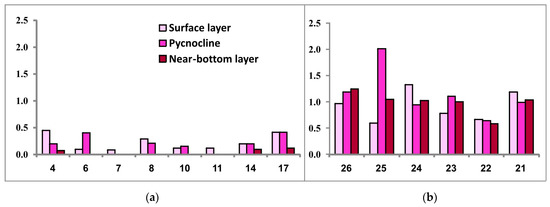
Figure 7.
Chlorophyll-a concentration (μg/L) in the three investigated seawater layers at sampling stations located in the southwestern Kara Sea (a) and the southeastern Barents Sea (b).
In the SEBS, due to shallow depths, chlorophyll-a was almost evenly distributed throughout the water column. Surface chlorophyll-a maximum reached 1.48 mg/m3 (0.92 ± 0.29 mg/m3 on average). In the pycnocline layer, chlorophyll-a concentration averaged 1.15 ± 0.46 mg/m3, with a maximum of 2.02 mg/m3. Near-bottom chlorophyll-a concentration did not exceed 1.24 mg/m3 (0.99 ± 0.22 mg/m3 on average). Low average chlorophyll-a concentrations in the photic layer, 0.24 ± 0.13 mg/m3 in the SWKS and 1.02 ± 0.33 mg/m3 in the SEBS, and the proportion of pheophytin > 50% in both regions, are typical for the late-summer and autumn stages of the seasonal succession of pelagic algal communities [45].
An assessment of photosynthetic pigments contents by the fluorescence value demonstrates a similar picture (Figure 8).
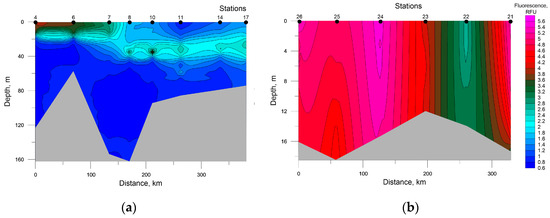
Figure 8.
Distribution of seawater fluorescence at the investigated transects in the southwestern Kara Sea (a) and the southeastern Barents Sea (b).
Two layers with increased values of this parameter were identified at the transect in the Kara Sea. One layer was found at stations 4, 6, and 7 at 0–20 m depth. The other was observed at stations 8, 10, 14, and 17 between 25 and 40 m depths, which bears relation to the presence of the thermocline whose vertical temperature gradient is 0.4 °C/m. At the transect in the Barents Sea, fluorescence maximums were registered in a surface layer at station 26 and throughout the water column at station 24.
Data on turbidity distribution were used as one of the important parameters of inhomogeneity of the water column (Figure 9). There are even observations [46] indicating a possible direct correlation between the opacity/transparency of the pelagic and the abundance of phytoplankton communities. However, no such relationship was observed in our studies (see Figure 7).
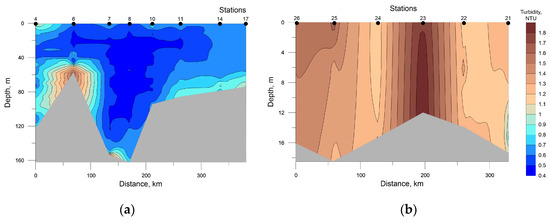
Figure 9.
Distribution of seawater turbidity at the investigated transects in the southwestern Kara Sea (a) and the southeastern Barents Sea (b).
The highest values of turbidity in the SWKS were recorded in the bottom layer at stations 6 and 7 due to the location close to the shore (see Figure 1). In the SEBS at station 23 in the surface to the bottom layer, a local maximum was registered, most likely caused by the Pechora River runoff.
3.2. Qualitative and Quantitative Phytoplankton Parameters
A complete inventory of microalgae taxa found in the studied area is shown in Table 1. It includes 35 organisms identified at the species level, as well as unidentified representatives of several genera and large taxa of various ranks [47].

Table 1.
Taxonomic inventory of phytoplankton in the seawater regions under consideration: on a light gray background—species found only in the SWKS; on dark gray—only in SEBS; on white—in both regions.
According to their taxonomic position, 15 algae species belong to the algal class Bacillariophyceae, 16 species belong to the class Dinophyceae, and the remaining 4 species are members of the classes Ebriophyceae (Ebria tripartita), Dictyochophyceae (Octactis speculum), Prasinophyceae (Polyasterias problematica), and Pyramimonadophyceae (Halosphaera viridis). By phytogeographic affiliation, 10 species are of arcto-boreal origin, 9 are boreal species, and 16 are cosmopolitans. Ecologically, 21 species were identified as neritic, 7 as oceanic, and another 7 as panthalassic species.
A comparison of the two bodies of seawater under consideration revealed the following features between them. Among the microalgae taxa found across the entire water area under study (quantitative parameters of virtually every taxon were very similar in both water bodies), 5 species belonged to diatoms, 8 species belonged to dinophytes, and 1 species, E. tripartita, was a member of the Class Ebriophyceae. Five species had arcto-boreal origin, 1 species was boreal, and 8 species were cosmopolitans. According to ecological characteristics, 9 neritic species, 3 oceanic ones, and 2 panthalassic ones were identified. Among the organisms registered only in the SWKS, diatoms and dinoflagellates made up equal proportions of 6 species each; members of other taxonomic groups, O. speculum, P. problematica, and H. viridis, were also found. The phytogeographic structure of this algal community included 4 arcto-boreal, 3 boreal, and 8 cosmopolitan species. Ecologically, it consisted of 7 neritic types, 4 oceanic ones, and 4 panthalassic ones. In the SEBS, species found only in this seawater body included 4 diatoms and 2 dinophytes, 5 boreal and 1 arcto-boreal type, and 5 neritic and 1 panthalassic one.
This inventory indicates that, in general, pelagic microalgae communities in these two arctic bodies of seawater were characterized by a complete dominance of members of two algal classes, Bacillariophyceae and Dinophyceae, in approximately equal proportions. At the same time, organisms belonging to all three phytogeographic groups typical for the regions under consideration and to three main ecological groups were registered, with the exception of freshwater and reliably identified types of microphytobenthos.
All the studied water areas were dominated by neritic algal flora; panthalassic and oceanic types played a much lesser role and were not registered at all in the SEBS region. All the above-mentioned features can be generally regarded as typical for Arctic pelagic ecosystems. No significant differences were revealed between the SEBS and SWKS pelagic algal communities, neither between the taxonomic nor between the phytogeographic and ecological structures. The list of species found only in the SEBS is poorer, but this might be due to observations being carried out only in a single, rather narrow, coastal water area of this seawater body [23].
We came across a somewhat different picture when examining the spatial distribution of the dominant microalgae types. The abundance (Appendix A, Table A1) was primarily dominated by small unidentified diatoms, dinophytes, and euglena algae reaching high concentrations throughout the studied water areas. Further, in the SEBS, a large share was occupied by the diatoms Thalassiosira decipiens, Thalassionema nitzschioides, and Paralia sulcata. Their abundance was much lower in the SWKS, with the first one being absent altogether. As for phytoplankton biomass, the following picture was observed: Chaetoceros borealis and Tripos longipes dominated the biomass over the whole investigated water area, Dinophysis norvegica and Scrippsiella trochoidea, though belonging in both water bodies, held leading positions only in the SWKS, and P. sulcata, T. nitzschioides, and Tripos fusus prevailed only in the SEBS. Among dominants were also Leptocylindrus danicus, Tripos arcticus, Gonyaulax sp., Gyrodinium lachryma, and Protoperidinium brevipes; Halosphaera viridis registered only in SWKS waters and T. decipiens and Tripos horridus found only in the SEBS. Thus, these two algal communities demonstrate quite pronounced differences from each other: the bulk of the biomass is dominated by different species including those developing in only one of the two seawater bodies. In addition, if the SWKS community lacks species exhibiting an appreciable dominance in abundance, with a significant number of species dominating the biomass and registered only in this water body, in the SEBS, the opposite situation takes place.
At the same time, one manifested feature of the spatial distribution, characteristic of all identified phytoplankton organisms without exception, attracts our attention, i.e., none of the species were recorded at all investigated stations. Even species exhibiting absolute dominance in abundance or biomass reached their significant average values due to very high concentrations within a limited water area often encompassing no more than 2–3 stations, while in the rest of the water areas, their abundances were minimal or null.
As for the general quantitative parameters, they also show differences between the communities in the SEBS and SWKS (Table 2, Figure 10 and Figure 11).
Table 2.
Total abundance (thousand cells/L, numbers above the lines) and biomass (μg/L, numbers below the lines) of phytoplankton in the water areas under investigation.
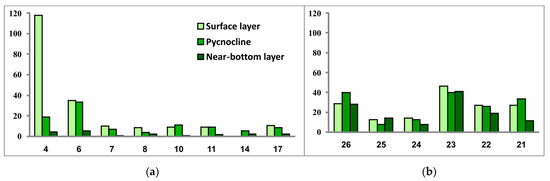
Figure 10.
Phytoplankton abundance (thousand cells/L) in the three investigated seawater layers at sampling stations located in the southwestern Kara Sea (a) and the southeastern Barents Sea (b).

Figure 11.
Phytoplankton biomass (μg/L) in the three investigated seawater layers at sampling stations located in the southwestern Kara Sea (a) and the southeastern Barents Sea (b).
In general, the range of variations between phytoplankton abundance and biomass values over the studied water areas was not significant, except for algal communities at stations 4 and 6 located in the mouth of Baydaratskaya Bay. If diatoms Skeletonema costatum and, to a lesser extent, Leptocylindrus danicus and L. minimus (only at stations 4 and 6 these both species were not registered) entirely prevailed in the abundance, then the biomass was dominated by the dinoflagellate Tripos longipes, with a secondary part played by the dinophytes Gonyaulax sp. and Dinophysis norvegica, the diatoms Chaetoceros borealis and Leptocylindrus danicus (Station 4), and Rhizosolenia hebetata found only at stations 4 and 6 in the surface water layer. Thus, this is another manifestation of the above-described patchiness in the spatial distribution of microalgae.
Comparison of the general values of phytoplankton abundance and biomass between two regions (excluding the community at Station 4) revealed higher levels of both in the SEBS—on average about twice as high as in the SWKS. The SEBS community also demonstrated greater variations of values of these two parameters between sampling stations.
In the SEBS, the vertical phytoplankton structure can be considered homogeneous throughout the water column. The SWKS was characterized by very similar values of phytoplankton abundance in the surface and density-jump layers and by much lower values in the near-bottom layer. The latter is explainable by the difference in the bottom relief: the SWKS has depths of about 100 m and more while the depth range in the shallow SEBS is 12–22 m.
Based on the foregoing comparison of the two phytoplankton communities under study, it seems necessary to highlight the following important similarities. In both algal communities, microalgae species belonging to the spring group were completely absent, even in single quantities. Of the total number of identified organisms, 40% were recorded in both seawater regions. Among the phytoplankters recorded in both the SEBS and SWKS, only arcto-boreal species, mainly oceanic, dominated the biomass. Among those found only in the SEBS region, boreal neritic demonstrated high biomass values. Among the phytoplankters found only in the SWKS region, the biomass was dominated by cosmopolitans and arcto-boreal species of various ecological groups. Among dominants, either common to both seawater regions or found only in one of them, almost equal proportions were shared by large-celled centric diatoms and dinoflagellates. Microalgae not exhibiting high abundance values were distinguished by a greater degree of patchiness in spatial distribution since they were present at a smaller number of stations and not in all seawater layers.
4. Discussion
The current pattern in the region is rather complicated and there are three major systems of water circulation (Figure 12). The first is the cyclonic (anticlockwise) gyre of the SEBS being seen at least during the spring–summer period [16,17,18,48]. Its southern portion is formed by the streams of the Kanin, White Sea, Kolguev-Pechora, and Pechora currents, whereas the northern boundary is formed by the Litke Current, penetrating from the Kara Sea and going further to the north along the western coast of Novaya Zemlya [49]. The second system is the clockwise circulation which contours the Novaya Zemlya coast [50]. The Litke Current forms its western part, and the East Novaya Zemlya Current the eastern one [51]. The latter forms the right semicircular component of the cyclonic gyre of the southwestern Kara Sea, while in the east this gyre is closed by the Yamal and Ob-Yamal currents starting from the coast of the Yamal Peninsula [52]. The result of those is a stable, diverse network of water exchange between the SEBS and the SWKS running through the Kara Gates and the Yugorsky (Yugor) Strait. We have all grounds to believe that there is also a drift of organisms resulting in the phytoplankton of the SEBS playing a decisive role in shaping the pelagic algal flora in the entire Novaya Zemlya phytogeographic province, given that the transfer of seawater from west to east dominates [14].
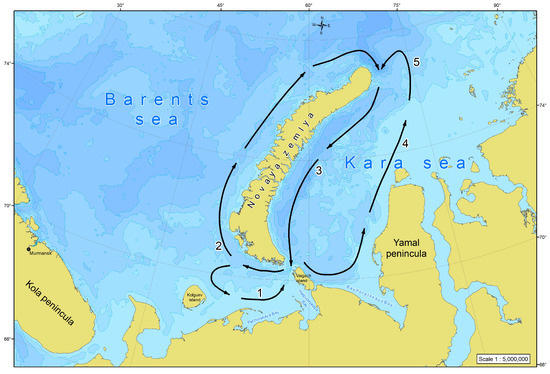
Figure 12.
A schematic presentation of the major components of the water circulation in the south-eastern Barents Sea and the south-western Kara Sea: (1) Kanin, White Sea, Kolguev-Pechora, and Pechora currents; (2) Litke Current; (3) East Novaya Zemlya Current; (4) Yamal Current; (5) Ob-Yamal Current (given by: [14]).
An analysis of the results of past studies carried out in these water areas, overall, confirms this hypothesis. Planktonic microalgae communities in the SEBS and the SWKS consist mainly of arcto-boreal neritic species with a high proportion of cosmopolitans. Not only are the SEBS and the SWKS characterized by the dominance of arcto-boreal types of organisms in the pelagic zone, but other Arctic marginal shelves display this feature. Moreover, all these water areas exhibit a great similarity in the composition of the dominant groups [11,12,53]. The rest of the ecological and phytogeographical groups do not occupy leading positions in the ecosystems of these areas. The presence of boreal (warm water) elements in them can be explained by the influence of transformed Atlantic waters. The contribution of cryophilic flora, mainly pennate diatoms, to microalgae communities in the SEBS and SWKS is insignificant and tends to be minimal during the open-water season since these are seasonally ice-covered regions [47]. Major differences in the taxonomic composition of pelagic algal communities in these regions are found among microphytobenthic and freshwater organisms, but these are allochthonous and uncharacteristic components and therefore can be neglected.
Our observations encompassing the winter and spring periods, starting from the 1980s [54,55], also confirm the similarity of communities in these two seawater bodies. The timing of the beginning of the phytoplankton growing season and the set of dominants in the SEBS and the SWKS are very close. This stage differs only in the presence of single specific taxa in certain areas and small deviations in the calendar dates of the onset of the phytoplankton bloom maximum [54,55].
However, all the published sources examined have one significant drawback, i.e., they hardly address the summer and autumn phases of the annual cycle of phytoplankton succession. The conclusion about the uniformity of species compositions in these regions is based mainly on a comparison of groups of species that provide spring bloom peaks. This approach can be justified by the fact that these are the species that dominate the pelagic zone in terms of abundance and/or biomass. This ultimately leads to the logical conclusion about the uniformity of the single-celled algal flora in all northern seas, called pan-Arctic [11] or ice-neritic [10]. Moreover, even those studies that submit a full list of species are without consideration of species typical for the summer–autumn period, since they do not provide abundance levels comparable to the spring season and are spatially distributed in a patchiness-like manner, occurring and reaching high concentrations only in the certain areas. However, it should not be forgotten that such a picture is generally typical of marine phytoplankton communities in the summer phase of the phytoplankton annual production cycle [56]. Species dominating abundance and biomass at this very stage of their development, even for a short time and in a limited area, should nevertheless be included in the comparative floristic analysis.
In this regard, the results of the investigation presented in this research are of particular value, since they make it possible to fill the above-mentioned gap and make the necessary adjustments to the definition of the biogeographic statuses of the seawater regions under study. The previous section of this article explicitly illustrates significant differences between the SEBS and SWKS waters in terms of hydrological and hydrochemical parameters. The cause of this is the difference in depths and the dynamics of currents. The consequence, in turn, is the difference in the absolute values of the abundance and biomass of microalgae.
The analysis performed gives reasons to assert that the pelagic algal communities in the seawater regions under comparison, despite these differences, were at the same stage of the seasonal succession and characterized by high similarity of their composition, both taxonomic and ecologic and phytogeographic [55]. It should be specially emphasized that during our investigations no spring phytoplankton species were found in the pelagic and no high abundance levels of microalgae were observed, which is characteristic of the spring phase of the annual phytoplankton vegetation in the Barents and Kara Seas [14,23,25,54].
Thus, during our studies, pelagic algal communities in both seawater bodies were by all indications in a state typical for the late summer–early autumn stage of succession. The thermohaline structure of the water column fully corresponded to this very phase of the annual hydrological cycle well studied both in the SEBS [57] and in the SWKS [41]. Average and peak concentrations of nutrients were typical for the given season and did not exhibit any noticeable differences from those reported earlier for this period of the year both for the SEBS [58,59,60] and for the SWKS [61,62,63,64].
Chlorophyll-a concentrations and its spatial distribution were well consistent with those reported in the literature for September in different years for the SEBS [65,66] and the SWKS [67,68]. Summer and autumn values of this parameter are lower compared to spring ones; the duration of peaks is shorter as well [55,69]. In general, the open part of the Kara Sea is characterized by low chlorophyll-a concentrations (about 0.2–0.5 mg/m3) [64]. In September 1993, its mean value in the photosynthesis layer in open waters of the sea was 0.2–1.8 mg/m3 [67]. Chlorophyll-a levels in September 2007 in the euphotic layer varied from 0.02 mg/m3 to 4.37 mg/m3, averaging 0.76 mg/m3 [68]. According to multi-year observations for September, the concentration of this pigment in the Kara Sea varied in a range of 0.2–6 mg/m3. Values exceeding 3 mg/m3 were observed in areas experiencing high river runoff impact [70]. In the Pechora Sea (SEBS region) in August and September 1998, surface chlorophyll-a levels varied in a range of 0.08–1.15 mg/m3 with a 2.4-fold increase when moving from central deep parts of the sea to coastal areas with shallow water [65]. During active vegetation of microalgae in June 1995, the average chlorophyll-a concentration was about 6 mg/m3 [71]. Its increased values recorded by us in the SWKS in autumn compared to the SEBS are most likely caused by the Pechora River runoff. Previous studies had also found that phytoplankton abundance and biomass values in the Pechora Sea (SEBS) region are higher than in the open Barents Sea [55].
A comparison of the species composition and abundance and biomass of phytoplankton with those reported earlier for the same season for the SEBS [23,72,73] and the SWKS [22,53] suggests similar conclusions. Both general taxonomic inventories and lists of dominant species, and absolute abundance and biomass values are consistent with each other. This, by the way, provides a conclusion about the weak inter-annual variability of these parameters. The latter in turn results from a long-established fact that the range of long-term fluctuations of climate-driven factors is extremely small in these seawater regions [20,21,74].
Thus, we can make a convincing conclusion that pelagic algal communities in the regions under comparison were in a state corresponding to the same phase of the seasonal succession and characterized by a substantial similarity in qualitative composition, including ecological and phytogeographical belonging. Still, at the same time, differences in hydrological parameters in the water areas under examination have a certain impact on the taxonomic structure of phytoplankton communities and the general level of their qualitative values.
5. Conclusions
The data acquired suggest the existence of floristic integration between the southeastern Barents Sea and the southwestern Kara Sea, the main mechanism of which is a stable seawater exchange between these seawater regions. Along with this, existing significant differences in hydrological and hydrochemical parameters in seawater regions under consideration cause different abundance levels, but at the same time do not affect the qualitative composition of algal flora.
In general, the situation described confirms the hypothesis of the floristic unity of the SEBS and SWKS regions. However, for this hypothesis to be ultimately and conclusively verified, further investigations involving comparisons with the summer–autumn state of pelagic algal communities in other regions of the Arctic Basin would be of great value. To date, these data are few or nonexistent.
In addition, the results of the analysis of previous studies display low degree of variability of long-term phytoplankton dynamics in both seawater regions. It is noteworthy that this situation has continued to be observed during recent years under global climate-driven and hydrological changes occurring in the Arctic Ocean and affecting all components of the biota [3]. Such conservatism of the SEBS and SWKS phytoplankton will undoubtedly be of great importance in resolving ecological problems in the region.
In conclusion, we cannot but emphasize that results of our study will undoubtedly be an important step for further investigations of biogeographic status of the pelagic algal communities of Arctic seas.
Author Contributions
Conceptualization, P.R.M.; methodology, P.R.M.; formal analysis, P.R.M., V.V.L., V.V.V., E.D.O. and T.G.I.; investigation, P.R.M., V.V.L., V.V.V. and T.G.I.; data curation, P.R.M., V.V.L., V.V.V., E.D.O. and T.G.I.; visualization, P.R.M., V.V.L., V.V.V., E.D.O. and T.G.I.; writing—original draft preparation, P.R.M., V.V.L., V.V.V. and T.G.I. All authors have read and agreed to the published version of the manuscript.
Funding
This study was funded by the Ministry of Science and Higher Education of the Russian Federation.
Institutional Review Board Statement
Not applicable.
Informed Consent Statement
Not applicable.
Data Availability Statement
The data are available on request from the corresponding author.
Acknowledgments
We are grateful to the staff of the Plankton Laboratory of MMBI RAS, T.M. Maksimovskaya and A.A. Deryabin for their assistance in the sampling and processing of the materials.
Conflicts of Interest
The authors declare no conflict of interest.
AppendixA
Table A1.
Abundance (thousand cells/L, numbers above the lines) and biomass (μg/L, numbers below the lines) of dominant phytoplankton species (reaching more than 10% of the abundance or biomass in samples) in the water areas under investigation.
Table A1.
Abundance (thousand cells/L, numbers above the lines) and biomass (μg/L, numbers below the lines) of dominant phytoplankton species (reaching more than 10% of the abundance or biomass in samples) in the water areas under investigation.
| Southwestern Kara Sea | |||||||||
|---|---|---|---|---|---|---|---|---|---|
| Station | 4 | 6 | 7 | ||||||
| Seawater Level | 0.5 m | 16 m | 105 m | 0.5 m | 13 m | 57 m | 0.5 m | 11 m | 155 m |
| Chaetoceros borealis | 785.37 20.50 | 200.00 5.22 | 400.00 10.44 | 310.00 8.09 | 635.30 16.58 | ||||
| Leptocylindrus danicus | 18,512.18 42.13 | 800.00 1.82 | 219.51 0.50 | ||||||
| Paralia sulcata | 1976.80 2.77 | ||||||||
| Rhizosolenia hebetata | 560.98 15.09 | 266.70 7.17 | |||||||
| Thalassionema nitzschioides | 2804.88 2.58 | 1100.00 1.01 | 4650.00 4.28 | 697.70 0.64 | 988.50 0.91 | ||||
| Tripos arcticus | 112.20 8.31 | 98.90 7.32 | 127.10 9.41 | ||||||
| Tripos fusus | |||||||||
| Tripos longipes | 673.17 71.52 | 100.00 10.62 | 800.00 84.99 | 155.00 16.47 | 98.90 10.51 | ||||
| Dinophysis norvegica | 448.78 9.50 | 200.00 4.24 | 1066.70 22.59 | 852.50 18.05 | 232.60 4.93 | 889.70 18.84 | |||
| Gyrodinium lachryma | 50.00 3.24 | 127.10 8.24 | |||||||
| Protoperidinium brevipes | 560.98 5.41 | 100.00 0.97 | 400.00 3.86 | 542.50 5.23 | 1581.60 15.26 | 889.40 8.58 | |||
| Protoperidinium pallidum | |||||||||
| Southwestern Kara Sea | |||||||||
| Station | 8 | 10 | 11 | ||||||
| Seawater level | 0.5 m | 13 m | 164 m | 0.5 m | 14 m | 97 m | 0.5 m | 30 m | 85 m |
| Chaetoceros borealis | |||||||||
| Leptocylindrus danicus | |||||||||
| Paralia sulcata | |||||||||
| Rhizosolenia hebetata | |||||||||
| Thalassionema nitzschioides | 127.70 0.12 | ||||||||
| Tripos arcticus | |||||||||
| Tripos fusus | 112.90 7.05 | ||||||||
| Tripos longipes | 118.20 12.56 | ||||||||
| Dinophysis norvegica | 451.80 9.57 | ||||||||
| Gyrodinium lachryma | 255.40 16.55 | 177.30 11.49 | 263.50 17.07 | ||||||
| Protoperidinium brevipes | 1085.50 10.47 | 677.60 6.54 | 329.40 3.18 | 183.10 1.77 | 390.60 3.77 | ||||
| Protoperidinium pallidum | 130.20 10.62 | ||||||||
| Southwestern Kara Sea | |||||||||
| Station | 14 | 17 | |||||||
| Seawater level | 0.5 m | 22 m | 79 m | 0.5 m | 25 m | 74 m | |||
| Chaetoceros borealis | |||||||||
| Leptocylindrus danicus | |||||||||
| Paralia sulcata | |||||||||
| Rhizosolenia hebetata | |||||||||
| Thalassionema nitzschioides | |||||||||
| Tripos arcticus | 35.70 2.64 | ||||||||
| Tripos fusus | 71.40 4.46 | 59.50 3.72 | |||||||
| Tripos longipes | |||||||||
| Dinophysis norvegica | |||||||||
| Gyrodinium lachryma | 71.40 4.63 | ||||||||
| Protoperidinium brevipes | 90.00 0.87 | 115.90 1.12 | 642.90 6.20 | 119.10 1.15 | |||||
| Protoperidinium pallidum | |||||||||
| Southeastern Barents Sea | |||||||||
| Station | 21 | 22 | 23 | ||||||
| Seawater level | 0.5 m | 12 m | 19 m | 0.5 m | 9 m | 14 m | 0.5 m | 6 m | 11 m |
| Chaetoceros borealis | |||||||||
| Paralia sulcata | 837.20 1.17 | 1101.20 1.54 | 846.00 1.18 | 1451.90 2.03 | 1594.60 2.23 | 2147.60 3.01 | 4229.30 5.92 | 7616.00 10.66 | 4917.10 6.88 |
| Thalassionema nitzschioides | 6802.30 6.26 | 8258.90 7.60 | 4230.00 3.89 | 3387.70 3.12 | 4556.00 4.19 | 2538.10 2.34 | 14,429.20 13.28 | 5984.00 5.51 | 15,024.40 13.82 |
| Thalassiosira decipiens | 5860.40 64.89 | 6240.00 69.09 | 2115.00 23.42 | 6291.50 69.66 | 8884.20 98.37 | 3904.80 43.23 | 746.30 8.26 | 340.00 3.76 | 1912.20 21.17 |
| Tripos fusus | 104.70 6.54 | 52.90 3.30 | |||||||
| Tripos horridus | |||||||||
| Tripos longipes | 314.00 33.36 | 1284.70 136.48 | 528.80 56.17 | 605.00 64.27 | 569.50 60.50 | 536.90 57.04 | 272.00 28.90 | 546.30 58.04 | |
| Dinophysis norvegica | 314.00 6.65 | 105.80 2.24 | 113.90 2.41 | ||||||
| Scrippsiella trochoidea | 373.20 1.46 | 272.00 1.06 | |||||||
| Southeastern Barents Sea | |||||||||
| Station | 24 | 25 | 26 | ||||||
| Seawater level | 0.5 m | 10 m | 16 m | 0.5 m | 11 m | 21 m | 0.5 m | 9 m | 17 m |
| Chaetoceros borealis | 307.10 8.02 | 310.40 8.10 | 423.50 11.05 | 481.90 12.58 | 232.90 6.08 | 1268.30 33.10 | 103.50 2.70 | ||
| Paralia sulcata | 614.30 0.86 | 1655.20 2.32 | 338.80 0.47 | 2168.60 3.04 | 931.80 1.31 | 2790.30 3.91 | 1035.30 1.45 | 1400.00 1.96 | |
| Thalassionema nitzschioides | 1023.80 0.94 | 620.70 0.57 | 1694.00 1.56 | 2168.60 2.00 | 2174.10 2.00 | 3804.90 3.50 | 2277.70 2.10 | 4200.00 3.86 | 3767.40 3.47 |
| Thalassiosira decipiens | 1842.80 20.40 | 3724.20 41.23 | 1185.80 13.13 | 3373.40 37.35 | 1708.20 18.91 | 4058.60 44.94 | 19,049.50 210.92 | 29,600.00 327.73 | 20,930.00 231.74 |
| Tripos fusus | 102.40 6.40 | 103.50 6.47 | 169.40 10.58 | 155.30 9.70 | 104.70 6.54 | ||||
| Tripos horridus | 511.90 61.43 | 103.50 12.42 | 42.40 5.09 | 60.20 7.22 | 77.60 9.31 | 126.80 15.22 | |||
| Tripos longipes | 819.00 4.01 | 672.40 3.30 | 677.60 3.32 | 241.00 25.60 | 100.00 10.62 | 104.70 11.12 | |||
| Dinophysis norvegica | 103.50 2.19 | ||||||||
| Scrippsiella trochoidea | |||||||||
References
- Karlusich, J.J.P.; Ibarbalz, F.M.; Bowler, C. Exploration of marine phytoplankton: From their historical appreciation to the omics era. J. Plankton Res. 2020, 42, 595–612. [Google Scholar] [CrossRef]
- Ji, R.; Edwards, M.; Mackas, D.L.; Runge, J.A.; Thomas, A.C. Marine plankton phenology and life history in a changing climate: Current research and future directions. J. Plankton Res. 2010, 32, 1355–1368. [Google Scholar] [CrossRef] [PubMed]
- Ardyna, M.; Arrigo, K.R. Phytoplankton dynamics in a changing Arctic Ocean. Nat. Clim. Chang. 2020, 10, 892–903. [Google Scholar] [CrossRef]
- Barton, A.D.; Pershing, A.J.; Litchman, E.; Record, N.R.; Edwards, K.F.; Finkel, Z.V.; Kiørboe, T.; Ward, B.A. The biogeography of marine plankton traits. Ecol. Lett. 2013, 16, 522–534. [Google Scholar] [CrossRef] [PubMed]
- Rat’kova, T.N.; Wassmann, P. Seasonal variation and spatial distribution of phyto- and protozooplankton in the central Barents Sea. J. Mar. Syst. 2002, 38, 47–75. [Google Scholar] [CrossRef]
- Oziel, L.; Neukermans, G.; Ardyna, M.; Lancelot, C.; Tison, J.-L.; Wassmann, P.; Sirven, J.; Ruiz-Pino, D.; Gascard, J.-C. Role for Atlantic inflows and sea ice loss on shifting phytoplankton blooms in the Barents Sea. J. Geophys. Res. 2017, 122, 5121–5139. [Google Scholar] [CrossRef]
- Moiseev, P.A. Biotopic approach to the study of biological resources of the World Ocean. In Biotopic Basis for the Distribution of Marine Organisms; Moiseev, P., Ed.; Nauka: Moscow, Russia, 1986; pp. 3–6. [Google Scholar]
- Okolodkov, Y.B. Dinoflagellates (Dinophyceae) of the Seas of the Eurasian Arctic. Ph.D. Thesis, SPb University, St. Petersburg, Russia, 2000. [Google Scholar]
- Ilyash, L.V.; Zhitina, L.S. Comparative analysis of the species composition of diatoms of the ice of the seas of the Russian Arctic. J. Gen. Biol. 2009, 70, 143–154. [Google Scholar]
- Vinogradova, L.A.; Gruzov, L.V. On biocenological zoning of the epipelagic zone of the North Atlantic and adjacent regions. Trudy GOIN 1990, 182, 112–133. [Google Scholar]
- Guillard, R.R.L.; Kilham, P. The ecology of marine planktonic diatoms. In The Biology of Diatoms; Werner, D., Ed.; Blackwell Sci. Publ.: Oxford, UK, 1977; pp. 372–469. [Google Scholar]
- Heimdal, B.R. Arctic Ocean phytoplankton. In The Arctic Seas: Climatology, Oceanography, Geology and Biology; Herman, Y., Ed.; Van Nostrand Reinhold: New York, NY, USA, 1989; pp. 123–146. [Google Scholar] [CrossRef]
- Williams, W.T.; Bunt, J.S.; John, R.D.; Abel, D.J. The community concept and the phytoplankton. Mar. Ecol. Prog. Ser. 1981, 6, 115–121. [Google Scholar] [CrossRef]
- Druzhkov, N.V.; Makarevich, P.R. Comparison of the phytoplankton assemblages of the southeastern Barents Sea and southwestern Kara Sea: Phytogeographic status of the regions. Bot. Mar. 1999, 42, 103–115. [Google Scholar] [CrossRef]
- Grönlund, L.; Kuznetsov, L.L.; Fomin, O.K.; Leppanen, J.-M.; Makarevich, P.R. Hydrography, chemistry, chlorophyll-a, phytoplankton and zooplankton species composition and biomass in the Pechora Sea in 1993. In Pechora Sea Ecological Studies in 1993; Finnish-Russian Offshore Technology Working Groupe. Rep. B5,: Helsinki, Finland, 1994; pp. 3–34. [Google Scholar]
- Grönlund, L.; Kuznetsov, L.L.; Fomin, O.K.; Leppanen, J.-M.; Larionov, V.V. Plankton production, nutrient concentration and hydrography at the Pechora Sea, in 1994. In Pechora Sea Ecological Studies in 1993; Finnish-Russian Offshore Technology Working Groupe. Rep. B6: Helsinki, Finland, 1995; pp. 3–30. [Google Scholar]
- Grönlund, L.; Kuznetsov, L.L.; Druzhkov, N.V. Hydrology of the Pechora Sea, the Pechora Bay and the Cheshskaya Bay. In Pechora Sea Ecological Studies in 1992–1995; Final Report; Finnish-Russian Offshore Technology Working Groupe. Rep. B13: Helsinki, Finland, 1997; pp. 15–28. [Google Scholar]
- Matishov, G.G.; Ilyin, G.V.; Matishov, D.G. General regularities of oceanological regime and the oceanographic conditions of the ice-free period. In Ecosystems, Bio-Resources and Anthropogenic Pollution of the Pechora Sea; Matishov, G., Ed.; KSC RAS Publ.: Apatity, Russia, 1996; pp. 25–39. [Google Scholar]
- Druzhkov, N.V.; Grönlund, L.; Kuznetsov, L.L. The phytoplankton of the Pechora Sea, the Pechora Bay and the Cheshskaya Bay. In Pechora Sea Ecological Studies in 1992–1995; Final Report. Finnish-Russian Offshore Technology Working Groupe. Rep. B13: Helsinki, Finland, 1997; pp. 41–52. [Google Scholar]
- Loeng, H. Ecological features of the Barents Sea. In Proceedings of the 6th Conference of the Comite Arctique International, Fairbanks, Alaska, 13–15 May 1985; E.J.Brill: Leiden, The Netherlands, 1989; pp. 327–365. [Google Scholar]
- Danilov, A.; Mironov, E.; Spichkin, V. (Eds.) Variability of Natural Conditions in the Shelf Zone of the Barents and Kara Seas; AANII Publ.: St. Petersburg, Russia, 2004. [Google Scholar]
- Sukhanova, I.N.; Flint, M.V.; Georgieva, E.Y.; Lange, E.K.; Kravchishina, M.D.; Demidov, A.B.; Nedospasov, A.A.; Polukhin, A.A. Structure of phytoplankton communities in the eastern part of the Laptev Sea. Oceanology 2017, 57, 86–102. [Google Scholar] [CrossRef]
- Larionov, V.V. Features of the annual development cycle of phytoplankton communities in different regions of the Pechora Sea. In Modern Ecological, Biological and Chemical Research, Technology and Production Technology, Materials of the International Scientific and Practical Conference; Murmansk State Technical University Publ.: Murmansk, Russia, 2016; pp. 196–202. [Google Scholar]
- Khaylov, K.M.; Yurchenko, Y.Y.; Snigirev, S.M. From the Plant to the Biosphere: Anti-Textbook; Druk: Odessa, Ukraine, 2005; p. 271. [Google Scholar]
- Makarevich, P.R.; Druzhkova, E.I. Functioning of the pelagic and cryopelagic ecosystems in ice-covered areas of the Barents and Kara Seas. In Biology and Oceanography of the North Sea Route: The Barents and the Kara Seas; Matishov, G., Ed.; KSC RAS Publ.: Apatity, Russia, 2007; pp. 50–63. [Google Scholar]
- Wang, Y.; Xiang, P.; Kang, J.; Ye, Y.; Lin, G.; Yang, Q.; Lin, M. Microphytoplankton community structure in the western Arctic Ocean: Surface layer variability of geographic and temporal considerations in summer. Hydrobiologia 2018, 811, 295–312. [Google Scholar] [CrossRef]
- Dodson, A.N.; Thomas, W.H. Concentrating plankton in a gentle fashion. Limnol. Oceanogr. 1964, 9, 455–456. [Google Scholar] [CrossRef]
- Sukhanova, I.N. Phytoplankton concentration in a sample. In Modern Methods of Quantitative Assessment of the Distribution of Marine Plankton; Vinogradov, M., Ed.; Nauka: Moscow, Russia, 1983; pp. 97–105. [Google Scholar]
- Fedorov, V.D. On the Methods of Study of Phytoplankton and Its Activity; MSU Publ.: Moscow, Russia, 1979. [Google Scholar]
- AlgaeBase. World-Wide Electronic Publication, National University of Ireland, Galway. Available online: http://www.algaebase.org (accessed on 28 October 2022).
- WoRMS (World Register of Marine Species). Available online: http://www.marinespecies.org/index.php (accessed on 28 October 2022).
- Makarevich, P.R.; Larionov, V.V.; Druzhkov, N.V. Mean weights of dominant phytoplankton of the Barents Sea. Algology 1993, 13, 103–106. [Google Scholar]
- 17.1.4.02-90; Water. Spectrophotometric Determination of Chlorophyll-a. Standards: Moscow, Russia, 2001.
- Aminot, A.; Rey, F. Standard Procedure for the Determination of Chlorophyll a by Spectroscopic Methods; International Council for the Exploration of the Sea: Copenhagen, Denmark, 2000. [Google Scholar]
- Determination of Photosynthetic Pigments in Sea-Water, Monographs on Oceanographic Methodology; UNESCO: Paris, France, 1966; Available online: https://unesdoc.unesco.org/ark:/48223/pf0000071612 (accessed on 16 November 2022).
- Standard Operating Procedure EAP0 23, Version 2.5; Collection and Analysis of Dissolved Oxygen (Winkler Method); Washington State Department of Ecology: Washington, DC, USA, 2017.
- Chemical Methods for the Use in Marine Environmental Monitoring/IOC, Manuals and Guides, No.12; UNESCO: Paris, France, 1983.
- Manual on Chemical Analysis of Marine Waters. Guiding Document; Hydrometeoizdat: Leningrad, Russia, 1993.
- Grasshoff, K.; Kremling, K.; Ehrhardt, M. (Eds.) Methods of Seawater Analysis, 3rd ed.; Wiley-VCH, GmbH: Weinheim, Germany, 1999. [Google Scholar]
- Fomin, O.K.; Petrov, V.S. The role of natural factors in the distribution of plankton biomass in the Kara Sea. In Nature and Economy of the North, 13; Murmansk Publ.: Murmansk, Russia, 1985; pp. 34–45. [Google Scholar]
- Zatsepin, A.G.; Zavialov, P.O.; Kremenetskiy, V.V.; Poyarkov, S.G.; Soloviev, D.M. The upper desalinated layer in the Kara Sea. Oceanology 2010, 50, 658–668. [Google Scholar] [CrossRef]
- Byshev, V.I.; Galyorkin, L.I.; Galyorkina, N.L.; Stcherbinin, A.D. Dynamics and structure of waters. In Pechora Sea: System Researches; Romankevich, E., Lisitzin, A., Vinogradov, M., Eds.; MORE: Moscow, Russia, 2003; pp. 93–116. [Google Scholar]
- Khmelnitskaya, O.K. The main hydrochemical characteristics of intermediate and deep water masses of the North Atlantic. Vestn. Mosk. un-ta Ser. 5. Geogr. 2011, 6, 60–66. [Google Scholar]
- Ilyin, G.V.; Nesvetova, G.I.; Petrov, V.C.; Tsekhotskaya, L.K. Biogenic elements and oxygen regime. In Life and Conditions of Its Existence in the Pelagic Zone of the Barents Sea; Matishov, G., Ed.; KSC RAS Publ.: Apatity, Russia, 1985; pp. 46–63. [Google Scholar]
- Makarevich, P.R.; Vodopyanova, V.V.; Oleinik, A.A. Floral communities in the pelagic zone of Kola Bay. In Structure and Functional Characteristics; Dzhenyuk, S.L., Ed.; SSC RAS Publishers: Rostov-on-Don, Russia, 2015; 192р. [Google Scholar]
- Seafarers, S.D.; Lavender, S.; Beaugrand, G.; Outram, N.; Barlow, N.; Crotty, D.; Evans, J.; Kirby, R. Seafarer citizen scientist ocean transparency data as a resource for phytoplankton and climate research. PLoS ONE 2017, 12, e0186092. [Google Scholar] [CrossRef] [PubMed]
- Makarevich, P.R.; Larionov, V.V.; Vodopyanova, V.V.; Ishkulova, T.G. Phytoplankton communities in the south-eastern Barents Sea and the south-western Kara Sea as indicators of the phytogeographic status of these regions. J. Gen. Biol. 2022, 83, 323–335. [Google Scholar]
- Arkhipov, B.V.; Popov, S.K. Modeling of density and wind currents in the southeastern part of the Barents Sea. Oceanology 1996, 36, 805–813. [Google Scholar]
- Stepanov, S.I. Spatio-temporal variability of salinity fields in the Kara Sea during the navigation period. Trudy AARI 1979, 361, 59–62. [Google Scholar]
- Batskikh, Y.M.; Denisov, V.V. Ice and icebergs. In Habitat and Ecosystems of Novaya Zemlya. Archipelago and Shelf; Matishov, G., Ed.; KSC RAS Publ.: Apatity, Russia, 1995; pp. 29–35. [Google Scholar]
- Stepanov, S.I. Peculiarities of water circulation in the Kara Sea during the navigation period. Trudy AARI 1985, 389, 43–45. [Google Scholar]
- Loeng, H. Features of the physical oceanographic conditions of the Barents Sea. In Proceedings of the PRO MARE Symposium on Polar Marine Ecology, Trondheim, Norway, 12–16 May 1990; Volume 10, pp. 5–18. [Google Scholar] [CrossRef]
- Druzhkov, N.V.; Makarevich, P.R. Spatial and temporal structure of pelagic phytocenosis in the open shelf waters of West Arctic (Kara Sea). In Pelagic Ecosystems of the West Arctic Seas; Matishov, G., Ed.; KSC RAS Publ.: Apatity, Russia, 1996; pp. 37–72. [Google Scholar]
- Makarevich, P.R. The spring state of microphytoplanktonic community of the South-Eastern part of the Barents and the South-Western part of the Kara Seas in ice-covered waters. In Biology and Oceanography of the Kara and Barents Seas (along the North Sea Route); Matishov, G., Ed.; KSC RAS Publ.: Apatity, Russia, 1998; pp. 138–150. [Google Scholar]
- Makarevich, P.R.; Druzhkova, E.I. Seasonal Cyclic Processes in Coastal Planktonic Algocenoses of the Northern Seas; SSC RAS Publ: Rostov-na-Donu, Russia, 2010. [Google Scholar]
- Makarevich, P.R.; Druzhkova, E.I.; Larionov, V.V. Primary producers of the Barents Sea. In Diversity of Ecosystems; InTech Open: Rijeka, Croatia, 2012; pp. 367–393. Available online: http://www.intechopen.com/books/diversity-of-ecosystems/primary-producers-of-the-barents-sea (accessed on 1 January 2023).
- Nikiforov, S.L.; Dunaev, N.N.; Ogorodov, S.A.; Artem’ev, A.V. Physical-geographic characteristics. In Pechora Sea: System Researches; Romankevich, E., Lisitzin, A., Vinogradov, M., Eds.; MORE: Moscow, Russia, 2003; pp. 27–92. [Google Scholar]
- Pozdnyakova, L.E.; Vinogradov, V.N. Some features of the distribution of hydrochemical elements in the southeastern part of the Barents Sea in August-September 1959. In Composition and Distribution of Plankton and Benthos in the Southern Part of the Barents Sea; Galkin, Y., Ed.; Nauka: Moscow, Russia, 1966; pp. 140–156. [Google Scholar]
- Makkaveev, P.N.; Stunzhas, P.A.; Makkaveev, A.P. Hydrochemistry. In Pechora Sea: System Researches; Romankevich, E., Lisitzin, A., Vinogradov, M., Eds.; MORE: Moscow, Russia, 2003; pp. 134–170. [Google Scholar]
- Sergeeva, V.M.; Mosharov, S.A.; Nedospasov, A.A.; Polukhin, A.A.; Zhitina, L.S. Phytoplankton community structure in the Polar front of the eastern Barents Sea at the end of the growth season. Oceanology 2018, 58, 700–709. [Google Scholar] [CrossRef]
- Shirokolobov, V.N. Hydrological and hydrochemical conditions of the south-western part of the Kara Sea. In Complex Studies of the Nature of the Northern Seas; Shirokolobov, V.N., Ed.; KSC RAS Publ.: Apatity, Russia, 1982; pp. 7–17. [Google Scholar]
- Makkaveev, P.N.; Stunzhas, P.A. Hydrochemical characteristics of the waters of the Kara Sea. Oceanology 1994, 34, 662–667. [Google Scholar]
- Makkaveev, P.N.; Stunzhas, P.A.; Mel’nikova, Z.G.; Khlebopashev, P.V.; Yakubov, S.K. Hydrochemical characteristics of the waters of the western part of the Kara Sea. Oceanology 2010, 50, 688–697. [Google Scholar] [CrossRef]
- Morozova, O.A.; Vesman, A.V.; Dobrotina, E.D.; Tarasenko, A.D.; Shumskaya, N.K.; Lavrentiev, P.Y.; Onoshko, V.A. Features of the hydrochemical structure of the waters of the Kara Sea in the summer of 2012. Probl. Arct. Antarct. 2013, 1, 61–71. [Google Scholar]
- Vedernikov, V.I.; Gagarin, V.I.; Burenkov, V.I. Features of distribution of primary products and chlorophyll in the Pechora Sea in August–September 1998. Oceanology 2001, 41, 69–79. [Google Scholar]
- Vedernikov, V.I.; Gagarin, V.I.; Vetrov, A.A. Primary production and chlorophyll. In Pechora Sea: System Researches; Romankevich, E., Lisitzin, A., Vinogradov, M., Eds.; MORE: Moscow, Russia, 2003; pp. 195–206. [Google Scholar]
- Vedernikov, V.I.; Demidov, A.B.; Sud’bin, A.I. Primary production and chlorophyll in the Kara Sea in September 1993. Oceanology 1994, 34, 693–703. [Google Scholar]
- Mosharov, S.A. Distribution of primary production and chlorophyll “a” in the Kara Sea in September 2007. Oceanology 2010, 50, 933–941. [Google Scholar] [CrossRef]
- Dalpadado, P.; Arrigo, K.R.; van Dijken, G.L.; Skjoldal, H.R.; Bagøien, E.; Dolgov, A.V.; Prokopchuk, I.P.; Sperfeld, E. Climate effects on temporal and spatial dynamics of phytoplankton and zooplankton in the Barents Sea. Progr. Oceanogr. 2020, 182, 102–320. [Google Scholar] [CrossRef]
- Vetrov, A.A. Chlorophyll, primary production, and organic carbon fluxes in the Kara Sea. Oceanology 2008, 48, 38–47. [Google Scholar] [CrossRef]
- Kuznetsov, L.L.; Shoshina, E.V. Phytocenosises of the Barents Sea: Physiological and Structural Characteristics; KSC RAS Publ.: Apatity, Russia, 2003. [Google Scholar]
- Makarevich, P.R. The phytoplankton communities. In Ecosystems, Bio-Resources and Anthropogenic Pollution of the Pechora Sea; Matishov, G., Ed.; KSC RAS Publ.: Apatity, Russia, 1996; pp. 50–54. [Google Scholar]
- Pautova, L.A. Phytoplankton of the Pechora Sea. In Pechora Sea: System Researches; Romankevich, E., Lisitzin, A., Vinogradov, M., Eds.; MORE: Moscow, Russia, 2003; pp. 171–194. [Google Scholar]
- Zubakin, G.K. Large-Scale Variability of Ice Cover of the North-European Basin; Gidrometeoizdat: Leningrad, Russia, 1987. [Google Scholar]


Disclaimer/Publisher’s Note: The statements, opinions and data contained in all publications are solely those of the individual author(s) and contributor(s) and not of MDPI and/or the editor(s). MDPI and/or the editor(s) disclaim responsibility for any injury to people or property resulting from any ideas, methods, instructions or products referred to in the content. |
© 2023 by the authors. Licensee MDPI, Basel, Switzerland. This article is an open access article distributed under the terms and conditions of the Creative Commons Attribution (CC BY) license (https://creativecommons.org/licenses/by/4.0/).