Article

Vanilla planifolia Andrews (Orchidaceae): Labellum Variation and Potential Distribution in Hidalgo, Mexico

by
Agustín Maceda
1,
Adriana Delgado-Alvarado
2,
Víctor M. Salazar-Rojas
3 and
B. Edgar Herrera-Cabrera
2,*
1
Instituto de Biología, Universidad Nacional Autónoma de México, Mexico City 04510, Mexico
2
Programa de Estrategias para el Desarrollo Agrícola Regional, Colegio de Postgraduados, Santiago Momoxpan 72760, Mexico
3
Facultad de Estudios Superiores Iztacala, Universidad Nacional Autónoma de México, Mexico City 54090, Mexico
*
Author to whom correspondence should be addressed.
Diversity 2023, 15(5), 678; https://doi.org/10.3390/d15050678
Submission received: 6 March 2023 / Revised: 18 April 2023 / Accepted: 9 May 2023 / Published: 18 May 2023
(This article belongs to the Special Issue Orchid Conservation and Associated Fungal Diversity)

Abstract

:
Vanilla planifolia is a species of commercial importance. However, vanilla presents gene erosion problems due to its clonal reproduction. In the Huasteca of Hidalgo, there is no information on vanilla populations. Therefore, the objectives of this study were to identify the current populations and the potential distribution of, and the morphological variation in, the labellum of V. planifolia in the Huasteca of Hidalgo. Twenty-two accessions were located and selected. Based on 21 environmental variables, the niche modeling of the potential distribution was carried out with the MaxEnt program; with the Jackknife test being used to identify the variables that contributed to the model. Flowers from 22 accessions were collected and the labellum of each flower was dissected. Subsequently, 64 morphological variables were obtained and various multivariate analyses were performed. The results showed three regions, defined by the highest to the lowest probability that V. planifolia was distributed. The precipitation of the driest month, altitude, and vegetation cover delimited the distribution. Five different morphotypes were distinguished, and the main differences were associated with the middle part of the labellum as well as the entrance of pollinators to the flower; therefore, the characterization of the labellum showed an infraspecific variation in V. planifolia in populations of the Huasteca of Hidalgo.

1. Introduction

Vanilla planifolia Andrews is a species of economic and ecological importance that is distributed from Mexico to Costa Rica [1,2]. Vanilla is native to Oaxaca and the crop was developed in the north of Veracruz, Mexico [1,3,4], although its cultivation has spread to different regions of the world. V. planifolia is a hemi-epiphytic or rupicolous plant that develops in evergreen or almost evergreen tropical forests, in primary or secondary vegetation at a height between 150 and 900 m above sea level (masl) [3,5]. It grows in evergreen or sub-evergreen forests with year-round rains on calcareous soils. In wetter areas, it can be found in young secondary forests. The flowers appear from March to April, and flowering is activated by low winter temperatures followed by warm temperatures in early spring [3]. Vanilla is subject to Special Protection (Pr) by the Mexican Government under NOM-059-SEMARNAT-2010, since there are only 30 registered collects in their natural environment [3]. Because Vanilla planifolia is propagated by cuttings, there are problems of genetic erosion in the crops [2,6,7,8] and susceptibility to diseases (fungi and bacteria) [9].
Through the modeling of ecological niches and potential distribution, the environmental and anthropogenic variables that affect the distribution of a species can be identified [10,11,12,13], in addition to determining if there is gene flow between populations [14,15,16]. These analyses are applied to endangered or threatened species [17] which need to be preserved in priority conservation areas [18,19,20].
Maximum entropy (MaxEnt) is a method used to model the potential distribution of species [21], identify the main environmental variables that determine the distribution [22], and the pixels where there is a maximum entropy of distribution [23,24,25]. Therefore, in V. planifolia, MaxEnt has been used to identify areas of potential distribution in states such as Puebla, Veracruz [26,27], Oaxaca [28], San Luis Potosí [29,30], and Mexico in general [31]. In Hidalgo, there is no information on the current distribution of V. planifolia [32]. With the analysis of the geographic distribution of V. planifolia and its interaction with the environmental variables that delimit its distribution [33,34], areas of conservation of vanilla germplasm can be identified [35,36].
Due to the low genetic variation in Vanilla planifolia populations [9,37], studies of vanilla genetics [9,38,39] and floral morphology [40,41,42] have been conducted to detect genetically diverse populations and increase germplasm [43]. Flowers are organs with little morphological variation associated with their genotype [40,42,44,45]; therefore floral morphology and morphometry delimit species [46,47] and determine infraspecific variation [42]. The labellum is a fundamental structure in the biology and floral ecology of orchids due to its specificity with the pollinator [48]. The thicker region of the labellum acts as a visual attraction and landing zone for pollinators [49]; therefore, the labellum is a stable organ under constant pressure and selection from pollinators, making it a suitable indicator to identify the infraspecific variation [50]. For Vanilla planifolia, the shape of the labellum has been characterized in populations from Oaxaca [40] and San Luis Potosí [42], in addition to similar characterizations for Vanilla pompona Schiede [41] and Laelia anceps Lindl. [51]; however, in Hidalgo, there is no information on the morphological variation in labellum.
Labellum characterization provides information on infraspecific variation, so that improvement and conservation programs can be developed [52]. Due to the scarcity of information on the distribution of and infraspecific variation in the populations in the Huasteca de Hidalgo, the objective of this study was to determine the geographic distribution and characterize the labellum morphology of V. planifolia populations from the Huasteca of Hidalgo, Mexico.

2. Materials and Methods

2.1. Geographic Location

The state of Hidalgo is located between 19°35′52′′–21°25′00′′ N and 97°57′27′′–99°51′51′′ W. Hidalgo extends to the north with the state of San Luis Potosí, northeast and east with Veracruz, east and southeast with Puebla, to the south with Tlaxcala and Mexico, and to the west with Querétaro. The study region was the Huasteca of Hidalgo, which includes the municipalities of Atlapexco, Huautla, Huazalingo, Huejutla, Jaltocan, San Felipe Orizatlán, Xochiatipan, and Yahualica [53,54]. It presents warm and humid semi-warm climates, is within the physiographic subprovince Carso Huasteco, and is covered mainly by mountain cloud forest in which the high forest has been displaced by secondary vegetation, in addition to presenting various types of crops and induced pastures [55].

2.2. Species Distribution

Visits were made to the eight municipalities belonging to the Huasteca of Hidalgo for the location of populations of Vanilla planifolia Andrews through direct observation in the field and with the help of the inhabitants (Figure 1). The locations of the vanilla populations were recorded using GPS (Garmin Montana 650). The selected populations were located in vanilla fields that were at least 20 years old and in acahual-type (native and introduced secondary vegetation) fields or in fields with no or minimal management, to avoid vanilla fields in the region with recent plants brought from Veracruz.

2.3. Species Distribution Modeling

The potential distribution of Vanilla planifolia Andrews was modeled with 21 environmental variables: 20 variables of 30 s of the spatial resolution were obtained from the WorldClim database (www.worldclim.org, accessed on 18 May 2022) [56,57] and a vegetation cover variable was obtained from the CONABIO database [58] (Table 1). The potential distribution was modeled using MaxEnt v. 3.4.1 [23,31,59]. The logistic output format was used to visualize the ideal habitat (probability of presence) of V. planifolia based on the different environmental variables [28,60]. The combined pixels in the model were recorded as the possible maximum entropy distribution space given by MaxEnt. Therefore, each cell on the map gives an estimate of the value of the suitability of the habitat on a scale that goes from 0 (least suitable) to 1 (most suitable) [23,31,61].
The accuracy of the model was evaluated by calculating the area under the curve (AUC) ROC (Receiver Operating Characteristic), which considers each value of the prediction result as a possible discrimination threshold and then calculates the corresponding sensitivity and specificity of each value. Sensitivity is the proportion of test localities that are present which were correctly predicted (1-extrinsic omission rate). The quantity (1-specificity) is the proportion of all of the pixels predicted to have suitable conditions for the species [23]; therefore, based on the AUC value, the model can be considered as poor (AUC < 0.8), fair (0.8 ≤ AUC < 0.9), good (0.9 ≤ AUC < 0.95), or very good (0.95 ≤ AUC < 1.0) [25].
Subsequently, a Jackknife test [62] was carried out, which allows for analyzing the contribution of each environmental variable individually and jointly, to form the distribution model of V. planifolia [63]. Therefore, through this test and the percentage of contribution of the species, the variables that locate the potential distribution of V. planifolia in the Huasteca of Hidalgo, Mexico were determined.

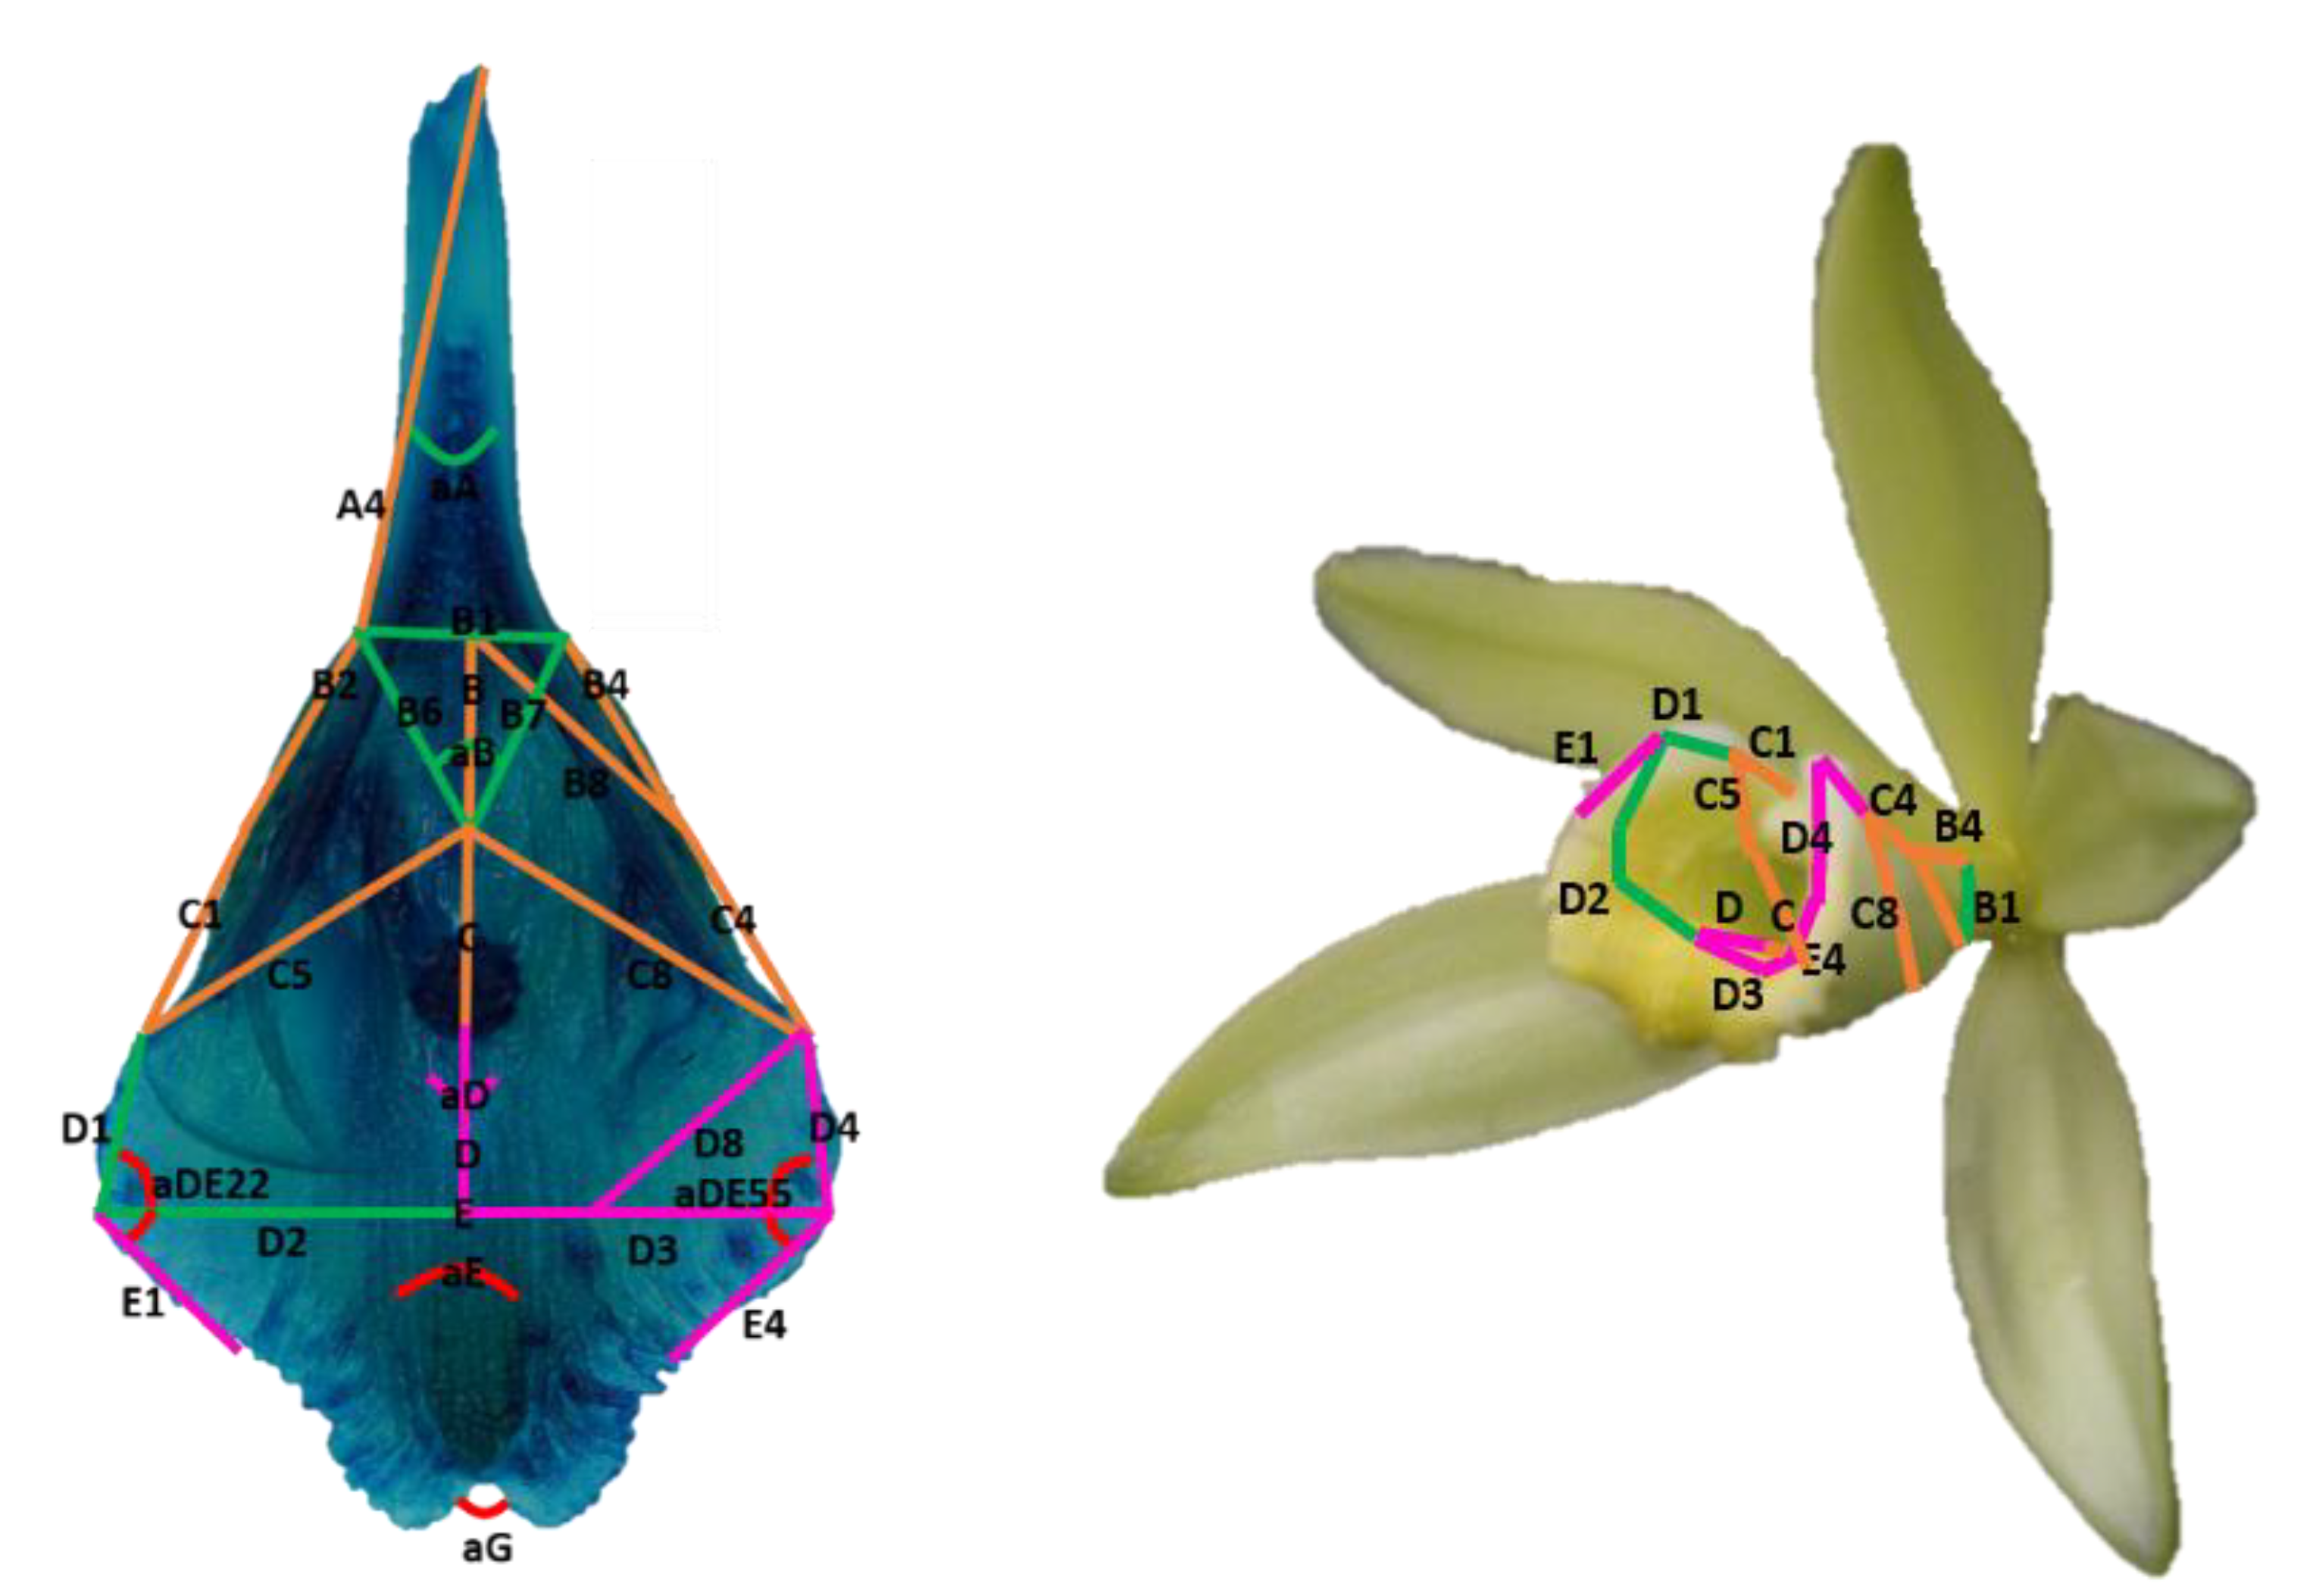
2.4. Morphological Characterization of the Flower

In April 2013, during the flowering season, 328 turgid flowers with pollinia and no apparent damage to the floral structure were collected from 22 Vanilla planifolia Andrews populations (22 accessions) (Figure 2A). The petals, sepals, and labellum were dissected and stored in a preservative solution (27% ethanol, 4% lactic acid, 3% benzoic acid, 3% glycerin, and 63% distilled water) inside 220 mL bottles with their respective collection label.
To identify morphometric variation, the work was based on the geometric morphometry of contours that are used in the analysis of anatomical structures. The shape of a structure is analyzed as a whole and not in fragments [1], in addition to characterizing the shapes through multivariate analysis [64,65].
The procedure to characterize the labellum was based on Hernández-Ruíz et al. [39] and Lima-Morales et al. [42]. First, the labellum stored in a preservative solution was stained with methylene blue (0.08%) (Figure 2B,C). Photographs were taken at a distance of 30 cm with a Sony digital camera (SONY α, DSLR-SLT-A55) equipped with a macro lens (Sony DT 30 mm F/2.8 SAM). Once the digital images of all of the flowers were obtained, the initial landmark points were placed (Figure 3A). In the curved regions, extra points were added without overloading the contour edges so as not to generate redundant information [66]. With the first landmark points, the labellum was separated into seven regions: A, B, C, D, E, F, and G (Figure 3B). Then, the secondary lines were placed to record the entire shape of the labellum; thus, a total of 57 lines and 7 angles (morphological variables) were obtained (Figure 3C).

2.5. Statistical and Numerical Analysis

For all of the labellum lines and angles, the mean and the coefficient of variation were obtained. Subsequently, an analysis of variance under a completely random unbalanced scheme was performed to determine if there were significant differences between the accessions. The 22 accessions were considered to be the source of variation; therefore, each collection had a different number of replicates (Table 2). Subsequently, a multivariate analysis of Principal Components and a hierarchical cluster analysis based on the Euclidean distance of each mean were performed to identify infraspecific variation in the labellum of Vanilla planifolia Andrews in the Huasteca of Hidalgo using the Software SAS 9.1 (SAS Institute, Cary, NC, USA) and the JMP 10.0.2 (SAS Institute, Cary, NC, USA).

3. Results

3.1. Potential Distribution of Vanilla planifolia Andrews

Location of the Populations of Vanilla planifolia Andrews

In the Huasteca of Hidalgo, 22 accessions of Vanilla planifolia Andrews were located in the municipalities of Atlapexco, Jaltocán, and Huejutla de Reyes (Table 3). These sites presented the conditions of vanilla plantations that were more than 20 years old and in traditional systems of acahuales and Coffea arabica Benth plantations under the shade of native trees (for example Pimenta dioica (L.), Bursera Jacq. ex L. spp., and Ceiba pentandra (L.) Gaertn.) and minimal management. Sites with intensive management and the recent acquisition of cuttings were excluded.
The municipality of Huejutla presented the largest number of V. planifolia populations with 63.6% of the total, while Atlapexco had 27.2% and Jaltocán had 9.2% (Figure 4). The vanilla populations were located between 273 and 545 masl; 31.8% of the accessions were in a warm humid climate, 45.4% in a humid semi-warm climate, 9.1% in a humid warm climate with the coldest month less than 18 °C, and 13.7% in a humid semi-warm climate of group C (Table 3).

3.2. Potential Distribution

The MaxEnt model predicted the potential distribution of Vanilla planifolia Andrews with a training area under the curve (AUC) of 0.985 (Figure 5A). The red curve (indicating the degree of fit of the sampling data) and the blue one (indicating the fit of the model) were identical and the values were considered to be acceptable. Figure 5B shows the omission rate calculated on both the training presence records and the test records. In the omission rate, a small part fell below the predictions, and another remained above the predictions because the sample used and the training samples were dependent.
Once the modeling carried out by MaxEnt was validated, the potential distribution of V. planifolia was obtained (Figure 6). The 22 accessions were located only in the northern and northwestern parts of Hidalgo that belong to the region of the Huasteca of Hidalgo. The areas in red showed the highest probability of presenting populations of V. planifolia. By contrast, the green areas are the places where there is little probability of finding a population of V. planifolia (Figure 6).
The populations marked by GPS were divided into three groups that were differentiated by the probability of finding V. planifolia. In Group I (GI), the largest number of populations was present (red area, 67–100% probability); therefore, it is the area with adequate environmental conditions for the development of V. planifolia in the Huasteca of Hidalgo. Group II (GII) was located in the orange area, with a 51–66% probability that the V. planifolia populations were distributed there. Finally, in Group III (GIII), the probability of finding populations of V. planifolia was 34–50% (Figure 6). The areas in gray were the areas where V. planifolia is not distributed and cannot be cultivated.

3.3. Effect of Environmental Variables

The variables that contributed the most to the potential distribution model generated by MaxEnt were the precipitation of the driest month (Bio14) (43%) and vegetation cover (Cover) (14.9%). Therefore, the two variables Bio14 and Cover were the determinants to generate the potential distribution model of Vanilla planifolia Andrews in the Huasteca of Hidalgo (Table 4).
The environmental variables that were individually most important for the potential distribution of V. planifolia were precipitation of the driest month, precipitation seasonality, precipitation of the coldest quarter, altitude, precipitation of the driest quarter, and temperature seasonality (Figure 7). The least important variables, individually, for the potential distribution of V. planifolia were temperature annual range and vegetation cover, which individually do not present a direct effect but, if they are eliminated, affect the distribution of the model when analyzed with the other variables together, as well as the mean diurnal temperature range (Figure 7).

3.4. Labellum Characterization

The 64 morphological variables which were analyzed presented low coefficients of variation (3–10%). In addition, highly significant differences were observed between the accessions for each of the variables (Table 5).

3.5. Diversity Distribution

In the Principal Component Analysis (PCA), the first three principal components (PC) had eigenvalues above 1 and explained 79% of the total variation (Table 6). PC1 explained 57.13%, PC2 13.26%, and PC3 8.76% of the total variation. The PC1 was determined by A4, B2, B4, B8, C1, C4, C5, C8, and C, which conformed to the middle basal regions of the flower. CP2 was defined by morphological variables of the mid-basal region (B1, B6, and B7), median (D1 and D2), and labellum width (aA and aB) (Table 6). PC3 was represented by morphological variables of the middle region (D3, D4, D8, and D), apical middle (E1 and E4), and one of the labellum width (aD) (Table 6).
When plotting the PCs of the vanilla populations, five morphotypes of Vanilla planifolia Andrews were identified for the Huasteca region of Hidalgo (Figure 8). The variables that define the morphotypes located in the positive zone of PC1 were A2, A4, B2, B4, B8, C1, C4, C5, C8, and C; for PC2 the variables were B1, D2, aA, aB, and aD; for PC3 the variables were D4, D8, D, and E1 (Figure 8, Table 6).

3.6. Diversity Clustering

The multivariate analysis of the clustering showed that, on a Euclidean distance of 0.831 in the dendrogram of Figure 9, the five morphotypes were confirmed for Vanilla planifolia Andrews accessions from the Huasteca region of Hidalgo. Similar tones mean variables with similar values, in addition to the fact that intense blue tones show the highest values while white tones represent the lowest values. Morphotypes I and II differed from Morphotypes III, IV, and V at a distance of 1.008 because the variables that represented the shape of the mid-apical and mid-basal region were the ones that presented the most information and mainly served to differentiate the morphotypes in the dendrogram. Subsequently, Morphotype I was separated from Morphotype II by the angles of the labellum (aA, aB, aD, aE, and aG). The Morphotypes III, IV, and V were separated by the angles of the labellum and the basal region (aA, aB, aD, aE, aG, A2, A3, A4, and A5) (Figure 9A).
Based on PC1 (Figure 8), the morphotypes located on the positive side of the graph were more elongated and broader in the mid-basal and basal region of the labellum (Morphotype I and Morphotype II), while those on the negative side were narrower in this region (Morphtype III, Morphtype IV, and Morphtype V) (Figure 8). In PC2, on the negative side, the morphotypes were thin in the left part of the middle region of the labellum (D2) and the basal region (B1, aA, and aB), but long in the middle basal region and the left part of the middle region of the labellum (B6, B7, and D1) (Morphotypes II, III, and IV). Morphotype I and V were located in the middle part of PC2 (Figure 8).
For PC3, the labellum on the positive side was longer in the right part of the middle region (D, D4, and D8) and the left part of the apical middle region of the labellum (E1). The labellum was narrower on the right side of the mid-region (D3 and aD) and short on the right side of the apical mid-region (E4). However, only Morphotype III was found in the positive part, while the other morphotypes were in the middle of PC3 (Figure 8). The morphological expression profile shows the behavior of each variable for each accession (Figure 9B). The variables with similar behaviors were grouped so that the five morphotypes were separated based on the differences of each accession. The height of the peaks corresponds to the value of each variable, and high peaks represent high values; therefore, Morphotype I is the one with the highest peaks for each accession, while it is the opposite for Morphotype V (Figure 9B).

4. Discussion

4.1. Potential Distribution of Vanilla planifolia Andrews

4.1.1. Potential Distribution Model

The potential distribution model of Vanilla planifolia Andrews identified three regions where there was a higher probability of finding this species and that could be considered as conservation areas for the germplasm present in the Huasteca region of Hidalgo [19,22]. This measure will prevent the disappearance of vegetation and changes in land use that reduce the potential distribution areas, as has been reported for V. planifolia in Oaxaca [28], San Luis Potosí [29,30], and Mexico in general [31].
The value obtained to validate the distribution model of Vanilla planifolia was 0.994, which means that the model prediction of the potential distribution of V. planifolia was acceptable (0.95 ≤ AUC < 1.0) because the current test data are adjusted with the training data [25]. The AUC value is high because V. planifolia is localized to specific environmental conditions [5], while in species that are located in different environments, the AUC value tends to be lower [20,67,68].
The evaluation of the model allows us to know its usefulness; therefore, it must be validated to know if the results are significant. To this end, the omission (or commission) rate is used, which is a binomial test that is dependent on a threshold based on omission and predicted area [23,69,70]. The omission rate is the fraction of test locations that fall into pixels that are not expected to be suitable for V. planifolia; the predicted area is the fraction of all of the pixels that are predicted to be suitable for the species [25]. In Figure 5B, the omission in the test examples was adjusted to the predicted omission rate, which is the omission rate for the test data modeled from the distribution given by MaxEnt (the omission rate predicted is a straight line due to the cumulative output format). Thus, the potential distribution modeled by MaxEnt was validated since the omission of the test data is close to the predicted omission [23,25,69].

4.1.2. Environmental Variables That Define the Potential Distribution

The main environmental variable that defined the potential distribution of Vanilla planifolia Andrews in the Huasteca of Hidalgo was the precipitation of the driest month. The abundance of rain in the month of April is a determinant for the establishment of vanilla populations (Figure 10B), similar to what Armenta-Montero et al. [31] report. Trinidad-García et al. [30] and Reyes-Hernández et al. [29] mention that the total precipitation in the Huasteca Potosina is one of the main factors that influence the distribution of vanilla; for Hernández-Ruíz et al. [28] it was the month with the highest rainfall in Oaxaca. However, because it is a species under cultivation, Soto-Arenas and Cribb [5] found that V. planifolia is established in dry conditions in the spring months for Veracruz.
In the case of altitude, there is a greater probability of finding populations of Vanilla planifolia at lower altitudes than at higher altitudes for the Huasteca region of Hidalgo (Figure 10A). These values fall within the range that has been reported for other populations of V. planifolia that are distributed from 150 to 800 masl [3,5]; in Oaxaca they are located from 200 to 1190 masl [28], and in the Huasteca Potosina, from 61 to 678 masl [29].
The climate in which the populations of the Huasteca of Hidalgo occur is similar to the Totonacapan region conditions (Puebla-Veracruz), where there are populations in warm humid and warm sub-humid conditions [71]. The vegetation cover did not turn out to be a decisive factor because, individually, it does not affect the distribution. However, based on the Jackknife test together with the other variables, it provides information in the construction of the model.
The largest number of populations (59.1%) was in the type of agricultural use cover. Vanilla planifolia was located in secondary vegetation, made up of acahuales for timber or Coffea arabica Benth plantations, and similar to that reported in the areas of Veracruz and part of Puebla [4,34,71]. Further, 40.9% of the accessions were associated with tropical or subtropical evergreen broadleaf forests, which are mainly used for Coffea arabica plantation, and the cultivation of Pimenta dioica (L.) Merr., Ceiba pentandra (L.) Gaertn, and Pouteria sapota (Jacq.) H. E. Moore and Stearn (direct observation in the field). These conditions are similar to some acahuales in Puebla and Veracruz [4,34,71], which serve as reservoirs for native species [72,73,74].
The use of computational predictive models has allowed for the identification of the distribution of species through the analysis of the environmental conditions of the sites where they are collected [75,76]. Geographic Information Systems, together with predictive algorithms, allow for the modeling of ecological niches. These models constitute an important technique in analytical biology which is oriented mainly to the conservation and management of species [10,24,63]. The distribution and geographical area of the plants are influenced by two main factors: altitude and climate [77,78]. However, plant species adapt to variations in environmental conditions [79,80] with significant changes in the composition and structure of populations; therefore, there may be species with a wide or very restricted distribution (endemic) [35,36]. In the case of Vanilla planifolia, the main factors were the precipitation of the driest month and altitude. In addition, because its distribution is restricted, it is considered to be an endemic species to Mexico [81,82].

4.2. Labellum Characterization

4.2.1. Labellum Morphotypes

Generally, biotic and abiotic factors influence the morphological variation in vegetative and reproductive characters [83]. Within the reproductive characters, the flowers present quantitative variation in the populations of the same species. This variation represents the basis of natural selection that can eventually result in diversification and speciation [46,84]. The size of the flower in some species is modified due to environmental variation; therefore, they become larger at high altitudes, cold temperatures, and high humidity, and shorter at low altitudes, warm temperatures, and dry conditions [46,85,86]. However, these variations occur due to the plasticity that individuals present under different environmental conditions [84,87], as reported for Arabidopsis thaliana (L.) Heynh [45], Narcissus triandrus L. [85], and Campanula rotundifolia Pall. Ex Roem. and Schult [86].
In many orchids, there is a high degree of pollinator specificity in flower shape; therefore, as they are specialized in pollination, the variation is minimal within the same species [48].
The Vanilla planifolia populations analyzed in this work had significant differences in all of the morphological variables. However, through the PCA, the variables that allowed for the separation of the populations into five different morphotypes were identified.
The traits that separated the groups for PC1 corresponded to the basal regions and the middle region of the labellum, similar to those reported for Vanilla planifolia Andrews in Oaxaca [40] and San Luis Potosí [42], while for Vanilla. pompona Schiede, they were from the middle and basal region [41].
In the case of PC2, the morphological variables that influence the separation of the groups corresponded to the middle regions and left part of the callus region, similar to what Hernández-Ruíz et al. [40] reported for V. planifolia from Oaxaca, but differing from what Lima-Morales et al. [2] reported in San Luis Potosí. In PC3, the morphological variables that separated the groups in this study corresponded exclusively to the callus region, a situation that coincides with V. planifolia from San Luis Potosí [2], and partially coincides with what they reported for Oaxaca for V. planifolia [40]. Considering the three PCs and comparing them with V. planifolia from Oaxaca [40], San Luis Potosí [42], and V. pompona [41], the relevant regions are the middle part and the callus. These regions define the entrance of the pollinating insect to the flower as suggested by Hernández-Ruíz et al. [41] for V. pompona and confirmed by Hernández-Ruiz et al. [40] and Lima-Morales et al. [42] for V. planifolia.
Although the variables of each PC are independent between each PC, as observed in Figure 8, the important variables are located in the same regions and are closer to each other; therefore, even though they are independent in the multivariate analysis, they are directly related to the structure of the labellum, a situation that was not observed in the published articles on Vanilla from San Luis Potosí and Oaxaca [40,42].
In addition, through the hierarchical clustering heatmap and the morphological expression profiles of the labellum of V. planifolia (Figure 9), the areas that varied between the five morphotypes were obtained:
Morphotype I (MI). Represented by nine accessions, MI had a wide labellum in the basal and mid-basal region, elongated on the right side, broad on the left side of the middle-middle apical region, and larger in the region of the apical lobes. It is the largest labellum compared to the other morphotypes (Figure 9B, Table A1).
Morphotype II (MII). Represented by three accessions. The main characteristic of MII was the larger basal region where the labellum joins the base of the column. For the mid-basal region, the structure was more elongated in a similar way to the median and apical median region of the labellum (Figure 9B, Table A1).
Morphotype III (MIII). With only two accessions, MIII had the third largest labellum size and was intermediate between Morphotypes I and II (larger) and Morphotypes IV and V (smaller labellum size) (Figure 9B, Table A1).
Morphotype IV (MIV). Represented by seven accessions, MIV had a small labellum (only surpassed by Morphotype V) in the basal region and the middle region (Figure 9B, Table A1).
Morphotype V (MV). This morphotype had only one accession, and presented the smallest labellum size, mainly in the mid-basal region, apical mean, and apical lobes (Figure 9B, Table A1).
Morphotypes I and II were those with the largest labellum sizes, followed by Morphotype III, then Morphotype IV, and the one with the smallest labellum was Morphotype V.
These five morphotypes would represent the vanilla populations that develop in the Hausteca of Hidalgo because, as previously mentioned, the 22 accessions analyzed come from acahuales and coffee plantations with little or no management, the age of the plants is more than 20 years old, and they have not been recently acquired from other regions such as Papantla, Veracruz.

4.2.2. Geographic Distribution of Morphotypes

Reproductive characters generally show a certain degree of morphological variation, a product of the genetic variability of each species and on which natural selection acts as the main force of speciation [40]. In situations where morphological variation is associated with environmental factors, it has been documented that it is generally expressed as gradual or mosaic patterns across a landscape or geographic area [83]. When the phenotype of a plant is affected by any of these factors, environmental patterns can be treated as geographic patterns of phenotypic variation [83,88]. Particularly, this type of variation is related to species with a wide geographical distribution, and which occupy discontinuous territories in the form of mosaics [89].
However, in the case of Vanilla planifolia Andrews, the distribution of the five morphotypes was not associated with abiotic factors: the five morphotypes were distributed within the same soil moisture regime (Udic from 270 to 330 days of moisture), at the same elevation that goes from 250 to 556 masl, and in areas with a total annual rainfall of 1000–2000 mm and an average temperature of 21–23 °C. Therefore, vanilla had no climatic pattern since the same morphotype was distributed in several types of climates, as reported by Soto-Arenas and Solano-Gómez [82], and as seen in the type of vegetation of the Huasteca of Hidalgo (Figure 11) [58].

4.3. Final Considerations on the Labellum Variation

Since the presence of five morphotypes cannot be explained by environmental variables, other factors such as biotic factors could be considered. McCormirck and Jacquemyn [90] suggest that micro factors such as mycorrhizae, tutors, and pollinators are factors that can affect and modify the spatial distribution of orchids in general. Damon et al. [91] suggest that the distribution and abundance of euglossine bees (Euglossini Latreille) in agroecosystems and forest fragments in southern Mexico is associated with relict forests and coffee plantations due to light and humidity, conditions that occur in the Huasteca of Hidalgo.
Shipunov and Bateman [49] pointed out that the size and shape of the labellum are important factors for the attraction of pollinators. Benítez-Vieyra et al. [92] reported the same situation for the orchid Geoblasta pennicillata (Rchb. f.) Hoehne ex M.N Correa, which attracts its pollinator by having a labellum shaped like the female wasps of the species Campsomeris bistrimacula Lepeletier. In Cryptostylis R. Br. orchids, the larger labellum functions as a stimulant for pollinating wasps; therefore, in some orchid species, the labellum is under constant selection pressure from pollinators [93].
The differences between Vanilla planifolia morphotypes were concentrated in the shape of the labellum attraction zone and were exposed to selection by pollinators (Figure 12). In the Huasteca region of Hidalgo, the vanilla plantations in acahual and with little management of the crop present natural pollination due to the presence of wasps and bees of the Euglossa Latreille and Eulaema Lepeletier genera [32,94]. Pollinators influence the variation in the size, shape, and color of floral structures in some plant species [44,95,96]; therefore, they are one of the main causes of floral evolution [45,46]. The morphological variation in the flowers depends on the level of specialization with the pollinator (the case of some orchids) [97]; for this reason, the variation in size of the flower is minimal because there is a strong relationship between the pollinator and the flower that is stable in climatic variations [44,93,98,99]. In addition, the labellum is a very important organ, not only to identify and differentiate highly related taxonomic entities [100], but also to study the processes and mechanisms that generate variation and adaptation within and between populations of V. planifolia, as has been reported for other regions of Mexico [40,42].
Possibly, the variation in the morphology of the labellum of the populations of the Huasteca Hidalguense are mainly related to the size of the pollinator; however, it is necessary to carry out studies on the biological interactions between plant and pollinator [101], as in other species of Vanilla [102], to determine if the shape between the morphotypes is related to the size of the pollinators present in the region or if the variation corresponds to other environmental factors as a product of the plasticity or accommodation of the plants to the environment in which they develop. In addition, to confirm that the morphological variation reflects the genetic diversity of V. planifolia, analyses with molecular markers must be carried out to characterize the germplasm [103,104] and propose generic improvement programs (new hybrids or new varieties) [105] and conservation programs in the Huasteca de Hidalgo, Mexico.

5. Conclusions

In the Huasteca region of Hidalgo, Mexico, 22 accessions of V. planifolia were located in acahuales and Coffea arabica Benth plantations with native vegetation and minimal management. The potential distribution map shows that, based on the probability of presence, the populations of V. planifolia were located in three groups from the highest to lowest probability of the presence of vanilla. The main environmental variables that delimit the potential distribution of V. planifolia in the Huasteca of Hidalgo were precipitation and altitude. In addition, five different labellum morphotypes which were possibly related to plant–pollinator interaction were obtained. However, it is necessary to deepen the study of the morphology associated with the floral ecology of the germplasm of V. planifolia in the Huasteca of Hidalgo.

Author Contributions

Conceptualization, B.E.H.-C., A.M., V.M.S.-R. and A.D.-A.; methodology, A.M. and B.E.H.-C.; validation, B.E.H.-C., A.M., V.M.S.-R. and A.D.-A.; investigation, A.M. and B.E.H.-C.; resources, B.E.H.-C.; writing—original draft preparation, A.M. and B.E.H.-C.; writing—review and editing, V.M.S.-R. and A.D.-A. All authors have read and agreed to the published version of the manuscript.

Funding

This work is a product of the thesis of the first author, who thanks the National Council of Science and Technology (CONACyT) for his MSc scholarship number 352293. Financial support from Fondo Sectorial CONACyT-SAGARPA (SADER): Project 2012-04-190442.

Institutional Review Board Statement

Not applicable.

Informed Consent Statement

Not applicable.

Data Availability Statement

Not applicable.

Acknowledgments

Thanks to the farmers of Huasteca of Hidalgo, especially to Manuel Ambrocio for his help.

Conflicts of Interest

The authors declare no conflict of interest.

Appendix A

Table A1. Morphotype averages for each of the variables.
VariableM IM IIM IIIM IVM VVariableM IM IIM IIIM IVM V
A12.682.462.312.662.48D7.978.498.28.117.63
A217.1217.1716.5517.0316.04E17.256.558.327.687.18
A317.1617.2316.7217.0916.18E27.366.636.076.36.47
A417.4117.4116.6217.2916.23E36.626.944.555.715.58
A517.6417.617.2217.5716.7E46.336.815.756.785.94
A17.1117.1616.5917.0416.07E55.265.314.854.884.78
b12.462.32.222.382.38E66.646.346.086.056.02
b29.649.778.949.548.94E76.126.544.965.665.42
b37.117.016.096.656.67E85.185.344.454.784.56
b49.829.799.289.589.2E4.554.744.254.344.13
b510.9911.0610.0110.8110.22F13.573.23.423.053.23
b699.978.659.058.43F25.384.84.244.54.63
b78.8910.048.449.018.28F35.14.913.884.344.43
b811.2411.0810.4910.8610.57F42.983.462.382.742.64
B8.538.578.258.548F56.015.494.945.125.23
C19.88109.059.589.05F67.927.166.716.826.97
C212.4112.0710.3411.4211.26F77.087.425.086.26.03
C311.9412.079.6410.9810.76F85.775.594.634.995.04
C49.979.949.219.69.15F2.692.652.532.472.41
C514.7714.8112.813.9713.51G13.883.612.693.423.19
C611.4311.110.5810.8810.65G24.714.24.494.074.3
C710.9211.119.9310.6510.2G33.793.752.963.363.18
C814.9314.7513.1114.0413.68G43.643.163.233.133.11
C8.558.598.268.478.01G53.343.142.672.982.88
D17.698.837.177.867.22G2.542.382.222.342.09
D212.7711.2312.5512.4412.07aA24.923.1622.4224.525.21
D311.1211.539.1211.0410.13aB32.0929.9829.9831.1633.11
D48.478.419.268.468.14aD58.354.3146.3652.4454.58
D511.0211.5710.1110.8210.29aE88.1784.6577.2883.7886.17
D69.159.568.688.968.52aDE22127.81141.76112.12120.28122.5
D79.169.519.069.018.6aDE55140.41139.1130.68129.01134.54
D811.211.3610.7910.9410.54aG85.7581.11105.5279.4890.47

References

  1. Schlüter, P.M.; Soto-Arenas, M.A.; Harris, S.A. Genetic variation in Vanilla planifolia (Orchidaceae). Econ. Bot. 2007, 61, 328. [Google Scholar] [CrossRef]
  2. Hu, Y.; Resende, M.F.R.; Bombarely, A.; Brym, M.; Bassil, E.; Chambers, A.H. Genomics-based diversity analysis of Vanilla species using a Vanilla planifolia draft genome and Genotyping-By-Sequencing. Sci. Rep. 2019, 9, 3416. [Google Scholar] [CrossRef]
  3. Soto Arenas, M.A.; Dressler, R.L.; Cameron, K.; Cribb, P.; Hágsater, E.; Salazar, G.; Solano, R. A revision of the Mexican and Central American species of Vanilla plumier ex miller with a characterization of their its region of the nuclear ribosomal DNA. Lankesteriana 2009, 9, 285–354. [Google Scholar] [CrossRef]
  4. Herrera-Cabrera, B.E.; Salgado Garciglia, R.; Manuel, V.; Higuera, O.; Jair Barrales-Cureño, H.; Delgado Alvarado, A.; Montiel-Montoya, J.; Diaz-Bautista, M.; Albino, R.A.; Reyes, C. Producción y caracterización de vainilla (Vanilla planifolia) en función de la concentración de vainillina. Rev. Iberoam. Cienc. 2022, 9, 46–62. [Google Scholar]
  5. Soto-Arenas, M.A.S.; Cribb, P. A new infrageneric classification and synopsis of the genus Vanilla Plum. ex mill. (Orchidaceae: Vanillinae). Lankesteriana 2009, 9, 355–398. [Google Scholar] [CrossRef]
  6. Herrera-Cabrera, B.E.; Salazar-Rojas, V.M.; Delgado-Alvarado, A.; Contreras, J.; Contreras, C.; Cervantes-Vargas, J. Use and conservation of Vanilla planifolia J. in the Totonacapan Region, México. Eur. J. Environ. Sci. 2012, 2, 43–50. [Google Scholar] [CrossRef]
  7. Bello-Bello, J.J.; García-García, G.G.; Iglesias-Andreu, L. Conservación de vainilla (Vanilla planifolia Jacks.) bajo condiciones de lento crecimiento in vitro. Rev. Fitotec. Mex. 2015, 38, 165–171. [Google Scholar] [CrossRef]
  8. Householder, E.; Janovec, J.; Mozambite, A.B.; Maceda, J.H.; Wells, J.; Valega, R.; Maruenda, H.; Christenson, E. Diversity, natural history, and conservation of Vanilla (Orchidaceae) in amazonian wetlands of Madre de Dios, Peru. J. Bot. Res. Inst. Tex. 2010, 4, 227–243. [Google Scholar]
  9. Ellestad, P.; Pérez-Farrera, M.A.; Buerki, S. Genomic insights into cultivated mexican Vanilla planifolia reveal high levels of heterozygosity stemming from hybridization. Plants 2022, 11, 2090. [Google Scholar] [CrossRef]
  10. Faleiro, F.V.; Machado, R.B.; Loyola, R.D. Defining spatial conservation priorities in the face of land-use and climate change. Biol. Conserv. 2013, 158, 248–257. [Google Scholar] [CrossRef]
  11. Peterson, A.T.; Papes, M.; Eaton, M. Transferability and model evaluation in ecological niche modeling: A comparison of GARP and MaxEnt. Ecography 2007, 30, 550–560. [Google Scholar] [CrossRef]
  12. Kozak, K.H.; Graham, C.H.; Wiens, J.J. Integrating GIS-based environmental data into evolutionary biology. Trends Ecol. Evol. 2008, 23, 141–148. [Google Scholar] [CrossRef]
  13. Chen, G.; Kéry, M.; Zhang, J.; Ma, K. Factors affecting detection probability in plant distribution studies. J. Ecol. 2009, 97, 1383–1389. [Google Scholar] [CrossRef]
  14. Bertolini, V.; Damon, A.; Valle Mora, J.; Natanael Rojas Velázquez, A. Distribution and ecological patterns of orchids in Monte Pel-legrino Reserve, Palermo (Sicily, Italy). Biodivers. J. 2012, 3, 375–384. [Google Scholar]
  15. Kalkvik, H.M.; Stout, I.J.; Doonan, T.J.; Parkinson, C.L. Investigating niche and lineage diversification in widely distributed taxa: Phylogeography and ecological niche modeling of the Peromyscus maniculatus species group. Ecography 2012, 35, 54–64. [Google Scholar] [CrossRef]
  16. Kolanowska, M.; Szlachetko, D.L. Niche conservatism of Eulophia alta, a trans-Atlantic orchid species. Acta Soc. Bot. Pol. 2014, 83, 51–57. [Google Scholar] [CrossRef]
  17. Kumar, S.; Stohlgren, T.J. MaxEnt modeling for predicting suitable habitat for threatened and endangered tree Canacomyrica monticola in New Caledonia. J. Ecol. Nat. Environ. 2009, 1, 94–98. [Google Scholar]
  18. Murray-Smith, C.; Brummitt, N.A.; Oliveira-Filho, A.T.; Bachman, S.; Moat, J.; Lughadha, E.M.N.; Lucas, E.J. Plant diversity hotspots in the Atlantic coastal forests of Brazil. Conserv. Biol. 2009, 23, 151–163. [Google Scholar] [CrossRef] [PubMed]
  19. Lehtomäki, J.; Moilanen, A. Methods and workflow for spatial conservation prioritization using Zonation. Environ. Model. Softw. 2013, 47, 128–137. [Google Scholar] [CrossRef]
  20. Yang, X.Q.; Kushwaha, S.P.S.; Saran, S.; Xu, J.; Roy, P.S. MaxEnt modeling for predicting the potential distribution of medicinal plant, Justicia adhatoda L. in Lesser Himalayan foothills. Ecol. Eng. 2013, 51, 83–87. [Google Scholar] [CrossRef]
  21. Elith, J.; Phillips, S.J.; Hastie, T.; Dudík, M.; Chee, Y.E.; Yates, C.J. A statistical explanation of MaxEnt for ecologists. Divers. Distrib. 2011, 17, 43–57. [Google Scholar] [CrossRef]
  22. Fandohan, B.; Assogbadjo, A.E.; Glèlè Kakaï, R.L.; Sinsin, B. Effectiveness of a protected areas network in the conservation of Tamarindus indica (Leguminosea–Caesalpinioideae) in Benin. Afr. J. Ecol. 2011, 49, 40–50. [Google Scholar] [CrossRef]
  23. Phillips, S.B.; Aneja, V.P.; Kang, D.; Arya, S.P. Maximum entropy modeling of species geographic distributions. Ecol. Modell. 2006, 190, 231–259. [Google Scholar] [CrossRef]
  24. Phillips, S.J.; Dudík, M. Modeling of species distributions with MaxEnt: New extensions and a comprehensive evaluation. Ecography 2008, 31, 161–175. [Google Scholar] [CrossRef]
  25. Wan, J.; Wang, C.; Han, S.; Yu, J. Planning the priority protected areas of endangered orchid species in northeastern China. Biodivers. Conserv. 2014, 23, 1395–1409. [Google Scholar] [CrossRef]
  26. Flores Jiménez, Á.; Reyes López, D.; García, D.J.; Romero Arenas, O.; Antonio, J.; Tapia, R.; Lara, M.H.; Silva, A.P. Diversidad de Vanilla spp. (Orchidaceae) y sus perfiles bioclimáticos en México. Rev. Biol. Trop. 2017, 65, 975–987. [Google Scholar] [CrossRef]
  27. Santillán-Fernández, A.; Cabrera, M.T.; Martínez Sánchez, A.; Ángel, L.M.; Vásquez Bautista, N.; Mejía, S.L. Potencial productivo de Vanilla planifolia Jacks en el Totonacapan, México, mediante técnicas geográficas. Rev. Mex. Cienc. Agrícolas 2019, 10, 789–802. [Google Scholar] [CrossRef]
  28. Hernández-Ruíz, J.; Herrera-Cabrera, B.E.; Delgado-Alvarado, A.; Salazar-Rojas, V.M.; Bustamante-Gonzalez, Á.; Campos-Contreras, J.E.; Ramírez-Juarez, J. Distribución potencial y características geográficas de poblaciones silvestres de Vanilla planifolia(Orchidaceae) en Oaxaca, México. Rev. Biol. Trop. 2016, 64, 235–246. [Google Scholar] [CrossRef] [PubMed]
  29. Reyes Hernández, H.; Trinidad García, K.L.; Herrera Cabrera, B.E. Caracterización del ambiente de los vainillales y área potencial para su cultivo en la Huasteca Potosína. Biotecnia 2018, 20, 49–57. [Google Scholar] [CrossRef]
  30. Trinidad García, K.L.; Reyes Hernández, H.; Martínez Salazar, R.I.; Galarza Rincón, E.; Trinidad García, K.L.; Reyes Hernández, H.; Martínez Salazar, R.I.; Galarza Rincón, E. Distribución de Vanilla planifolia Jacks. ex Andrews y acciones para su conservación en la Huasteca Potosina. Rev. Mex. Cienc. For. 2019, 10, 108–134. [Google Scholar] [CrossRef]
  31. Armenta-Montero, S.; Menchaca-García, R.; Pérez-Silva, A.; Velázquez-Rosas, N. Changes in the Potential Distribution of Vanilla planifolia Andrews under Different Climate Change Projections in Mexico. Sustainability 2022, 14, 2881. [Google Scholar] [CrossRef]
  32. Lubinsky, P.; Bory, S.; Hernández Hernández, J.; Kim, S.C.; Gómez-Pompa, A. Origins and dispersal of cultivated vanilla (Vanilla planifolia Jacks. [Orchidaceae]). Econ. Bot. 2008, 62, 127–138. [Google Scholar] [CrossRef]
  33. Cortéz-Marin, A.L.; Aceves-Navarro, L.A.; Arteaga-Ramírez, R.; Vázquez-Peña, M.A. Zonificación agroecológica para aguacate en la zona central de Venezuela. Terra Latinoam. 2005, 23, 159–166. [Google Scholar]
  34. Martínez, M.Á.; Evangelista, V.; Basurto, F.; Mendoza, M.; Cruz-Rivas, A. Flora útil de los cafetales en la Sierra Norte de Puebla, México. Rev. Mex. Biodivers. 2007, 78, 15–40. [Google Scholar] [CrossRef]
  35. Pedroso, H.L.; Rocha-Filho, L.C.; Lomônaco, C. Variación fenotípica de plantas del Cerrado (Sabana brasileña) frente a la heterogeneidad ambiental. Ecosistemas 2010, 19, 24–36. [Google Scholar]
  36. Vargas-Amado, G.; Castro-Castro, A.; Harker, M.; Villaseñor, J.L.; Ortiz, E.; Rodríguez, A. Distribución geográfica y riqueza del género Cosmos (Asteraceae: Coreopsideae). Rev. Mex. Biodivers. 2013, 84, 536–555. [Google Scholar] [CrossRef]
  37. De Oliveira, R.T.; da Silva Oliveira, J.P.; Macedo, A.F. Vanilla beyond Vanilla planifolia and Vanilla × tahitensis: Taxonomy and Historical Notes, Reproductive Biology, and Metabolites. Plants 2022, 11, 3311. [Google Scholar] [CrossRef]
  38. Villanueva-Viramontes, S.; Hernández-Apolinar, M.; Carnevali Fernández-Concha, G.; Dorantes-Euán, A.; Dzib, G.R.; Martínez-Castillo, J. Vanilla planifolia silvestre y sus parientes en la Península de Yucatán, México: Análisis sistemáticos con ISSR e ITS. Bot. Sci. 2017, 95, 169–187. [Google Scholar] [CrossRef]
  39. Flanagan, N.S.; Navia-Samboni, A.; González-Pérez, E.N.; Mendieta-Matallana, H. Distribution and conservation of vanilla crop wild relatives: The value of local community engagement for biodiversity research. Neotrop. Biol. Conserv. 2022, 17, 205–227. [Google Scholar] [CrossRef]
  40. Hernandez-Ruiz, J.; Delgado-Alvarado, A.; Salazar-Rojas, V.M.; Herrera-Cabrera, B.E. Morphological variation of the labellum of Vanilla planifolia Andrews (Orchidaceae) in Oaxaca, Mexico. Rev. La Fac. Cienc. Agrar. UNCuyo 2020, 52, 160–175. [Google Scholar]
  41. Hernández-Ruiz, J.; Herrera-Cabrera, B.E.; Delgado-Alvarado, A. Variación morfológica del labelo de Vanilla pompona (Orchidaceae) en Oaxaca, México. Rev. Mex. Biodivers. 2019, 90, 16. [Google Scholar] [CrossRef]
  42. Lima-Morales, M.; Herrera-Cabrera, B.E.; Delgado-Alvarado, A. Intraspecific variation of Vanilla planifolia (Orchidaceae) in the Huasteca region, San Luis Potosí, Mexico: Morphometry of floral labellum. Plant Syst. Evol. 2021, 307, 40. [Google Scholar] [CrossRef]
  43. Flanagan, N.S.; Mosquera-Espinosa, A.T. An integrated strategy for the conservation and sustainable use of native Vanilla species in Colombia. Lankesteriana 2016, 16, 201–218. [Google Scholar] [CrossRef]
  44. Herrera, J. The Variability of Organs Differentially Involved in Pollination, and Correlations of Traits in Genisteae (Leguminosae: Papilionoideae). Ann. Bot. 2001, 88, 1027–1037. [Google Scholar] [CrossRef]
  45. Brock, M.T.; Weinig, C. Plasticity and environment-specific covariances: An investigation of floral-vegetative and within flower correlations. Evolution 2007, 61, 2913–2924. [Google Scholar] [CrossRef]
  46. Herrera, J. Flower Size Variation in Rosmarinus officinalis: Individuals, Populations and Habitats. Ann. Bot. 2005, 95, 431–437. [Google Scholar] [CrossRef]
  47. Chiron, G.R.; Guignard, G.; Barale, G. Contribution of Morphometry to the Taxonomy of Baptistonia Barb. Rodr. (Orchidaceae). Candollea 2010, 65, 45–62. [Google Scholar] [CrossRef]
  48. Margońska, H.B.; Kozieradzka-Kiszkurno, M.; Brzezicka, E.; Haliński, Ł.P.; Davies, K.L.; Lipińska, M.M. Crepidium sect. Crepidium (Orchidaceae, Malaxidinae)—Chemical and Morphological Study of Flower Structures in the Context of Pollination Processes. Plants 2021, 10, 2373. [Google Scholar] [CrossRef]
  49. Shipunov, A.B.; Bateman, R.M. Geometric morphometrics as a tool for understanding Dactylorhiza (Orchidaceae) diversity in European Russia. Biol. J. Linn. Soc. 2005, 85, 1–12. [Google Scholar] [CrossRef]
  50. Sobel, J.M.; Streisfeld, M.A. Flower color as a model system for studies of plant evo-devo. Front. Plant Sci. 2013, 4, 321. [Google Scholar] [CrossRef]
  51. Salazar-Rojas, V.M.; Herrera-Cabrera, B.E.; Soto-Arenas, M.Á.; Castillo-González, F. Morphological variation in Laelia anceps subsp. dawsonii f. chilapensis Soto-Arenas Orchidaceae in traditional home gardens of Chilapa, Guerrero, Mexico. Genet. Resour. Crop Evol. 2010, 57, 543–552. [Google Scholar] [CrossRef]
  52. Priyanka, V.; Kumar, R.; Dhaliwal, I.; Kaushik, P. Germplasm Conservation: Instrumental in Agricultural Biodiversity-A Review. Sustainability 2021, 13, 6743. [Google Scholar] [CrossRef]
  53. Villavicencio Nieto, M.Á.; Pérez Escandón, E.B. Vegetación e inventario de la flora útil de la Huasteca y la zona Otomí-Tepehua de Hidalgo. Cienc. Univ. 2010, 1, 23–33. [Google Scholar]
  54. Leoncio, J.; García, M. Lucha campesina en la Huasteca hidalguense. Un estudio regional. Estud. Agrar. 2013, 19, 17–90. [Google Scholar]
  55. Ceja-Romero, J.; Mendoza-Ruiz, A.; López-Ferrari, A.R.; Espejo-Serna, A.; Pérez-García, B.; García-Cruz, J. Las epífitas vasculares del Estado de Hidalgo, México: Diversidad y distribución. Acta Botánica Mex. 2010, 93, 1–39. [Google Scholar] [CrossRef]
  56. Cruz-Cárdenas, G.; López-Mata, L.; Villaseñor, J.L.; Ortiz, E. Potential species distribution modeling and the use of principal component analysis as predictor variables. Rev. Mex. Biodivers. 2014, 85, 189–199. [Google Scholar] [CrossRef]
  57. Drake, J.M.; Beier, J.C. Ecological niche and potential distribution of Anopheles arabiensis in Africa in 2050. Malar. J. 2014, 13, 213. [Google Scholar] [CrossRef] [PubMed]
  58. CONABIO—Comisión Nacional para el Conocimiento y Uso de la Biodiversidad. Available online: http://www.conabio.gob.mx/informacion/gis/ (accessed on 18 May 2022).
  59. Kumar, S.; Graham, J.; West, A.M.; Evangelista, P.H. Using district-level occurrences in MaxEnt for predicting the invasion potential of an exotic insect pest in India. Comput. Electron. Agric. 2014, 103, 55–62. [Google Scholar] [CrossRef]
  60. Fitzgibbon, A.; Pisut, D.; Fleisher, D. Evaluation of Maximum Entropy (MaxEnt) Machine Learning Model to Assess Relationships between Climate and Corn Suitability. Land 2022, 11, 1382. [Google Scholar] [CrossRef]
  61. Warren, D.L.; Seifert, S.N. Ecological niche modeling in MaxEnt: The importance of model complexity and the performance of model selection criteria. Ecol. Appl. 2011, 21, 335–342. [Google Scholar] [CrossRef]
  62. Gunawan, G.; Sulistijorini, S.; Chikmawati, T.; Sobir, S. Predicting suitable areas for Baccaurea angulata in Kalimantan, Indonesia using MaxEnt modelling. Biodiversitas J. Biol. Divers. 2021, 22, 2646–2653. [Google Scholar] [CrossRef]
  63. Padalia, H.; Srivastava, V.; Kushwaha, S.P.S. Modeling potential invasion range of alien invasive species, Hyptis suaveolens (L.) Poit. in India: Comparison of MaxEnt and GARP. Ecol. Inform. 2014, 22, 36–43. [Google Scholar] [CrossRef]
  64. Radović, S.; Urošević, A.; Hočevar, K.; Vuleta, A.; Manitašević Jovanović, S.; Tucić, B. Geometric morphometrics of functionally distinct floral organs in Iris pumila: Analyzing patterns of symmetric and asymmetric shape variations. Arch. Biol. Sci. 2017, 69, 223–231. [Google Scholar] [CrossRef]
  65. Caiza Guamba, J.C.; Corredor, D.; Galárraga, C.; Herdoiza, J.P.; Santillán, M.; Segovia-Salcedo, M.C. Geometry morphometrics of plant structures as a phenotypic tool to differentiate Polylepis incana Kunth. and Polylepis racemosa Ruiz & Pav. reforested jointly in Ecuador. Neotrop. Biodivers. 2021, 7, 121–134. [Google Scholar] [CrossRef]
  66. Ibacache, M.V.T.; Soto, G.M.; Galdames, I.S. Morfometría geométrica y el estudio de las formas biológicas: De la morfología descriptiva a la morfología cuantitativa. Int. J. Morphol. 2010, 28, 977–990. [Google Scholar] [CrossRef]
  67. McPherson, J.M.; Jetz, M. Effects of species’ ecology on the accuracy of distribution models. Ecography 2007, 30, 135–151. [Google Scholar] [CrossRef]
  68. Evangelista, P.H.; Kumar, S.; Stohlgren, T.J.; Jarnevich, C.S.; Crall, A.W.; Norman, J.B.; Barnett, D.T. Modelling invasion for a habitat generalist and a specialist plant species. Divers. Distrib. 2008, 14, 808–817. [Google Scholar] [CrossRef]
  69. Jaryan, V.; Datta, A.; Uniyal, S.K.; Kumar, A.; Gupta, R.C.; Singh, R.D. Modelling potential distribution of Sapium sebiferum—An invasive tree species in western Himalaya. Curr. Sci. 2013, 105, 1282–1288. [Google Scholar]
  70. Shcheglovitova, M.; Anderson, R.P. Estimating optimal complexity for ecological niche models: A jackknife approach for species with small sample sizes. Ecol. Modell. 2013, 269, 9–17. [Google Scholar] [CrossRef]
  71. Barrera-Rodríguez, A.; Herrera-Cabrera, B.E.; Jaramillo-Villanueva, J.L.; Escobedo-Garrido, S.; Bustamante-González, A. Caracterización de los sistemas de producción de vainilla (Vanilla planifolia A.) bajo naranjo y en malla sombra en el Totonacapan. Trop. Subtrop. Agroecosyst. 2009, 10, 199–212. [Google Scholar]
  72. García-González, A.; Damon, A.; Esparza, O.; Ligia, G.; Valle-Mora, J. Population structure of Oncidium poikilostalix (Orchidaceae), in coffee plantations. Lankesteriana Int. J. Orchid. 2011, 11, 23–32. [Google Scholar]
  73. Moorhead, L.C.; Philpott, S.M.; Bichier, P. Epiphyte biodiversity in the coffee agricultural matrix: Canopy stratification and distance from forest fragments. Conserv. Biol. 2010, 24, 737–746. [Google Scholar] [CrossRef] [PubMed]
  74. Rasmussen, C. Diversity and abundance of orchid bees (Hymenoptera: Apidae, Euglossini) in a tropical rainforest succession. Neotrop. Entomol. 2009, 38, 66–73. [Google Scholar] [CrossRef]
  75. Lozano, F.D.; Schwartz, M.W. Patterns of rarity and taxonomic group size in plants. Biol. Conserv. 2005, 126, 146–154. [Google Scholar] [CrossRef]
  76. Tsiftsis, S.; Tsiripidis, I.; Trigas, P. Identifying important areas for orchid conservation in Crete. Eur. J. Environ. Sci. 2012, 1, 28–37. [Google Scholar] [CrossRef]
  77. Condit, R. Spatial patterns in the distribution of tropical tree species. Science 2000, 288, 1414–1418. [Google Scholar] [CrossRef]
  78. Casazza, G.; Zappa, E.; Mariotti, M.G.; Médail, F.; Minuto, L. Ecological and historical factors affecting distribution pattern and richness of endemic plant species: The case of the Maritime and Ligurian Alps hotspot. Divers. Distrib. 2008, 14, 47–58. [Google Scholar] [CrossRef]
  79. Kijowska-Oberc, J.; Staszak, A.M.; Kamiński, J.; Ratajczak, E. Adaptation of Forest Trees to Rapidly Changing Climate. Forests 2020, 11, 123. [Google Scholar] [CrossRef]
  80. Oguz, M.C.; Aycan, M.; Oguz, E.; Poyraz, I.; Yildiz, M. Drought Stress Tolerance in Plants: Interplay of Molecular, Biochemical and Physiological Responses in Important Development Stages. Physiologia 2022, 2, 180–197. [Google Scholar] [CrossRef]
  81. SEMARNAT NORMA Oficial Mexicana NOM-059-SEMARNAT-2010, Protección Ambiental-Especies Nativas de México de Flora y fauna Silvestres-Categorías de Riesgo y Especificaciones para su Inclusión, Exclusión o Cambio-Lista de Especies en Riesgo. Available online: https://www.dof.gob.mx/normasOficiales/4254/semarnat/semarnat.htm (accessed on 23 January 2023).
  82. Soto-Arenas, M.A.; Solano-Gómez, A.R. Ficha técnica de Vanilla planifolia. In Información Actualizada Sobre Las Especies de Orquídeas del PROY-NOM-059-ECOL2000. Bases de Datos SNIB-CONABIO. Proyecto No. W029, 1st ed.; Soto-Arenas, M.A., Ed.; Instituto Chinoin A.C., Herbario de la Asociación Mexicana de Orquideología A.C.: México City, Mexico, 2007; pp. 1–9. [Google Scholar]
  83. Paiaro, V.; Oliva, G.E.; Cocucci, A.A.; Sérsic, A.N. Geographic patterns and environmental drivers of flower and leaf variation in an endemic legume of Southern Patagonia. Plant Ecol. Divers. 2012, 5, 13–25. [Google Scholar] [CrossRef]
  84. Pigliucci, M. Evolution of phenotypic plasticity: Where are we going now? Trends Ecol. Evol. 2005, 20, 481–486. [Google Scholar] [CrossRef]
  85. Hodgins, K.A.; Barrett, S.C.H. Geographic variation in floral morphology and style-morph ratios in a sexually polymorphic daffodil. Am. J. Bot. 2008, 95, 185–195. [Google Scholar] [CrossRef] [PubMed]
  86. Pélabon, C.; Osler, N.C.; Diekmann, M.; Graae, B.J. Decoupled phenotypic variation between floral and vegetative traits: Distinguishing between developmental and environmental correlations. Ann. Bot. 2013, 111, 935–944. [Google Scholar] [CrossRef] [PubMed]
  87. Givnish, T.J. Ecological constraints on the evolution of plasticity in plants. Evol. Ecol. 2002, 16, 213–242. [Google Scholar] [CrossRef]
  88. Blinova, I.V. Intra- and interspecific morphological variation of some European terrestrial orchids along a latitudinal gradient. Russ. J. Ecol. 2012, 43, 111–116. [Google Scholar] [CrossRef]
  89. Ramírez, N.; Nassar, J.M.; Valera, L.; Garay, V.; Briceño, H.; Quijada, M.; Moret, Y.A.; Montilla, J. Variación morfométrica floral en Pachira quinata (Jacq.) W.Alverson (Bombacaceae). Acta Botánica Venez. 2010, 33, 83–102. [Google Scholar]
  90. Mccormick, M.K.; Jacquemyn, H. Research review What constrains the distribution of orchid populations? New Phytol. 2014, 202, 392–400. [Google Scholar] [CrossRef]
  91. Damon, A.; Hernández-Ramírez, F.; Riggi, L.; Verspoor, R.; Bertolini, V.; Lennartz-Walker, M.; Wiles, A.; Burns, A. Pollination of euglossinophylic epiphytic orchids in agroecosystems and forest fragments in southeast Mexico. Eur. J. Environ. Sci. 2012, 2, 5–14. [Google Scholar] [CrossRef]
  92. Benitez-Vieyra, S.; Medina, A.M.; Cocucci, A.A. Variable selection patterns on the labellum shape of Geoblasta pennicillata, a sexually deceptive orchid. J. Evol. Biol. 2009, 22, 2354–2362. [Google Scholar] [CrossRef]
  93. Gaskett, A.C. Floral shape mimicry and variation in sexually deceptive orchids with a shared pollinator. Biol. J. Linn. Soc. 2012, 106, 469–481. [Google Scholar] [CrossRef]
  94. Bory, S.; Grisoni, M.; Duval, M.F.; Besse, P. Biodiversity and preservation of vanilla: Present state of knowledge. Genet. Resour. Crop Evol. 2008, 55, 551–571. [Google Scholar] [CrossRef]
  95. Bateman, R.M.; Rudall, P.J. Evolutionary and Morphometric Implications of Morphological Variation Among Flowers within an Inflorescence: A Case-Study Using European Orchids. Ann. Bot. 2006, 98, 975–993. [Google Scholar] [CrossRef]
  96. Savriama, Y.; Gómez, J.M.; Perfectti, F.; Klingenberg, C.P. Geometric morphometrics of corolla shape: Dissecting components of symmetric and asymmetric variation in Erysimum mediohispanicum (Brassicaceae). New Phytol. 2012, 196, 945–954. [Google Scholar] [CrossRef] [PubMed]
  97. Solís-Montero, L.; Vallejo-Marín, M. Does the morphological fit between flowers and pollinators affect pollen deposition? An experimental test in a buzz-pollinated species with anther dimorphism. Ecol. Evol. 2017, 7, 2706–2715. [Google Scholar] [CrossRef]
  98. Ordano, M.; Fornoni, J.; Boege, K.; Domínguez, C.A. The adaptive value of phenotypic floral integration. New Phytol. 2008, 179, 1183–1192. [Google Scholar] [CrossRef]
  99. Gong, Y.B.; Huang, S.Q. Floral symmetry: Pollinator-mediated stabilizing selection on flower size in bilateral species. Proc. R. Soc. B Biol. Sci. 2009, 276, 4013–4020. [Google Scholar] [CrossRef] [PubMed]
  100. Borba, E.L.; Shepherd, G.J.; Van Den Berg, C.; Semir, J. Floral and Vegetative Morphometrics of Five Pleurothallis (Orchidaceae) Species: Correlation with Taxonomy, Phylogeny, Genetic Variability and Pollination Systems. Ann. Bot. 2002, 90, 230. [Google Scholar] [CrossRef]
  101. Lozano-Rodríguez, M.A.; Luna-Rodríguez, M.; Pench-Canché, J.M.; Menchaca-García, R.A.; Cerdán-Cabrera, C.R. Visit frequency of Euglossine bees (Hymenoptera: Apidae) to mature fruits of Vanilla planifolia (Orchidaceae). Acta Bot. Mex. 2022, 129, e2001. [Google Scholar] [CrossRef]
  102. Pansarin, E. Vanilla flowers: Much more than food-deception. Bot. J. Linn. 2021, 20, 1–17. [Google Scholar] [CrossRef]
  103. Andriamihaja, C.F.; Botomanga, A.; Misandeau, C.; Ramarosandratana, A.V.; Grisoni, M.; Da Silva, D.; Pailler, T.; Jeannoda, V.H.; Besse, P. Integrative taxonomy and phylogeny of leafless Vanilla orchids from the South-West Indian Ocean region reveal two new Malagasy species. J. Syst. Evol. 2022, 61, 80–90. [Google Scholar] [CrossRef]
  104. Ellestad, P.; Perez-Farrera, M.A.; Forest, F.; Buerki, S. Uncovering haplotype diversity in cultivated Mexican vanilla species. Am. J. Bot. 2022, 109, 1120–1138. [Google Scholar] [CrossRef] [PubMed]
  105. Grisoni, M.; Nany, F. The beautiful hills: Half a century of vanilla (Vanilla planifolia Jacks. ex Andrews) breeding in Madagascar. Genet. Resour. Crop Evol. 2021, 68, 1691–1708. [Google Scholar] [CrossRef]
Figure 1. Differe nt stages of life of Vanilla planifolia Andrews, flower in April and immature beans in November.
Diversity 15 00678 g001
Figure 2. (A) Flower of Vanilla planifolia Andrews. (B) Dissection of the labellum. (C) Staining of the labellum. Scale bar: 1 cm.
Diversity 15 00678 g002
Figure 3. Geometric contour morphometry of the V. planifolia labellum. (A) Landmark points. (B) First lines. (C) Secondary lines.
Diversity 15 00678 g003
Figure 4. Locations of the 22 accessions of V. planifolia in the Huasteca of Hidalgo.
Diversity 15 00678 g004
Figure 5. Validation of the potential distribution model of V. planifolia in the Huasteca of Hidalgo. (A) Sensitivity versus specificity. The red curve represents the fit of the model to the sample data. The blue curve indicates the degree of adjustment of the model to the test data, which is the real test of the predictive power of the model. The black line represents the expected line if the model were no better than random. (B) The omission rate of the model created by MaxEnt and the cumulative threshold of the predicted area. If the omission on the test samples is close to the predicted omission, the distribution model for V. planifolia is considered to be adequate.
Diversity 15 00678 g005
Figure 6. Potential distribution of V. planifolia in the Huasteca of Hidalgo. The color variation showed the probability of finding vanilla populations or individuals. GI: Group I, GII: Group II, GIII: Group III.
Diversity 15 00678 g006
Figure 7. Jackknife test of the importance of individual environmental variables represented by the dark blue bars, the turquoise bars represent the information expressed by the variables when they are eliminated from the set; the shorter the bar, the more informative the variable. The red bar shows the information expressed by the entire set of variables.
Diversity 15 00678 g007
Figure 8. Dispersion of the 22 accessions of V. planifolia carried out in the Huasteca of Hidalgo (B) and the variables that most affect the PC (A). The colors in the labellum diagram correspond to the PCs, the orange color corresponds to the PC1 variables, green colors correspond to the PC2 variables, and the pink color correspond to the PC3 variables. MI to MV: Morphotype 1 to Morphotype V. Each Morphotype was surrounded with an arbitrary color to differentiate them.
Diversity 15 00678 g008
Figure 9. Multivariate cluster analysis for the identification of vanilla morphotypes. (A) Hierarchical clustering heatmap of the 22 accessions of V. planifolia in the Huasteca of Hidalgo, based on 64 variables and similarity grouping. The differences in intensity of the blue color denote the differences in the behavior of the 64 variables analyzed in a multivariate manner. The scale with blue x shows the values of the Euclidean distance that represent the points where the collects were separated to form the five morphotypes. (B) Morphological expression profile of the labellum variables of each morphotype, based on the behavior of the variables concerning the structure of the dendrogram. The number of lines depends on the number of accessions included in each Morphotype; therefore, Morphotypes I and IV have the highest number of lines.
Diversity 15 00678 g009
Figure 10. Response of V. planifolia to the variables of altitude and precipitation of driest month. (A) This graph shows that the higher the altitude, the lower the probability of finding populations of V. planifolia in the Huasteca of Hidalgo. (B) The probability of finding populations of V. planifolia depending on the amount of rain in the driest month of the year; the higher the rainfall, the greater the probability of finding populations.
Diversity 15 00678 g010
Figure 11. Main environmental factors where the five morphotypes are distributed, no morphotype had a distributions pattern associated with environmental conditions.
Diversity 15 00678 g011
Figure 12. Labellum morphological variables exposed to selection by pollinators of V. planifolia.
Diversity 15 00678 g012
Table 1. Environmental variables used to obtain the potential distribution of V. planifolia in the Huasteca of Hidalgo, Mexico.
CodeEnvironmental VariablesUnits
Bio1Annual mean temperature°C
Bio2Mean diurnal range°C
Bio3IsothermalityDimensionless
Bio4Temperature seasonalityCV
Bio5Max temperature of the warmest month°C
Bio6Min temperature of the coldest month°C
Bio7Temperature annual range°C
Bio8Mean temperature of the wettest quarter°C
Bio9Mean temperature of the driest quarter°C
Bio10Mean temperature of the warmest quarter°C
Bio11Mean temperature of the coldest quarter°C
Bio12Annual precipitationmm
Bio13Precipitation of the wettest monthmm
Bio14Precipitation of the driest monthmm
Bio15Precipitation seasonalityCV
Bio16Precipitation of the wettest quartermm
Bio17Precipitation of the driest quartermm
Bio18Precipitation of the warmest quartermm
Bio19Precipitation of the coldest quartermm
CoverVegetation cover16 types
AltAltitudem
Table 2. Hidalgo accessions and flowers.
MunicipalityLocalityAccessionsNumber of Flowers (Repetition)
AtlapexcoItzocalS120
S213
HuizotlacoS31
S47
San IsidroS527
S626
HuejutlaContepecS719
S818
TezahualS920
XocotitlaS1012
PoxtlaS115
S129
S133
PahuatlánS1430
IchcatepecS1520
JaltocánTlanepantlaS1620
MiradorS1716
HuejutlaCoacuilcoS1817
S1910
S2014
S2111
S2210
Table 3. Location of V. planifolia populations, altitude, climate, and vegetation in the state of Hidalgo, Mexico.
MunicipalityLocalityAccessionAltitudeWeather *Vegetation *
AtlapexcoItzocalS1370Am(f) Warm and wetAgricultural use
S2382
HuizotlacoS3285
S4273
San IsidroS5394
S6350
HuejutlaContepecS7406(A)C(m)(f) Semiwarm-temperate humidTropical or subtropical evergreen broadleaf forest
S8352
TezahualS9414
XocotitlaS10391
PoxtlaS11312Agricultural use
S12367
S13331
PahuatlánS14381
IchcatepecS15545
JaltocánTlanepantlaS16482
MiradorS17316Am(f) Warm and wet
HuejutlaCoacuilcoS18420A(f) Warm humid coldest month less than 18 °CTropical or subtropical evergreen broadleaf forest
S19400
S20473(A)C(fm) Semi-warm humid of group C
S21398
S22423
* Taken from CONABIO data, 2022.
Table 4. Percentage contribution of the variables to the potential distribution model generated by MaxEnt.
VariableContribution (%)
Precipitation of driest month (Bio14)43
Vegetal cover (Cover)14.9
Precipitation of the driest quarter (Bio17)7.2
Temperature seasonality (Bio4)7
Precipitation seasonality (Bio15)6.5
Mean temperature of the wettest quarter (Bio8)5.8
Mean temperature of the driest quarter (Bio9)5.3
Annual mean temperature (Bio1)4.9
Mean diurnal range (Bio2)2.7
Altitude (Alt)1.3
Precipitation of the wettest quarter (Bio16)0.7
Temperature annual range (Bio7)0.6
Table 5. Analysis of variance for the 22 vanilla accessions in the Huasteca of Hidalgo.
VariableMeanCoefficient of
Variation
Mean SquareVariableMeanCoefficient of
Variation
Mean Square
AccessionsErrorAccessionsError
A12.5610.150.52 ***0.06D7.936.052.52 ***0.23
A216.763.464.08 ***0.33E17.111.73.18 ***0.69
A316.853.653.52 ***0.37E26.8111.044.47 ***0.56
A4173.64.70 ***0.37E36.239.275.70 ***0.33
A517.334.043.39 ***0.49E46.312.623.08 ***0.63
A16.773.513.84 ***0.34E55.048.371.51 ***0.17
B12.385.070.16 ***0.01E66.298.622.07 ***0.29
B29.44.062.21 ***0.14E75.97.62.95 ***0.2
B36.876.082.14 ***0.17E84.947.42.01 ***0.13
B49.574.121.37 ***0.15E4.46.481.17 ***0.08
B510.714.212.96 ***0.2F13.3214.371.21 ***0.22
B68.935.285.14 ***0.22F24.947.642.53 ***0.14
B78.835.76.12 ***0.25F34.777.012.25 ***0.11
B810.944.21.81 ***0.21F42.9113.361.49 ***0.15
B8.363.491.02 ***0.08F55.576.852.76 ***0.14
C19.585.12.65 ***0.23F67.3410.844.89 ***0.63
C211.875.826.83 ***0.47F76.79.386.02 ***0.39
C311.455.397.56 ***0.38F85.426.32.56 ***0.11
C49.695.322.11 ***0.26F2.567.250.49 ***0.03
C514.245.127.31 ***0.53G13.5813.41.94 ***0.23
C611.065.762.60 ***0.4G24.4514.892.06 ***0.43
C710.634.532.71 ***0.23G33.5113.62.03 ***0.22
C814.434.996.26 ***0.51G43.3511.291.15 ***0.14
C8.373.61.01 ***0.09G53.1311.680.86 ***0.13
D17.7410.85.30 ***0.7G2.3510.090.75 ***0.05
D212.210.078.31 ***1.51aA24.595.317.64 ***1.69
D310.8310.988.29 ***1.41aB31.865.3235.28 ***2.88
D48.3110.612.93 ***0.77aD55.826.78162.33 ***14.36
D510.846.814.96 ***0.54aE86.623.96122.95 ***11.8
D68.974.732.86 ***0.18aDE22127.878.16972.33 ***109.06
D78.994.872.70 ***0.19aDE55137.058.56967.25 ***137.88
D810.946.564.17 ***0.51aG86.3113.18679.38 ***129.45
*** Significant differences.
Table 6. Vectors, eigenvalues, and cumulative proportion of the variation explained by each variable in the first three PCs.
VariablePC1 *PC2 *PC3 *VariablePC1 *PC2 *PC3 *
A10.0940.103−0.062D0.081−0.2070.236
A20.149−0.0710.04E1−0.0340.1040.261
A30.145−0.0690.048E20.1250.197−0.01
A40.151−0.0620.033E30.146−0.011−0.176
A50.141−0.040.044E40.079−0.1−0.216
A0.148−0.0690.039E50.1370.02−0.053
B10.0660.2170.14E60.1320.1220.084
B20.15−0.0770.058E70.145−0.073−0.157
B30.1180.0780.092E80.147−0.043−0.09
B40.159−0.0080.04E0.139−0.08−0.023
B50.147−0.0390.081F10.0840.1820.096
B60.105−0.214−0.015F20.1380.1750.01
B70.104−0.231−0.006F30.1460.091−0.108
B80.1570.0540.062F40.121−0.127−0.196
B0.147−0.0750.03F50.1420.1520.01
C10.157−0.070.018F60.1250.1910.018
C20.1470.080.061F70.146−0.014−0.179
C30.147−0.001−0.002F80.1480.08−0.089
C40.154−0.02−0.007F0.1320.020.001
C50.156−0.0050.033G10.140.114−0.092
C60.1320.0920.122G20.0920.1240.104
C70.148−0.0660.052G30.1370.049−0.121
C80.1550.0410.024G40.1210.1830.053
C0.15−0.0680.035G50.140.105−0.06
D10.096−0.243−0.048G0.1330.085−0.034
D20.0440.2450.156aA−0.010.249−0.02
D30.112−0.017−0.246aB−0.0460.2260.096
D40.028−0.0520.392aD0.0890.202−0.224
D50.13−0.1320.098aE0.0670.196−0.099
D60.138−0.1410.119aDE220.104−0.15−0.071
D70.119−0.1410.211aDE550.063−0.0150.186
D80.108−0.0790.269aG−0.0630.0170.205
PC1PC2PC3
Eigenvalue36.568.485.6
Variance (%)57.1313.268.76
Accumulative variance (%)57.1370.479.15
* The values in bold represent the variables with the greatest impact on the variation in each PC.
Disclaimer/Publisher’s Note: The statements, opinions and data contained in all publications are solely those of the individual author(s) and contributor(s) and not of MDPI and/or the editor(s). MDPI and/or the editor(s) disclaim responsibility for any injury to people or property resulting from any ideas, methods, instructions or products referred to in the content.

