Article

Diversity and Distribution of 18 Cephalopod Species, and Their Link with Some Environmental Factors in the NW Pacific

Third Institute of Oceanography, Ministry of National Resource, Xiamen 361005, China
*
Author to whom correspondence should be addressed.
Diversity 2023, 15(5), 694; https://doi.org/10.3390/d15050694
Submission received: 19 March 2023 / Revised: 9 May 2023 / Accepted: 20 May 2023 / Published: 22 May 2023
(This article belongs to the Special Issue Diversity and Spatiotemporal Distribution of Nekton)

Abstract

:
Some cephalopods are important fishery resources, with some major economic species living in pelagic waters, possessing short life history cycles, and responding strongly to environmental changes. The analysis of cephalopod community species composition, catch distribution, and their relationship with environmental factors in important marine areas can provide a basic reference for cephalopod biogeography and resource development and utilization. In this study, based on the cephalopod survey data in the spring of 2015 and summer of 2016 in the Pacific Ocean, we analyzed the cephalopod species composition, diversity index (the Margalef richness index, Shannon–Wiener diversity index, and Pielou uniformity index), main contributing species, and catch distribution in the two seasons of spring and summer in the Pacific Ocean. We also analyzed the relationship between cephalopod catch, each diversity index, and environmental factors in each season using the GAM model. The results show that 18 species of cephalopods were captured in the spring and summer, the Margalef richness index, Shannon–Wiener diversity index, and Pielou uniformity index in summer was higher than that in spring; the average catch biomass in spring was significantly higher than that in summer. The main contributing species in spring was Todarodes pacificus, while the main contributing species in summer was Ommastrephes bartramii. The interaction of the “longitude” and “latitude” has a great impact on cephalopod catch biomass in spring, and “sea surface temperature” has a great impact on cephalopod catch biomass in summer. The results of the study can provide a basic reference for the study of cephalopod diversity and resource development and utilization in the Pacific Ocean.

1. Introduction

The Northwest Pacific Ocean is vast, including different large marine ecosystems (LME) such as the West Bering Sea, Okhotsk Sea, Kuroshio, Oyashio, and the Sea of Japan. Among them, the Kuroshio is one of the most important ocean currents in the world. It passes through the Taiwan Province of China and the East China Sea to the Northwest Pacific from south to north, transporting water of relatively high temperature and salinity into the Northwest Pacific [1]. The Oyashio, known as the “Kuril cold current”, comes from the Bering Sea and the Okhotsk Sea, it is a low-temperature current that is rich in plankton. The Oyashio meets and merges with the Kuroshio warm current in the Northeast of Honshu Island, Japan. Under the action of geostrophic bias and Kuroshio, the Oyashio changes to the eastward direction, forming a Kuroshio-Oyashio transition region [2] with the Kuroshio, as shown in Figure 1. Because of the obvious difference in water temperature and salinity between the Kuroshio system and the Oyashio system, the intersection area has the water temperature and bait suitable for the survival of marine organisms, so a large number of marine organisms gather there, forming a fishing ground. Tuna, saury, sardine, squid, and other fish are important regional fishery resources. The region is a famous fishing ground and an active area for material and energy exchange between the equatorial and subtropical Pacific, which also plays an important role in responding to global climate change. El Nino Southern Oscillation and the Pacific interannual oscillation index are the main modes of climate change in the Pacific. They represent the climate change in the Northwest Pacific on a medium and longtime scale and affect the marine ecosystem.
In recent years, rapid climate change has brought some impact on the fisheries in the Northwest Pacific Ocean. The change in intensity associated with the Kuroshio and high tides caused by climate change will affect the formation of their fishing grounds. Taking Ommastrephes bartramii as an example, related studies have pointed out that its suitable habitat range is influenced by water temperature conditions, and climate change, such as the El Niño and La Niña events, can bring about abnormal fluctuations in water temperature, thus affecting its distribution and migration [3,4]. Due to a series of environmental changes and the increase in fishing intensity, Ommastrephes bartramii resources are fully exploited, and the yield has decreased in recent years [5]. It has also been suggested that within the context of global climate change and overfishing of fish stocks, there is some evidence that cephalopod populations are benefiting from this changing setting, and the flexibility of cephalopod resources is fully demonstrated [6].
Cephalopod resource was considered to be one of the three most potential fishery resources in the world by the United Nations Food and Agriculture Organization (FAO), and has become the main fishing objects of major fishery countries and regions [7]. The present species richness database reveals that the most diverse ocean is the Pacific Ocean (with 213 cephalopod species), followed by the Indian (146 species) and Atlantic (95 species) Oceans. The least diverse are the Arctic (12 species) and Southern (15 species) Oceans [6]. The Northwest Pacific Ocean is the most important sea area for cephalopod yield, accounting for about one-third of the world’s total cephalopod catch. According to FAO, the cephalopod production in this sea area has always been the highest among all sea areas (except for 1987), and in 1995, the cephalopod catch in this sea area exceeded 1 million tons. There are 12 species of cephalopods of economic value in the Northwest Pacific Ocean, among them, the Ommastrephes bartramii and the Todarodes pacificus are important targets, and the yield of Todarodes pacificus is relatively high [5]. Related studies have pointed out that there is still much room for the exploitation of cephalopod resources in the Northwest Pacific, but the key is to develop new fishing grounds and identify new fishable species [8]. Although cephalopod resources are currently harvested regularly in most of the sea area, our knowledge of their taxonomy, biology, and ecology is still limited. According to the literature, among about 750–800 species of cephalopods, only 59 of them have been studied relatively thoroughly, with the most studied species being the Ommastrephidae, among which Todarodes pacificus is the most intensively studied [9], and the other cephalopod species are relatively poorly studied. It is the lack of relevant studies that limits the further development of cephalopod resources.
Currently, many countries pay substantial attention to cephalopod resources in the Northwest Pacific. There are some studies about the basic biology, habitats, fishing grounds, and resource status of cephalopods [8,10,11], but overall analyses of species composition, resource status, and the relationship between resource and environmental factors are limited. Among the empirical relationships between cephalopod distribution or abundance and environmental factors that have been documented, some of them seem to be useful for predicting future fisheries [11]. For example, temperature affects cephalopod metabolism and survival, mainly in terms of early embryonic development, recruitment survival, and growth rate [12,13]. In particular, the size of the recruitment is usually related to the ambient temperature during the first months of its life cycle, and the size of the recruitment directly affects the size of the fishery [14,15,16]. In contrast, the range of temperature variation can help to estimate the location where the resource is concentrated and the appropriate time to fish [17]. In addition to temperature, changes in salinity can also affect the survival of cephalopods by influencing their development [18]. If we want to develop new fishing grounds and new catch resources reasonably and effectively, then an in-depth understanding of these factors is needed.
Based on the above background, we analyzed the cephalopod species composition, diversity index (the Margalef richness index, Shannon–Wiener diversity index, and Pielou uniformity index), main contributing species, and catch biomass distribution in the two seasons of spring and summer in the Northwest Pacific Ocean, and analyzed the relationship between cephalopod catch biomass, diversity indices, and environmental factors in each season using the GAM model. The analysis results can provide a basis for improving sustainable exploitation of cephalopods in the Northwest Pacific, and they can provide basic information for fishery prediction, provide the relevant basis and important reference for the research on the response of similar marine organisms to climate change and the protection and management of relevant marine living resources. In addition, they can also provide reference information for the study of geographic patterns of cephalopod organisms and large-scale pattern changes.

2. Material and Methods

2.1. Material

The data used in the analysis of this study are from the survey data of the Northwest Pacific Light Seine. The data fields included the survey date, station information, longitude, latitude, catch composition of each net, and the environmental data (sea surface temperature, salinity, and Chl a). The composition of the survey data is shown in Table 1.
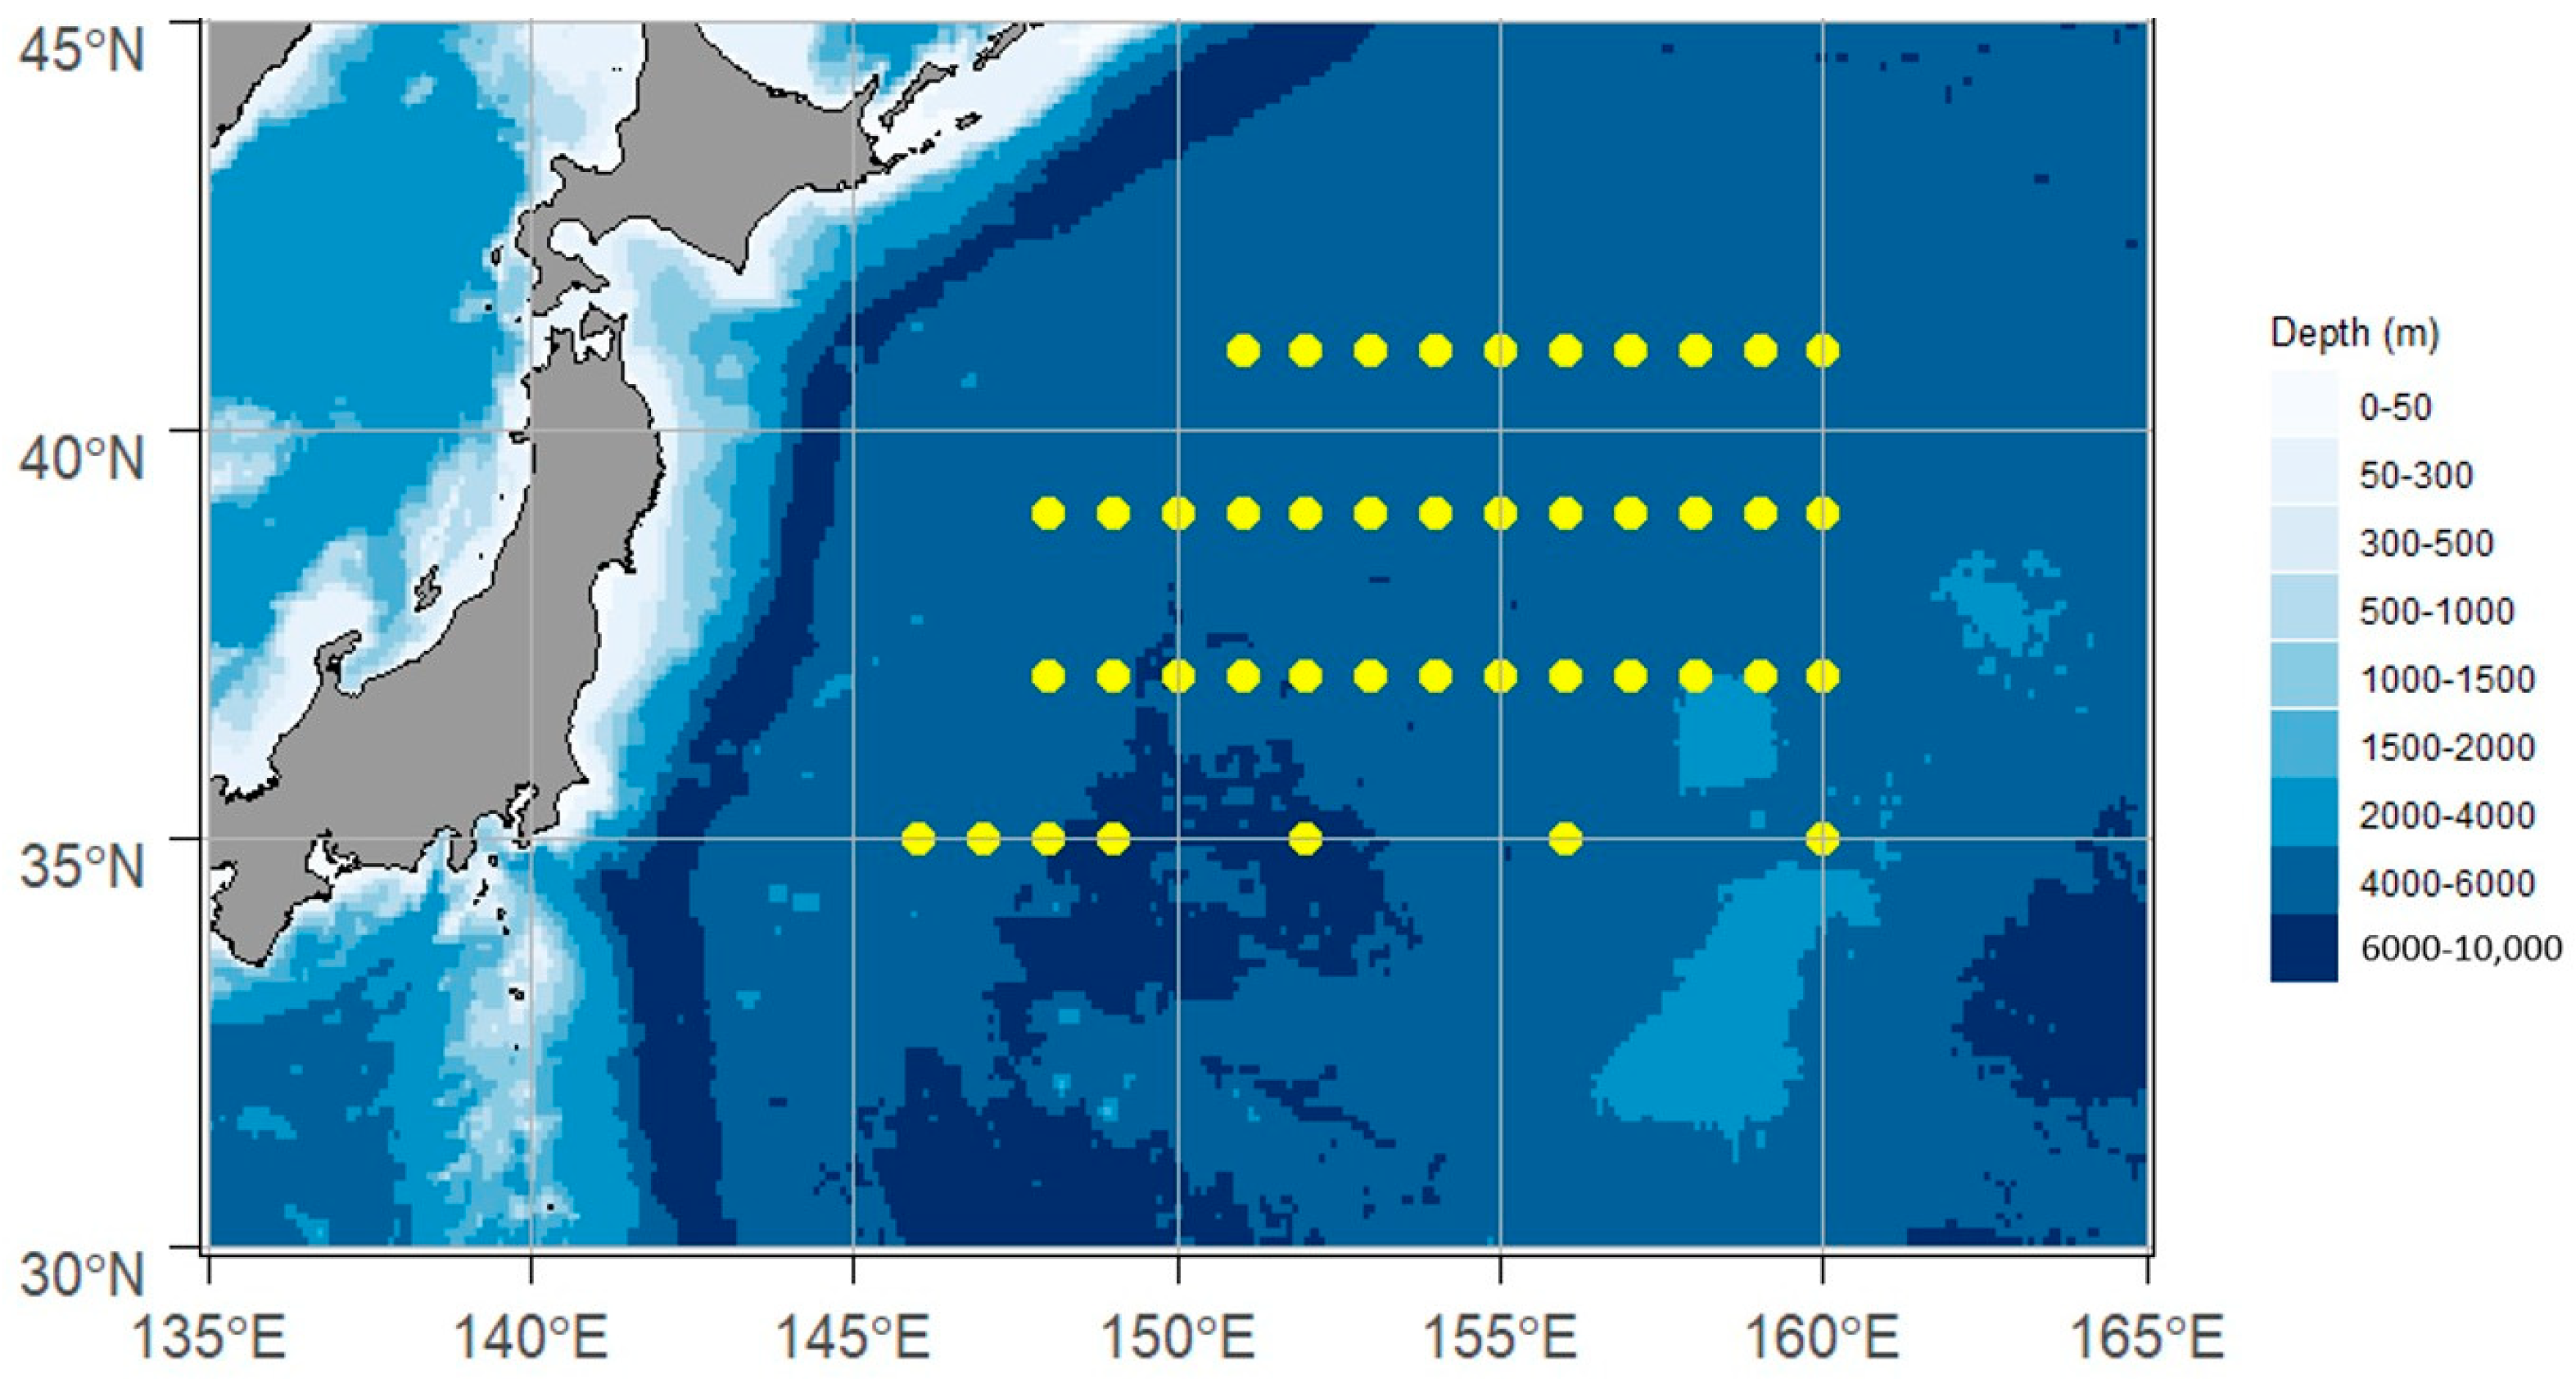
The surveyed area in spring and summer was located in the Northwest Pacific Ocean, with latitude and longitude ranging from 146°00′ E to 160°00′ E and 35°00′ N to 41°00′ N, respectively (Figure 2).

2.1.1. Resource Sampling Method

The spring survey vessels were “Fuyuan Yu 666” and “Fuyuan Yu 667”, and the summer survey vessels were “Fuyuan Yu 080” and “Fuyuan Yu 081”. The four operating vessels were all light purse seine vessels, and their performance parameters were constant. The length of each vessel was 50.5 m, the width was 9.8 m, the draft was 4.6 m, the total tonnage was 830 t, the main power of each vessel was 800 kW, and the auxiliary power was 698 kW. Each vessel was equipped with 110 fishing lights with a power of 4 kW. Equipped with an EK60 portable fish finder and GPS navigator, the length of the net was 1200 m, the perimeter of the Network port is 800 m, the maximum mesh size was 4.5 cm, and the minimum mesh size was 3.5 cm.

2.1.2. Environmental Data Acquisition Method

Environmental data for analysis include longitude, latitude, water temperature, salinity, and Chl a concentration.
The longitude and latitude data are the actual location data of each survey station, and the water temperature, salinity, and Chl a data are the measured data of each station. The water temperature and salinity data are collected by temperature, salt, and depth recorders (SBE37-SM Micro Cat) produced by Sea-Bird company. The Chl a data are obtained by taking the collected water samples back to the laboratory. The water samples were taken through a water collector, the filtered membranes were stored at −20° under light-proof conditions, brought back to the laboratory, and then the fluorescence values in the water samples were determined by a Turner Designs 10-Au Fluorometer, and the Chl a value was calculated according to the classical formula recommended in the Marine Survey Specification.
It should be noted here that, in addition to water temperature, salinity, and Chl a concentration, oxygen is also a very important environmental factor for cephalopods, but due to the limitations of the survey, the corresponding oxygen data were not collected in the survey relied on in this study, so no relevant analysis was conducted, which does not mean that the oxygen factor is not important.

2.2. Methods

2.2.1. Catch (Weight) and Catch (Individual)

Calculated for catch (weight) and catch (individual), respectively, with the following equations:
c a t c h ( w e i g h t ) = C w T
c a t c h ( i n d i v i d u a l ) = C I n d T
C w is the catch biomass of the total catch per station, and the unit is grams; C I n d is the total number of individuals per station, and the unit is individual; T is the operating time per station, and the unit is an hour.

2.2.2. Diversity

The diversity of cephalopods in the Northwest Pacific was calculated by the Margalef index [19], Shannon–Wiener index [20], and Pielou index [21], and the formulas are the following:
M a r g a l e f   i n d e x : D = S 1 / l n N
S h a n n o n W i e n e r   i n d e x : H = P i l n P i
P i e l o u   i n d e x : J = H / l n S
S is the number of species of cephalopods; P i = n i / N is the ratio of cephalopod species i to the biomass of the total catch or the total number of individuals; n i is the biomass or an individual number of the cephalopod species i.

2.2.3. Main Contributing Species

Similarity Percentage (SIMPER) analysis [22,23] was used to analyze the contribution of species to community composition. In this study, the SIMPER analysis was used to screen the main contributing species in each season.
SIMPER analysis is performed using the “Vegan” package in R.

2.2.4. Relationship with Environmental Factors

The generalized additive model (GAM) [24] was used to detect the nonlinear response of environmental factors to the catch of cephalopod, Margalef index, Shannon–Wiener index, and Pielou index. The independent variable in the GAM is environmental factors. In addition, to avoid the collinear relationship between various environmental factors, Pearson correlation analysis was used to analyze the relationship between the respective variables before stepwise regression to confirm the correlation between them. The GAM Formula is (6):
Ln(n) ~ s (Environmental Factor)
where n is the catch (weight) of cephalopod, Margalef index (D), Shannon–Wiener index, (H′), and Pielou index (J′) in each season. To avoid overfitting, the maximum degree of freedom set for the model is 5. The model is regressed step by step, and the optimal model is selected based on the AIC value and the number of model parameters. The GAM was implemented using the “mgcv” package in R.

3. Results

3.1. Cephalopods Species and Diversity

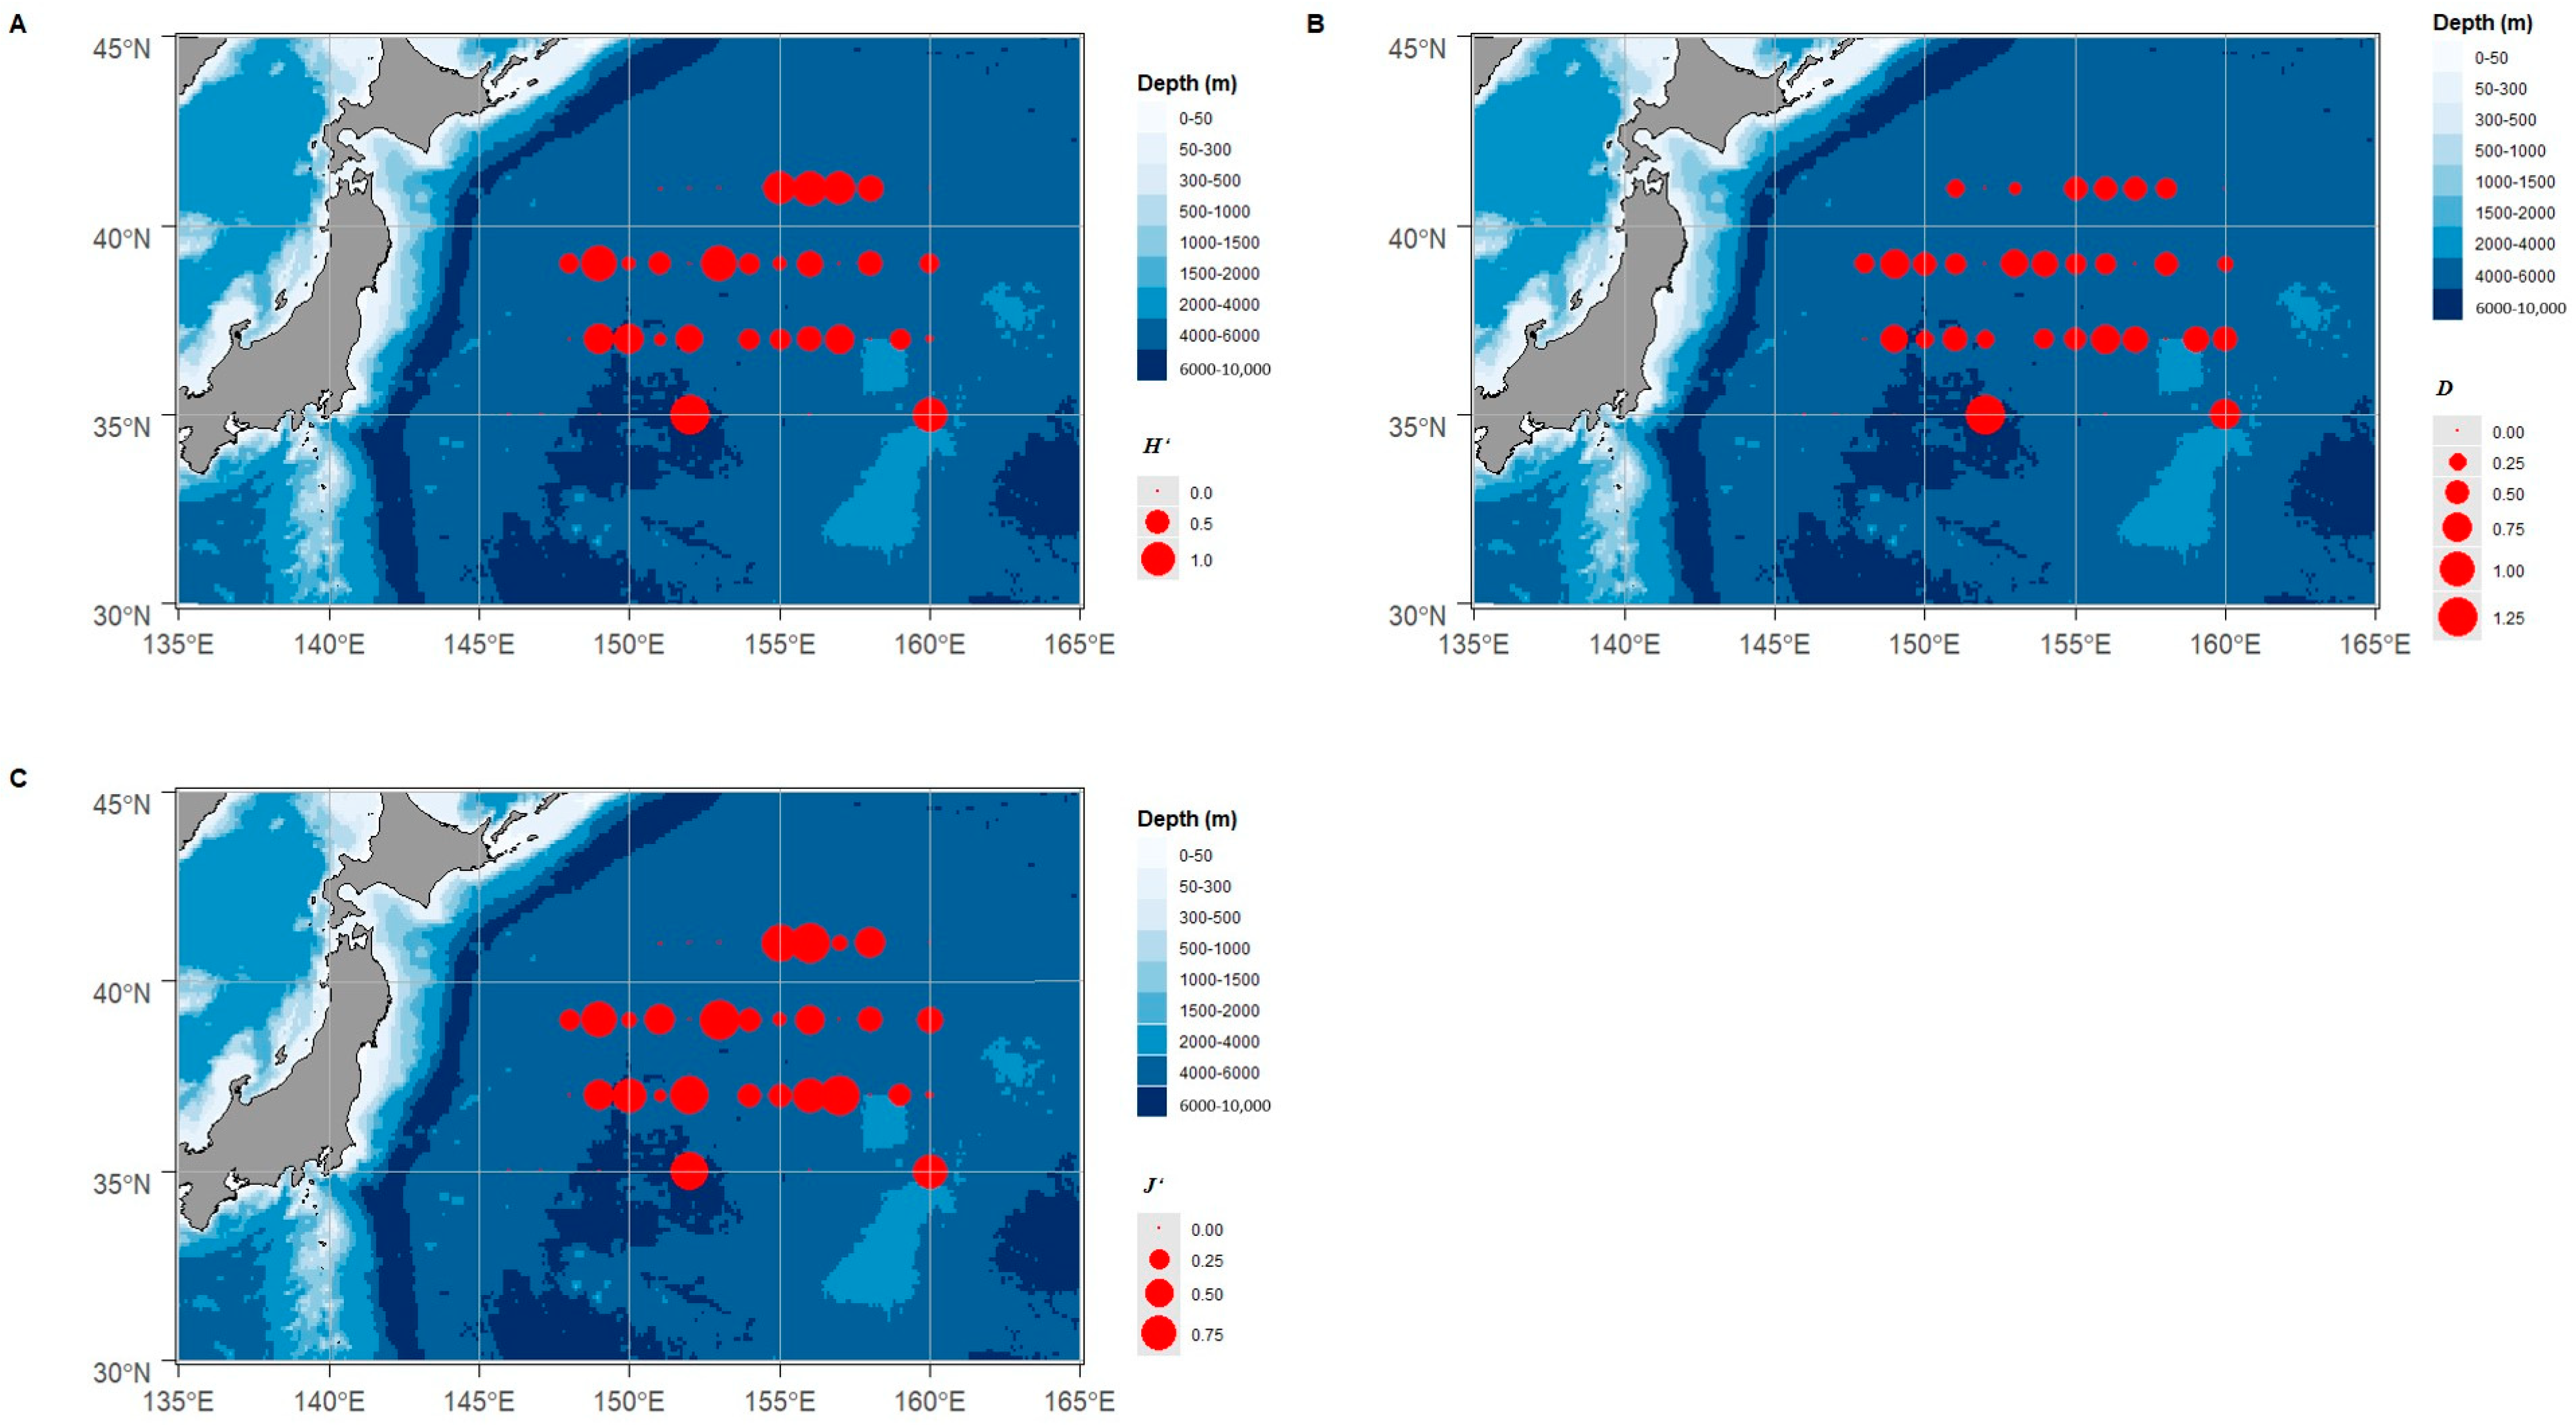
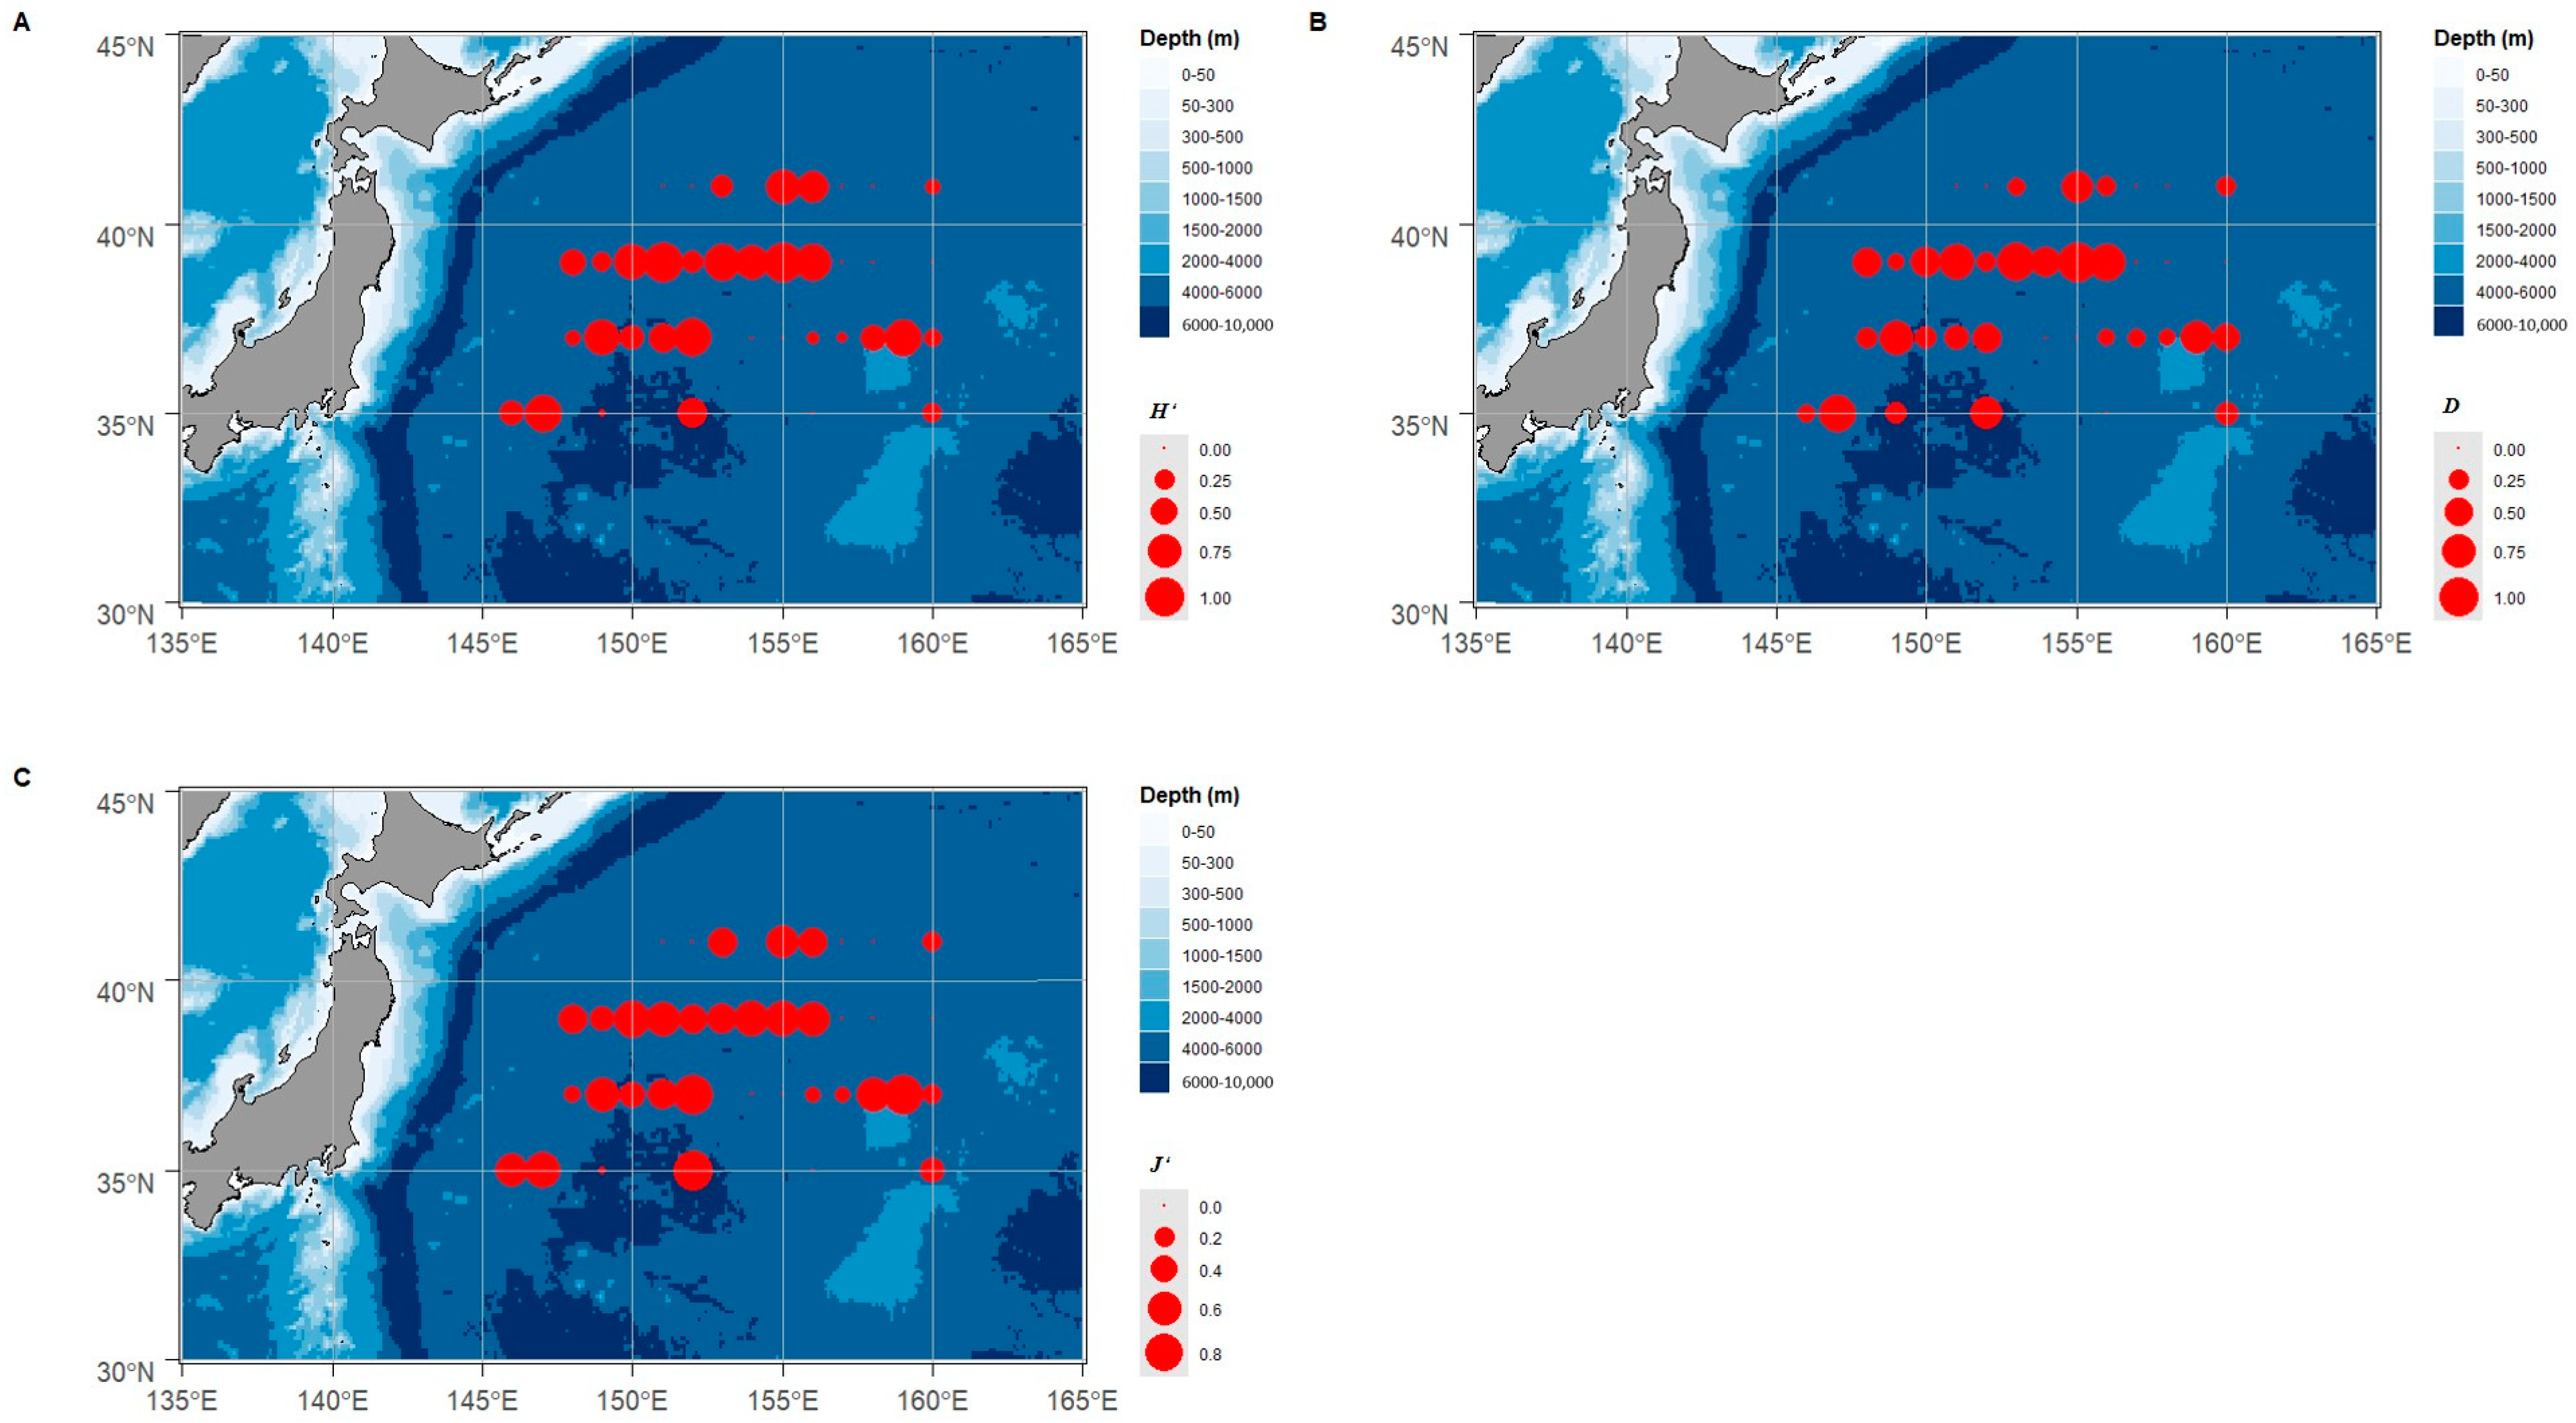
In the two seasons, 18 species of cephalopods, belonging to 2 orders, 9 families, and 13 genera, were captured in the Northwest Pacific Ocean. The specific species list is shown in Table 2. The cephalopod diversity at the same survey stations in spring and summer was shown in Table 3. Overall, the Margalef richness index, Shannon–Wiener diversity index, and Pielou uniformity index were higher in summer than that in spring. The distribution of the Margalef richness index, Shannon–Wiener diversity index, and Pielou uniformity index for each station was shown in Figure 3 and Figure 4.
The main contributing species of cephalopod resources in spring and summer were different (Table 4). The main contributing species in the spring season was Todarodes pacificus, while the main contributing species in summer was Ommastrephes bartramii.

3.2. Resource of Cephalopods Distribution

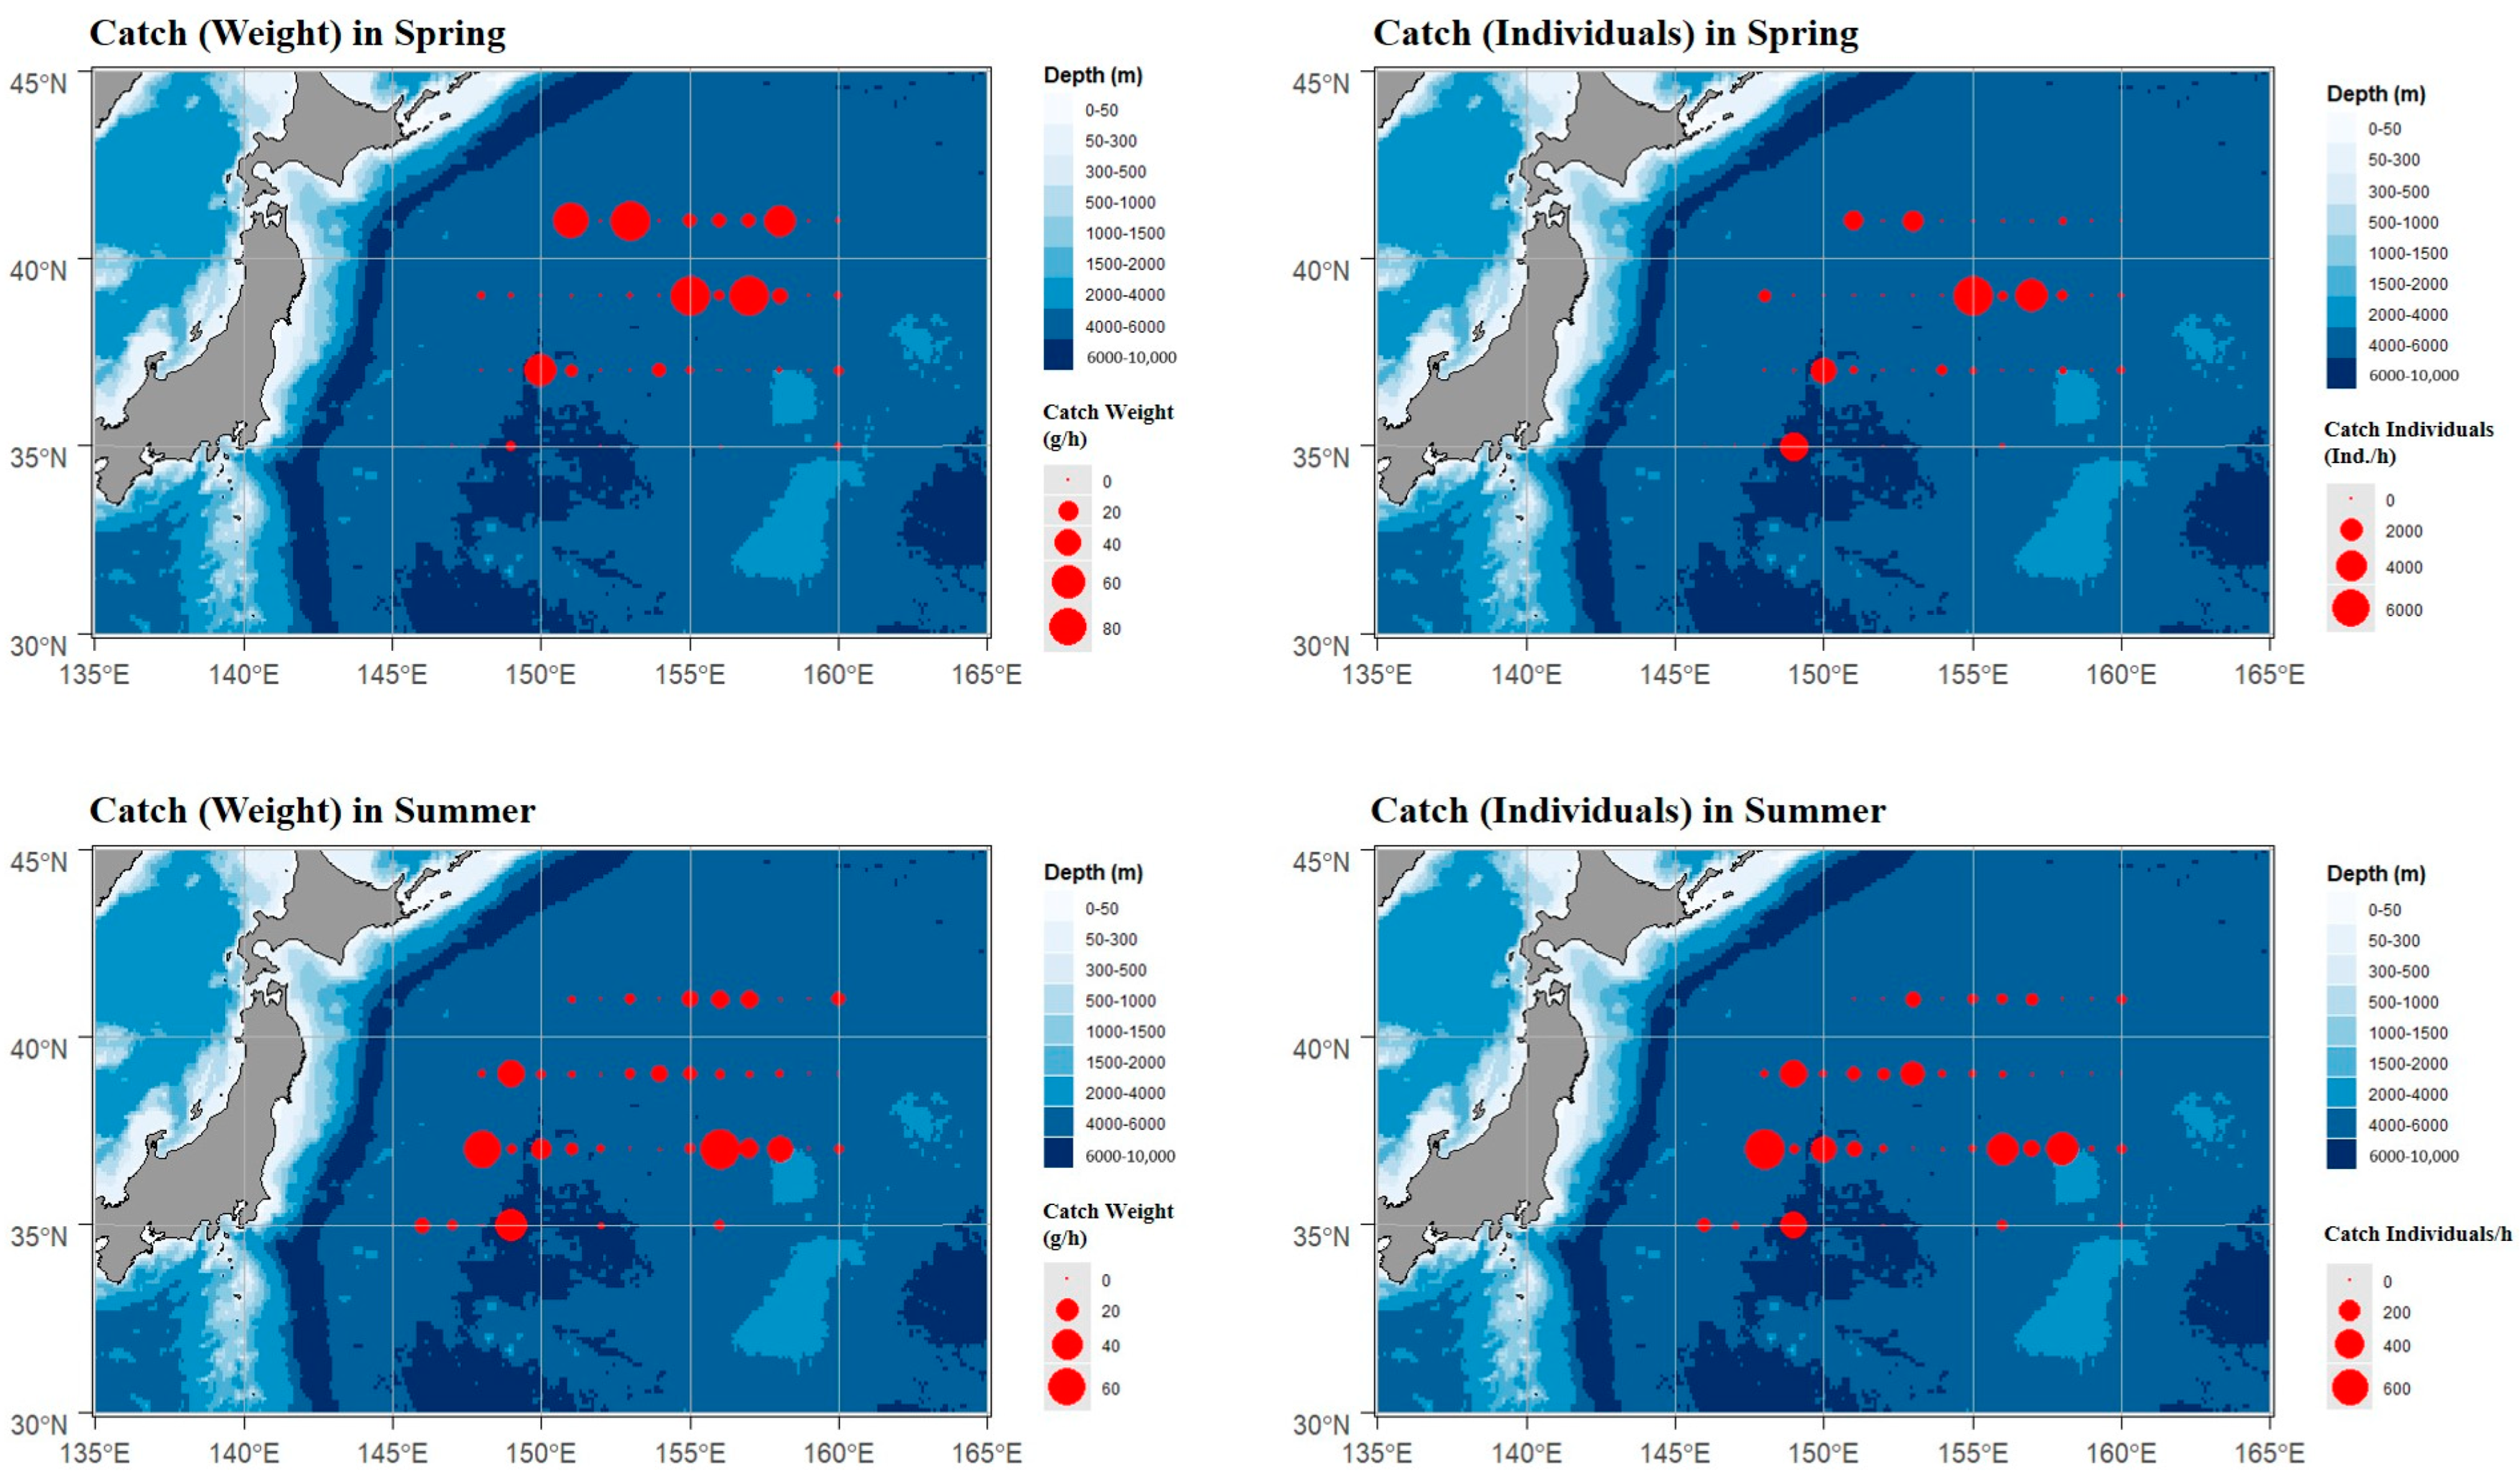
The average catch (weight) of spring cephalopod resources was 19,504.07 g/h, and the average catch (individual) was 809.14 ind./h; the average catch (weight) of summer cephalopod resources was 9541.59 g/h, and the average catch (individual) was 98.31 ind./h, and the catch in spring was significantly higher than that in summer.
The spatial distribution of cephalopod resources in spring and summer is shown in Figure 5, and it can be seen that cephalopod resources in spring were mainly concentrated near the section of 39–41° N, while those in summer were mainly concentrated near the section of 37° N, and there were obvious spatial distribution differences between spring and summer. The distribution of catch (weight) in latitude and longitude is shown in Figure 6. Overall, the variation of cephalopod catches (weight) along longitude and latitude in each season showed a pattern of alternating highs and lows. The distribution of the main contributing species catch (weight) biomass was shown in Figure 7. Catch (weight) of the main contributing species in spring was concentrated in the northern part of the survey area (39–41° N, 150–155° E), while those of the main contributing species in spring were concentrated in the eastern part of the survey area (39° N, 157° E).

3.3. GAM Results

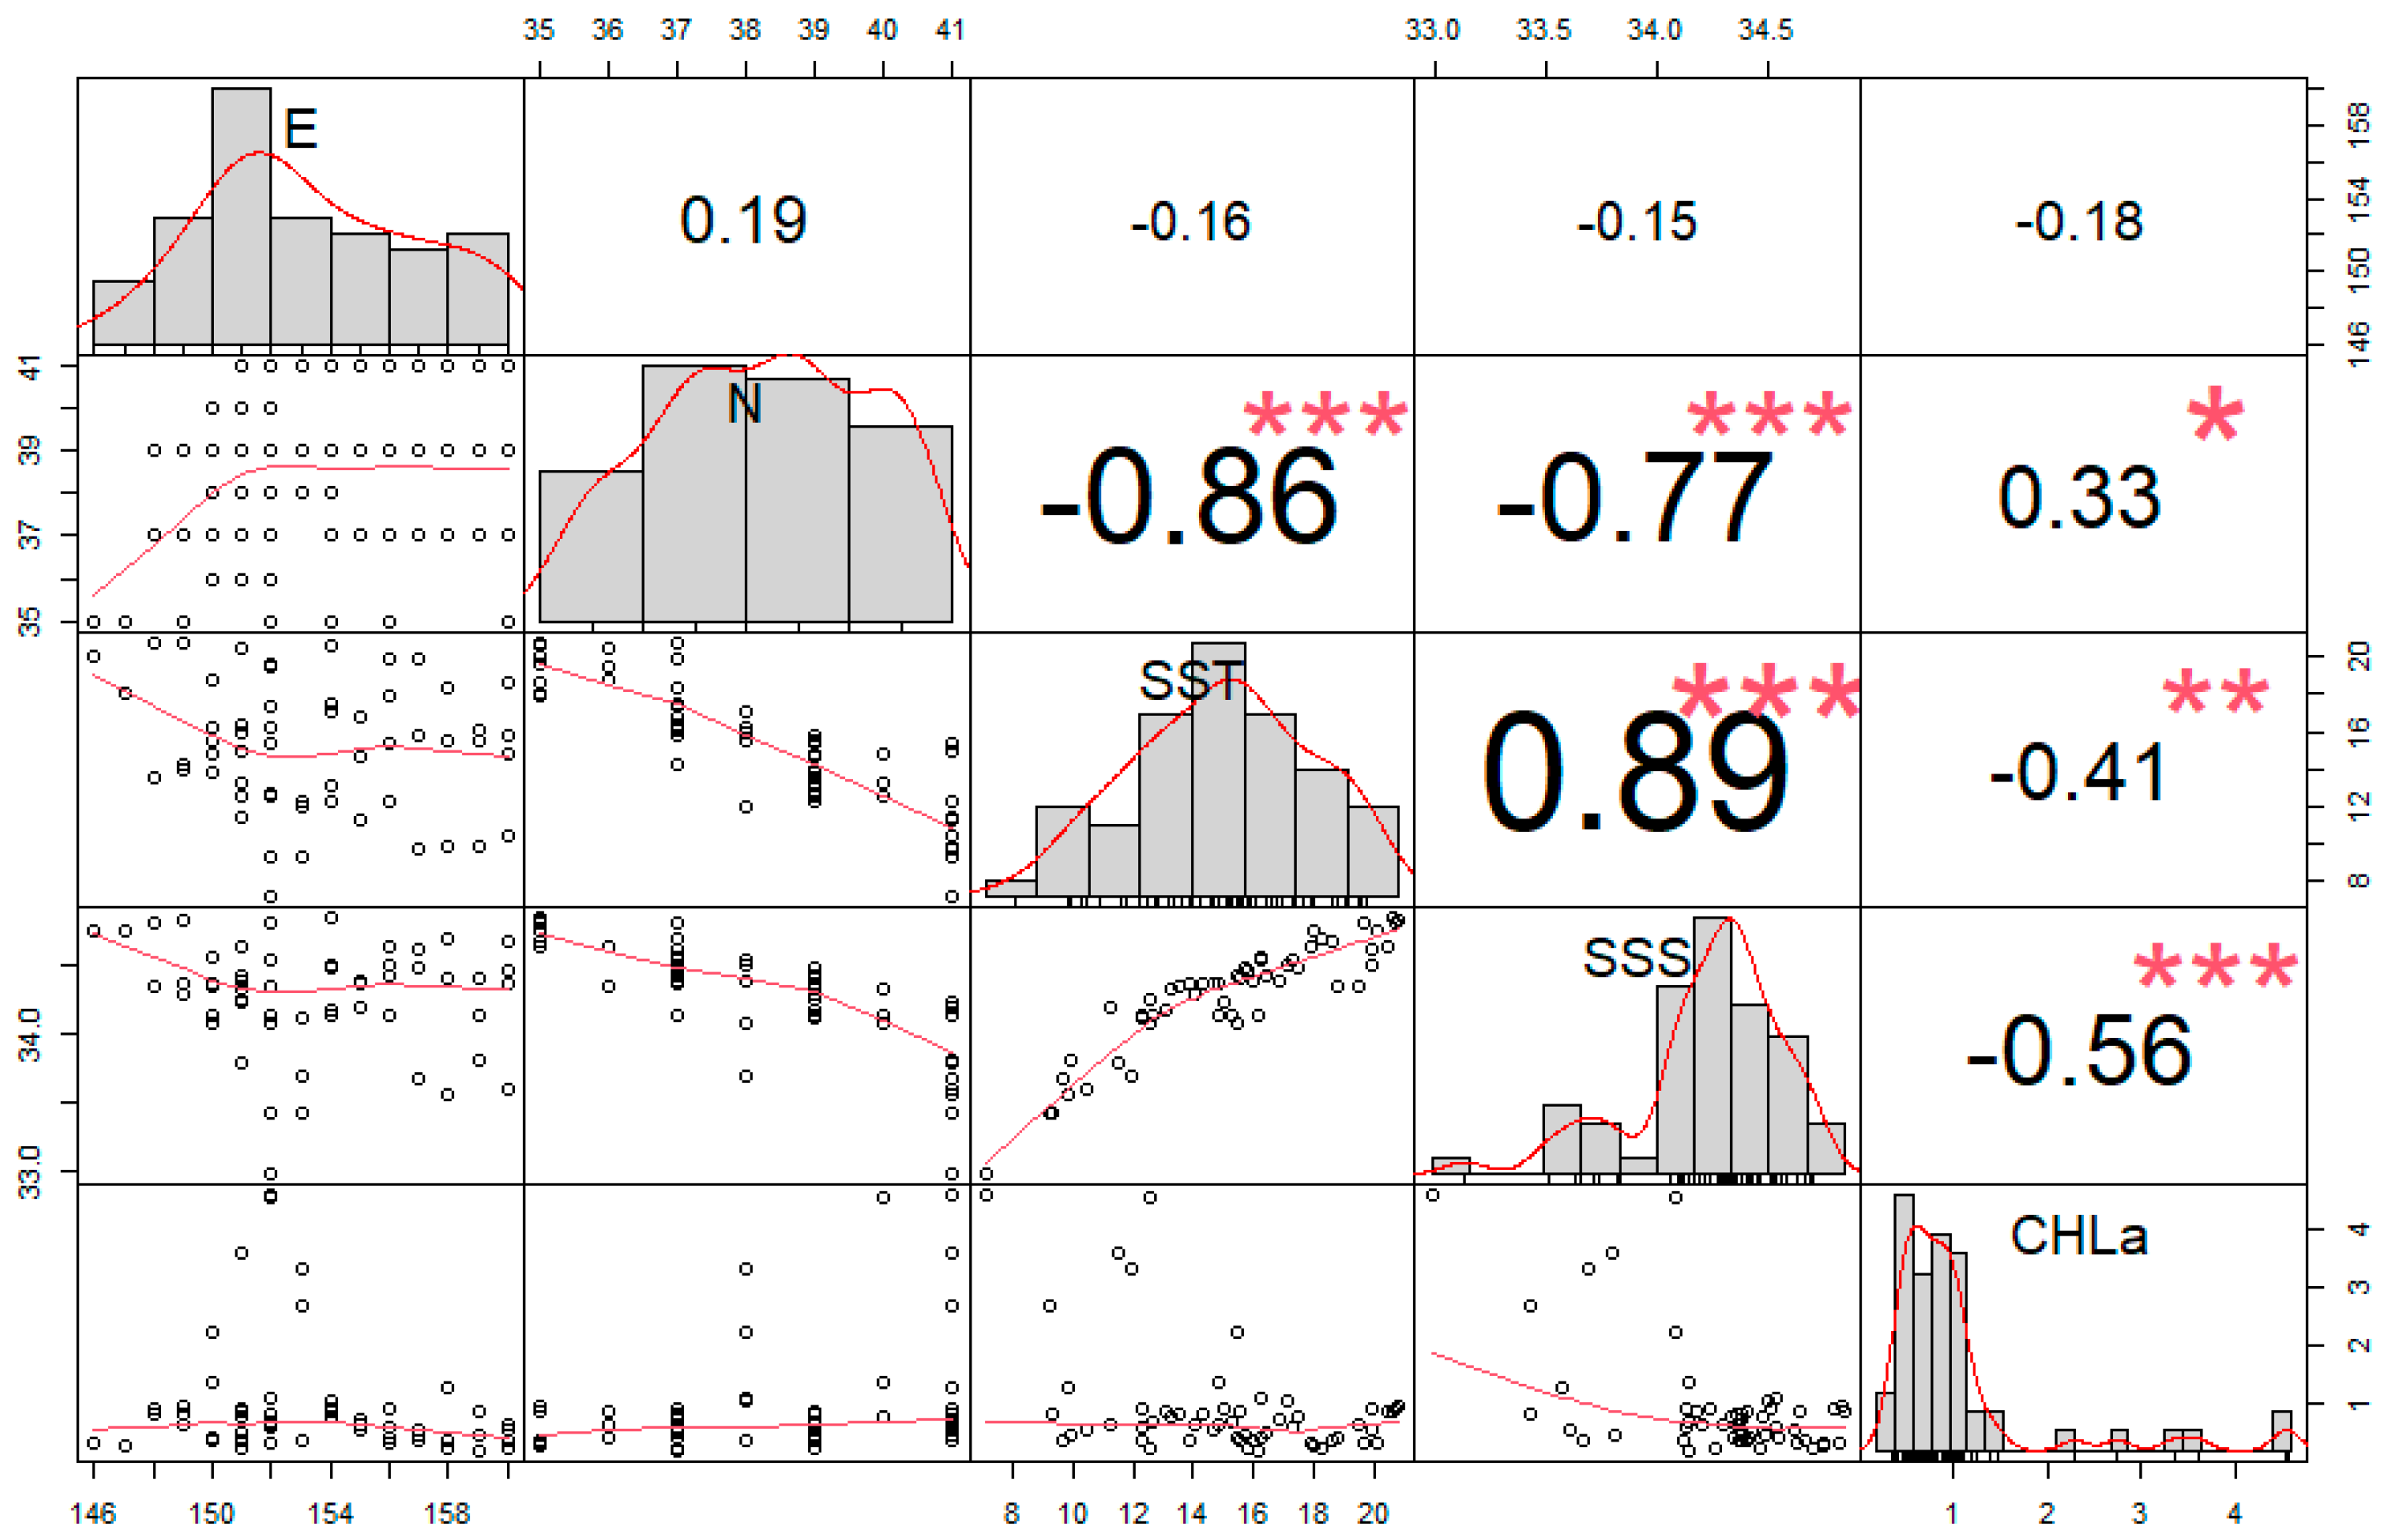
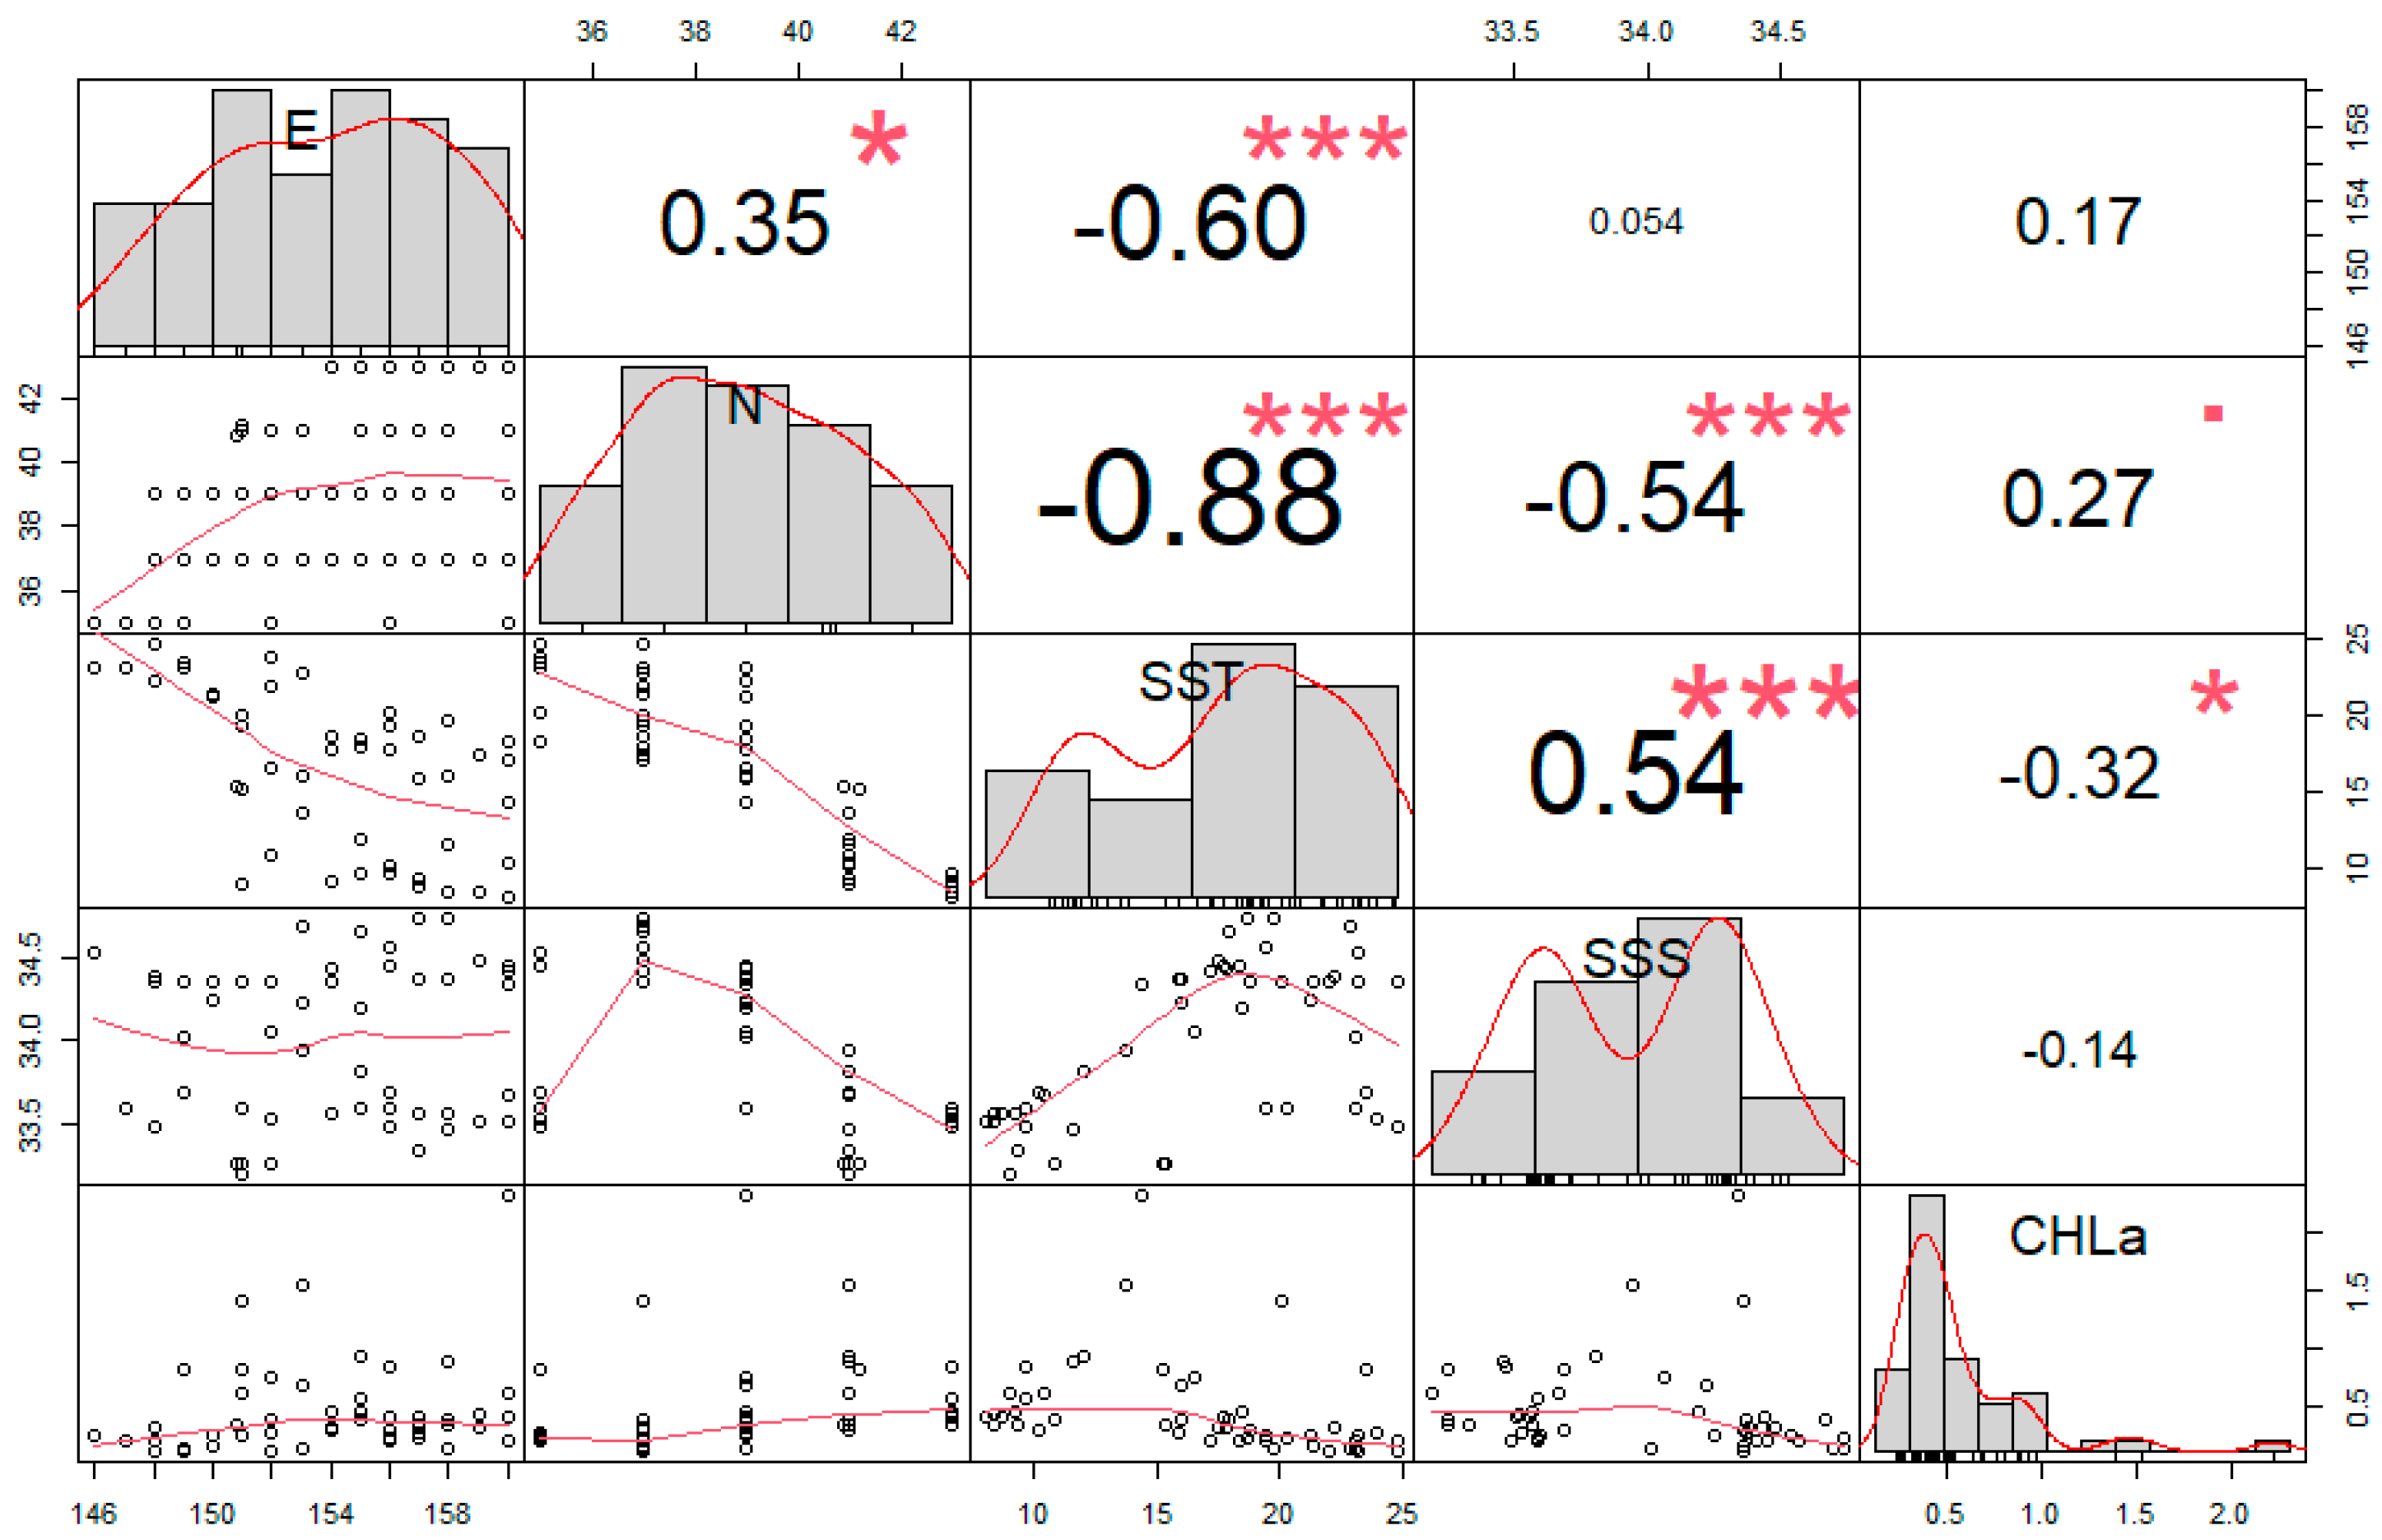
The correlation analysis results show that there is a certain correlation between the respective variables (in spring and summer), as shown in Figure 8 and Figure 9.
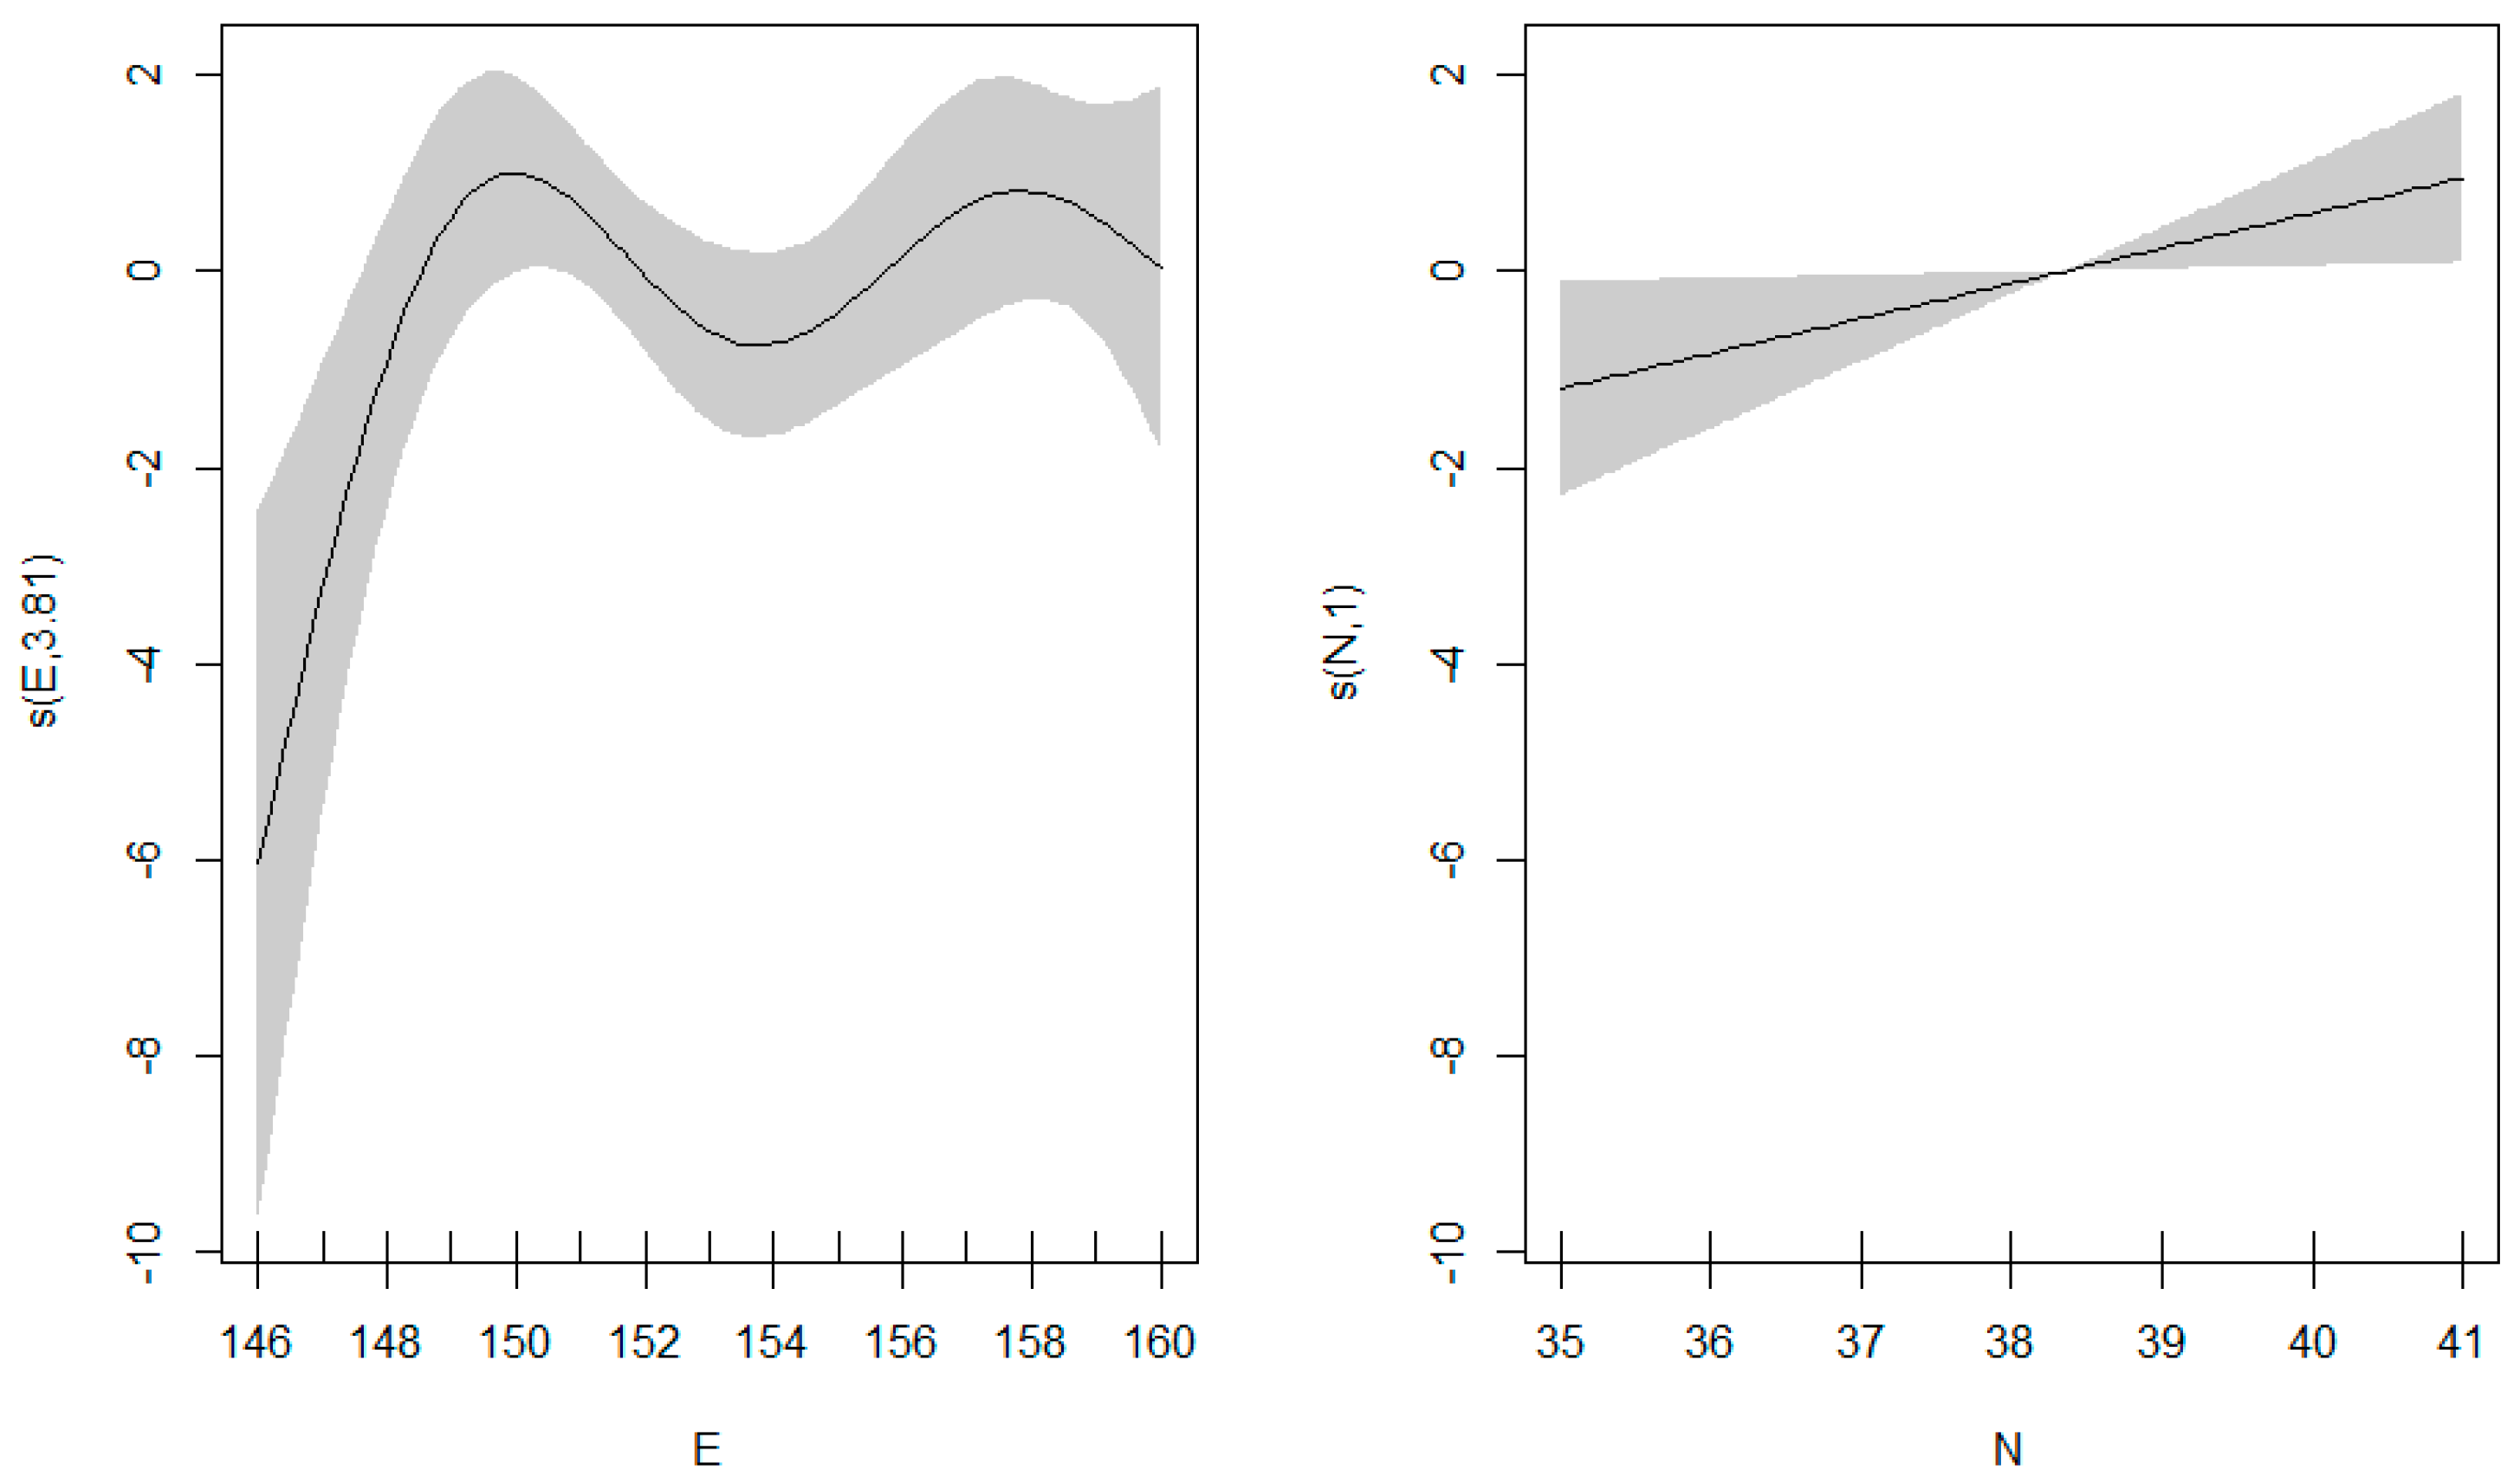
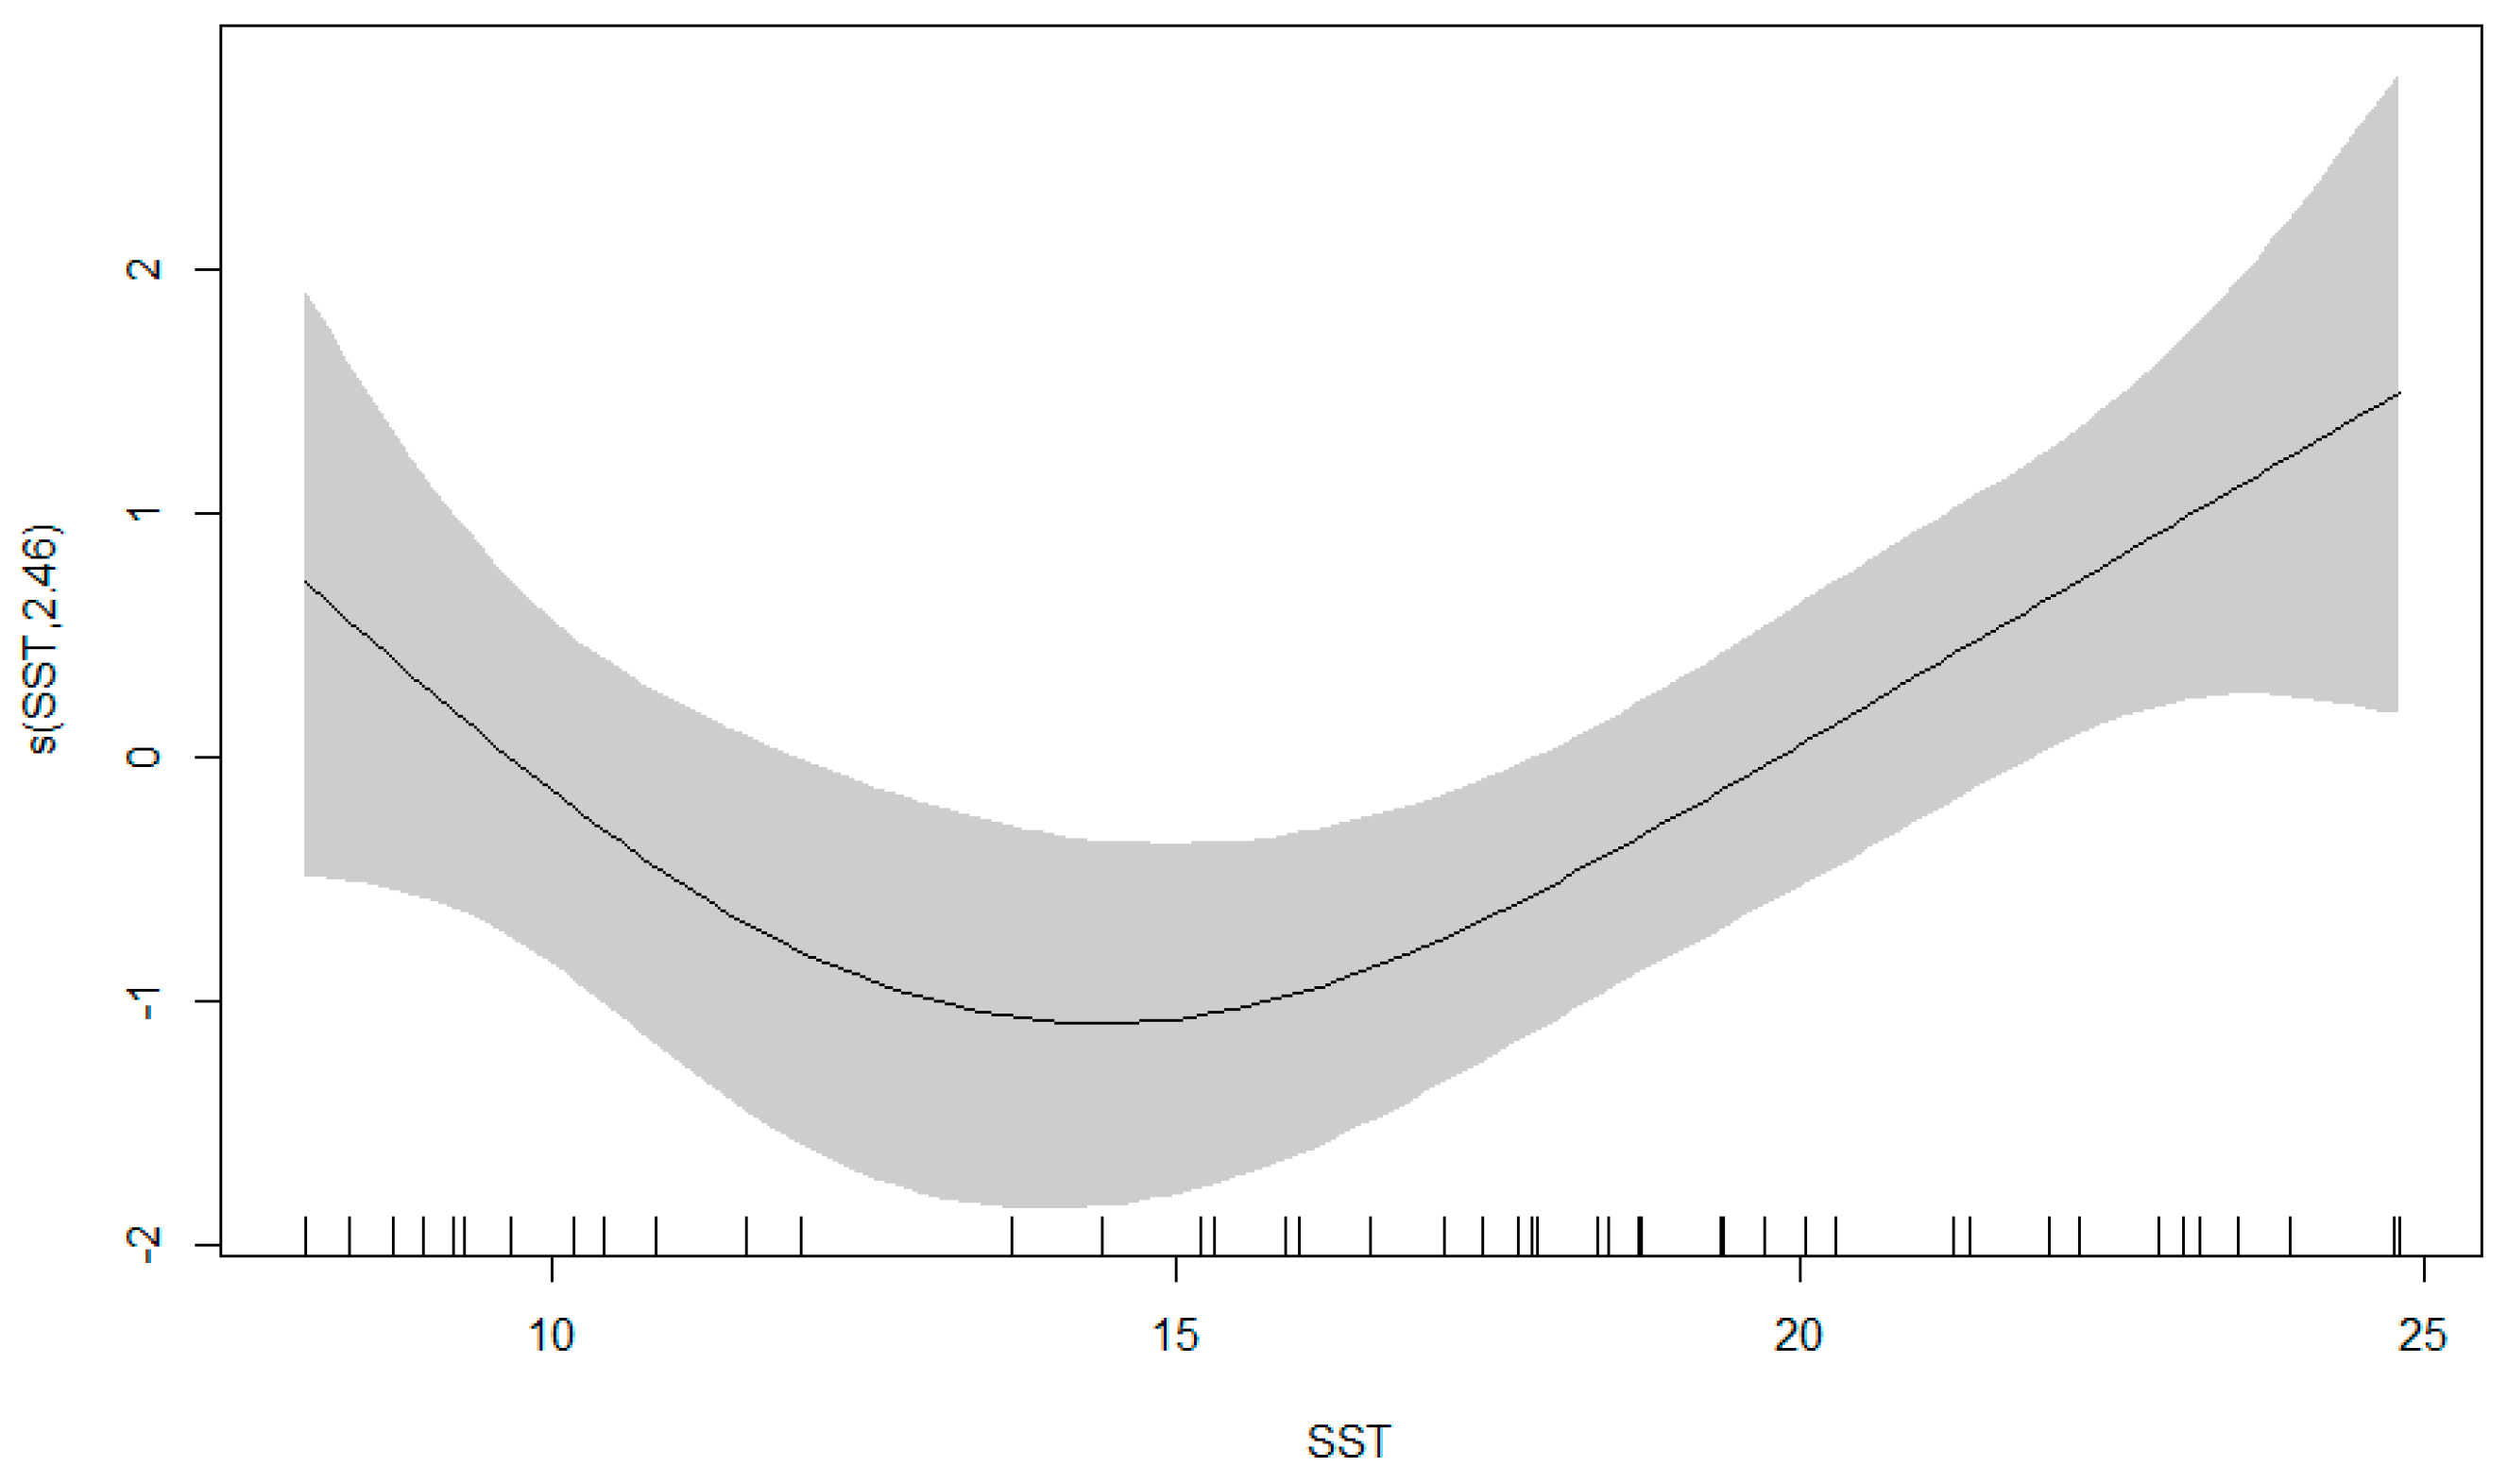
Adhering to the principle of ensuring the simplicity of the model (when a factor is added to the model and the AIC value does not drop by more than 3, it is considered that the factor does not need to be added to the model), the model is not considered to be the optimal model. The influence of various environmental factors on the “Catch (weight) of cephalopod”, Margalef index (D), Shannon–Wiener index (H′), and Pielou index (J′) dependent variables was analyzed by establishing a GAM. In the spring and summer seasons, the optimal model “Ln(n) ~ s(Environmental Factors)” was obtained through stepwise regression. The bolded part of Table 5 is every optimal model and the correlation is shown in Figure 10, Figure 11, Figure 12, Figure 13, Figure 14, Figure 15, Figure 16 and Figure 17.

4. Discussion

4.1. Cephalopods Species Composition and Resource Distribution in the Northwest Pacific

There are around 800 species of cephalopods living today [9]. The present species richness database reveals that the most diverse ocean is the Pacific Ocean, which has 213 cephalopod species [6]. In this study, a total of 18 species of cephalopods were captured in the Northwest Pacific during the spring and summer seasons. Among the 18 cephalopod species captured, the largest number of species recorded and studied was in the Ommastrephidae, accounting for 63% of the number of species in this family [9], and the two dominant species in this survey also belonged to this family. Among the six economic species of Ommastrephidae reported by FAO [6], three species appeared in the spring and four species in the summer. The changes in cephalopod species in this study were mainly related to the survey method and the duration of the survey. Taking the summer cephalopod species as an example, the study duration of the scholars at the Russian Pacific Center in the summer of 2004–2009 was the same as the investigation time in the summer in this study, but the survey area was slightly to the north in the Russian study [25]. The Russian survey results showed that 33 species of cephalopods were captured. This result was higher than the result in this survey, but the gap was not large. There are three main reasons for the difference in species composition: (1) The survey methods were different. The Russian survey adopted middle and upper trawl surveys, and the survey duration was long, the survey method in this study was light seine surveys, which are suitable for fishing for fishes and cephalopods in the middle or upper layer with good net selectivity [26]. However, the method is slightly inferior to the trawler method in terms of investigating species diversity [27]. (2) There are some differences in the location of the surveys, as can also be seen in Figure 1, where the Russian surveys are closer to the location of the fishing grounds and, therefore, correspondingly surveyed more species. (3) There were differences in the timing of the survey, the season is an important factor affecting the composition of cephalopods, and in different seasons, different species of cephalopods will be in different life stages [28]. Most exploited cephalopod species have short life cycles, typically only 1–2 years, and their short life cycles, high metabolic rates, and high growth rates are associated with a high degree of plasticity in life history traits and sensitivity to environmental change [9], and can therefore result in different compositions of collected cephalopods. The main reason for the higher number of species and diversity indices found in the summer than in the spring is also due to the differences in the size and distribution of the populations caused by the different life history characteristics of the various species. The results of this study indicate that the main contributing species in spring is Todarodes pacificus and in summer is Ommastrephes bartramii, both of which have formed a sizeable fishery in the Pacific Northwest, with Todarodes pacificus having a fishery only in the Pacific Ocean, while Ommastrephes bartramii has fisheries in many seas [17]. The main reason for the different main contributing species in the same area, in different seasons, is the different life history stage characteristics of each species, the time and area of spawning, and the migration routes [28,29,30,31,32]. The distribution of bait also affects the spatial and temporal distribution of these two species, and it has been noted that in the area where Todarodes pacificus and Ommastrephes bartramii share a common distribution, Todarodes pacificus prey on mollusks and Ommastrephes bartramii preys on fish, so bait Differences in time and space can lead to high and low biomass of a particular cephalopod during a certain time period [17,33,34].
Regarding catch rate and resource distribution, the results of this study show that the average net biomass and average net individual quantity in spring are higher than those in summer. The spatial distribution of catch (weight) and catch (individual) shows that the high values of catch (weight) and catch (individual) in spring are concentrated in the 39° N section, in addition, there are also some high values of catch (weight) in the 41° N section, but the corresponding catch (individual) values are not high. The corresponding catch (individual) values were not high mainly due to individual differences, such as the large body mass of some cephalopods but the small number of individuals. In summer, the higher values of catch (weight) and catch (individual) were mainly concentrated in the 37° N section, and the distribution was relatively consistent, which could indicate that the cephalopod species were more uniform in summer. The variation of cephalopod catches (weight) along longitude and latitude in each season showed a pattern of alternating highs and lows. The effect of different seasons on resource distribution is probably the most intuitive, but we must further understand more internal causes, e.g., differences in individuals of different cephalopod species over different seasons, differences in the distribution of different populations of the same species, etc., and related elements involving climate change. Cephalopods are an important marine fishery resource with a short life cycle (usually one year) and, in many cases, the end of life occurs after cephalopod spawning [35,36,37]. Although different species of cephalopods have different habits, in the Pacific Ocean, cephalopods are generally divided into autumn and winter-spring groups [36,37]. Both winter-spring and autumn groups spawn in the western Pacific Ocean at a closer distance from shore, and as the season progresses, the whole cephalopod group moves from west to east, forming the western Pacific group and forming a more productive fishing ground.

4.2. Relationship between Cephalopod Resources and Environmental Factors in the Northwest Pacific

This study analyzed the relationship between catch biomass distribution and diversity indices (Margalef richness index, Shannon–Wiener diversity index, and Pielou uniformity index) distribution and environmental factors using the GAM method. The results showed the strongest correlation between catch biomass and “longitude + latitude” in spring. The catch biomass increased with increasing latitude and rose and fell with increasing longitude in the survey area. The main reason for this result is that the northern part of the survey area is closer to the Northwest Pacific fishing grounds [21], which can be found by comparing Figure 1 and Figure 2, and is also supported by the results of numerous studies on the location of the Northwest Pacific fishing grounds. In addition to the proximity of the fishery to the Pacific Northwest, the influence of “longitude + latitude” on catch biomass can also be explained from the perspective of the organisms themselves. The main contributing species in the spring was Todarodes pacificus, which is distributed only in the Pacific Ocean [9] with its distribution centered at 45–50° N. Its population is highly refugial, and its fall spawning population is distributed south of 44° N and spawns from April to December [17]. Todarodes pacificus is the main cephalopod species in the Northwest Pacific fisheries and has been highly productive in recent years [5], which is generally consistent with the results of this study. In addition, it has also been noted that Todarodes pacificus often occurs in large aggregations around seamounts and whirlpools [9,17], and the occurrence of topographic and hydrographic phenomena such as seamounts and whirlpools are dependent on geographic location (longitude and latitude). In summer, the strongest correlation between catch biomass and “sea surface temperature” was observed, decreasing and then increasing with increasing sea surface temperature. The main summer contributor was Ommastrephes bartramii, which is more widely distributed than Todarodes pacificus and has a global oceanic distribution [17]. Ommastrephes bartramii has two principal intraspecific groups, an autumn cohort and a winter-spring cohort [17]. The winter-spring cohort spawns in winter, with incubation occurring from January to May and sometimes into August. The location of the spawning grounds is between 20–30° N and slowly shifts with incubation to a region of 30–40° N and 150–170° E [17,35,37]. The distribution of Ommastrephes bartramii in Figure 7 and the time of the survey suggest that the captured Ommastrephes bartramii are probably still in recruitment and that the recruitment of cephalopods is strongly influenced by “sea surface temperature”, which affects their survival and growth rates [14,15,16].
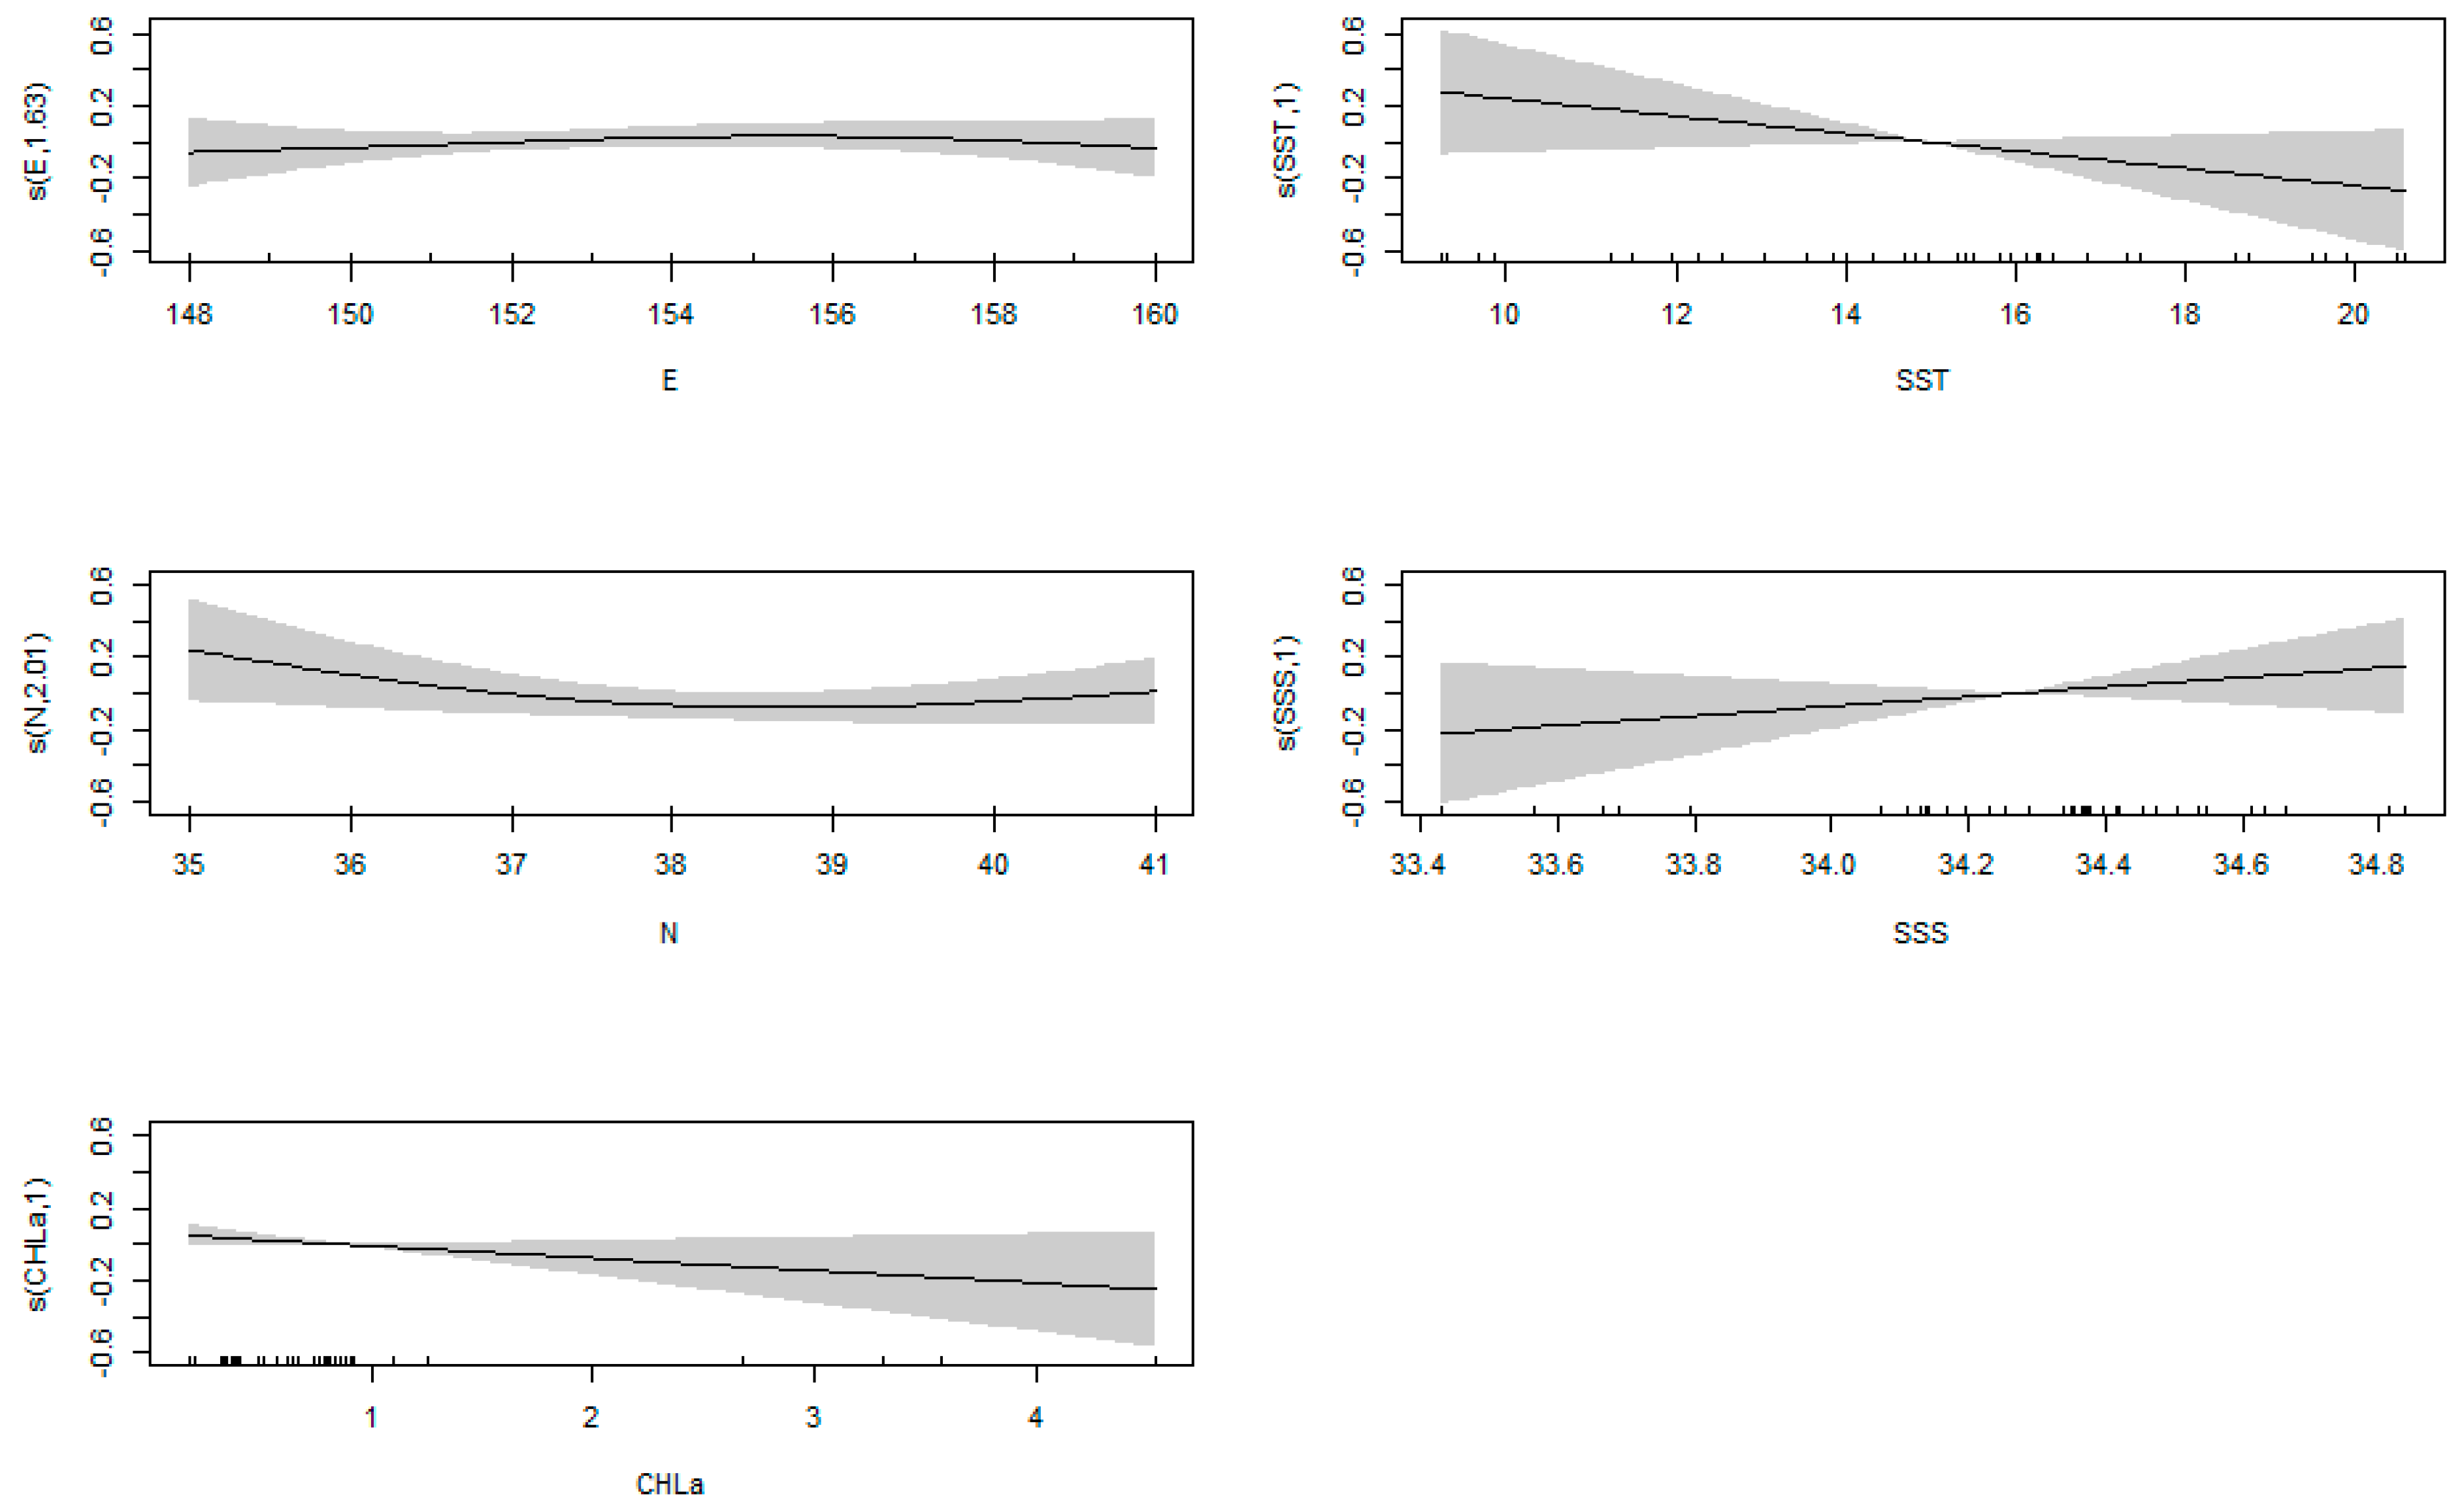
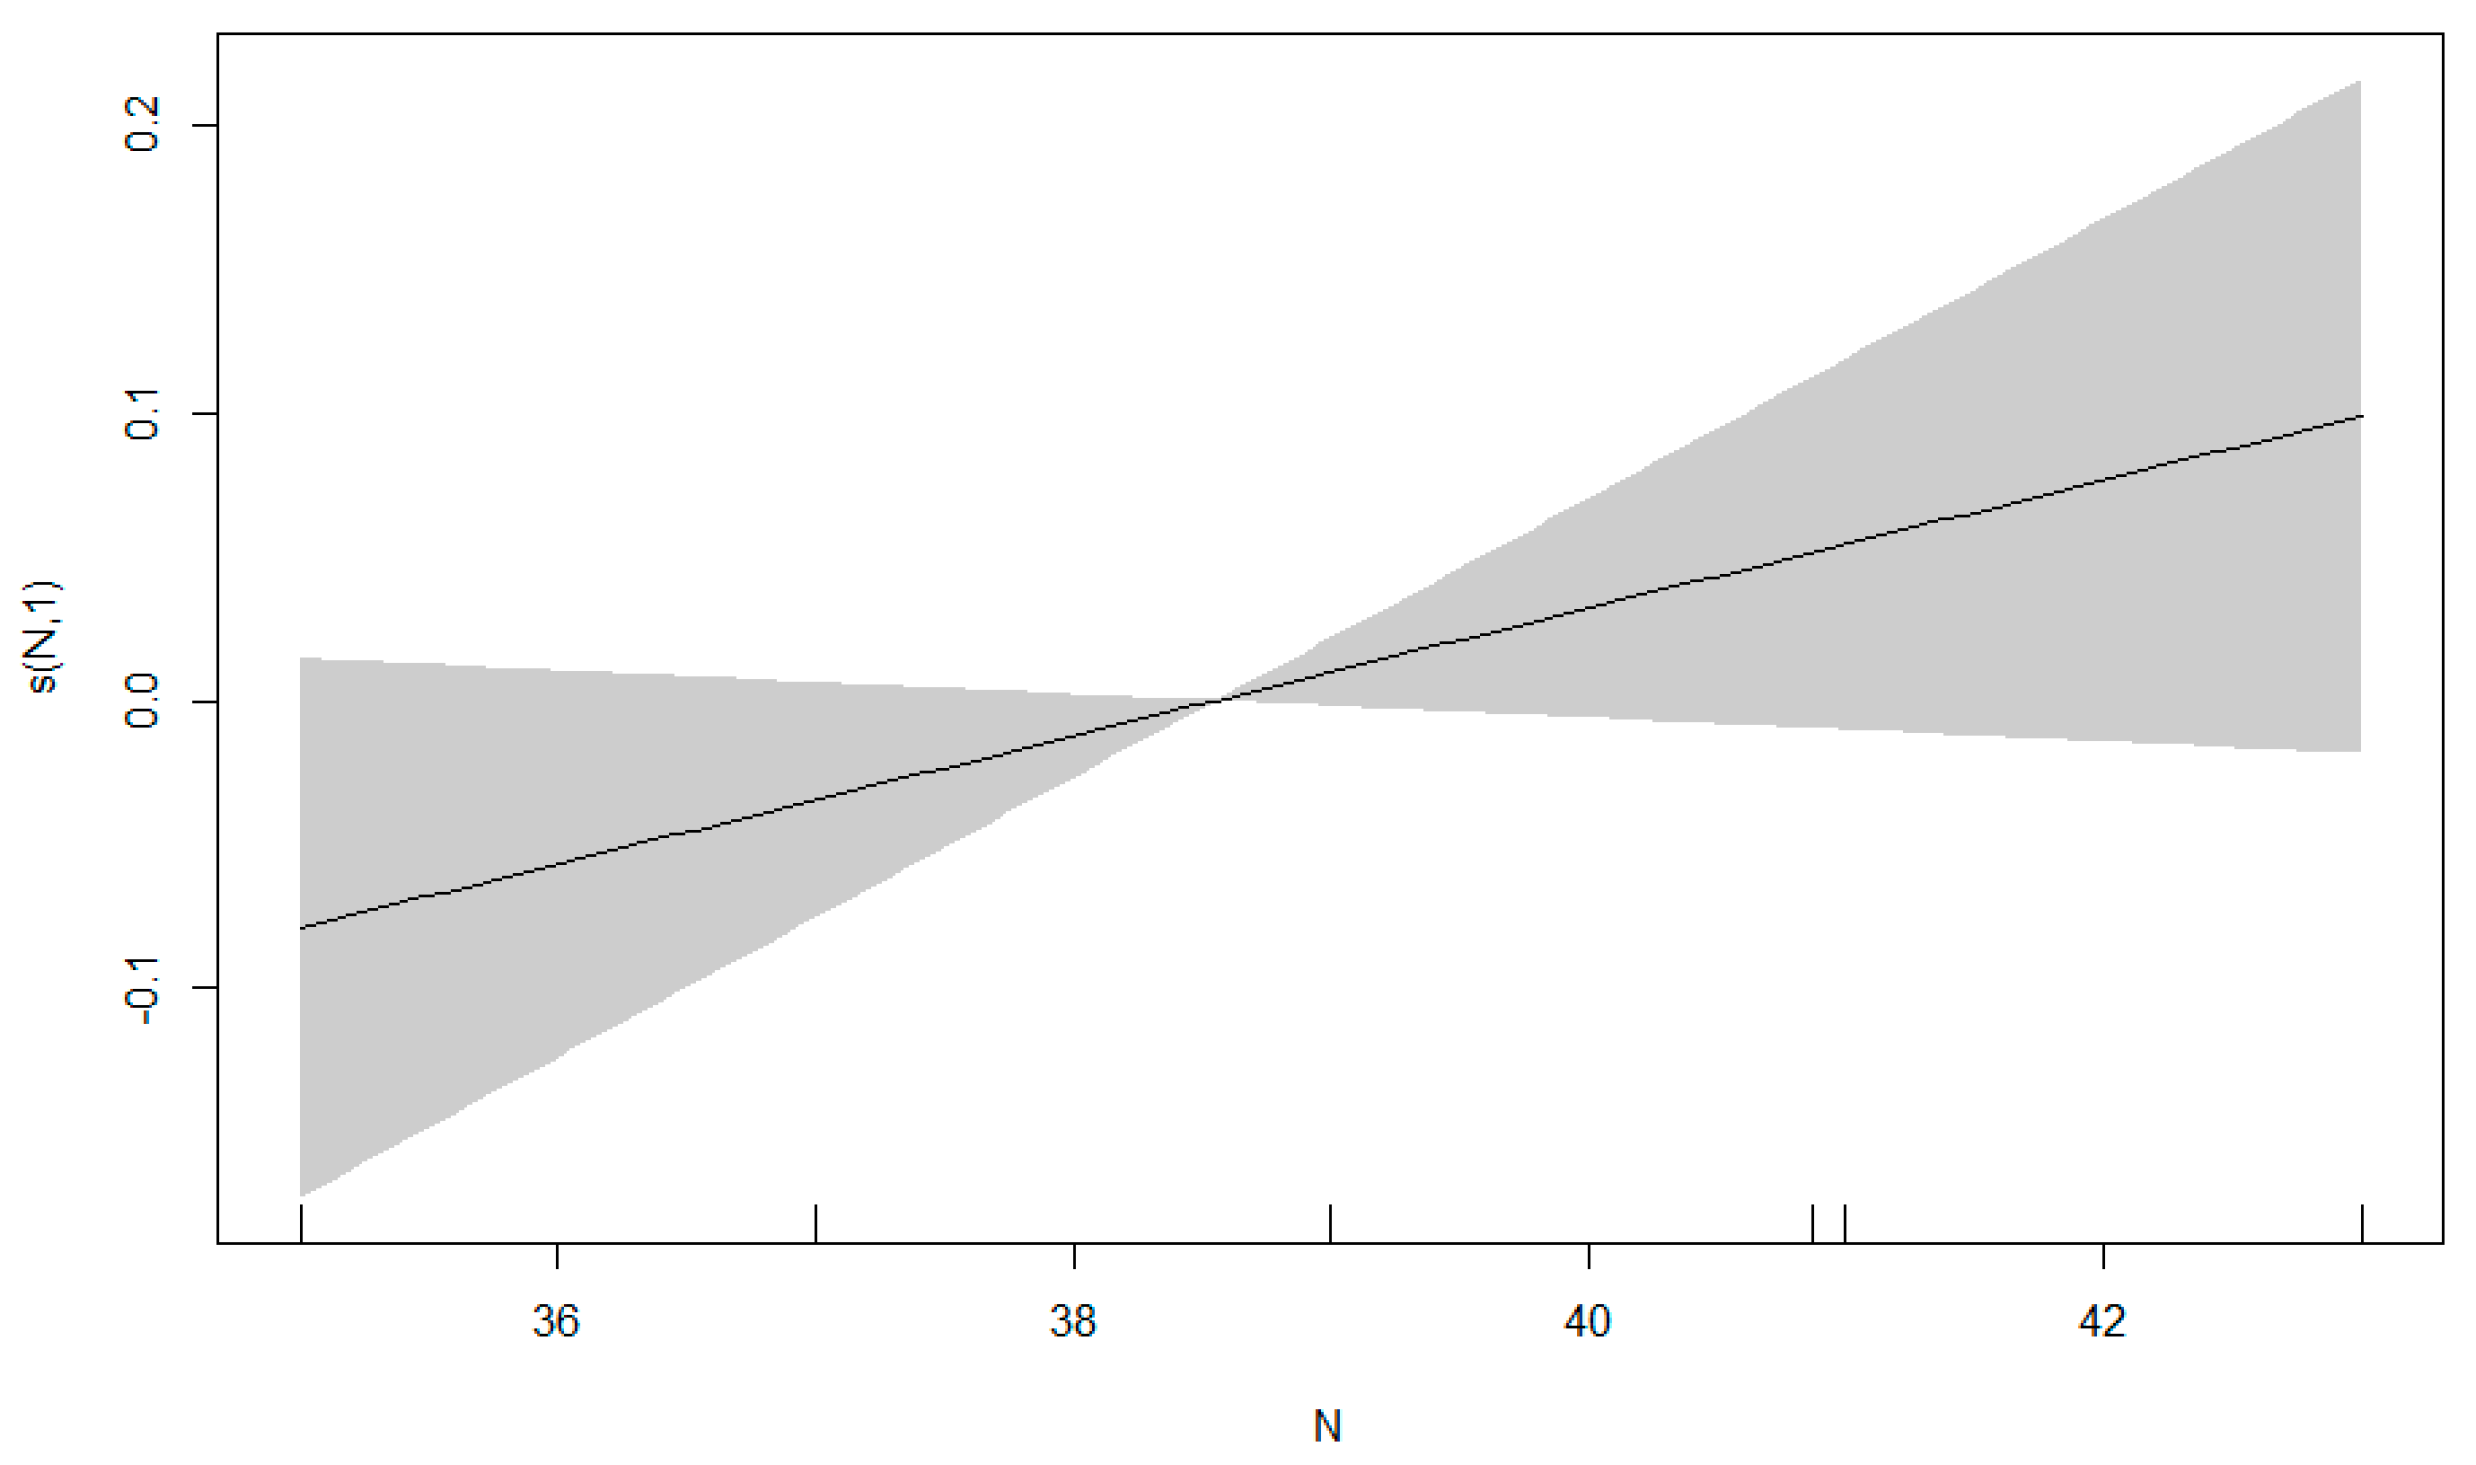
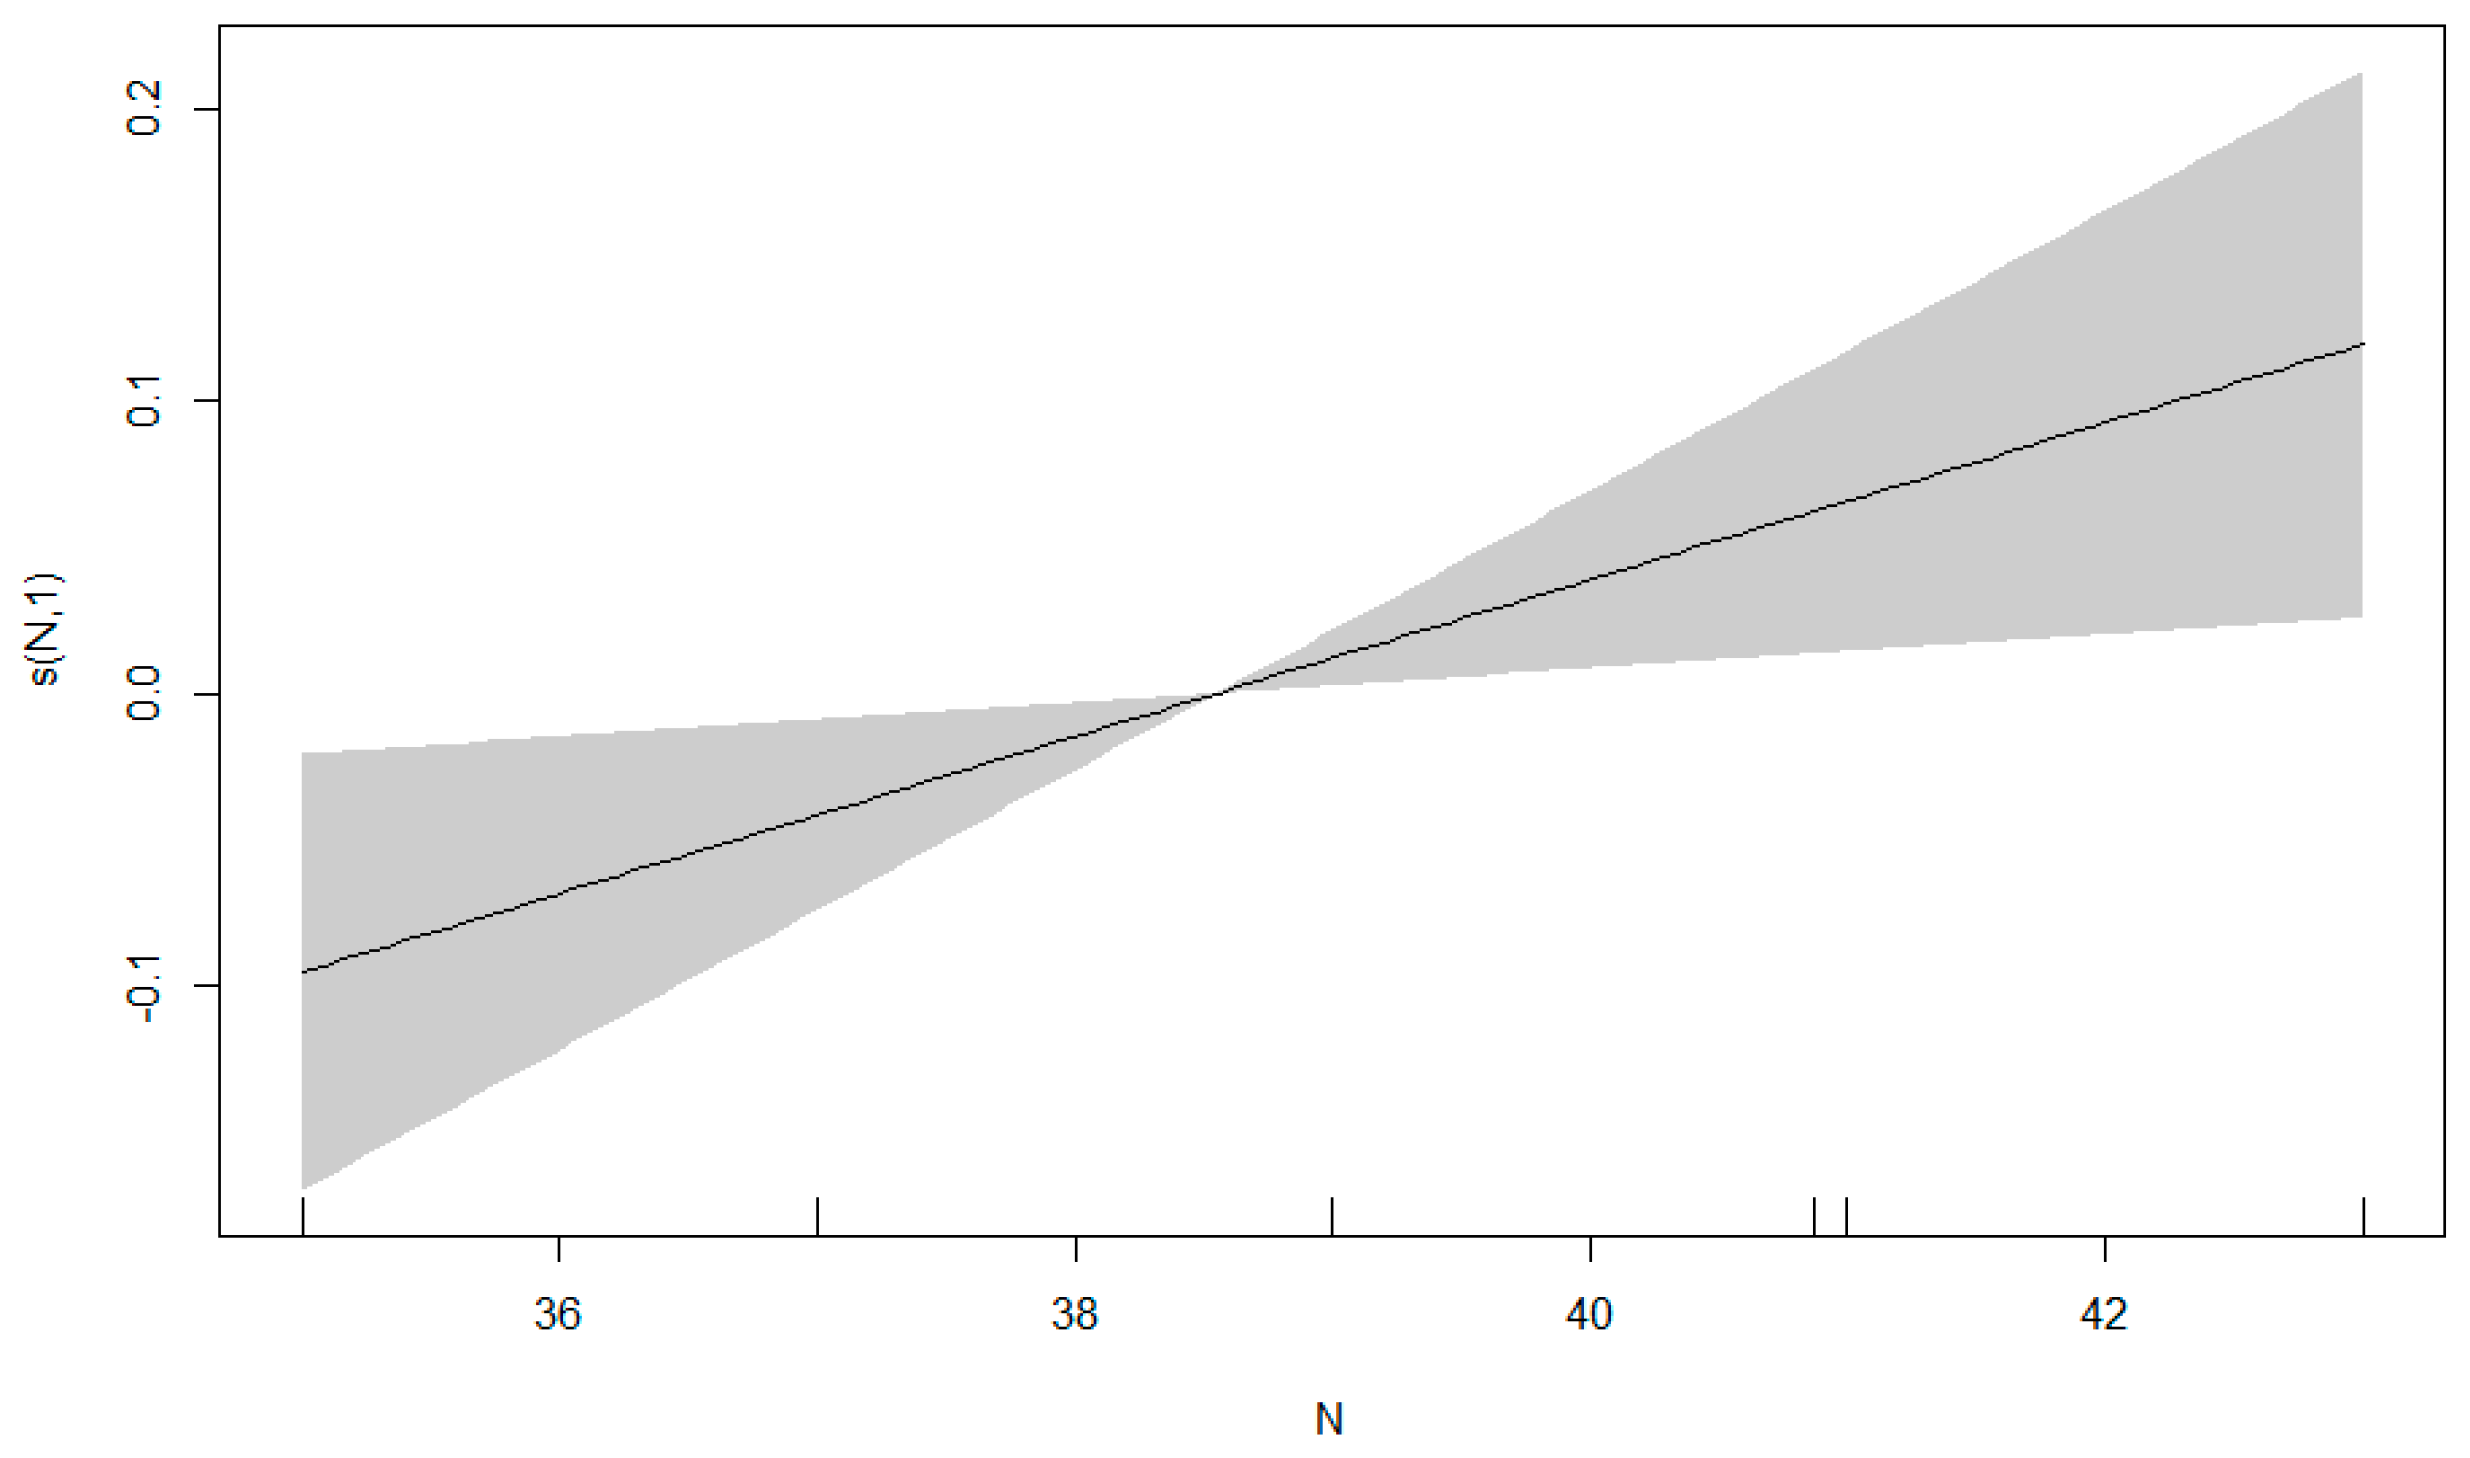
In terms of diversity indices (Margalef richness index, Shannon–Wiener diversity index, and Pielou uniformity index), “longitude + latitude + sea surface temperature + sea surface salt+ Chlorophyll concentrations” jointly influenced the distribution of cephalopod diversity in spring, “sea surface temperature” influenced the distribution of evenness, while “longitude + Chlorophyll concentrations” affects the distribution of richness. In summer, “latitude” influenced the distribution of diversity, “sea surface salt” influenced the distribution of evenness, and “latitude” influenced the distribution of richness. Comparing the results of the spring and summer analyses, we can see that “latitude” is a very important environmental factor. In addition to the fact that the northern region of the survey area in this study is the Pacific Northwest fishing grounds, another key reason is that environmental gradient changes cannot increase or decrease diversity and richness, but rather promote or emphasize differences in rates of change, while the combination of latitude and depth can produce a gradient of diversity, although this pattern is not yet well estimated [38,39]. Most of the differences in the effects of other environmental factors on diversity indices stem from the differences in the time of the survey. Cephalopod groups at different times will be in different life cycles and have different dependencies on the environment.

4.3. Future Research

Understanding the species composition and distribution characteristics of cephalopods at different spatial and temporal scales, and analyzing the correlation between the distribution of cephalopod resources, the distribution of diversity indices, and environmental factors are very important work. Environmental changes may alter the migration routes and timing of marine organisms, especially during the feeding and overwintering migration phases [10,29,40,41,42]. Choosing appropriate methods to analyze and capture the effects of environmental factors on cephalopod resources can further explain the distribution of resources and the movement of fishing grounds, sustainably exploit existing resources, improve the fishing effort, protect important populations of related species (spawning or recruitment, etc.), and develop new targets for fishing. It can also provide reference information for studying the geographic patterns and large-scale morphological changes of cephalopod organisms.
In future research, we need to collect more environmental data to analyze their relevance to cephalopod resources, especially the oxygen data missing in this study. As the fast-growing cephalopod with calcareous statoliths and a high demand for oxygen, the effects of acidification and ocean warming may be significant, as a range of studies is already beginning to suggest [9,43]. The analysis of the “oxygen” factor can be combined with climate change to conduct more in-depth studies, and the results can not only provide a reference for the development of new fishing grounds and fishing targets in the Northwest Pacific Ocean but also support the strategy of cephalopod resources to cope with future climate change.

5. Conclusions

In this study, 18 species of cephalopods were captured in the spring and summer, the diversity indexes in summer were higher than those in spring; the main contributing species in spring was Todarodes pacificus, while the main contributing species in summer was Ommastrephes bartramii. In general, the factors “latitude” and “longitude” have a great impact on cephalopod catch biomass and diversity distribution in spring, and “sea surface temperature” has a great impact on cephalopod catch biomass and diversity distribution in summer.

Author Contributions

R.W., R.Z. and P.S. performed the data analyses and wrote the first draft. S.L. and Y.L. helped with data analyses and revised the manuscript. H.L. helped with data curation. All authors participated in the discussion to finalize the manuscript. All authors have read and agreed to the published version of the manuscript.

Funding

This study was funded by National Program on Global Change and Air-Sea Interaction (GASI-02-PAC-YD spr/sum).

Institutional Review Board Statement

Not applicable.

Informed Consent Statement

Not applicable.

Data Availability Statement

Not applicable.

Conflicts of Interest

The authors declare no conflict of interest.

References

  1. Kawabe, M. Variations of Current Path, Velocity, and Volume Transport of the Kuroshio in Relation with the Large Meander. J. Phys. Oceanogr. 1995, 25, 3103–3117. [Google Scholar] [CrossRef]
  2. Watanabe, Y.; Kurita, Y.; Noto, M.; Oozeki, Y.; Kitagawa, D. Growth and survival of Pacific saury Cololabis saira in the Kuroshio-Oyashio transitional waters. J. Oceanogr. 2003, 59, 403–414. [Google Scholar] [CrossRef]
  3. Argüelles, J.; Rodhouse, P.G.; Villegas, P.; Castillo, G. Age, growth and population structure of the jumbo flying squid Dosidicus gigas in Peruvian waters. Fish. Res. 2001, 54, 51–61. [Google Scholar] [CrossRef]
  4. Zheng, P.; Wu, D.; Lin, X.; Li, X.-T. Interannual variability of Kuroshio current and its effect on the nearshore branch in Japan/east sea. J. Hydrodyn. Ser. B 2010, 22, 305–311. [Google Scholar] [CrossRef]
  5. FAO and Agriculture. FAO Yearbook of Fisheries Statistics 2022; Food and Agriculture Organization of the United Nations: Rome, Italy, 2022. [Google Scholar]
  6. Rosa, R.; Pissarra, V.; Borges, F.O.; Xavier, J.; Gleadall, I.G.; Golikov, A.; Bello, G.; Morais, L.; Lishchenko, F.; Roura, Á.; et al. Global patterns of species richness in coastal cephalopods. Front. Mar. Sci. 2019, 6, 469. [Google Scholar] [CrossRef]
  7. FAO and Agriculture. FAO Yearbook of Fisheries Statistics 2007; Food and Agriculture Organization of the United Nations: Rome, Italy, 2007. [Google Scholar]
  8. Zhou, J.G.; Chen, X.J.; Liu, B.L. Notes on the present status of exploitation and potential of cephalopod resources on the world. Mar. Fish. 2008, 30, 268–275. [Google Scholar]
  9. Rodhouse, P.G.K.; Pierce, G.J.; Nichols, O.C.; Sauer, W.H.H.; Arkhipkin, A.I.; Laptikhovsky, V.V.; Lipiński, M.R.; Ramos, J.E.; Gras, M.; Kidokoro, H.; et al. Environmental effects on cephalopod population dynamics: Implications for management of fisheries. Adv. Mar. Biol. 2014, 67, 99–233. [Google Scholar]
  10. Lipiński, M.R. Cephalopod life cycles: Patterns and exceptions. S. Afr. J. Mar. Sci. 1998, 20, 439–447. [Google Scholar] [CrossRef]
  11. Pierce, G.J.; Valavanis, V.D.; Guerra, A.; Jereb, P.; Orsi-Relini, L.; Bellido-Millán, J.; Katara, I.; Piatkowski, U.; Pereira, J.; Balguerias, E.; et al. A review of cephalopod-environment interactions in European Seas. Hydrobiologia 2008, 612, 49–70. [Google Scholar] [CrossRef]
  12. Chen, X.; Tian, S.; Chen, Y.; Liu, B. A modeling approach to identify optimal habitat and suitable fishing grounds for neon flying squid (Ommostrephes bartramii) in the Northwest Pacific Ocean. Fish. Bull. 2010, 108, 1–14. [Google Scholar]
  13. Laptikhovsky, V. Latitudinal and bathymetric trends in egg size variation: A new look at Thorson’s and Rass’s rules. Mar. Ecol. 2006, 27, 7–14. [Google Scholar] [CrossRef]
  14. Caballero-Alfonso, A.M.; Ganzedo, U.; Trujillo-Santana, A.; Polanco-Martínez, J.M.; del Pino, A.S.; Ibarra-Berastegi, G.; Hernandez, J.C. The role of climatic variability on the short-term fluctuations of octopus captures at the Canary Islands. Fish. Res. 2010, 102, 258–265. [Google Scholar] [CrossRef]
  15. Pierce, G.J.; Boyle, P.R. Empirical modelling of interannual trends in abundance of squid (Loligo forbesi) in Scottish waters. Fish. Res. 2003, 59, 305–326. [Google Scholar] [CrossRef]
  16. Vargas-Yáñez, M.; Moya, F.; García-Martínez, M.; Rey, J.; González, M.; Zunino, P. Relationships between Octopus vulgaris landings and environmental factors in the northern Alboran Sea (Southwestern Mediterranean). Fish. Res. 2009, 99, 159–167. [Google Scholar] [CrossRef]
  17. Jereb, P.; Roper, C.F.E. Cephalopods of the World—An Annotated and Illustrated Catalogue of Cephalopod Species Known to Date; Myopsid and oegopsid squids; FAO: Rome, Italy, 2010; Volume 2. [Google Scholar]
  18. Nabhitabhata, J.; Asawangkune, P.; Amornjaruchit, S.; Promboon, P. Tolerance of Eggs and Hatchlings of Neritic Cephalopods to Salinity Changes. Phuket Mar. Biol. Cent. Spec. Publ. 2001, 251, 91–99. [Google Scholar]
  19. Margalef, R. On certain unifying principles in ecology. Am. Nat. 1963, 97, 357–374. [Google Scholar] [CrossRef]
  20. Spellerberg, I.F.; Fedor, P.J. A tribute to Claude Shannon (1916–2001) and a plea for more rigorous use of species richness, species diversity and the ‘Shannon–Wiener’ Index. Glob. Ecol. Biogeogr. 2003, 12, 177–179. [Google Scholar] [CrossRef]
  21. Pielou, E.C. The measurement of diversity in different types of biological collections. J. Theor. Biol. 1966, 13, 131–144. [Google Scholar] [CrossRef]
  22. Clarke, K.R. Non-parametric multivariate analyses of changes in community structure. Aust. J. Ecol. 1993, 18, 117–143. [Google Scholar] [CrossRef]
  23. Somerfield, P.J.; Clarke, K.R. Inverse analysis in non-parametric multivariate analyses: Distinguishing groups of associated species which covary coherently across samples. J. Exp. Mar. Biol. Ecol. 2013, 449, 261–273. [Google Scholar] [CrossRef]
  24. Chouldechova, A.; Hastie, T. Generalized additive model selection. arXiv 2015, arXiv:1506.03850. [Google Scholar]
  25. Volvenko, I.V.; Orlov, A.M.; Gebruk, A.V.; Katugin, O.N.; Vinogradov, G.M.; Maznikova, O.A. Species richness and taxonomic composition of trawl macrofauna of the North Pacific and its adjacent seas. Sci. Rep. 2018, 8, 16604. [Google Scholar] [CrossRef] [PubMed]
  26. Rathjen, W.F. Cephalopod capture methods: An overview. Bull. Mar. Sci. 1991, 49, 494–505. [Google Scholar]
  27. Jiaxin, S. Analysis and Research on Fishing Capacity of Fishing Vessels Based on Data. Ph.D. Thesis, Shanghai Ocean University, Shanghai, China, 2021. [Google Scholar] [CrossRef]
  28. Goodwin, C.L.; Pease, B. Life histories and environmental requirements of coastal fishes and invertebrates (Pacific Northwest)-Pacific geoduck clam. U. S. Fish Wildl. Serv. Biol. Rep. 1989, 82, 14. [Google Scholar]
  29. Andre, J.; Haddon, M.; Pecl, G.T. Modelling climate-change-induced nonlinear thresholds in cephalopod population dynamics. Glob. Change Biol. 2010, 16, 2866–2875. [Google Scholar] [CrossRef]
  30. Boyle, P.R. Cephalopod biology in the fisheries context. Fish. Res. 1990, 8, 303–321. [Google Scholar] [CrossRef]
  31. Zheng, X.D.; Han, S.; Lin, X.Z.; Li, Q. Research progress in Cephalopod reproductive behaviors. J. Fish. Sci. China 2009, 16, 459–465. [Google Scholar]
  32. Rosa, A.L.; Yamamoto, J.; Sakurai, Y. Effects of environmental variability on the spawning areas, catch, and recruitment of the Japanese common squid, Todarodes pacificus (Cephalopoda: Ommastrephidae), from the 1970s to the 2000s. ICES 28. J. Mar. Sci. 2011, 68, 1114–1121. [Google Scholar] [CrossRef]
  33. Pierce, G.J.; Portela, J.; Robin, J.P. Foreword: Environmental effects on cephalopod life history and fisheries. Aquat. Living Resour. 2005, 18, 325–326. [Google Scholar] [CrossRef]
  34. Huang, W.B.; Huang, Y.C. Maturity characteristics of pacific saury during fishing season in the Northwest Pacific. J. Mar. Sci. Technol. 2015, 23, 819–826. [Google Scholar]
  35. Yu, W.; Chen, X.; Yi, Q.; Chen, Y. Spatio-temporal distributions and habitat hotspots of the winter–spring cohort of neon flying squid Ommastrephes bartramii in relation to oceanographic conditions in the Northwest Pacific Ocean. Fish. Res. 2016, 175, 103–115. [Google Scholar] [CrossRef]
  36. Yu, W.; Chen, X.J.; Chen, Y.; Yi, Q.; Zhang, Y. Effects of environmental variations on the abundance of western winter-spring cohort of neon flying squid (Ommastrephes bartramii) in the Northwest Pacific Ocean. Acta Oceanol. Sin. 2015, 34, 43–51. [Google Scholar] [CrossRef]
  37. Sakurai, Y.; Kiyofuji, H.; Saitoh, S.; Goto, T.; Hiyama, Y. Changes in inferred spawning areas of Todarodes pacificus (Cephalopoda: Ommastrephidae) due to changing environmental conditions. ICES J. Mar. Sci. 2000, 57, 24–30. [Google Scholar] [CrossRef]
  38. Yu, W.; Zhang, Y.; Chen, X.; Yi, Q.; Qian, W. Response of winter cohort abundance of Japanese common squid Todarodes pacificus to the ENSO events. Acta Oceanol. Sin. 2018, 37, 61–71. [Google Scholar] [CrossRef]
  39. Rosa, R.; González, L.; Dierssen, H.M.; Seibel, B.A. Environmental determinants of latitudinal size-trends in cephalopods. Mar. Ecol. Prog. Ser. 2012, 464, 153–165. [Google Scholar] [CrossRef]
  40. Rosa, R.; Dierssen, H.M.; González, L.; Seibel, B.A. Large-scale diversity patterns of cephalopods in the Atlantic open ocean and deep sea. Ecology 2008, 89, 3449–3461. [Google Scholar] [CrossRef]
  41. Pecl, G.T.; Jackson, G.D. The potential impacts of climate change on inshore squid: Biology, ecology and fisheries. Rev. Fish Biol. Fish. 2008, 18, 373–385. [Google Scholar] [CrossRef]
  42. Xavier, J.C.; Allcock, A.L.; Cherel, Y.; Lipinski, M.R.; Pierce, G.J.; Rodhouse, P.G.K.; Rosa, R.; Shea, E.K.; Strugnell, J.M.; Vidal, E.A.G.; et al. Future challenges in cephalopod research. J. Mar. Biol. Assoc. United Kingd. 2015, 95, 999–1015. [Google Scholar] [CrossRef]
  43. Rosa, R.; Seibel, B.A. Synergistic effects of climate-related variables suggest future physiological impairment in a top oceanic predator. Proc. Natl. Acad. Sci. USA 2008, 105, 20776–20780. [Google Scholar] [CrossRef]
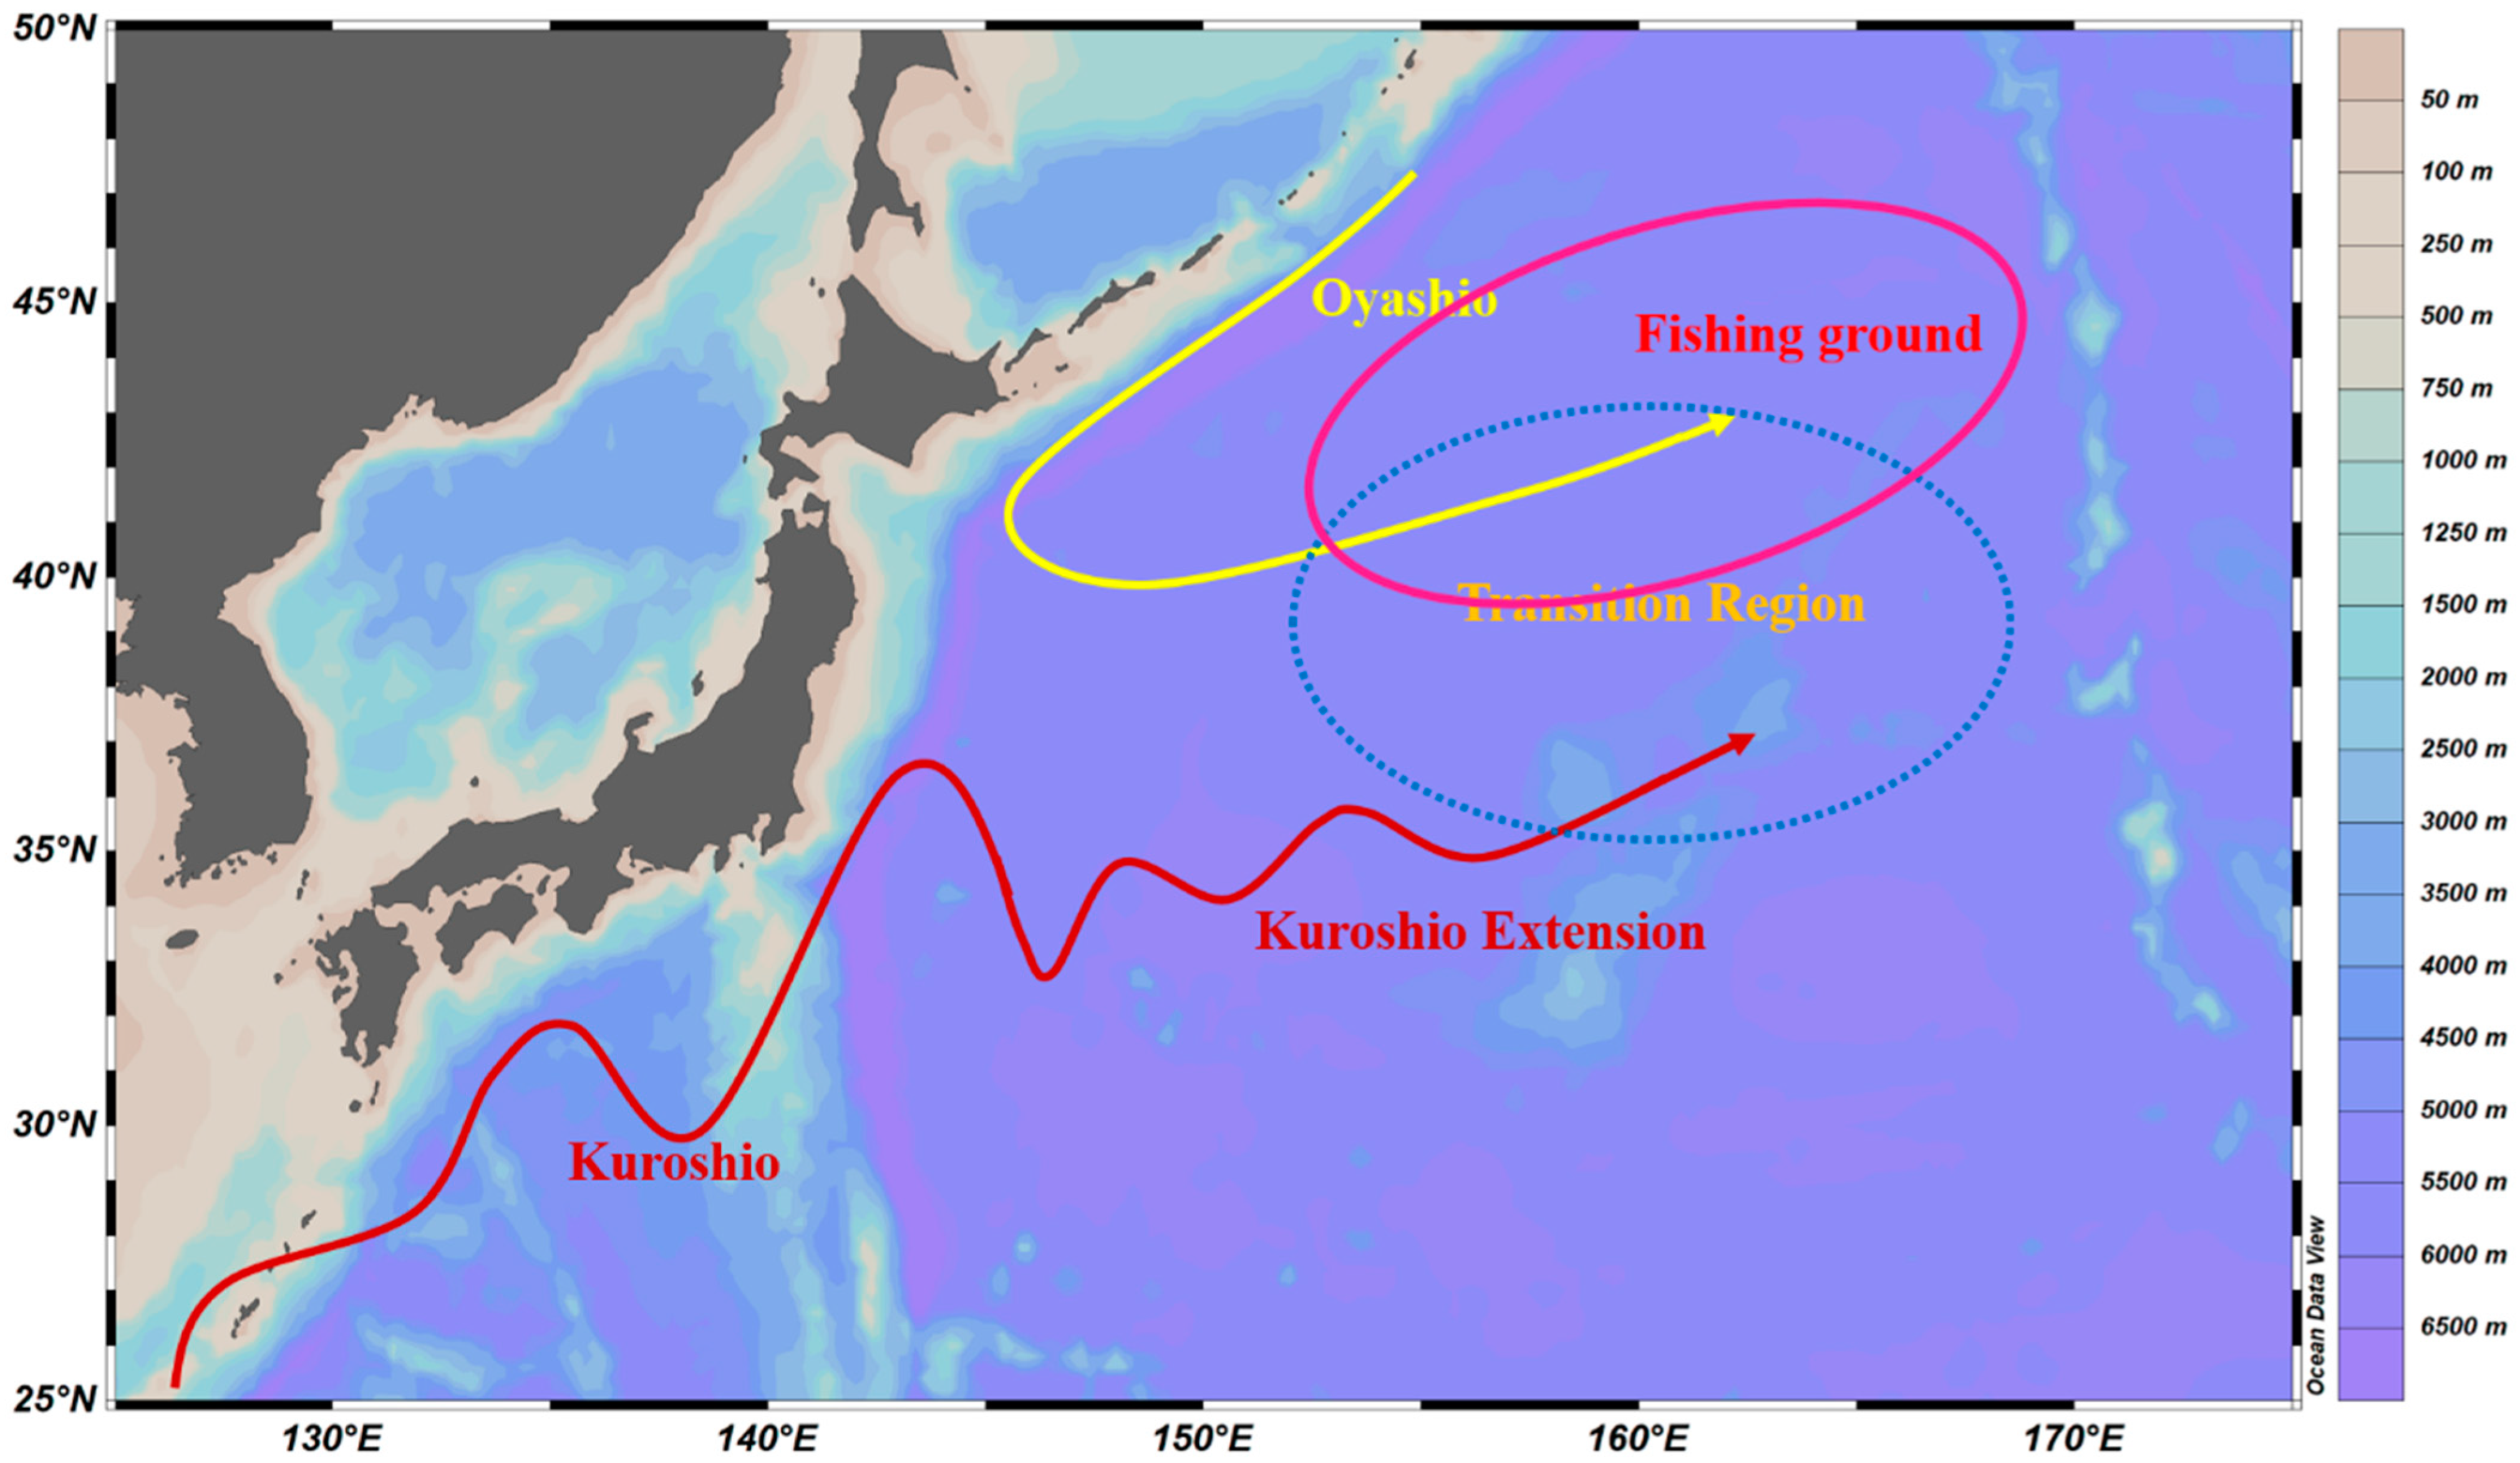
Figure 1. Schematic diagram of major currents in the research area. Note: This map is a Mercator projection.
Diversity 15 00694 g001
Figure 2. Survey stations in the Northwest Pacific (Spring and Summer).
Diversity 15 00694 g002
Figure 3. Diversity index of cephalopods in the Northwest Pacific in spring. (A) values of the Shannon–Wiener diversity index (H′) distribution; (B) values of the Margalef richness index (D) distribution; (C) values of the Pielou uniformity index (J′) distribution.
Diversity 15 00694 g003
Figure 4. Diversity index of cephalopods in the Northwest Pacific in summer. (A) values of the Shannon–Wiener diversity index (H′) distribution; (B) values of the Margalef richness index (D) distribution; (C) values of the Pielou uniformity index (J′) distribution.
Diversity 15 00694 g004
Figure 5. Distribution of cephalopods catch biomass in spring and summer seasons.
Diversity 15 00694 g005
Figure 6. Variation in cephalopod catch biomass over latitudes and longitudes in spring and summer seasons.
Diversity 15 00694 g006
Figure 7. Distribution of main contributing species in the spring and summer seasons.
Diversity 15 00694 g007
Figure 8. Correlation analysis chart between the respective variables (in spring) in the GAM model. The numbers in the graph represent the correlation values between the factors, and the number of red asterisks represents the strength of the correlation; the higher the number of red asterisks, the stronger the correlation; the red line on the bottom of the diagonal is a fitted line of bivariate scatter plots.
Diversity 15 00694 g008
Figure 9. Correlation analysis chart between the respective variables (in summer) in the GAM model. The numbers in the graph represent the correlation values between the factors, and the number of red asterisks represents the strength of the correlation; the higher the number of red asterisks, the stronger the correlation; the red line on the bottom of the diagonal is a fitted line of bivariate scatter plots.
Diversity 15 00694 g009
Figure 10. Nonlinear fitting curve between each environmental factor in GAM optimal model with “catch biomass in spring”. Longitude is represented by E, Latitude is represented by N, and shaded in gray is the 95% confidence interval.
Diversity 15 00694 g010
Figure 11. Nonlinear fitting curve between each environmental factor in GAM optimal model with “catch biomass in summer”. Sea Surface Temperature is represented by SST, and shaded in gray is the 95% confidence interval.
Diversity 15 00694 g011
Figure 12. Nonlinear fitting curve between each environmental factor in GAM optimal model with “Shannon–Wiener index, (H′) in spring”. Longitude is represented by E, Latitude is represented by N, Sea Surface Temperature is represented by SST, Sea Surface Salt is represented by SSS, Chlorophyll concentrations are represented by CHLa, and shaded in gray is the 95% confidence interval.
Diversity 15 00694 g012
Figure 13. Nonlinear fitting curve between each environmental factor in GAM optimal model with “Margalef index (D) in spring”. Sea Surface Temperature is represented by SST, and shaded in gray is the 95% confidence interval.
Diversity 15 00694 g013
Figure 14. Nonlinear fitting curve between each environmental factor in GAM optimal model with “Pielou index (J’) in spring”. Longitude is represented by E, Chlorophyll concentrations are represented by CHLa, and shaded in gray is the 95% confidence interval.
Diversity 15 00694 g014
Figure 15. Nonlinear fitting curve between each environmental factor in GAM optimal model with “Shannon–Wiener index, (H′) in summer”. Latitude is represented by N, and shaded in gray is the 95% confidence interval.
Diversity 15 00694 g015
Figure 16. Nonlinear fitting curve between each environmental factor in GAM optimal model with “Margalef index (D) in summer”. Sea Surface Salt is represented by SSS, and shaded in gray is the 95% confidence interval.
Diversity 15 00694 g016
Figure 17. Nonlinear fitting curve between each environmental factor in GAM optimal model with “Pielou index (J’) in summer”. Latitude is represented by N, and shaded in gray is the 95% confidence interval.
Diversity 15 00694 g017
Table 1. Composition of research data.
SeasonTimeNumber of StationsMajor Data Field
Spring16 April 2015–25 June 201545Latitude/longitude/catch/SST/SSS/Chl a
Summer21 May 2016–23 July 201645Latitude/longitude/catch/SST/SSS/Chl a
Note: Unit of latitude and longitude is °, and denoted by N and E; Unit of catch is g; SST is sea surface temperature, and the unit of SST is °C; SSS is sea surface salt, and the unit of SSS is ‰; Chl a is Chlorophyll concentration, and the unit of Chl a is mg/m3.
Table 2. A list of captured cephalopods (with catch in spring and summer) in the Northwest Pacific.
ClassOrderFamilyGenusSpeciesCatch
in Spring
Catch
in Summer
CephalopodaOegopsidaOmmastrephidaeOmmastrephesOmmastrephes bartramii3084.995885.86
TodarodesTodarodes pacificus9141.30220.15
Todarodes sp. /22.70
EucleoteuthisEucleoteuthis luminosa211.70918.65
SthenoteuthisSthenoteuthis oualaniensis/221.87
EnoploteuthidaeAbraliaAbralia andamanica148.4421.49
Abralia similis/1.92
EnoploteuthisEnoploteuthis chunii6.33/
OnychoteuthidaeOnychoteuthisOnychoteuthis banksii/8.41
Onychoteuthis borealijaponica3973.62626.25
Onychoteuthis sp./3.47
OnykiaOnykia robusta8.6010.70
CranchiidaeCranchiaCranchia scabra0.34/
ArchiteuthidaeArchiteuthisArchiteuthis dux/14.82
GonatidaeGonatopsisGonatopsis borealis328.20192.29
ThysanoteuthidaeThysanoteuthisThysanoteuthis rhombus/104.65
OctopodaTremoctopodidaeTremoctopusTremoctopus violaceus/13.13
OcythoidaeOcythoeOcythoe tuberculata/3.05
Note: unit of the catch in spring and summer is g/h.
Table 3. Margalef index (D), Shannon–Wiener index, (H′), and Pielou index (J′) of cephalopods in the Northwest Pacific.
SeasonHDJ
Spring0.3691 ± 0.370.3176 ± 0.270.3498 ± 0.33
Summer0.3919 ± 0.350.3237 ± 0.290.3824 ± 0.31
Table 4. SIMPER analysis results of cephalopods in the Northwest Pacific.
Spring:AverageSdRatioCumsum
Species
Todarodes pacificus0.3820.36641.04250.4218
Onychoteuthis borealijaponica0.2340.28880.810.6801
Ommastrephes bartramii0.10110.2350.43030.7918
Eucleoteuthis luminosa0.09150.24480.37370.8928
Abralia andamanica0.04340.14420.30110.9407
Gonatopsis borealis0.0420.10450.40230.9871
Onykia robusta0.0060.04770.12670.9938
Enoploteuthis chunii0.00520.04090.12630.9995
Cranchia scabra0.00040.00360.11971
Summer:
Ommastrephes bartramii0.37190.35111.05940.4242
Onychoteuthis borealijaponica0.21030.29220.71960.6641
Eucleoteuthis luminosa0.08120.18480.43950.7567
Gonatopsis borealis0.06260.11470.54570.8281
Sthenoteuthis oualaniensis0.05490.19190.28620.8908
Todarodes pacificus0.04630.14030.33030.9436
Thysanoteuthis rhombus0.01540.08240.18660.9611
Todarodes sp.0.01130.07780.14580.9741
Abralia andamanica0.00550.02850.19480.9804
Architeuthis dux0.00540.03240.1680.9866
Tremoctopus violaceus0.00380.0230.16640.991
Onychoteuthis sp.0.0030.02510.11840.9944
Onychoteuthis banksii0.00220.0090.24660.9969
Ocythoe tuberculata0.0010.00480.20730.998
Onykia robusta0.00090.00490.19260.9991
Abralia similis0.00080.00470.16511
Note: average: species contribution to average between-group dissimilarity; sd: standard deviation of contribution; ratio: average to sd ratio; cusum: ordered cumulative contribution.
Table 5. Statistical parameter table of GAM optimal model screening process.
ModelCovariatesDeviance ExplanationAICR2
Catch in spring
1E27.30%261.4340.219
2N14.40%264.980.13
3SST13.80%266.850.11
4SSS21.40%265.140.16
5CHLa7.24%271.730.03
6* E + N33.40%258.50.27
7E + N + SST33.90%260.40.26
8E + N + SSS + SST33.80%262.220.24
9E + N + SSS + SST + CHLa41.80%260.260.3
Catch in summer
1E18%199.810.12
2N6.45%203.860.02
3* SST21.60%195.980.17
4SSS22.30%197.020.17
5CHLa12.10%198.670.1
H′ in spring
1E0.64%2.38−0.0191
2N11.40%−0.260.0668
3SST2.84%2.3−0.0073
4SSS14.30%0.320.0736
5CHLa5.85%0.170.0343
6E + N11.60%1.590.0444
7E + N + SST12.50%3.130.0283
8E + N + SST + SSS25.50%0.90.119
9* E + N + SST + SSS + CHLa28.50%0.160.143
D in spring
1E0.06%−33.34−0.025
2N21.40%−40.460.165
3SST10.90%−35.920.0606
4* SSS35.30%−45.830.288
5CHLa2.21%−34.23−0.003
6SSS + E35.20%−43.850.267
J′ in spring
1E7.50%−4.510.0313
2N6.01%−4.10.0187
3SST8.78%−4.440.0365
4SSS11.70%−4.470.0509
5CHLa7.36%−6.060.0499
6* E + CHLa15.90%−6.250.0934
H′ in summer
1E3.83%−6.96−0.0041
2* N7.72%−9.40.0501
3SST4.27%−8.080.0146
4SSS10.90%−8.840.0574
5CHLa10.70%−7.480.0367
D in summer
1E0.33%−18.37−0.026
2N1.08%−18.64−0.0183
3SST1.66%−18.81−0.013
4* SSS23.20%−23.150.152
5CHLa3.86%−18.7258−0.0036
6SSS + E23.10%−21.24940.125
7SSS + CHLa5.91%−17.1975−0.0171
8SSS + E + CHLa24.90%−20.22250.119
J′ in summer
1E8.48%−20.93940.0343
2* N16.10%−25.73260.136
3SST13.10%−24.48470.106
4SSS11%−23.6110.0839
5CHLa17.60%−22.27020.097
Note: Longitude is represented by E; Latitude is represented by N; Sea Surface Temperature is represented by SST; Sea Surface Salt is represented by SSS; Chlorophyll concentrations are represented by CHLa; Covariates marked with * means the covariates is a significant factor.
Disclaimer/Publisher’s Note: The statements, opinions and data contained in all publications are solely those of the individual author(s) and contributor(s) and not of MDPI and/or the editor(s). MDPI and/or the editor(s) disclaim responsibility for any injury to people or property resulting from any ideas, methods, instructions or products referred to in the content.