Abstract
Coffee (Coffea arabica L.) is one of the most consumed non-alcoholic beverages. To expand the coffee market and attract consumers to a diversity of coffee types, data on the nutritional potential of different coffee varieties are needed. The present study assessed the phytochemical constituents, i.e., total flavonoid content (TFC), total anthocyanin content (TAC), and total phenolic content (TPC), and the antioxidant activities of extracts from Bourbon coffee berries differing in color. Furthermore, the metabolome profiles of the four Bourbon berries, i.e., purple (PF), red (RF), orange (ORF), and yellow (YF), were explored. The results indicated that the TFC and TPC were significantly higher in RF (7.12 ± 0.96 and 9.01 ± 1.36 mg/g), followed by YF (6.54 ± 0.38 and 7.80 ± 0.10 mg/g), ORF (6.31 ± 0.15 and 7.20 ± 0.40 mg/g), and PF (4.66 ± 0.53 and 6.60 ± 1.10 mg/g). A UPLC-MS/MS analysis resulted in the identification of 579 metabolites belonging to 11 different compound classes. Of these, 317 metabolites were differentially accumulated in the four varieties. These differentially accumulated metabolites were majorly classified as flavonoids, organic acids, phenolics, and amino acids and derivatives. Based on the metabolome profiles, we discuss the major compounds in each Bourbon coffee variety and highlight their nutritional and health potentials. These findings will serve as a foundation for the promotion of each variety and provide useful information for coffee improvement programs.
1. Introduction
Coffee is the most desirable non-alcoholic beverage due to its taste sensation, psychostimulant effects, and beneficial health impacts. Of the ~70 Coffea species, Coffea arabica and Coffea canephora are primarily cultivated and consumed; the former is preferred over the latter. The Chinese coffee market has expanded in the past decade, and in 2022, its worth reached an estimated CNY 169.6 billion [1]. This has led to an increased production of coffee in China; China produced nearly two million bags of coffee in 2021–2022 (https://www.china-briefing.com/; accessed on 30 January 2023). With an increase in the market, the demand for different flavors and nutritional value also increases. The Yunnan Province of China is the major coffee producer, and “Catimor 7963”, “Typica”, and “Bourbon” are the famous varieties/cultivars [2]. Bourbon coffee has a range of fruit colors, i.e., yellow, red, orange, and dark purple. Among these, the red is the most popular among consumers. However, there is limited/no data on the fruit metabolic composition of Bourbon coffees with different fruit colors produced in China.
Coffee fruits (berries hereafter) of different varieties vary in their chemical composition [3]. The metabolomic profiles of coffee beans depend on the altitude, origin, macro and micro climate, and postharvest processing method [4]. Nevertheless, major bioactive compounds in coffee are phenolics, alkaloids, terpenoids, proteins, carbohydrates, lipids, flavonoids, and amino acids [5,6]. Berries with different colors have been reported to show different physical properties after medium roasting [7]. However, the nutritional composition of berries differing in color is not known, particularly the colored berries of Bourbon varieties. Coffee brew consumption gives coffee a status of a “functional beverage” due to the presence of health-beneficial compounds such as soluble carbohydrates, non-volatile aliphatic acids, volatile acids, oils, proteins, free amino acids, and minerals [8]. Among the major compounds, purine caffeine (an alkaloid) is strongly associated with coffee quality as it contributes to bitterness and the stimulation of the central nervous system (inducing alertness), improving blood circulation and respiration, mood enhancement, and improved performances in physical exercise [9] and references therein. Other than alkaloids, phenolic acids present in coffee have potential antioxidant, hepatoprotective, hypoglycemic, and antiviral activities [10]. However, most of the metabolome analysis studies have reported the composition of green coffee (C. arabica) or C. anthonyi and C. canephora [11]. Since the berries are the commercial starting point for coffee production, it is important to understand how berries of different colors differ in chemistry. It is also important from consumer preference and health perspectives. Some studies have reported differences in the metabolomic compositions of berries differing in color. However, these studies reported the changes in the composition of the same varieties, or the color change was studied from a perspective of ripening time or coffee processing and not for the varietal differences [12,13,14].
Fruit color has been associated with different metabolomic compositions in different plant species. For example, the comparative metabolomics of guava [15], fig [16], Citrullus spp. [17], cherry tomato [18], pitaya [19], and capsicum [20] fruits with different colors have revealed that the color of the fruit can be due to the presence of different pigments, i.e., chlorophyll, xanthophylls, carotenoids, and anthocyanins. Since during development, the taste and color change [18], it can be assumed that coffee cherries with different colors could have different metabolomic compounds affecting the color and taste. This is also related to the fact that the color intensity, hue, and saturation of food/drink influences multisensory flavor perception [21]. Furthermore, color is a factor in food choice [22,23]. Therefore, to capture a large number of consumers, the provision of coffee with different colors is a useful strategy. If the metabolomic profile of the coffee berries with different colors is revealed, the consumer will have more knowledge of the nutrition profiles and health impacts of the chosen coffee. To this regard, we explored the metabolomic profiles of peels of yellow, red, orange, and dark purple Bourbon berries.
2. Materials and Methods
2.1. Coffee Genetic Resources and Field Conditions
Healthy seeds of the four Bourbon varieties (Coffea arabica L.) with different colors, i.e., red (RF), yellow (YF), orange (ORF), and dark purple (PF), were obtained from the Coffee Research Center in the Institute of Tropical and Subtropical Cash Crop, Yunnan Academy of Agricultural Sciences, China. The seeds were planted in July 2017 at the scientific research station of the Institute in Lujiang Town, Boashan City (24°58′17.93″ N; 98°52′43.28″ E), China. Planting was carried out at 1 m intra-row and 2 m inter-row, and each variety had at least 15 plants. The experimental site is located in a low-latitude quasi-tropical monsoon rainforest with a dry and hot valley transition type of climate. The average temperature and rainfall in the experimental area are 21.5 °C and 755.3 mm, respectively. The experimental site encounters a dry season from November to May each year with adequate sunlight and significant variation in temperature between day and night.
The cultivated coffee varieties started producing fruits in 2019. Plants at the border of each field were excluded during fruit sampling. Healthy and disease-free coffee plants from the four varieties were selected for sampling. Five plants were randomly selected in January 2020 and tagged for fruit harvesting. Fully mature, healthy, and fresh berry samples with uniform colors were picked from the first-level branches on the inner plants of each variety. After labeling, the fruit samples were placed in a liquid nitrogen container to transfer to the laboratory where they were stored in −80 °C ultra-low temperature refrigerator until further processing.
2.2. Determination of Total Flavonoid, Anthocyanin, and Phenolic Contents in the Peels of the four Coffee Varieties
The total flavonoid content (TFC) in the peels among the four coffee varieties was determined using the NaNO2–AlCl3–NaOH method [24] using a biochemical kit (NMKD0120, Norminkoda Biotechnology Co., Ltd., Wuhan, China). Briefly, about 0.02 g of the flesh tissues was extracted using 1 mL of 80% methanol in 60 °C water in an ultrasonic bath for 30 min. The solution was centrifuged at 10,000× g at 25 °C for 10 min, and the supernatant was collected. The supernatant was combined and standardized to a final volume of 10 mL with 80% methanol. The spectrophotometer microplate reader was preheated for 30 min, and the absorbance was measured at the wavelength of 510 nm. The total flavonoid content was expressed in μg g−1 of the fresh weight (FW).
The total anthocyanin content (TAC) was quantified by pH differential method [25] using the Plant Anthocyanin Content Detection Kit (Norminkoda Biotechnology Co., Ltd., Wuhan, China) according to manufacturer’s protocols. The absorbance of samples was measured at 530 and 700 nm. TAC was computed using the following formula:
where A = (A520 nm − A700 nm) pH 1.0 − A = (A520 nm − A700 nm) pH 4.5; V = volume of extract (mL); and M = fresh mass of the sample (g).
The total phenolic content (TPC) was determined by total phenols test [24] using a kit from Norminkoda Biotechnology Co., Ltd., Wuhan, China. Under alkaline conditions, the phenolic substance reduced the tungsten molybdic acid to produce a somewhat blue compound with a characteristic absorption peak at 760 nm. Absorbance at 760 nm was measured to obtain the sample’s total phenol content. About 0.1 g of flesh tissue powder was weighed, 2.5 mL of extract solution was added, and total phenols were extracted by ultrasonic extraction. The ultrasonic power was 300 W, the mixture was broken for 5 s, intermittent 8 s, and then extracted for 30 min at 60 °C. The mixture was centrifuged for 10 min at 12,000 rpm, at 25 °C, and the supernatant was taken and diluted to a final volume of 2.5 mL with the extraction solution. The absorbance of the extract was measured at wavelength of 760 nm using a Microplate reader (pectraMax M2, Molecular Devices, Sunnyvale, CA, USA). The standard curve was tested with 1 mg mL−1 tannic acid standard solution.
The TFC, TAC, and TPC measurements were performed for three biological replicates for each of the four Bourbon varieties.
2.3. Assessment of Antioxidant Activities in the Peels of the Four Coffee Varieties
Antioxidant activities were assessed by 2,2-dyphenyl-1-picrylhydrazyl (DPPH), 2,2-azino-bis(3-ethyl-benzothiazoline-6-sulphonic acid) di-ammonium salt (ABTS) and ferric reducing antioxidant potential (FRAP) following procedures reported by Afonso et al. [26] with NMKD0109, NMKD0110, and NMKD0111 kits, respectively, from Norminkoda Biotechnology Co., Ltd. Wuhan, China. The measurement of DPPH, ABTS, and FRAP was conducted in triplicates for each variety.
2.4. Metabolome Profiling in the Peels of the Four Coffee Varieties by Ultra-High-Performance Liquid Chromatography-Mass Spectrometry
Twelve samples (4 coffee varieties × 3 biological replicates), each weighing about 3 g, were crushed into powder following vacuum freeze-drying with a mixer mill MM400 and zirconia beads (15 mm) for 1.5 min at 30 Hz. Thereafter, sample powder of 100 mg was extracted overnight at 4 °C in 1.0 mL 70% aqueous methanol and centrifuged for 10 min at 10,000× g. The extracts were filtered and transferred to a new tube for ultra-high-performance liquid chromatography-tandem mass spectrometry (ULPLC-MS/MS) analysis as reported earlier [27]. Briefly, widely untargeted metabolite profiling was performed with a self-built database by MetWare Biotechnology Co., Ltd. (Wuhan, China). A control analysis was conducted by mixing sample extracts from four samples to check in the repeated analyses. The metabolites were assessed by secondary spectrum information by qualitative means. The metabolites were quantified by a multi-reaction monitoring mode analysis via triple quadruple-bar mass spectrometry, AB4500 Q TRAP UPLC/MS/MS System, equipped with an ESI Turbo Ion-Spray interface. The system worked in both positive and negative ion modes and was controlled by Analyst 1.6.3 software (AB Sciex). The ESI source operation parameters were set as follows: ion source, turbo spray; source temperature 550 °C; ion spray voltage (IS) 5500 V (positive ion mode)/−4500 V (negative ion mode); ion source gas I (GSI), gas II(GSII), curtain gas (CUR) was set at 50, 60, and 25.0 psi, respectively; the collision-activated dissociation (CAD) was high. Instrument tuning and mass calibration were undertaken in 10 and 100 μmol/L polypropylene glycol solutions in QQQ and LIT modes, respectively. QQQ scans were obtained as MRM experiments with collision gas (nitrogen) set to medium. DP and CE for individual MRM transitions were done with further DP and CE optimization. A specific set of MRM transitions was checked for each period according to the metabolites eluted within this period.
2.5. Statistical Analyses
Data obtained for TFC, TAC, TPC, DPPH, ABTS, and FRAP in triplicates were subjected to the analysis of variance (ANOVA) in GenStats, version 12 (VSN International Ltd., UK, www.vsni.co.uk, accessed on 20 February 2023), and post hoc mean separation was performed with Duncan multiple-range test at p < 0.05. Graphs with means and standard error of mean were generated with the help of GraphPad Prism statistical software (version 8, GraphPad Software, San Diego, CA, USA, www.graphpad.com, accessed on 20 February 2023).
Data quality and reproducibility of metabolites detected were assessed by principal component analysis (PCA), hierarchical clustering heatmap (HCH), and Pearson’s correlation analysis based on ion intensities with tidyverse [28], pheatmap [29], and corrplot [30] packages in R, respectively. The differentially accumulated metabolites (DAMs) were identified by using stringent filtering criteria of the orthogonal partial least squares-discriminant analysis (OPLS-DA) using a threshold of log2 foldchange, i.e., |log2FC ≥ 1| and variable importance in projection (VIP) ≥ 1 [31]. The heatmap of selected DAMs was constructed in R with pheatmap package [29].
3. Results
3.1. Levels of Bioactivities and Bioactive Secondary Metabolites in the Peels of Four Varieties of C. arabica
The berry color is reported to influence consumer preference [32], possibly due to variation in nutritional contents, i.e., bioactivities and bioactive secondary metabolites. The present study utilized the peels of four C. arabica Bourbon varieties with different fruit colors, i.e., purple (PF), red (RF), orange (ORF), and yellow (YF) (Figure 1). The total flavonoid content (TFC), total anthocyanin content (TAC), and total phenolic content (TPC) were assessed. In addition, antioxidant activities were assessed by 2,2-azino-bis(3-ethyl-benzothiazoline-6-sulphonic acid) di-ammonium salt (ABTS), 2,2-dyphenyl-1-picrylhydrazyl (DPPH), and ferric reducing antioxidant potential (FRAP). Significant variations in the studied parameters were observed among the four Bourbon coffee varieties (Figure 2A–F).
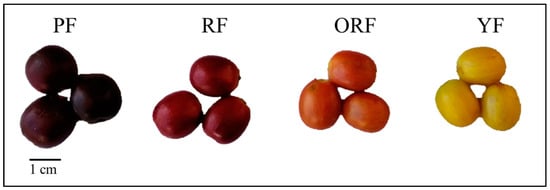
Figure 1.
Ripe fruit samples (berries) of the four Bourbon coffee (Coffea arabica) varieties used in this study. Dark purple (PF)-, Red (RF)-, Orange (ORF)-, and Yellow-colored berries (YF).
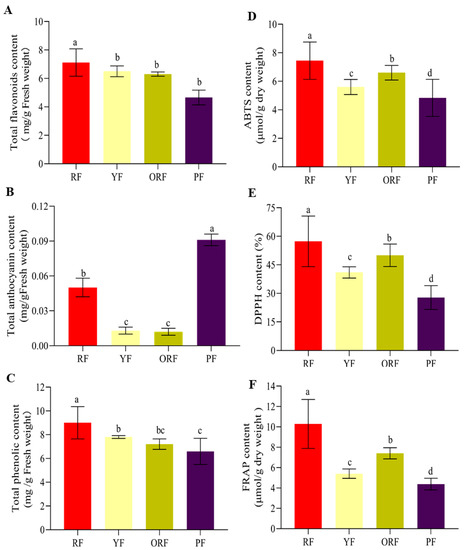
Figure 2.
Antioxidant and antiradical activities of the extracts of four Bourbon varieties. (A) Total flavonoid content, (B) total anthocyanin content, (C) total phenolic content, (D) 2,2-azino-bis(3-ethyl-benzothiazoline-6-sulphonic acid) di-ammonium salt (ABTS), (E) 2,2-dyphenyl-1-picrylhydrazyl (DPPH) content, and (F) ferric reducing antioxidant potential (FRAP). The bars represent mean (n = 3), and the error bars indicate standard error of mean (SEM). The post hoc mean separation was performed by Duncan multiple-range test at p < 0.05. Bars (Mean ± SEM) with a standard alphabet show no significant difference (p > 0.05), while those with different alphabets indicate significant difference (p < 0.05).
The RF had significantly (p < 0.05) the highest TFC (7.12 ± 0.96 mg/g) compared to YF (6.54 ± 0.38 mg/g), ORF (6.31 ± 0.15 mg/g), and PF peels (4.66 ± 0.53 mg/g) (Figure 2A). On the contrary, PF had the highest TAC (0.091 ± 0.005 mg/g), which was significantly (p < 0.05) different from the other three varieties (Figure 2B). The highest TAC was recorded in PF, followed by RF (0.050 ± 0.008 mg/g), YF (0.013 ± 0.003 mg/g), and ORF (0.012 ± 0.003 mg/g). The TAC was significantly higher in PF and RF compared to the other two; however, it did not differ significantly in YF and ORF (Figure 2B). Similarly, the TPC in berries varied significantly (p < 0.05) among the four varieties such that RF had the highest content (9.01 ± 1.36), followed by YF (7.80 ± 0.10), ORF (7.20 ± 0.40), and PF (6.60 ± 1.10 mg/g) (Figure 2C).
The antioxidant activities (ABTS, DPPH, and FRAP) differed significantly among the four coffee varieties (Figure 2D–F). The RF berries had the highest activities, i.e., ABTS, DPPH, and FRAP, followed by ORF, YF, and PF (Figure 2D–F), which is consistent with TFC and TPC (Figure 2A,C–E). These observations suggest a high level of correlation between antioxidant activity (ABTS, DPPH, and FRAP) and TFC and TPC [33,34]. Next, we studied the metabolome profiles of the four coffee berries to understand the major metabolite composition in these varieties.
3.2. Overview of Metabolome Profiling among the Four Varieties of C. arabica
A total of 579 metabolites were detected by UPLC-MS/MS in the berries of the four coffee varieties. These metabolites belong to 11 compound classes (Figure 3). The top five compound classes were flavonoids (19.86%), organic acids (12.44%), others (saccharides and alcohols, vitamins and others, 11.92%), lipids (11.74%), and amino acids and derivatives (11.57%) (Figure 3; Table S1). The remaining classes included phenolic acids (10.54%), nucleotides and derivatives (7.08%), alkaloids (5.87%), lignans and coumarins (3.11%), terpenoids (3.11%), and tannins (2.76%) (Figure 3A). The sum of all compounds within each class differed among the varieties such that RF was rich in tannins, YF in alkaloids, lignans and coumarins, and lipids, ORF in amino acids and derivatives, organic acids, and terpenoids, and PF in flavonoids, nucleotides and derivatives, and phenolic acids (Figure 3B). These observations suggest that each of the studied varieties offers a unique nutritional value based on the presence of compounds. These results are important from the point of view of health benefits and consumer preference (Figure 3B).
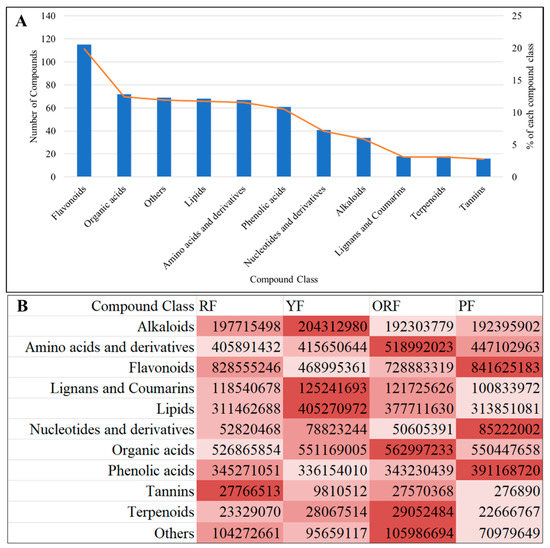
Figure 3.
(A) Percentage of the compound classes (of 579 metabolites) detected in the berries of four Bourbon coffee varieties by ultra-performance liquid chromatography and tandem mass spectrometry. (B) Sum of relative intensities of compounds in each class. The color intensity in panel “B” represents the relative content of compounds in each class.
Pearson correlation analysis based on the ion intensities of the 579 metabolites displayed high reproducibility between biological replicates (correlation coefficients ≥ 0.79) (Figure S1). In addition, PCA explained that there was 56.09% variability among the four varieties (Figure 4A). The HCH based on the ion intensities of the 597 metabolites showed that the biological replicates grouped as two clusters. Cluster 1 consisted of only PF, while Cluster II included YF, RF, and ORF (Figure 4B). These results suggest that coffee fruit peels differ in their metabolite composition such that YF, RF, and ORF may contain a greater number of common metabolites, whereas the composition of PF might be different from the other three varieties. Overall, the Pearson’s correlation, PCA, and HCH analyses indicate the presence of metabolome variability which could account for the difference in the nutritive value of the four varieties.
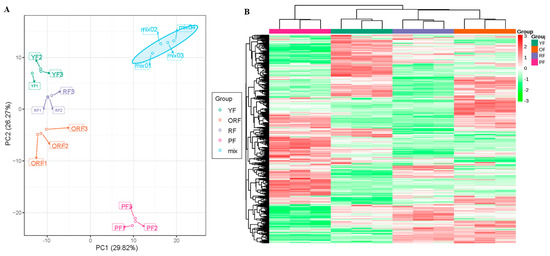
Figure 4.
Principal component analysis (A) and hierarchical cluster heatmap (B) based on the relative intensity of 579 metabolites detected in the four Bourbon coffee varieties. The Mix in Figure A was included as the control for quality check.
3.2.1. Comparative Analysis of Differentially Accumulated Metabolites among the Four Varieties of C. arabica
We screened the DAMs based on the filtering criteria, i.e., |log2FC ≥ 1| and VIP ≥ 1, which resulted in the identification of DAMs (Figure 5A,B). The highest and lowest numbers of DAMs were detected in YF_vs_PF (194) and ORF_vs_RF (106), respectively. These 319 DAMs are grouped into nine sub-classes such that the sub-class 4 (name of the class) and 9 (name of the class) had 55 (name of the class) and 18 (name of the class) metabolites, respectively (Figure S2; Tables S2 and S3). Moreover, based on the results of the antioxidant and antiradical bioactivities, the bioactive secondary metabolite contents (Figure 2A–F), and HCH (Figure 4B), we compared RF to the other three varieties, i.e., PF, YF, and ORF, and thus we present ORF_vs_RF, RF_vs_PF, and YF_vs_RF in our subsequent analyses (Figure 5C).
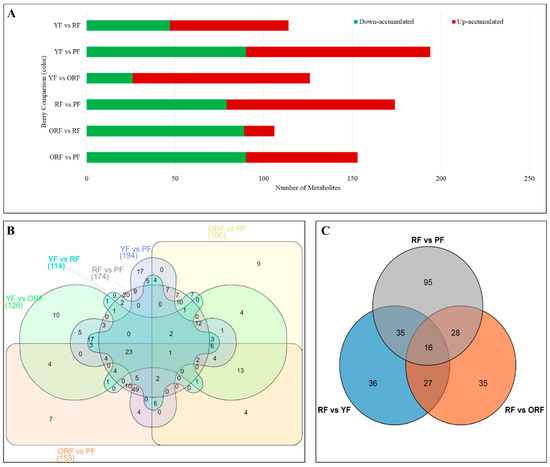
Figure 5.
(A) Summary of the number of differentially accumulated metabolites (DAMs) in pairwise comparisons among the four matured and ripe fruit peel samples of Coffea arabica. (B) Venn diagram based on the pairwise comparison of the DAMs accumulated in the four genotypes, and (C) Venn diagram of the DAMs in RF as compared to YF, ORF, and PF.
Variation in Flavonoid (and Anthocyanin) Contents in the Ripe Fruit Peels of Four C. arabica Varieties
We further screened the flavonoid compounds from the 319 DAMs accumulated in the four coffee varieties. Of the 319 DAMs, 103 flavonoid compounds showed differential accumulation in the four varieties. The flavonoids accumulated in the order of PF (624,955,246.85) > RF (617,112,251.64) > ORF (491,334,557.73) > YF (257,461,277.53) (Table S3). These compounds include anthocyanins, chalcones, dihydroflavones, dihydroflavonols, flavanols, flavonoids, flavonoid carbonosides, flavonols, and isoflavones. Notably, cyanidin-3-O-(6″-O-p-coumaroyl)glucoside, 3,3′,5-trihydroxy-4′,7-dimethoxyflavanone, epicatechin, 3′-O-methyl-(-)-epicatechin, luteolin-7-O-rutinoside, kaempferol-3-O-glucoside (astragalin), kaempferol-3-O-rutinoside-7-O-glucoside, kaempferol-3-O-rutinoside(nicotiflorin), kaempferol-3,7-O-dirhamnoside (kaempferitrin), kaempferol-3-O-neohesperidoside, and 2’-hydroxyisoflavone were highly accumulated in RF compared to the other three varieties (Table S2), which seems to be a possible reason for observing the highest TFC content in RF (Figure 2A).
Anthocyanins are documented to have an antioxidant and anti-inflammatory potential [35,36]. Petunidin-3-O-(6″-O-p-coumaroyl)glucoside and delphinidin-3-O-rutinoside-7-O-glucoside compounds accumulated 0.25-fold lower in RF than in ORF, while the other two compounds (cyanidin-3-O-glucoside (kuromanin) and cyanidin-3-O-rutinoside (keracyanin)) had 4.27–7.91-fold higher content in RF than ORF. Contrarily, these four compounds showed an opposite accumulation trend in RF_vs_PF (Table S4A,B; Table 1). Only kuromanin and keracyanin were up-accumulated in RF compared with PF (Table S4C; Table 1). Among the three other varieties, five anthocyanin compounds generally accumulated in the order of PF > YF > ORF. These trends are consistent with the TAC results (Figure 2B).

Table 1.
Selected differentially accumulated flavonoid compounds and their fold change among the four coffee varieties with different fruit colors (orange-colored (ORF), red-colored (RF), yellow-colored (YF), and purple-colored (PF)) in pairwise comparisons.
The relevance of the antimicrobial, anti-inflammatory, antioxidant, and anti-diabetic effects of luteolin and its related compounds have recently been highlighted in food processing and utilization [37]. Considering this, we screened the differentially accumulated luteolin and its related compounds among the four coffee varieties. At least one of seven luteolin compounds showed differential accumulation in the pairwise comparisons (except ORF_vs_RF and ORF_vs_PF). For example, luteolin-7-O-neohesperidoside (lonicerin), luteolin-7-O-rutinoside, and luteolin-7-O-(2″-O-rhamnosyl)rutinoside had higher content in RF than PF (Table 1; Table S4B). Conversely, luteolin-6-C-glucoside-7-O-(6″-feruloyl)arabinoside accumulated lower in RF than YF. Again, luteolin-8-C-glucoside-7-O-glucoside had a higher abundance in ORF than YF (Table 1; Table S4D). Moreover, most of the luteolin compounds (four out of seven) were up-accumulated in YF in comparison to PF (Table 1; Table S4E). Additionally, other beneficial flavonoid compounds such as quercetin, kaempferol, and others found in Table S4A–F had varied accumulation among the four varieties [38].
In addition to anthocyanins and luteolin, hesperetin and its derivatives are known to have antioxidant and anticarcinogenic properties [39,40]. Four of these compounds, hesperetin-5-O-glucoside, hesperetin-7-O-glucoside, hesperetin-7-O-rutinoside (hesperidin), and hesperetin-7-O-(6″-malonyl) glucoside, accumulated variedly among the four coffee varieties (Table S4A–F; Table 1). For instance, both hesperetin-5-O-glucoside and hesperetin-7-O-glucoside accumulated higher in ORF than in RF (Table S4A). Meanwhile, in YF_vs_RF, hesperetin-7-O-glucoside also accumulated higher in YF than RF. Interestingly, hesperetin-7-O-rutinoside (hesperidin) was also detected in YF (Table S4B). Hesperetin-7-O-glucoside accumulated 0.44-fold lower in RF than in PF (Table S4C). Among the other three coffee varieties (ORF, YF, and PF), at least one compound classified as hesperetin or its derivative accumulated differentially (Table S4D–F; Table 1).
Comparison of Phenolic Compounds Accumulated Differentially among the Ripe Fruit Peels of Four Varieties of C. arabica
Coffee is known to contain a number of phenolic compounds [41], making it useful for hepatoprotective, hypoglycemic, and antiviral activities [10]. In all, 35 compounds classified as phenolic acids were differentially accumulated among the four coffee varieties. The highest phenolic acid accumulation (cumulative) was observed in PF (126,153,037.37), followed by RF (71,001,425.70), ORF (60,938,409.73), and YF (59,286,683.50) (Tables S2 and S3). These observations are different from the TPC results (Figure 2C), which could be due to the sensitivity of the detection methods, as well as the fact that only phenolic acids were detected by UPLC-MS/MS. 2-Hydroxybenzaldehyde (Salicylaldehyde), 3,4-dihydrobenzeneacetic acid, phthalic anhydride, and dibutyl phthalate had higher contents in RF followed by YF, ORF, and PF. Meanwhile, disinapoyl glucoside, 3,4-dihydroxybenzoic acid (protocatechuic acid), methyl sinapate, 1-O-sinapoyl-D-glucose, and 4-O-sinapoylquinic acid had higher accumulation in ORF than RF (Figure 6A, Table S4A). Interestingly, 2-(formylamino)benzoic acid was unique to RF (Figure 6A, Table S4A).
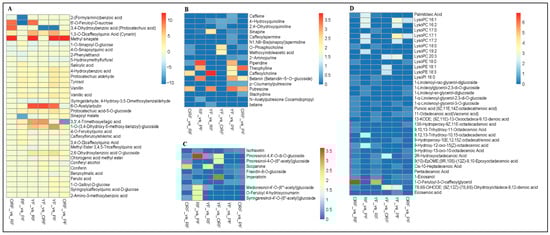
Figure 6.
Fold change (FC) of differentially accumulated metabolites (based on ion intensities) of different classes of compound pairwise comparison among the four coffee varieties (red-colored fruit peels (RF); yellow-colored fruit peels (YF); orange-colored fruit peels (ORF), and purple-colored fruit peels (PF)). (A) Phenolic acids. (B) Alkaloids. (C) Lignans and coumarins. (D) Lipids. FC < 1 means down-accumulated, FC > 1 represents up-accumulated, and FC = 0 indicates not differentially accumulated. For instance, FC < 1, FC > 1, and FC = 0 in ORF_vs_RF indicate higher accumulation in ORF than in RF, lower accumulation in ORF than in RF, and no difference between ORF and RF, respectively. Details on the accumulation in the individual varieties in the pairwise comparisons are shown in Table S4A–F.
Twenty-two phenolic acids differentially accumulated in RF_vs_PF; six and sixteen were down- and up-accumulated in PF and RF, respectively (Figure 6A, Table S4B). The compounds that had higher contents in PF include 4-O-feruloylquinic acid, caffeoylferuloylshikimic acid, 3,4-O-dicaffeoylquinic acid methyl ester, sinapoyl malate, 1-O-sinapoyl-D-glucose, and 3,4,5-tricaffeoylquinic acid (Table S4B). Meanwhile, 2-phenylethanol, 5-hydroxymethylfurfural, and 6-O-acetylarbutin had higher contents in RF than PF. Of these, 2-phenylethanol is reported to improve the organoleptic properties of cider, offer health benefits through its antioxidant properties [42], and enhance tomato fruit taste [43,44]. In addition to these, 2-(formylamino)benzoic acid, 3,3′,4-trimethoxyellagic acid, and 6′-O-feruloyl-D-sucrose were solely identified in the RF variety in contrast to the PF variety.
Thirteen phenolic acids including 1,3-O-dicaffeoylquinic acid (cynarin), 1-O-(3,4-dihydroxy-5-methoxy-benzoyl)-glucoside, 2,6-dihydroxybenzoic acid O-glucoside, and tyrosol had higher contents in RF compared to YF (Figure 6A, Table S4C). Seven compounds, i.e., syringaldehyde, 4-Hydroxy-3,5-dimethoxybenzaldehyde, methyl sinapate, sinapoyl malate, 4-O-feruloylquinic acid, chlorogenic acid methyl ester, 1-O-sinapoyl-D-glucose, and 3,4,5-tricaffeoylquinic acid were in higher abundance in YF than RF (Table S4C). It has been documented that chlorogenic acid and its related compounds are flavor precursors during roasting and provide a distinctive coffee taste [32,45], making the YF variety a good candidate for processing and consumption.
Considering other varietal comparisons, there were 13 (2 down and 11 up), 21 (4 down and 17 up), and 20 (5 down and 15 up) compounds that exhibited differential accumulation in YF_vs_ORF, YF_vs_PF, and ORF_vs_PF, respectively (Figure 6A, Table S4D–F). Of these, 1,3-O-dicaffeoylquinic acid (cynarin) was detected in only the ORF variety. It has been reported to be a major compound in coffee compared to other beverages [41,46] and have anti-inflammatory and antioxidant properties [47]. In addition, sinapoyl malate was in higher abundance in the PF variety than both YF and ORF varieties, and tyrosol followed a similar trend to sinapoyl malate (Figure 6A, Table S4D–F). Several other compounds exhibited differences in accumulation among the three varieties, suggesting that the ORF, YF, and PF varieties with some unique metabolites have potential for specific human use [41,48].
Variation in Alkaloid and Lignan and Coumarin Compounds in RF Variety Relative to ORF, YF, and PF Varieties of C. arabica
Alkaloids present in different foods, e.g., coffee, offer a arrange of health benefits [49]. For example, caffeine is the most studied and the most useful compound that has sensory and physiological effects [50,51]. Caffeine was observed to accumulate in the order of YF > ORF > RF > PF (Table S3); however, it accumulated differentially in YF_vs_PF (Figure 6B; Table S4E). The other alkaloid compounds worth elaborating on are quinoline and its derivatives, 4-hydroxyquinoline, and 2,4-dihydroxyquinoline. 4-hydroxyquinoline accumulated highly in the YF variety relative to ORF, RF, and PF (Figure 2B; Table S4C–E). In addition, 2,4-dihydroxyquinoline had a higher abundance in YF than in ORF (Figure 2B; Table S4D). Similarly, sinapine, which is known for its antioxidant and radio-protective effects [52], was accumulated highly in RF relative to either PF or YF (Figure 6B; Table S4B,C). However, sinapine exhibited higher abundance in either YF or ORF than PF (Figure 6B; Table S4E,F). Among the other alkaloids, notably, caffeoylspermine and N1,N8-bis(sinapoyl)spermidine showed differential accumulation in YF and PF such that YF had higher contents than PF (Table S4E).
Lignan and coumarins offer numerous human health benefits. We observed that lignans and coumarins were highly accumulated in YF, followed by ORF, RF, and PF. Among the differentially accumulated lignans and coumarins, isofraxetin (IF) showed differential accumulation in RF_vs_PF, YF_vs_PF, and ORF_vs_PF such that RF, YF, and ORF had higher accumulation than PF (Figure 6C; Table S4B,E,F). Two variants of pinoresinol, i.e., pinoresinol-4,4′-O-di-O-glucoside and pinoresinol-4-O-(6″-acetyl) glucoside, accumulated differentially (Figure 6C; Table S4A–F). Pinoresinol-4,4′-O-di-O-glucoside accumulated higher in either YF, PF, or ORF than RF (Figure 6C; Table S4A–C). Meanwhile, it accumulated >2-fold higher in ORF than YF (Table S4E). On the other hand, ORF had more abundance of pinoresinol-4-O-(6″-acetyl) glucoside than either RF or YF (Table S4A,F). Similarly, scoparone had higher accumulation in RF than either YF, ORF, or PF (Table S4A–C), while in the case of YF_vs_PF and ORF_vs_PF, PF had a lower abundance than either YF or ORF (Table S4E,F). In summary, these results indicate that unique compounds’ presence (and combinations) in each of the studied varieties makes them useful.
Lipid and Terpenoid Compounds Showed Diverse Accumulation among the Peels of the Four Varieties of C. arabica
Coffee contains a large number of lipid compounds mostly stored as triacylglycerol and linoleic acid (fatty acid desaturation) [53,54,55], which contribute significantly to beverage organoleptic properties. They are also considered to be the determinants of coffee quality [55]. Palmitoleic acid showed differential accumulation between RF and either YF, ORF, or PF in the order of YF > ORF > PF > RF (Figure 6D; Table S4A–C). In addition, five derivatives of linolenic acids (1-linolenoyl-rac-glycerol-diglucoside, 1-linoleoylglycerol-2,3-di-O-glucoside, 1-linoleoyl-sn-glycerol-diglucoside, 1-α-linolenoyl-glycerol-2,3-di-O-glucoside, and 1-α-linolenoyl-glycerol-3-O-glucoside) showed varied accumulation patterns (Figure 6D; Table S4A–C). For instance, 1-α-linolenoyl-glycerol-3-O-glucoside accumulated in the order of ORF > RF (ORF_vs_RF), YF > RF (YF_vs_RF), and YF > PF (YF_vs_PF).
Moreover, the punicic acid (9Z,11E,14Z-octadecatrienoic acid) accumulation was higher in ORF than RF or PF (Figure 6D; Table S4A,F), while 13 derivatives of punicic acid including 11-octadecanoic acid (vaccenic acid) and pentadecanoic acid had varied accumulation patterns among the four coffee varieties (Figure 6C; Table S4A,F). Furthermore, the other derivatives of palmitic (16:0), linoleic (18:2), stearic (18:0), and oleic (18:1) acids had varied accumulation among the four coffee varieties (Figure 6D; Table S4A–F).
Terpenoids also possess antihypertensive, anticancer, antifungal, and antimicrobial properties [56]. Hence, we compared the accumulation trends of the terpenoid compounds among the four coffee varieties. Cafestol is one of the major terpenoid compounds [46], which showed a higher accumulation trend in either RF, YF, or ORF than PF (Table S4B,E,F). Similarly, mascaroside, a diterpene glycoside compound, provides bitterness in coffee as a caffeine-free compound. Our results showed that three derivatives of mascaroside, i.e., mascaroside I, II, and IV, were differentially accumulated among the four coffee varieties such that RF had higher contents compared to YF, ORF, or PF (Table S4A–C). This suggests that mascaroside may impart a bitter taste in RF.
Composition of Organic Acid and Nucleotide and Derivative Compounds among the Ripe Fruit Peels of the Four Varieties of C. arabica
Quinic acid (QA) is a common organic acid present in different coffee varieties [57,58]. Our results showed that QA had the highest accumulation in PF followed by ORF, RF, and YF (Table S4B,D–F). In addition, 23 other organic acid compounds including isocitric, mevalonic, muconic, shikimic, and α-ketoglutaric acids, as well as phosphoenolpyruvate, accumulated differentially among the four coffee varieties (Table S4A–F).
Regarding nucleotides and derivatives, nine compounds (adenine, hypoxanthine, guanine, xanthine, 1,7-dimethylxanthine, 9-(arabinosyl) hypoxanthine, uridine 5′-monophosphate, 2′-Deoxyadenosine-5′-monophosphate, and NADP (nicotinamide adenine dinucleotide phosphate)) were all up-accumulated in PF relative to RF (Table S4B). Of these, only adenine, xanthine, 9-(arabinosyl) hypoxanthine, 2′-deoxyadenosine-5′-monophosphate, and NADP (nicotinamide adenine dinucleotide phosphate) were highly accumulated in PF (Table S4E). Similarly, all nine compounds (except guanine and 9-(arabinosyl) hypoxanthine) were up-accumulated in PF compared to ORF. Moreover, 16 other nucleotide and derivative compounds accumulated differentially in YF_vs_RF, YF_vs_ORF, YF_vs_PF, and ORF_vs_PF (Table S4C–F).
Amino Acid and Derivative, Tannin Compound, and Other (Saccharides and Alcohols, Stilbenes, and Vitamins) Variation among the Fruit Peels of the Four Varieties of C. arabica
Coffee is known to contain an appreciable amount of different amino acids and derivatives [57,59,60]. It was generally observed that amino acids and derivatives mostly accumulated higher in either ORF or PF than RF (Table S4A,B). Notably, L-histidine, L-isoleucine, L-leucine, and L-methionine were up-accumulated in either ORF or PF compared to RF. Generally, the amino acid and derivatives were highly accumulated differentially in ORF followed by PF and YF (Table S4D–F). These observations suggest that ORF, YF, and YF are richer in amino acids compared to the RF variety.
It was generally observed that tannins had higher accumulation in RF than either YF or PF (Table S4A,B). For example, cinnamtannin B2 was absent in the PF variety but had ~13-fold lower accumulation in YF relative to RF. Cinnamon is known as a remedy for respiratory, digestive, and gynecological disorders, among others, as outlined in Ranasinghe and Galappaththy [61]. The highest accumulation of tannins in the RF variety may account for the higher TPC recorded in RF than the other three varieties (Figure 2D).
Finally, coffee also contains volatile and carbohydrate compounds such as saccharides and alcohols, stilbene, and vitamins [57,60,62]. Among the vitamins, L-ascorbic acid had higher accumulation in either RF or YF than PF (Table S4B,E). In the case of stilbenes, piceatannol-3′-O-glucoside was highly accumulated in RF, YF, or ORF compared to PF (Table S4B,E,F). In addition to amino acids and stilbenes, 18 compounds classified as saccharides and alcohols were also differentially accumulated among the four coffee varieties (Table S4A–F). For example, D(+)-melezitose O-rhamnoside accumulated higher in ORF than in either of the other three varieties (RF, YF, or PF). Notably, D-(+)-sucrose was differentially accumulated in YF_vs_PF such that YF had higher contents than PF.
In summary, the above results suggest that the four studied varieties have a range of metabolites that are important from nutrition and health perspectives.
4. Discussion
4.1. Coffee Berries with Different Colors Offer Different Antioxidant Potentials
An increase in coffee consumption in China is driving the expansion of its market. Though coffee production, as well as import, is increasing in China, new strategies are needed to expand the coffee market [1]. One such strategy is to use a variety of processed products, e.g., different-colored coffees. Coffea arabica var. Bourbon is available in different colors, i.e., yellow, red, orange, and dark purple. To develop interest in consumers for consuming coffee of different colors, the provision of more information on their health and nutritional benefits can be useful [2]. Here, we report the antioxidant potential of four Bourbon coffees with different berry colors, i.e., yellow, red, orange, and dark purple. The highest FRAP in RF indicates the presence of the highest antioxidant content and respective antioxidant activity (Figure 1 and Figure 2) [63]. Interestingly, the observed FRAP content trend was consistent with the DPPH content (%), as well as ABTS content (Figure 2D–F). Thus, the studied fresh berries can be arranged as RF > ORF > YR > PF as per their antioxidant capacities. The similar trends of these antioxidant capacities in bioactive compounds, e.g., TFC and TPC, in the four Bourbon varieties indicate the potential role of these compounds (Figure 2A–F). Earlier studies on coffee, e.g., green coffee [64], black grapes [65], and chestnut [66], have shown that TFC and TPC are responsible for an increase in antioxidant potential. The UPLC-MS/MS analysis results showed that a major fraction of the metabolites classified as flavonoids, as well as phenolic acids, were accumulated in higher quantities in RF compared to YF (YF vs. RF) and PF (PF vs. RF), except for ORF (ORF vs. RF) (Tables S2 and S3). These observations indicate that other secondary metabolites might also be involved in the observed antioxidant potential. For example, terpenoids, alkaloids [67], saccharides and alcohols [68], and tannins [69]. This is consistent with the earlier reports that the antioxidant potential is also related to these compound classes [70,71]. In summary, all four tested coffee types offer potential health benefits.
4.2. Coffee Berries with Different Colors Have Different Metabolomic Profiles
Metabolomic variations within a variety of a cultivar exist and are important markers for consumer preference [72]. Our results show that each of the studied Bourbon coffee berries with different colors offering a unique nutritional value is important. For example, the highest accumulated contents of tannins (RF), alkaloids, lignans, coumarins, lipids (YF), amino acids, organic acids, terpenoids (ORF), flavonoids, nucleotides, and phenolic acids (PF) in the respective berries provide a guide for their consumption (Figure 3; Tables S2 and S3). Among these compound classes, each has its own health benefits, which together with the metabolome profile of the studied Bourbon coffee berries hint toward their preferred utility. Tannins offer both health-beneficial (antioxidant, anticancer, antiallergic, anti-inflammatory, and antimicrobial activities) and negative (carcinogenic, hepatotoxic, and mutagenic) effects [73]. Their presence in C. arabica is previously reported [71] to have a role in antioxidant activity. It is possible that the observed higher antioxidant potential in RF could be partially due to tannins since they are phenolic compounds and can be a cause of higher TPC [74].
However, the relatively total content of other compounds indicates that those varieties are also nutritionally diverse. Alkaloids, lignins and coumarins, and lipids were highly accumulated in YF. Alkaloids are reported to have anti-inflammatory, anticancer, analgesic, local anesthetic and pain relief, neuropharmacological, antimicrobial, antifungal, and many other beneficial activities [49,50,75,76,77]. Among them, caffeine is a metabolite of great economic significance in coffee since it influences the sensorial and physiological impact of the beverage. The result that YF had the highest total alkaloid contents is important from a sensory and physiological point of view because caffeine stimulates brain function, improves wakefulness, alleviates fatigue, and protects against Alzheimer’s and Parkinson’s diseases [50,51,77]. The notable higher contents of other metabolites classified as alkaloids in YF, RF, and PF, e.g., quinoline, 4-hydroxyquinoline, 2,4-dihydroquinoline, sinapine, caffeoylspermine, and N1-N8-bis(sinapoyl)spermidine, suggest that these Bourbon types could offer health-beneficial effects. This is because apart from caffeine, quinoline and its derivatives, sinapine, and spermidine have been reported as anticancer, anti-angiogenic agents, inhibiting telomerase activity in tumor cells [75,78] and showing radio-protective and antioxidant activities together with other health-beneficial effects [52,79,80,81]. In addition to alkaloids, YF (followed by ORF, RF, and PF) was rich in lignans and coumarins (Tables S3 and S4A–F). Earlier studies have also reported their presence in coffee [57,82]. These compounds offer a range of health benefits including antioxidant, antimicrobial, anti-inflammatory, antitumor, neuroprotective, and antihyperglycemic effects [83,84]. Together with alkaloids, the relatively higher accumulation of these compounds in YF and ORF indicates that these two varieties may offer fairly greater health benefits. Particularly, the higher accumulation of coumarins, i.e., IF (in YF and ORF), pinoresinol (in YF, PF, and ORF), and scoparone (in RF), is interesting from a health perspective. Isofraxetin is known for its anticancer, anti-inflammatory, antioxidant, cardioprotective, weight loss, anti-osteoarthritis, antimalarial, and neuroprotective effects [85]. Pinoresinol is a hypoglycemic agent and improves memory impairment [86], whereas scoparone has attracted much attention in recent years due to its anti-inflammatory activities and is a hepatoprotective candidate for hepatitis therapy [87,88]. Finally, the third most accumulated class of compounds in YF was lipids (Figure 5). These results suggest that the organoleptic properties of YF Bourbon coffee are higher followed by ORF and RF [55]. Because these varieties had relatively higher caffeine content, the detection of higher palmitoleic acid is understandable since it promotes the conversion of palmitic acid (16:0) to palmitoleic acid (16:1) [89]. Furthermore, the accumulation of linolenic acid and punicic acid and their derivatives in these Bourbon varieties (YF > ORF > RF > PF) indicates that they offer nutraceutical benefits. Particularly, punicic acid is an essential nutraceutical compound that can prevent neurodegenerative diseases, e.g., Alzheimer’s, Parkinson’s, and Huntington’s diseases [90].
From the perspective of richness in amino acids (and derivatives), organic acids, and terpenoids, the ORF Bourbon berries had the highest contents (Table S3; Figure 5). Amino acids and their derivatives are used to enhance physical and mental performance in athletes [91]. The comparative results that ORF and PF had higher concentrations of the amino acids (and their derivatives) than RF and YF indicate their usability from a nutritional perspective (Table S4A–F). Particularly the higher contents of pipecolic acid, isoleucine, leucine, ornithine, 2,3-dimethylsuccinic acid, methionine, histidine, tryptophan, and N-α-acetyl-L-ornithine in ORF and PF compared to RF suggest that these two Bourbon coffees can be beneficial to consumers for preventing oxidative stress, improving immune responses, and maintaining normal physiological mechanisms [92]. The higher antioxidant potential observed for ORF as compared to YF and PF can be due to the presence of these amino acids and derivatives. Earlier studies have shown that both amino acids and derivatives and organic acids contribute toward DPPH and FRAP [93,94,95]. The results that ORF had the highest organic compounds are consistent with these reports. Moreover, the highest terpenoid content in ORF followed by YF and RF could also be a reason for their higher antioxidant potential because they are known for their antioxidant activities in different plants [96]. Particularly, cafestol extracted from coffee beans has been shown to have multiple pharmacological actions in humans [97]. In summary, the higher contents and unique combinations of amino acids, organic acids, and terpenoids make ORF Bourbon coffee a good choice from a health perspective followed by YF, PF, and RF.
Finally, the relatively higher accumulation of the sum of all flavonoids, nucleotides and derivatives, and phenolic acids in PF indicates its utility from a health and color perspective. The relatively higher concentration of anthocyanins among the detected flavonoids is related to red and dark purple color in RF and PF, respectively. Moreover, the observed antioxidant potential in PF could be due to the accumulation of the detected flavonoids and phenolic acids [64,65,66]. The higher content of nucleotides and derivatives in PF and YF indicates that these varieties can provide serval benefits to consumers such as indispensable nutrients which can help the consumer during immune challenges, starvation, and aging [98]. Finally, the highest sum of the content of phenolic acids in PF followed by RF and YF indicates that these coffee varieties offer a range of compounds related to antioxidant and health benefits.
Overall, these results indicate that all of the examined four varieties have interesting metabolomic profiles that offer sensory, as well as health, benefits to consumers. These results are in agreement with the previous studies that have also reported that coffee varieties may differ in their metabolomic compositions [3,99]. Future studies on the specific metabolites reported in each of these colored Bourbon coffee berries would lead toward a detailed understanding of more specific health-beneficial and sensory properties. Moreover, comparative genomic investigations will be needed to explore the key pathways governing the common and differential metabolites in these varieties.
5. Conclusions
This study demonstrates that C. arabica Bourbon varieties differing in berry color have different antioxidant potentials owing to variation in TFC, TAC, and TPC. Based on the analyses performed in this work, we conclude that RF has the highest FRPA due to higher antioxidant content and activity followed by ORF, YR, and PF. The metabolome profile of Bourbon berries with different colors showed that the four coffee types differ in their compound composition and amount of the compounds present in each type. Based on the analyses performed, we concluded that the RF type of Bourbon coffee is rich in tannins, whereas YF has the highest contents of alkaloids, lignans and coumarins, and lipids. The ORF-type Bourbon coffee is rich in amino acids and derivatives, organic acids, and terpenoids. Finally, the fourth type, i.e., PF coffee, contains higher contents of compounds classified as flavonoids, nucleotides and derivatives, and phenolic acids. These results enable us to conclude that each of the studied varieties offers unique nutritional value based on the presence of compounds and antioxidant potential.
Supplementary Materials
The following supporting information can be downloaded at https://www.mdpi.com/article/10.3390/d15060724/s1, Figure S1: Pearson’s Correlation Coefficient analysis-based ion intensities of 579 metabolites detected among the four matured and ripe fruit peel samples of Coffea arabica (red-colored fruits (RF); yellow-colored fruits (YF); orange-colored fruits (ORF); and purple-colored fruits (PF)), in triplicates (YF1-3; ORF1-3; RF1-3; and PF1-3). Mix = control sample from the three varieties (YF, ORF, RF and PF) used for quality check in quadruplicates (mix01-04). Each column represents one colored bar indicating the replications, Figure S2: K-means clustering of differentially accumulated metabolites (DAMs) based on the standardized ion intensities of metabolites (log10 transformed) among the four matured and ripe fruit peel samples of Coffea arabica (red-colored fruits (RF); yellow-colored fruits (YF); orange-colored fruits (ORF); and purple-colored fruits (PF)). The sub-class and number of metabolites are shown on top of each sub-class plot, Table S1: Ion intensities (average of triplicates) of 579 metabolites detected among the peels of four matured and ripe fruit peel samples of Coffea arabica (red-colored fruits (RF); yellow-colored fruits (YF); orange-colored fruits (ORF); and purple-colored fruits (PF)) by ultra-performance liquid chromatography and tandem mass spectrometry, Table S2: K-means clustering of differentially accumulated metabolites based on the ion intensities of metabolites among the four matured and ripe fruit samples of Coffea arabica (red-colored fruits (RF); yellow-colored fruits (YF); orange-colored fruits (ORF); and purple-colored fruits (PF)), Table S3: Sub-classes by K-means clustering of the 319 differentially accumulated metabolites based on the ion intensities of metabolites among the four matured and ripe fruit samples of Coffea arabica (red-colored fruits (RF); yellow-colored fruits (YF); orange-colored fruits (ORF); and purple-colored fruits (PF)), Table S4: Differentially accumulated metabolites in pairwise comparison of the four Coffea arabica varieties (red-colored fruits (RF); yellow-colored fruits (YF); orange-colored fruits (ORF); and purple-colored fruits (PF)) based on the ion intensities upon application of stringent criteria of the orthogonal partial least squares-discriminant analysis (OPLS-DA) using a threshold of log2 foldchange, i.e., |log2FC ≥ 1|, and variable importance in projection (VIP) ≥ 1.
Author Contributions
Conceptualization, F.H., X.B., X.F., R.S. and W.D.; methodology, F.H., X.B. and X.F.; software, Y.L. (Yanan Li) and G.L.; validation, Y.L. (Yaqi Li), D.L. and Y.Y.; formal analysis, F.H., X.B. and X.F.; investigation, F.H., X.B. and X.F.; resources, R.S. and W.D.; data curation, Y.L. (Yanan Li), G.L., Y.L. (Yaqi Li), D.L. and Y.Y.; writing—original draft preparation, F.H. and X.B.; writing—review and editing, X.F., R.S. and W.D.; visualization, X.F.; supervision, R.S. and W.D.; project administration, R.S. and W.D.; funding acquisition, R.S. and W.D. All authors have read and agreed to the published version of the manuscript.
Funding
This research was funded by the major scientific special project plan in Yunnan “The research and development, demonstration of critical technology to improve quality and increase efficiency in coffee industry” (202202AE090002) and Yunnan high-level science and technology talent and selection of innovation team introducing project “Technology Innovation Talents Training Object Project” (202305AD160010).
Institutional Review Board Statement
Not applicable.
Informed Consent Statement
Not applicable.
Data Availability Statement
All the datasets are included within the manuscript or are attached as Supplementary Materials.
Conflicts of Interest
The authors declare no conflict of interest.
References
- Guanyan-Tianxia. China’s Coffee Industry Development Status Analysis and Investment Trend Forecast Report (2022–2029); Guanyan Tianxia (Beijing) Information Consulting Co., Ltd.; Insight & Info Consulting Ltd.: Beijing, China, 2022. [Google Scholar]
- Zhang, H.; Li, J.; Zhou, H.; Chen, Z.; Song, G.; Peng, Z.; Pereira, A.; Silva, M.; Várzea, V. Arabica coffee production in the Yunnan Province of China. In Proceedings of the 24th International Conference on Coffee Science, San José, Costa Rica, 12–16 November 2012. [Google Scholar]
- Da Silva Taveira, J.H.; Borém, F.M.; Figueiredo, L.P.; Reis, N.; Franca, A.S.; Harding, S.A.; Tsai, C.-J. Potential markers of coffee genotypes grown in different Brazilian regions: A metabolomics approach. Food Res. Int. 2014, 61, 75–82. [Google Scholar] [CrossRef]
- Amalia, F.; Aditiawati, P.; Putri, S.P.; Fukusaki, E. Gas chromatography/mass spectrometry-based metabolite profiling of coffee beans obtained from different altitudes and origins with various postharvest processing. Metabolomics 2021, 17, 69. [Google Scholar] [CrossRef]
- De Melo Pereira, G.V.; de Carvalho Neto, D.P.; Júnior, A.I.M.; do Prado, F.G.; Pagnoncelli, M.G.B.; Karp, S.G.; Soccol, C.R. Chemical composition and health properties of coffee and coffee by-products. Adv. Food Nutr. Res. 2020, 91, 65–96. [Google Scholar]
- Sharma, H. A detail chemistry of coffee and its analysis. In Coffee—Production and Research; IntechOpen: London, UK, 2020; p. 79. [Google Scholar]
- Yusibani, E.; Putra, R.; Rahwanto, A.; Surbakti, M. Physical properties of Sidikalang robusta coffee beans medium roasted from various colors of coffee cherries. In Journal of Physics: Conference Series; IOP Publishing: Bristol, UK; p. 012046.
- Gonzalez-Rios, O.; Suarez-Quiroz, M.L.; Boulanger, R.; Barel, M.; Guyot, B.; Guiraud, J.-P.; Schorr-Galindo, S. Impact of “ecological” post-harvest processing on the volatile fraction of coffee beans: I. Green coffee. J. Food Compos. Anal. 2007, 20, 289–296. [Google Scholar] [CrossRef]
- Esquivel, P.; Jimenez, V.M. Functional properties of coffee and coffee by-products. Food Res. Int. 2012, 46, 488–495. [Google Scholar] [CrossRef]
- Farah, A.; Donangelo, C.M. Phenolic compounds in coffee. Braz. J. Plant Physiol. 2006, 18, 23–36. [Google Scholar] [CrossRef]
- Montis, A.; Souard, F.; Delporte, C.; Stoffelen, P.; Stévigny, C.; Van Antwerpen, P. Targeted and Untargeted Mass Spectrometry-Based Metabolomics for Chemical Profiling of Three Coffee Species. Molecules 2022, 27, 3152. [Google Scholar] [CrossRef]
- Ságio, S.A.; Lima, A.A.; Barreto, H.G.; de Carvalho, C.H.S.; Paiva, L.V.; Chalfun-Junior, A. Physiological and molecular analyses of early and late Coffea arabica cultivars at different stages of fruit ripening. Acta Physiol. Plant. 2013, 35, 3091–3098. [Google Scholar] [CrossRef]
- Aswathi, K.; Shankar, S.; Seenivasan, K.; Prakash, I.; Murthy, P.S. Metagenomics and metabolomic profiles of Coffea canephora processed by honey/pulped natural technique. Innov. Food Sci. Emerg. Technol. 2022, 79, 103058. [Google Scholar] [CrossRef]
- De Castro, R.D.; Marraccini, P. Cytology, biochemistry and molecular changes during coffee fruit development. Braz. J. Plant Physiol. 2006, 18, 175–199. [Google Scholar] [CrossRef]
- Zheng, B.; Zhao, Q.; Wu, H.; Wang, S.; Zou, M. A comparative metabolomics analysis of guava (Psidium guajava L.) fruit with different colors. ACS Food Sci. Technol. 2020, 1, 96–106. [Google Scholar] [CrossRef]
- Wang, Z.; Cui, Y.; Vainstein, A.; Chen, S.; Ma, H. Regulation of fig (Ficus carica L.) fruit color: Metabolomic and transcriptomic analyses of the flavonoid biosynthetic pathway. Front. Plant Sci. 2017, 8, 1990. [Google Scholar] [CrossRef] [PubMed]
- Yuan, P.; He, N.; Umer, M.J.; Zhao, S.; Diao, W.; Zhu, H.; Dou, J.; Kaseb, M.O.; Kuang, H.; Lu, X. Comparative metabolomic profiling of Citrullus spp. fruits provides evidence for metabolomic divergence during domestication. Metabolites 2021, 11, 78. [Google Scholar]
- Li, Y.; Nie, J.; Shi, L.; Xie, Y.; Tan, D.; Yang, X.; Zhang, C.; Zheng, J. Transcriptomic and metabolomic profiling reveals the mechanisms of color and taste development in cherry tomato cultivars. LWT 2022, 167, 113810. [Google Scholar] [CrossRef]
- Hua, Q.; Chen, C.; Zur, N.T.; Wang, H.; Wu, J.; Chen, J.; Zhang, Z.; Zhao, J.; Hu, G.; Qin, Y. Metabolomic characterization of pitaya fruit from three red-skinned cultivars with different pulp colors. Plant Physiol. Biochem. 2018, 126, 117–125. [Google Scholar] [CrossRef] [PubMed]
- Zhang, Y.; Shu, H.; Mumtaz, M.A.; Hao, Y.; Li, L.; He, Y.; Jin, W.; Li, C.; Zhou, Y.; Lu, X. Transcriptome and Metabolome Analysis of Color Changes during Fruit Development of Pepper (Capsicum baccatum). Int. J. Mol. Sci. 2022, 23, 12524. [Google Scholar] [CrossRef]
- Spence, C. On the relationship (s) between color and taste/flavor. Exp. Psychol. 2019, 66, 99–111. [Google Scholar] [CrossRef]
- Clydesdale, F.M. Color as a factor in food choice. Crit. Rev. Food Sci. Nutr. 1993, 33, 83–101. [Google Scholar] [CrossRef]
- Stroebele, N.; De Castro, J.M. Effect of ambience on food intake and food choice. Nutrition 2004, 20, 821–838. [Google Scholar] [CrossRef]
- Zhang, Q.; Wang, L.; Wang, Z.; Liu, Z.; Zhao, Z.; Zhou, G.; Liu, M.; Liu, P. Variations of the nutritional composition of jujube fruit (Ziziphus jujuba Mill.) during maturation stages. Int. J. Food Prop. 2020, 23, 1066–1081. [Google Scholar] [CrossRef]
- Li, Y.; Cui, W.; Qi, X.; Lin, M.; Qiao, C.; Zhong, Y.; Hu, C.; Fang, J. MicroRNA858 negatively regulates anthocyanin biosynthesis by repressing AaMYBC1 expression in kiwifruit (Actinidia arguta). Plant Sci. 2020, 296, 110476. [Google Scholar] [CrossRef] [PubMed]
- Afonso, S.; Oliveira, I.V.; Meyer, A.S.; Aires, A.; Saavedra, M.J.; Gonçalves, B. Phenolic Profile and Bioactive Potential of Stems and Seed Kernels of Sweet Cherry Fruit. Antioxidants 2020, 9, 1295. [Google Scholar] [CrossRef] [PubMed]
- Wen, Y.-J.; Zhang, H.; Ni, Y.-L.; Huang, B.; Zhang, J.; Feng, J.-Y.; Wang, S.-B.; Dunwell, J.M.; Zhang, Y.-M.; Wu, R. Methodological implementation of mixed linear models in multi-locus genome-wide association studies. Brief. Bioinform. 2018, 19, 700–712. [Google Scholar] [CrossRef] [PubMed]
- Wickham, H.; Averick, M.; Bryan, J.; Chang, W.; McGowan, L.D.A.; François, R.; Grolemund, G.; Hayes, A.; Henry, L.; Hester, J. Welcome to the Tidyverse. J. Open Source Softw. 2019, 4, 1686. [Google Scholar] [CrossRef]
- Kolde, R. Pheatmap: Pretty heatmaps. R Package Version 2012, 1, 747. [Google Scholar]
- Vanhaeren, H.; Nam, Y.-J.; De Milde, L.; Chae, E.; Storme, V.; Weigel, D.; Gonzalez, N.; Inzé, D. Forever young: The role of ubiquitin receptor DA1 and E3 ligase BIG BROTHER in controlling leaf growth and development. Plant Physiol. 2017, 173, 1269–1282. [Google Scholar] [CrossRef]
- Shan, M.; Liu, H.; Hao, Y.; Song, K.; Meng, T.; Feng, C.; Wang, Y.; Huang, Y. Metabolomic Profiling Reveals That 5-Hydroxylysine and 1-Methylnicotinamide Are Metabolic Indicators of Keloid Severity. Front. Genet. 2022, 12, 804248. [Google Scholar] [CrossRef]
- Bressani, A.P.P.; Martinez, S.J.; Batista, N.N.; Simão, J.B.P.; Schwan, R.F. Into the minds of coffee consumers: Perception, preference, and impact of information in the sensory analysis of specialty coffee. Food Sci. Technol. 2021, 41, 667–675. [Google Scholar] [CrossRef]
- Dudonné, S.; Vitrac, X.; Coutière, P.; Woillez, M.; Mérillon, J.-M. Comparative Study of Antioxidant Properties and Total Phenolic Content of 30 Plant Extracts of Industrial Interest Using DPPH, ABTS, FRAP, SOD, and ORAC Assays. J. Agric. Food Chem. 2009, 57, 1768–1774. [Google Scholar] [CrossRef]
- Thaipong, K.; Boonprakob, U.; Crosby, K.; Cisneros-Zevallos, L.; Hawkins Byrne, D. Comparison of ABTS, DPPH, FRAP, and ORAC assays for estimating antioxidant activity from guava fruit extracts. J. Food Compos. Anal. 2006, 19, 669–675. [Google Scholar] [CrossRef]
- Fernandes, I.; Marques, C.; Évora, A.; Faria, A.; Calhau, C.; Mateus, N.; de Freitas, V. Anthocyanins: Nutrition and Health. In Bioactive Molecules in Food; Mérillon, J.-M., Ramawat, K.G., Eds.; Springer International Publishing: Cham, Switzerland, 2019; pp. 1097–1133. [Google Scholar] [CrossRef]
- Gonçalves, A.C.; Nunes, A.R.; Falcão, A.; Alves, G.; Silva, L.R. Dietary Effects of Anthocyanins in Human Health: A Comprehensive Review. Pharmaceuticals 2021, 14, 690. [Google Scholar] [CrossRef] [PubMed]
- Muruganathan, N.; Dhanapal, A.R.; Baskar, V.; Muthuramalingam, P.; Selvaraj, D.; Aara, H.; Shiek Abdullah, M.Z.; Sivanesan, I. Recent Updates on Source, Biosynthesis, and Therapeutic Potential of Natural Flavonoid Luteolin: A Review. Metabolites 2022, 12, 1145. [Google Scholar] [CrossRef] [PubMed]
- Jan, R.; Khan, M.; Asaf, S.; Lubna; Asif, S.; Kim, K.-M. Bioactivity and Therapeutic Potential of Kaempferol and Quercetin: New Insights for Plant and Human Health. Plants 2022, 11, 2623. [Google Scholar] [CrossRef]
- Martínez-Noguera, F.J.; Marín-Pagán, C.; Carlos-Vivas, J.; Rubio-Arias, J.A.; Alcaraz, P.E. Acute Effects of Hesperidin in Oxidant/Antioxidant State Markers and Performance in Amateur Cyclists. Nutrients 2019, 11, 1898. [Google Scholar] [CrossRef] [PubMed]
- Khan, A.; Ikram, M.; Hahm, J.R.; Kim, M.O. Antioxidant and Anti-Inflammatory Effects of Citrus Flavonoid Hesperetin: Special Focus on Neurological Disorders. Antioxidants 2020, 9, 609. [Google Scholar] [CrossRef]
- Rostagno, M.A.; Celeghini, R.M.S.; Debien, I.C.N.; Nogueira, G.C.; Meireles, M.A.A. Phenolic Compounds in Coffee Compared to Other Beverages. In Coffee in Health and Disease Prevention; Preedy, V.R., Ed.; Academic Press: San Diego, CA, USA, 2015; pp. 137–142. [Google Scholar] [CrossRef]
- Wilson, A.; Johnson, J.B.; Naiker, M. Biotechnological Modification of Cider Brewing Processes for the Enhanced Production of 2-Phenylethanol. Beverages 2022, 8, 64. [Google Scholar] [CrossRef]
- Tieman, D.; Taylor, M.; Schauer, N.; Fernie, A.R.; Hanson, A.D.; Klee, H.J. Tomato aromatic amino acid decarboxylases participate in synthesis of the flavor volatiles 2-phenylethanol and 2-phenylacetaldehyde. Proc. Natl. Acad. Sci. USA 2006, 103, 8287–8292. [Google Scholar] [CrossRef]
- Wang, S.; Qiang, Q.; Xiang, L.; Fernie, A.R.; Yang, J. Targeted approaches to improve tomato fruit taste. Hortic. Res. 2023, 10, uhac229. [Google Scholar] [CrossRef]
- Selmar, D.; Bytof, G.; Knopp, S.-E. The Storage of Green Coffee (Coffea arabica): Decrease of Viability and Changes of Potential Aroma Precursors. Ann. Bot. 2008, 101, 31–38. [Google Scholar] [CrossRef]
- Vandeponseele, A.; Draye, M.; Piot, C.; Chatel, G. Subcritical water and supercritical carbon dioxide: Efficient and selective eco-compatible solvents for coffee and coffee by-products valorization. Green Chem. 2020, 22, 8544–8571. [Google Scholar] [CrossRef]
- Alcázar Magaña, A.; Kamimura, N.; Soumyanath, A.; Stevens, J.F.; Maier, C.S. Caffeoylquinic acids: Chemistry, biosynthesis, occurrence, analytical challenges, and bioactivity. Plant J. 2021, 107, 1299–1319. [Google Scholar] [CrossRef] [PubMed]
- Glabasnia, A.; Blank, I.; Mora, F.; Leloup, V.; Kerler, J. The multiple role of polyphenol chemistry in coffee associated with quality attributes. In Proceedings of the 24th ASIC Conference, San José, Costa Rica, 12–16 November 2012. [Google Scholar]
- Joanna, K. Introductory Chapter: Alkaloids—Their Importance in Nature and for Human Life. In Alkaloids; Joanna, K., Ed.; IntechOpen: Rijeka, Croatia, 2019; Chapter 1. [Google Scholar] [CrossRef]
- Ashihara, H.; Sano, H.; Crozier, A. Caffeine and related purine alkaloids: Biosynthesis, catabolism, function and genetic engineering. Phytochemistry 2008, 69, 841–856. [Google Scholar] [CrossRef] [PubMed]
- Patay, É.B.; Bencsik, T.; Papp, N. Phytochemical overview and medicinal importance of Coffea species from the past until now. Asian Pac. J. Trop. Med. 2016, 9, 1127–1135. [Google Scholar] [CrossRef] [PubMed]
- Guo, Y.; An, H.; Feng, L.; Liu, Q.; Wang, S.; Zhang, T. Sinapine as an active compound for inhibiting the proliferation of Caco-2 cells via downregulation of P-glycoprotein. Food Chem. Toxicol. 2014, 67, 187–192. [Google Scholar] [CrossRef]
- Bastian, F.; Hutabarat, O.S.; Dirpan, A.; Nainu, F.; Harapan, H.; Emran, T.B.; Simal-Gandara, J. From Plantation to Cup: Changes in Bioactive Compounds during Coffee Processing. Foods 2021, 10, 2827. [Google Scholar] [CrossRef]
- Farias-Pereira, R.; Park, C.S.; Park, Y. Mechanisms of action of coffee bioactive components on lipid metabolism. Food Sci. Biotechnol. 2019, 28, 1287–1296. [Google Scholar] [CrossRef]
- Anagbogu, C.F.; Zhou, J.; Olasupo, F.O.; Baba Nitsa, M.; Beckles, D.M. Lipidomic and metabolomic profiles of Coffea canephora L. beans cultivated in Southwestern Nigeria. PLoS ONE 2021, 16, e0234758. [Google Scholar] [CrossRef]
- Deepak Kumar, D.; Chandra Kishore, T.; Anil Kumar, S.; Vaibhav, T. Revisiting the Medicinal Value of Terpenes and Terpenoids. In Revisiting Plant Biostimulants; Vijay Singh, M., Hanuman Prasad, P., Sunita Kumari, M., Eds.; IntechOpen: Rijeka, Croatia, 2022; Chapter 5. [Google Scholar] [CrossRef]
- Ali, A.; Zahid, H.F.; Cottrell, J.J.; Dunshea, F.R. A Comparative Study for Nutritional and Phytochemical Profiling of Coffea arabica (C. arabica) from Different Origins and Their Antioxidant Potential and Molecular Docking. Molecules 2022, 27, 5126. [Google Scholar] [CrossRef]
- Jham, G.N.; Fernandes, S.A.; Garcia, C.F.; Silva, A.A.d. Comparison of GC and HPLC for the quantification of organic acids in coffee. Phytochem. Anal. 2002, 13, 99–104. [Google Scholar] [CrossRef]
- Casal, S.; Mendes, E.; Oliveira, M.B.P.P.; Ferreira, M.A. Roast effects on coffee amino acid enantiomers. Food Chem. 2005, 89, 333–340. [Google Scholar] [CrossRef]
- Dong, W.; Tan, L.; Zhao, J.; Hu, R.; Lu, M. Characterization of Fatty Acid, Amino Acid and Volatile Compound Compositions and Bioactive Components of Seven Coffee (Coffea robusta) Cultivars Grown in Hainan Province, China. Molecules 2015, 20, 16687–16708. [Google Scholar] [CrossRef]
- Ranasinghe, P.; Galappaththy, P. Health benefits of Ceylon cinnamon (Cinnamomum zeylanicum): A summary of the current evidence. Ceylon Med. J. 2016, 61, 1–5. [Google Scholar] [CrossRef] [PubMed]
- Cwiková, O.; Komprda, T.; Šottníková, V.; Svoboda, Z.; Simonová, J.; Slováček, J.; Jůzl, M. Effects of Different Processing Methods of Coffee Arabica on Colour, Acrylamide, Caffeine, Chlorogenic Acid, and Polyphenol Content. Foods 2022, 11, 3295. [Google Scholar] [CrossRef]
- Guo, C.; Yang, J.; Wei, J.; Li, Y.; Xu, J.; Jiang, Y. Antioxidant activities of peel, pulp and seed fractions of common fruits as determined by FRAP assay. Nutr. Res. 2003, 23, 1719–1726. [Google Scholar] [CrossRef]
- Fidrianny, I.; Ruslan, K. Antioxidant activities of Arabica green coffee from three regions using ABTS and DPPH assays. Asian J. Pharm. Clin. Res. 2016, 189–193. [Google Scholar]
- Çoklar, H.; Akbulut, M. Effect of sun, oven and freeze-drying on anthocyanins, phenolic compounds and antioxidant activity of black grape (Ekşikara)(Vitis vinifera L.). South Afr. J. Enol. Vitic. 2017, 38, 264–272. [Google Scholar] [CrossRef]
- Martínez, S.; Fuentes, C.; Carballo, J. Antioxidant Activity, Total Phenolic Content and Total Flavonoid Content in Sweet Chestnut (Castanea sativa Mill.) Cultivars Grown in Northwest Spain under Different Environmental Conditions. Foods 2022, 11, 3519. [Google Scholar] [CrossRef]
- Chairgulprasert, V.; Kongsuwankeeree, K. Preliminary phytochemical screening and antioxidant activity of robusta coffee blossom. Sci. Technol. Asia 2017, 22, 1–8. [Google Scholar]
- Mohanta, B.; Sen, D.J.; Mahanti, B.; Nayak, A.K. Antioxidant potential of herbal polysaccharides: An overview on recent researches. Sens. Int. 2022, 3, 100158. [Google Scholar] [CrossRef]
- Sung, S.H.; Kim, K.H.; Jeon, B.T.; Cheong, S.H.; Park, J.H.; Kim, D.H.; Kweon, H.J.; Moon, S.H. Antibacterial and antioxidant activities of tannins extracted from agricultural by-products. J. Med. Plants Res. 2012, 6, 3072–3079. [Google Scholar] [CrossRef]
- Ameca, G.M.; Cerrilla, M.E.O.; Córdoba, P.Z.; Cruz, A.D.; Hernández, M.S.; Haro, J.H. Chemical composition and antioxidant capacity of coffee pulp. Ciência E Agrotecnol. 2018, 42, 307–313. [Google Scholar] [CrossRef]
- Patay, É.B.; Sali, N.; Kőszegi, T.; Csepregi, R.; Balázs, V.L.; Németh, T.S.; Németh, T.; Papp, N. Antioxidant potential, tannin and polyphenol contents of seed and pericarp of three Coffea species. Asian Pac. J. Trop. Med. 2016, 9, 366–371. [Google Scholar] [CrossRef] [PubMed]
- Farag, M.A.; Zayed, A.; Sallam, I.E.; Abdelwareth, A.; Wessjohann, L.A. Metabolomics-based approach for coffee beverage improvement in the context of processing, brewing methods, and quality attributes. Foods 2022, 11, 864. [Google Scholar] [CrossRef]
- Sharma, K.; Kumar, V.; Kaur, J.; Tanwar, B.; Goyal, A.; Sharma, R.; Gat, Y.; Kumar, A. Health effects, sources, utilization and safety of tannins: A critical review. Toxin Rev. 2021, 40, 432–444. [Google Scholar] [CrossRef]
- Strati, I.F.; Tataridis, P.; Shehadeh, A.; Chatzilazarou, A.; Bartzis, V.; Batrinou, A.; Sinanoglou, V.J. Impact of tannin addition on the antioxidant activity and sensory character of Malagousia white wine. Curr. Res. Food Sci. 2021, 4, 937–945. [Google Scholar] [CrossRef] [PubMed]
- Gaspar, D.; Izabel Luzia, M.; Marisa Alves Nogueira, D. Quinolines, Isoquinolines, Angustureine, and Congeneric Alkaloids—Occurrence, Chemistry, and Biological Activity. In Phytochemicals; Rao, A.V., Leticia, G.R., Eds.; IntechOpen: Rijeka, Croatia, 2015; Chapter 6. [Google Scholar] [CrossRef]
- Ashihara, H. Metabolism of alkaloids in coffee plants. Braz. J. Plant Physiol. 2006, 18, 1–8. [Google Scholar] [CrossRef]
- Perrois, C.; Strickler, S.R.; Mathieu, G.; Lepelley, M.; Bedon, L.; Michaux, S.; Husson, J.; Mueller, L.; Privat, I. Differential regulation of caffeine metabolism in Coffea arabica (Arabica) and Coffea canephora (Robusta). Planta 2015, 241, 179–191. [Google Scholar] [CrossRef]
- Muñoz, A.; Sojo, F.; Arenas, D.R.M.; Kouznetsov, V.V.; Arvelo, F. Cytotoxic effects of new trans-2,4-diaryl-r-3-methyl-1,2,3,4-tetrahydroquinolines and their interaction with antitumoral drugs gemcitabine and paclitaxel on cellular lines of human breast cancer. Chem.-Biol. Interact. 2011, 189, 215–221. [Google Scholar] [CrossRef]
- Qian, D.; Chen, J.; Lai, C.; Kang, L.; Xiao, S.; Song, J.; Xie, J.; Huang, L. Dicaffeoyl polyamine derivatives from bitter goji: Contribution to the bitter taste of fruit. Fitoterapia 2020, 143, 104543. [Google Scholar] [CrossRef]
- Roumani, M.; Duval, R.E.; Ropars, A.; Risler, A.; Robin, C.; Larbat, R. Phenolamides: Plant specialized metabolites with a wide range of promising pharmacological and health-promoting interests. Biomed. Pharmacother. 2020, 131, 110762. [Google Scholar] [CrossRef]
- Xiao, X.; Ren, W.; Zhang, N.; Bing, T.; Liu, X.; Zhao, Z.; Shangguan, D. Comparative Study of the Chemical Constituents and Bioactivities of the Extracts from Fruits, Leaves and Root Barks of Lycium barbarum. Molecules 2019, 24, 1585. [Google Scholar] [CrossRef] [PubMed]
- Mazur, W.; WÄHÄLÄ, K.; Rasku, S.; Makkonen, A.; Hase, T.; Adlercreutz, H. Lignans and Isoflavonoid Polyphenols in Tea and Coffee. J. Med. Food 1999, 2, 199–202. [Google Scholar] [CrossRef] [PubMed]
- Matos, M.J.; Santana, L.; Uriarte, E.; Abreu, O.A.; Molina, E.; Yordi, E.G. Coumarins—An important class of phytochemicals. Phytochem.-Isol. Characterisation Role Hum. Health 2015, 25, 533–538. [Google Scholar]
- Hano, C.F.; Dinkova-Kostova, A.T.; Davin, L.B.; Cort, J.R.; Lewis, N.G. Lignans: Insights into their biosynthesis, metabolic engineering, analytical methods and health benefits. Front. Plant Sci. 2021, 11, 630327. [Google Scholar] [CrossRef]
- Majnooni, M.B.; Fakhri, S.; Shokoohinia, Y.; Mojarrab, M.; Kazemi-Afrakoti, S.; Farzaei, M.H. Isofraxidin: Synthesis, Biosynthesis, Isolation, Pharmacokinetic and Pharmacological Properties. Molecules 2020, 25, 2040. [Google Scholar] [CrossRef]
- Pal, D.; Chandra, P.; Sachan, N. Sesame Seed in Controlling Human Health and Nutrition. In Nuts and Seeds in Health and Disease Prevention, 2nd ed.; Preedy, V.R., Watson, R.R., Eds.; Academic Press: Cambridge, MA, USA, 2020; pp. 183–210. [Google Scholar] [CrossRef]
- Hsueh, T.-P.; Tsai, T.-H. Preclinical Pharmacokinetics of Scoparone, Geniposide and Rhein in an Herbal Medicine Using a Validated LC-MS/MS Method. Molecules 2018, 23, 2716. [Google Scholar] [CrossRef]
- Zhang, A.; Sun, H.; Dou, S.; Sun, W.; Wu, X.; Wang, P.; Wang, X. Metabolomics study on the hepatoprotective effect of scoparone using ultra-performance liquid chromatography/electrospray ionization quadruple time-of-flight mass spectrometry. Analyst 2013, 138, 353–361. [Google Scholar] [CrossRef]
- Du, X.; Huang, Q.; Guan, Y.; Lv, M.; He, X.; Fang, C.; Wang, X.; Sheng, J. Caffeine Promotes Conversion of Palmitic Acid to Palmitoleic Acid by Inducing Expression of fat-5 in Caenorhabditis elegans and scd1 in Mice. Front. Pharmacol. 2018, 9, 321. [Google Scholar] [CrossRef]
- Guerra-Vázquez, C.M.; Martínez-Ávila, M.; Guajardo-Flores, D.; Antunes-Ricardo, M. Punicic Acid and Its Role in the Prevention of Neurological Disorders: A Review. Foods 2022, 11, 252. [Google Scholar] [CrossRef]
- Luckose, F.; Pandey, M.C.; Radhakrishna, K. Effects of amino acid derivativeson physical, mental, and physiological activities. Crit. Rev. Food Sci. Nutr. 2015, 55, 1793–1807. [Google Scholar] [CrossRef]
- Alagawany, M.; Elnesr, S.S.; Farag, M.R.; Tiwari, R.; Yatoo, M.I.; Karthik, K.; Michalak, I.; Dhama, K. Nutritional significance of amino acids, vitamins and minerals as nutraceuticals in poultry production and health–a comprehensive review. Vet. Q. 2021, 41, 1–29. [Google Scholar] [CrossRef]
- Rao, M.J.; Duan, M.; Wang, J.; Han, S.; Ma, L.; Mo, X.; Li, M.; Hu, L.; Wang, L. Transcriptomic and Widely Targeted Metabolomic Approach Identified Diverse Group of Bioactive Compounds, Antiradical Activities, and Their Associated Genes in Six Sugarcane Varieties. Antioxidants 2022, 11, 1319. [Google Scholar] [CrossRef]
- Šentjurc, M.; Nemec, M.; Connor, H.D.; Abram, V. Antioxidant Activity of Sempervivum tectorum and Its Components. J. Agric. Food Chem. 2003, 51, 2766–2771. [Google Scholar] [CrossRef]
- Zhang, D.; Nie, S.; Xie, M.; Hu, J. Antioxidant and antibacterial capabilities of phenolic compounds and organic acids from Camellia oleifera cake. Food Sci. Biotechnol. 2019, 29, 17–25. [Google Scholar] [CrossRef] [PubMed]
- GRAßMANN, J. Terpenoids as plant antioxidants. Vitam. Horm. 2005, 72, 505–535. [Google Scholar] [PubMed]
- Ren, Y.; Wang, C.; Xu, J.; Wang, S. Cafestol and kahweol: A review on their bioactivities and pharmacological properties. Int. J. Mol. Sci. 2019, 20, 4238. [Google Scholar] [CrossRef] [PubMed]
- Ding, T.; Song, G.; Liu, X.; Xu, M.; Li, Y. Nucleotides as optimal candidates for essential nutrients in living organisms: A review. J. Funct. Foods 2021, 82, 104498. [Google Scholar] [CrossRef]
- Wei, F.; Furihata, K.; Koda, M.; Hu, F.; Kato, R.; Miyakawa, T.; Tanokura, M. 13C NMR-based metabolomics for the classification of green coffee beans according to variety and origin. J. Agric. Food Chem. 2012, 60, 10118–10125. [Google Scholar] [CrossRef]


Disclaimer/Publisher’s Note: The statements, opinions and data contained in all publications are solely those of the individual author(s) and contributor(s) and not of MDPI and/or the editor(s). MDPI and/or the editor(s) disclaim responsibility for any injury to people or property resulting from any ideas, methods, instructions or products referred to in the content. |
© 2023 by the authors. Licensee MDPI, Basel, Switzerland. This article is an open access article distributed under the terms and conditions of the Creative Commons Attribution (CC BY) license (https://creativecommons.org/licenses/by/4.0/).