Abstract
The distribution of birds in the tropical mountains is important not only for testing fundamental scientific hypotheses, but also for bird conservation. In order to obtain knowledge on bird community structure within the tropical highland ecosystem, we used ground-to-canopy mist nets to assess bird species distribution along a vertical ground-to-canopy gradient for two elevational bands on Mount Cameroon. The study area included lowland forest (Drink Garri, 650 m a.s.l.) and montane forest (Mann’s Spring, 2200 m a.s.l.). We mist netted a total of 2658 individuals, including recaptures, belonging to 118 species from 50 genera. NLAG (net location above the ground), vegetation cover and locality significantly affected the bird communities. The composition of avian communities strongly differed between the two elevational bands. Species diversity considerably decreased with NLAG in both localities and increased with increased vegetation cover at the low elevation site. Species dietary guilds were significantly influenced by the seasonality, elevation, NLAG and vegetation cover. For most of the feeding guilds included in the study (frugivores, omnivores, insectivores, granivores and nectarivores), we found a negative correlation between the abundances and vegetation cover. Meanwhile, percentages of abundance of frugivores, nectarivores and omnivores showed a positive correlation with NLAG. We discuss the substantial changes in feeding guild structure along a vertical gradient and between two elevational bands. In conclusion, Mount Cameroon’s forest vegetation structure differs between two elevational bands and along vertical gradients from ground to canopy, considerably affecting the bird community structure.
1. Introduction
Wildlife populations play an important role in tropical forest ecosystem processes, such as in the alteration of the physical structure of the forest through seed dispersal, seed predation and bark removal from trees, thereby modifying forest structure and composition. The extirpation of wild animals from these ecosystems may cause a gradual yet detrimental loss of plant communities and biodiversity likely to negatively influence human livelihoods and survival [1]. Sustainable conservation of tropical forests is therefore challenging, as these natural habitats are undergoing the highest rate of land-use changes ever recorded, and has led to a worldwide expansion of degraded forests [1]. Consequently, understanding the influence of different successional stages of secondary forests and that of landscape matrix structure and composition on the occurrence and abundance patterns of bird communities may be of great interest for conservation purposes [2].
Furthermore, it has been observed that biodiversity in the tropics changes along altitudinal gradients [3,4]. Moreover, tropical forest ecosystems are composed of multiple complex vegetation layers that contain variable nutrient resources [5,6,7]. Therefore, variability among the vegetation layers at different elevations may explain the elevational distribution of forest species [8,9], and consequently determine bird community diversity [8,10]. Bird species clearly differ in their morphological adaptations to a particular strata [11]. Due to their increased number of vegetation strata, lowland forests are the most species-rich terrestrial ecosystems [12]. The most frequent results obtained by studies related to elevational gradients include the decrease in species richness with increasing elevation [13]. Therefore, highly diversified montane ecosystems are important biodiversity hotspots [3].
The structure of vegetation cover within forests represents an essential component determining bird community structure [14], especially due to the distribution of food resources [15]. The vertical stratification of bird communities has already been studied in both temperate and tropical forests [16,17,18,19,20,21,22,23,24]. Meanwhile, the structure of the vegetation changes considerably with elevation [25,26], due to changes in abiotic (temperature, wind; [27]) and biotic conditions (predator, foliage density, food resources, high parasitism rate; [28]). Many studies have been performed on bird community structure along elevational gradients [29,30], and on bird community interactions with vegetation structure in temperate forests [14,31]. However, these interactions are not well-known for tropical forests [8,32]. Furthermore, studies combining vegetation and bird community structure may facilitate our understanding of the effect of intra- and inter-specific interactions on the distribution of bird species [15]. To the best of our knowledge, there has not been such a comparison of vertical bird community structure among elevational bands.
Based on published results from various tropical areas, we suggest that bird diversity might decrease with increasing elevation and might follow the diversity pattern of vegetation structure. The design of our study was driven mainly by the changes in vegetation structure along the ground-to-canopy gradient and changes in the vegetation structure between lowland and montane forest. We aimed to evaluate (1) the changes in forest vegetation structure along the ground-to-canopy gradient (i.e., gradient of vegetation cover change) for each elevational belt (lowland/montane forest). Consequently, we assessed changes in bird diversity and bird community structure (2) along a vertical ground-to-canopy gradient and (3) between two distinct elevational bands (lowland forest and montane forest). More specifically, we compared (4) the bird community diversity and (5) structure of bird communities. Furthermore, we compared (6) the structure of feeding guild communities between two elevational belts and along the ground-to-canopy gradient.
2. Materials and Methods
2.1. Study Area
Our study was conducted on the southwestern slopes of Mount Cameroon National Park at two localities known as Mann’s Spring (4.139° N, 9.114° E, 2200 m a.s.l.) and Drink Garri (4.100° N, 9.063° E, 650 m a.s.l.). Mount Cameroon is the highest mountain in Central/West Africa (4040 m a.s.l.) and is a hotspot for biodiversity. The lowland forest extends from 0 to 800 m a.s.l., the submontane forest from 800 to 1600 m a.s.l. and the montane forest from 1600 to 2300 m a.s.l. The study area in the lowland forest (Drink Garri) is characterized by high plant diversity and high complexity of vertical forest structure. The most common trees are from the families Fabaceae (e.g., Anthonotha fragrans or Berlinia bracteosa), Annonaceae (Uvariopsis and Uvariodendron spp.), Apocynaceae (Tabernaemontana brachyantha) and Rubiaceae (Cuviera longiflora). The shrub layer is dominated by Cola cauliflora (Malvaceae) and Trichilia rubescens (Meliaceae). As a mountain forest, the Mann Spring locality hosts a much lower number of plant species. The vegetation is dominated by several tree species, including Ilex mitis (Aquifoliaceae), Schefflera abyssinica and S. mannii (Araliaceae), Prunus africana (Rosaceae) and Nuxia congesta (Stilbaceae). The most common shrub is Psychotria hypsophila (Rubiaceae).
The climate of Mount Cameroon is characterized by a wet season from June to October and a dry season lasting from November to May. The highest average annual rainfall is 10,000 mm located at Cape Debundscha, one of the rainiest places in the world. In contrast, the lowest annual rainfall (1800 mm) is reported at Ekona on the opposite flank of the mountain [33].
2.2. Bird Data Collection
We sampled birds at two elevations (Figure 1): Drink Garri from 8 to 31 August 2018 (wet season) and from 3 to 27 February 2019 (dry season); Mann’s Spring from 3 to 27 August 2019 (wet season) and from 2 to 26 February 2020 (dry season). For detailed distribution of mist-netting sites within each elevation belt, see Supplementary material, Figure S1. Ground-to-canopy mist nets were used to study the vertical stratification and the distribution of forest bird species along a vertical vegetation gradient on Mount Cameroon (for a description, see [24]).
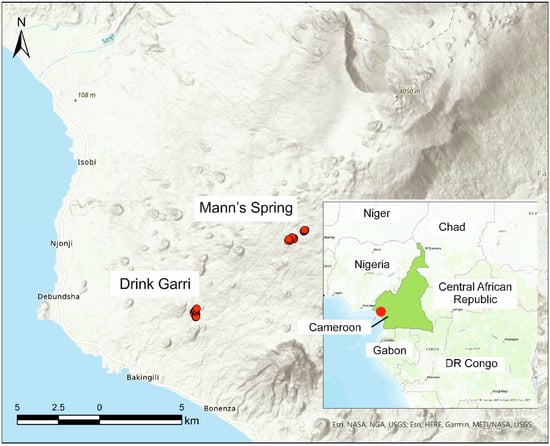
Figure 1.
Map of study area with position of catching sites at Drink Garri and Mann’s Spring within Mt. Cameroon. Map of position of study area within Cameroon is in the bottom right corner of the figure with demarcation of Mt. Cameroon. ESRI hillshade base map was used to create the figure.
At each locality, we established 17 mist-netting sites with known GPS coordinates where five to seven nets of 3 m height each were superimposed on each other, resulting in a continuous panel assembly of mist nets reaching a height of 15 or 21 m above ground. Thus, the 3-m net height categories within the mist-netting panels were as follows: 3, 6, 9, 12, 15, 18 and 21 m. Overhanging branches and shrubs (<10 cm in diameter) were cut to facilitate net installation and to prevent entanglement in the nets during bird catching. Unfortunately, it was impossible to have the same net panel height at all the sites because of limitations such as the presence of large branches in the canopy and the absence of tall trees.
We opened a set of five to six mist-net sites for three to four consecutive days of sampling before moving them to another set of sites. After a minimum of 7 days, mist netting was repeated at the same site in the order of the first round of sampling. The daily capture time was determined by weather conditions, and nets were opened from 6:00 a.m. to 6:00 p.m. In case of heavy rain and fog, the nets were closed. Before removing the birds from the nets, their position was recorded. They were then banded with SAFRING metal rings, allowing us to recognize recaptured birds. The net location above ground (hereafter NLAG; m) was also recorded.
The vertical forest profile was assessed through visual estimation of the vegetation cover using a horizontal 0.25 × 0.25 m grid. For each cell within this grid across the whole mist-netting panel, we defined the presence/absence of vegetation. On both sides of the 17 mist-netting sites, the covers of vegetation layers were estimated within a distance of 10 m. For each NLAG belt, we then calculated percentages for squares with presence of vegetation.
2.3. Statistical Analyses
The differences in bird community structures between the lowland (Drink Garri) and montane (Mann’s Spring) forest and the effects of NLAG and vegetation cover on bird community structure (i.e., primary predictors/independent variables) were analyzed using variance partitioning via principal coordinate analysis of neighbor matrices (PCNM) in Canoco 5 software [34], which was recommended by Marrot et al. [35]. This multivariate analysis enabled us to remove the effect of geographical position (i.e., space predictors) from the effect of primary predictors [36]. The analysis is suitable for calculating inter-correlated variables, since all these variables entered the analysis simultaneously. The analysis included nine steps: (1) primary predictor test (i.e., preliminary test of the over-all effect of primary predictors on the dataset), (2) primary predictor testing using partial redundancy analysis (RDA) based on partial Monte-Carlo permutation tests (n = 499 permutations), (3) principal coordinate analysis (PCoA) based on Euclidean distances (i.e., finding the main space predictors based on GPS coordinates), (4) PCNM for all predictors (i.e., preliminary test of the overall effect of space predictors on the dataset), (5) PCNM selection (i.e., the choice of space predictors based on coordinates using forward selection and partial Monte-Carlo permutation tests), (6) spatial effects analysis (i.e., assessing the amount of variability explained by space predictors), (7) primary predictor effects analysis (i.e., assessing the amount of variability explained by primary predictors), (8) joint effects analysis (i.e., assessing the amount of variability explained by both predictor types) and (9) removal of spatial effects [37]. We included the elevational belt (Drink Garri and Mann’s Spring), NLAG (ground-to-canopy category of height 3 m), season (dry/wet) and percentage of vegetation cover as independent variables in the PCNM analysis. Each mist-netting site was considered a data unit (n = 34). Percentage of vegetation cover refers to a proportion of vegetation defined vertically by the height and horizontally by the width of the net in all sampling sites over a 10 m distance on both sides of the mist net within each ground-to-canopy height category. Differences in chosen species abundances between elevational belts (Drink Garri and Mann’s Spring) from the PCNM graph that fitted the ordination axes by at least 87.9% were then computed using a Mann–Whitney U test. Relationships between chosen species abundances and NLAG and vegetation cover were computed using regressions. These analyes were performed using Statistica 13 software [38]. Similarly, we performed regressions to uncover the relationships between vegetation cover and NLAG for each elevational belt.
We evaluated the interactions between the NLAG location and vegetation cover location (independent variables) on bird diversity expressed by Shannon-Wiener diversity index (dependent variable) using generalized mixed effect models (GLMM) in the R 4.0.2 software [39] with the package lme4. Sampling effort was used as the variable with random effect. The effects of NLAG and vegetation cover in both Drink Garri and Mann’s Spring to bird diversity were calculated using regressions in Statistica 13 software.
Further, PCNM analysis was performed to assess the effect of vegetation cover, elevational belt (Drink Garri, Mann’s Spring), season (dry, wet) and NLAG (m) as independent variables on species dietary guilds, where percentages of abundance of individual feeding guilds represented response variables. Mist-net site was used as a covariate, and we used arcsine transformation for the percentage data. The following feeding guilds were included into the analysis: frugivores, insectivores, nectarivores, omnivores and granivores. Due to a very low sample size, carnivores were excluded from the analysis. The feeding guild classification was based on dietary literature reviewed at link https://birdsoftheworld.org/ (accessed on 15 April 2023) (Supplementary material, Table S1). Mann–Whitney U tests using Statistica 13 software were further used to compare the differences in guild abundances between localities and regressions were used to compare the effects of NLAG and vegetation cover on abundances of individuals within each respective feeding guild.
Finally, we performed multiple comparisons of beta diversity (i.e., similarity of bird community structure) using a Jaccard similarity index among mist-netting sites within each elevational belt.
3. Results
We mist netted a total of 2658 birds belonging to 118 species, 9 of which were common to both study sites. More species were mist netted at Drink Garri (n = 83) compared with Mann’s Spring (n = 43). A total of 50 genera were distributed equally between the two localities. Four European migratory species were captured: Willow Warbler (Phylloscopus trochilus), Garden Warbler (Sylvia borin), Tree Pipit (Anthus trivialis) and Eurasian Blackcap (Sylvia atricapilla).
The total number of species varied with the NLAG, being more plentiful near the ground and continually decreasing towards the canopy. Carnivores were rare and almost absent from the middle layer to the canopy. Insectivores, omnivores and granivores were numerous in the understory and their numbers decreased considerably with increasing height above the ground. In contrast, the numbers of frugivores somewhat increased with height above the ground (Figure 2). Additionally, the proportion of the vegetation cover within 10 m on either side of the mist nets was highest in the understory and gradually decreased towards the canopy (lowland forest, ß = −0.70, R2 = 0.48, F = 209.87, p < 0.001; montane forest, ß = −0.42, R2 = 0.17, F = 42.53, p < 0.001, Supplementary material, Figure S2). Using variance partitioning via PCNM analysis, we found that primary predictors explained 33.3% of the variance, space predictors explained 49.6% of variance and the shared fraction was 17.1% of the variance. Bird community structure was significantly affected by vegetation cover (%), NLAG (m) and locality (Drink Garri/Mann’s Spring, Table 1). Along the first ordination axis, we found a clear gradient between the lowland and montane forest. The second ordination axis represented another independent gradient. NLAG scores were positively correlated with the scores of the second ordination axis (correlation coefficient 0.64) and percentages of vegetation cover showed a negative correlation with the scores of the same axis (−0.57, Figure 2).
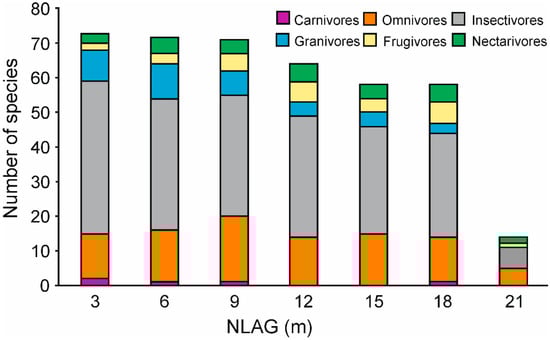
Figure 2.
The numbers of species per feeding guild along the NLAG categories.

Table 1.
The results of PCNM analysis on the effect of independent variables on bird community structure (percentages of abundance corrected for sampling effort). Ordination axes I and II explained 87.9% of variability. PCO—space predictor based on coordinates. The number of space predictors refers to the particular geographical gradient found by the analysis within the dataset. Statistically significant p-values are in bold.
Species such as the Collared Sunbird (Hedydipna collaris), Yellow-footed Honeyguide (Melignomon eisentrauti), African Green-pigeon (Treron calvus), Tambourine Dove (Turtur tympanistria), White-tailed Greenbul (Baeopogon clamans) and the Green Hylia (Hylia prasina) were mostly mist netted in the middle and upper canopy strata where the vegetation cover was less dense. However, increased percentages of Chubb’s Cisticolas (Cisticola chubbi), Black-billed Weavers (Ploceus melanogaster), Evergreen-forest Warblers (Bradypterus lopezi), Red-faced Crimsonwings (Cryptospiza reichenovii) and Mountain Robin-chats (Cossypha isabellae) were found in the understory where the percentage of the vegetation cover was very high.
The lowland forest was often occupied by species such as the Icterine Greenbul (Phyllastrephus icterinus), Yellow Longbill (Macrosphenus flavicans), Olive Sunbird (Cyanomitra olivacea) and the Olivaceous Flycatcher (Fraseria olivascens). Conversely, the African Thrush (Turdus pelios), Northern double-collared sunbird (Cinnyris reichenowi), Oriole Finch (Linurgus olivaceus) and Western Mountain Greenbuls (Arizelocichla tephrolaema) were often caught within the montane forest (Figure 3). Based on the PCNM graph, we prepared regressions (Supplementary material, Table S2). These analyses showed that percentages of abundance of Western Mountain Greenbuls, Yellow Longbills and Red-bellied Paradise-flycatchers (Terpsiphone rufiventer) significantly increased with NLAG. Percentages of abundance of Olive Sunbirds (Cyanomitra olivacea), Yellow-whiskered Greenbuls (Eurillas latirostris) and Green Longtails (Urolais epichlorus) were negatively correlated with the percentage of vegetation cover (Supplementary material, Figure S3).
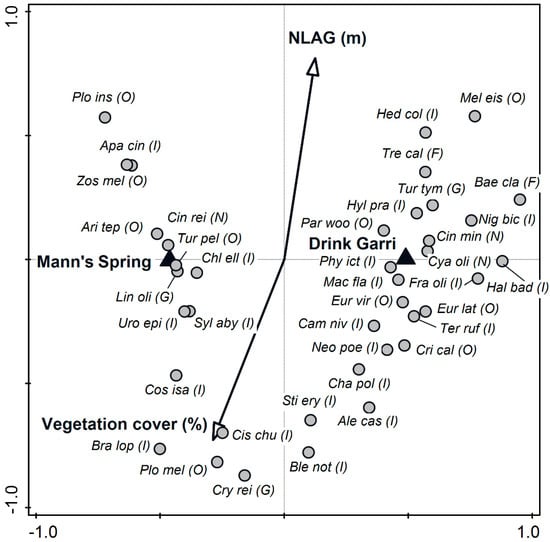
Figure 3.
Projection scores of bird species within an ordination space and the effect of NLAG, vegetation cover and locality (Drink Garri and Mann’s Spring) on Mount Cameroon National Park. PCNM analysis, ordination axes I and II explained 87.9% of variability. Species in the graph fitted the ordination axes by at least 1.7%. Species codes are expressed by six letter abbreviations of their scientific names. Circles (species), triangles (localities), arrows (NLAG, vegetation cover). Species codes: Plo ins—Ploceus insignis, Cri cal—Criniger calurus, Neo poe—Neocossyphus poensis, Cam niv—Campethera nivosa, Tur tym—Turtur tympanistria, Bae cla—Baeopogon clamans, Ter ruf—Terpsiphone rufiventer, Eur lat—Eurillas latirostris, Eur vir—Eurillas virens, Mac fla—Macrosphenus flavicans, Fra oli—Fraseria olivascens, Hal bad—Halcyon badia, Cya oli—Cyanomitra olivacea, Phy ict—Phyllastrephus icterinus, Cin min—Cinnyris minullus, Par woo—Parmoptila woodhousei, Nig bic—Nigrita bicolor, Hyl pra—Hylia prasina, Apa cin—Apalis cinerea, Zos mel—Zosterops melanocephalus, Cin rei—Cinnyris reichenowi, Mel eis—Melignomon eisentrauti, Hep col—Hedydipna collaris, Tre cal—Treron calvus, Ari tep—Arizelocichla tephrolaema, Tur pel—Turdus pelios, Chl ell—Chloropicus elliotii, Lin oli—Linurgus olivaceus, Uro epi—Urolais epichlorus, Syl aby—Sylvia abyssinica, Cos isa—Cossypha isabellae, Bra lop—Bradypterus lopezi, Plo mel—Ploceus melanogaster, Cis chu—Cisticola chubbi, Cry rei—Cryptospiza reichenovii, Ble not—Bleda notatus, Ale cas—Alethe castanea, Sti ery—Stiphrornis erythrothorax, Cha pol—Chamaetylas poliocephala.
The effects of interactions between NLAG and locality (GLMM analysis, d.f. = 6, 11.6% of explained variability, Chi = 80.1, p < 0.001) and vegetation cover and locality (GLMM analysis, d.f. = 6, 16.1% of explained variability, Chi = 11.4, p < 0.001) on bird diversity were highly significant. Species diversity significantly decreased with NLAG at both lowland and montane forest sites. The diversity also considerably increased with increasing vegetation cover in the lowland forest, but this relationship was not significant in the montane forest (Table 2, Figure 4).
Table 2.
The effect of NLAG and vegetation cover on bird community diversity at Drink Garri and Mann’s Spring using regressions. Statistically significant p-values are in bold.
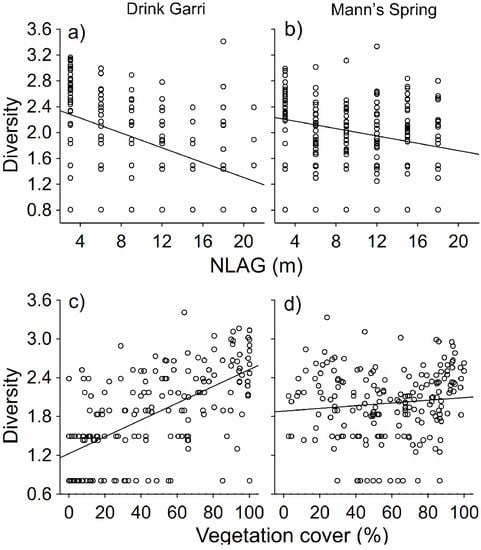
Figure 4.
Effect of NLAG (a,b) and vegetation cover (c,d) on bird community diversity at Drink Garri (a,c) and Mann’s Spring (b,d). Regressions (n = 34).
Using variance partitioning via PCNM analysis on feeding guilds, we found that primary predictors (i.e., independent variables) explained 42.2% of variability, space predictors explained 8.8% of variability and shared fraction represented 49% of variability. More specifically, NLAG (m), vegetation cover (%), season (dry/wet) and locality (lowland/montane forest) were significantly correlated with the structure of bird feeding guilds. NLAG scores were positively correlated with the scores of the first (0.67) and second (0.38) ordination axes, representing an independent gradient on dry/wet season and elevational belts. Percentages of vegetation cover were mainly negatively correlated with the second ordination axis (−0.52, Table 3, Figure 5).
Table 3.
Result of the PCNM analysis on the effect of the independent variables on percentages of bird feeding guilds. Ordination axes I and II explained 93.2% of variability. PCO—space predictor based on coordinates. The number of space predictors refers to the particular geographical gradient found by the analysis within the dataset. Statistically significant or marginally significant p-values are in bold.
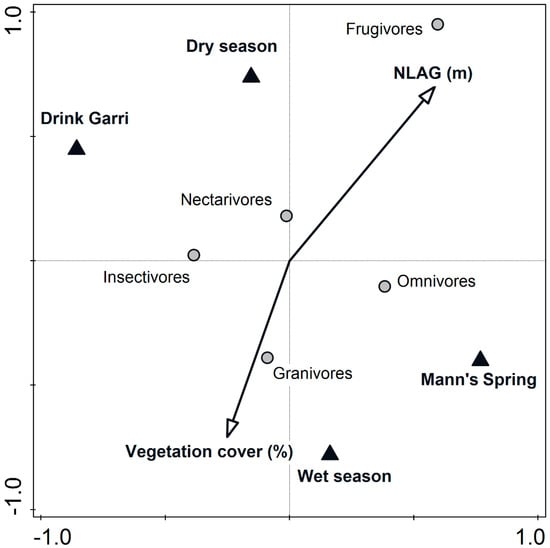
Figure 5.
Projection scores for the feeding guilds within an ordination space and the effect of NLAG (m), vegetation cover (%), season (dry and wet) and localities (Drink Garri and Mann’s Spring) on Mount Cameroon National Park. PCNM analysis, ordination axes I and II explained 93.2% of variability. Feeding guild codes are expressed by one-letter abbreviations of their full names.
The percentage of frugivorous individuals was positively correlated with NLAG, whereas granivorous individuals were more often caught at lower strata with dense vegetation. Higher percentages of omnivorous individuals were mostly found in the montane forest, unlike the percentages of insectivorous individuals, which were more often found in the lowland forest. The abundances of species within feeding guilds significantly differed between the localities (Supplementary Material, Table S3). Frugivores, granivores, insectivores and nectarivores showed higher abundances in the lowland forest, whereas omnivores were more abundant in the montane forest (Supplementary material, Figure S4). The results from the regressions revealed that NLAG and vegetation cover significantly affected species abundances within the feeding guilds (Supplementary Material, Table S4). For most of the feeding guilds (frugivores, omnivores, insectivores, granivores and nectarivores), we found a negative correlation between the abundances and vegetation cover. The most pronounced was this correlation for frugivores and nectarivores (Supplementary Material, Figure S5). Simultaneously, percentages of the abundances of frugivores, nectarivores and omnivores showed a positive correlation with NLAG (Supplementary Material, Figure S6). The similarity of bird community structure for both elevational bands decreased with NLAG. We also found that the similarity among strata in bird community structure was higher at Mann’s Spring (0.58 ± 0.08 [0.46–0.79]) compared with Drink Garri (0.34 ± 0.14 [0.12–0.57], Table 4).
Table 4.
Multiple comparisons of bird community structures for each pair of NLAG bands (3–21 m) at Drink Garri and Mann’s Spring using Jaccard similarity index. The higher values refer to higher similarity.
4. Discussion
Combined with abiotic factors, biotic factors such as predation, vegetation structure and food availability play a major role in the elevational distribution of bird species and the bird community structure [40,41,42,43]. We found that the bird community structure clearly differed between the two elevational belts (Drink Garri/Mann’s Spring); the similarity in bird community structure decreased with NLAG and was generally higher at the higher elevational belt. The differences observed in the bird community structure from one elevation to another can be attributed to several factors. The decrease in bird species with elevation can be due to homogeneity of vegetation cover at higher elevations, decrease in the abundance of food resources such as invertebrates or changes in the abiotic conditions of the environment such as precipitation, wind and temperature, which decreases with elevation on Mount Cameroon [44]. As a result, we recorded two completely different bird communities in the lowland and montane forest of Mount Cameroon. Insectivores represented a large proportion of the bird community at the lowland belt and omnivores were more abundant at the high elevation belt. This result agrees with Terborgh [40], who revealed that bird communities in low elevations are mainly dominated by insectivores.
Regarding the diversity at different elevations, Blake [45] documented that even though more individual birds were captured in the montane forest in Costa Rica, bird diversity was highest in the lowland forest. We assumed that the decrease in the number of species with elevation was due to the decrease in vegetation cover and other changes in environmental conditions (e.g., decrease in temperature or competition and availability of invertebrates). Similar results have been reported by several studies [46,47,48]. Nevertheless, lowland forests have been reported by Turner [12] to be the most species-rich terrestrial habitats.
We also found a clear negative correlation between NLAG and the percentages of vegetation cover on the structure of bird communities. With increasing NLAG (Supplementary material, Figure S3), we documented an increase in abundances for several species, including the Western Mountain greenbul, Yellow Longbill, Red-bellied paradise-flycatcher, Olive sunbird, Yellow-whiskered greenbul and the Green longtail. Meanwhile, we recorded a decrease in the number of species with increased NLAG. Such a vertical distribution of birds is typical for our study area and partially disagrees with the findings of other authors from other areas of the world. For example, Chmel et al. [23] found an opposite pattern of vertical vegetation distribution in the forest of Papua New Guinea that was consequently followed by a different bird community structure. Similar results were also obtained from other areas within the tropics [16,49]. This suggests that the vertical structure of the bird community is closely connected with the distribution of vegetation, not simply following the height above the ground.
The bird community diversity was affected by the interactions of locality (Drink Garri/Mann’s Spring) and gradient along NLAG/percentages of vegetation cover. We found that the species diversity significantly decreased with NLAG at Drink Garri and Mann’s Spring. This corroborates with the study of Chmel et al. [24], who revealed that bird diversity is increased in the undergrowth. Furthermore, species diversity significantly increased with increasing vegetation cover at Drink Garri. We assume that dense vegetation cover attracts more bird species because it provides them shelter against predators and/or increased food availability [9,50]. This agrees with the results of Chmel et al. [24], who documented that bird species diversity was positively correlated with vegetation cover. Additionally, other studies showed that tropical forests not undergoing disturbances have high tree density [46], and therefore have higher species diversity in the canopy [49]. The presence of elephants in the lowland and sub-montane forest is known on Mount Cameroon. Elephants significantly modify the structure of the vegetation [51,52] by increasing the heterogeneity and density of the vegetation undergrowth [53,54]. They have no access to the mountainous forest around Mann’s Spring, because of a vast layer of lava separating them [52]. We suggest that the absence of elephants at Mann’s Spring may explain the absence of the correlation between bird community diversity and vegetation cover. We also found that the relationship between NLAG and vegetation cover was steeper with the lowland forest than with the montane forest and might contribute to the absence of a relationship between NLAG and bird diversity there.
As we stated before, the overall number of species decreased with the height above ground. Insectivores, omnivores and granivores decreased in numbers towards the canopy. For the omnivores, the result disagreed with that of Bradfer-Lawrence et al. [55], who found that in the Neotropical Forest of Panama omnivores were the dominant species in the canopy. Meanwhile, insectivorous birds have always been reported to be most abundant in the undergrowth [23,24], which is also the result of our study.
We demonstrated that NLAG, vegetation cover, season and locality significantly affected the structure of bird feeding guilds. Frugivores tended to prefer canopy with decreased vegetation cover. In agreement, several other studies reported that frugivorous birds are dominant species in the canopies with increased availability of fruits [23,56,57,58]. Percentages of granivore species increased within the thick vegetation of the understory. The presence of granivores in the undergrowth can be explained by the increased availability of seeds within this layer. The seeds could come from higher trees, or simply from the large numbers of shrubs producing seeds in the understory. Insectivores were found to be more common at lower elevations (Drink Garri) and their numbers dropped considerably at Mann’s Spring. It is assumed that this is due to the lower abundance and diversity of insects at higher elevations. This corroborates with the study of Sam et al. [57], where the species richness of insectivores decreased with elevation. Janes [59] noted that the absence of large insectivores at higher elevations is linked to the low availability of large insects. Insectivorous birds only feed on insects proportional to their body weight [57]. Blake and Loiselle [45] further clarified this explanation by the fact that insectivores occurring at low elevations are generally army ant swarms’ consumer species, which are known to be very abundant at very low elevations (e.g., 500 m a.s.l.). Percentages of omnivorous species increased with elevation. An explanation may be due to the mix of seeds, fruits and invertebrates found in the surrounding vegetation within these elevations. This finding is supported by the results of Koen [60], who believes that most omnivores switch their diets to adapt to available resources.
5. Conclusions
We conclude that bird community diversity, community structure and structure of feeding guilds on Mount Cameroon are heavily affected by vegetation structure along a vertical forest profile. The vegetation structure on Mount Cameroon changes along the vertical forest profile in a different manner compared with studies from other tropical regions. Additionally, we found differences between the two vegetation bands. The bird community diversity in the montane forest was not correlated with vegetation cover and can be explained by the absence of small-scale disturbances there (i.e., absence of forest elephants). The bird community structure substantially differs between the lowland and the montane forest, which mainly followed known changes in biotic and abiotic drivers with elevation. The complexity of vegetation structure changes along the two gradients, which could be the main driver for extremely high bird community diversity on Mount Cameroon.
Supplementary Materials
The supporting information can be downloaded at: https://www.mdpi.com/article/10.3390/d15060727/s1. Figure S1. The distribution of mist netting sites within Driung Garri and Mann’s Spring. ESRI hillshade base map was used to create a figure; Figure S2. The relationship between vegetation cover and NLAG for (a) Drink Garri and (b) Mann’s Spring; Figure S3. Relationships between percentages of abundances and NLAG for (a) Arizelocichla tephrolaema, (b) Macrosphenus flavicans, (c) Terpsiphone rufiventer and vegetation cover: (d) Cyanomitra olivacea, (e) Eurillas latirostris and (f) Urolais epichlorus; Figure S4. Differences in percentages of abundances of species dietary guilds between Drink Garri and Mann’s Spring for (a) frugivores, (b) granivores, (c) insectivores, (d) nectarivores and (e) omnivores; Figure S5. Differences in percentages of abundances of species from feeding guilds with vegetation cover for (a) frugivores, (b) omnivores, (c) insectivores, (d) granivores and (e) nectarivores; Figure S6. Relationships between percentages of abundances and NLAG for (a) frugivores, (b) nectarivores and (c) omnivores; Table S1. Checklist of bird species with their feeding guilds (C—carnivores, I—insectivores, O—omnivores, G—granivores, F—frugivores and N—nectarivores); Table S2. Results of regressions on the effects of NLAG and vegetation cover on percentage of abundances of chosen bird species according to the PCNM analysis (n = 18); Table S3. Comparison of percentages of bird abundances within feeding guilds between Drink Garri and Mann’s Spring (n = 34). Mann-Whitney U tests; Table S4. Effect of environmental variables on percentage of individuals within each feeding guilds. Regressions (n = 34).
Author Contributions
Conceptualization, Š.J.; methodology, K.C.; data curation K.C., J.M., Š.J., L.L.M., G.U.-G., F.L.E., S.M.K., T.A.II; writing—original draft preparation, J.R., S.M.K.; writing—review and editing, all co-authors; supervision, J.R. and S.A.T. All authors have read and agreed to the published version of the manuscript.
Funding
This research was supported by the Czech Science Foundation (18-10781S).
Institutional Review Board Statement
The study was approved by the Ministry of Forestry and Wildlife of the Republic of Cameroon. Permits Nos. 1075PRS/MINFOF/SETAT/SG/DFAP/SDVAF/SC/BJ and 310PRBS/MINFOF/SETAT/SG/DFAP/SDVEF/SC/BJ.
Data Availability Statement
Data will be available on request.
Acknowledgments
We would like to express our warmest gratitude to the local members of the field team, who contributed so much to the success of the field season. Additionally, we are very thankful to the management of Mount Cameroon National Park for the kind support and to the Ministry of Forestry and Wildlife of the Republic of Cameroon for providing the research permits.
Conflicts of Interest
The authors declare no conflict of interest.
References
- Tamungang, S.A.; Cheke, R.A.; Mofor, G.Z.; Tamungang, R.N.; Oben, F.R. Conservation Concern for the Deteriorating Geographical Range of the Grey Parrot in Cameroon. Int. J. Ecol. 2014, 15, 753294. [Google Scholar] [CrossRef]
- Tamungang, S.A.; Onabid, M.A.; Awa, T.; Balinga, V.S. Habitat preferences of the grey parrot in heterogeneous vegetation landscapes and their conservation implications. Int. J. Biodivers. 2016, 2016, 7287563. [Google Scholar] [CrossRef]
- Myers, N.; Mittermeier, R.A.; Mittermeier, C.G.; da Fonseca, G.A.B.; Kent, J. Biodiversity hotspots for conservation priorities. Nature 2000, 403, 853–858. [Google Scholar] [CrossRef] [PubMed]
- Quintero, I.; Jetz, W. Global elevational diversity and diversification of birds. Nature 2018, 555, 246–250. [Google Scholar] [CrossRef]
- Castley, J.G.; Kerley, G.I.H. The paradox of forest conservation in South Africa. For. Ecol. Manag. 1996, 85, 35–46. [Google Scholar] [CrossRef]
- Hemp, A. Continuum or zonation? Altitudinal gradients in the forest vegetation of Mt. Kilimanjaro. Plant Ecol. 2005, 184, 27–42. [Google Scholar] [CrossRef]
- Mucina, L.; Geldenhuys, C.J. Afrotemperate, subtropical and azonal forests. In The Vegetation of South Africa, Lesotho and Swaziland; Strelitzia 19; Mucina, L., Rutherford, M.C., Eds.; South African National Biodiversity Institute: Pretoria, South Africa, 2006; pp. 585–614. [Google Scholar]
- MacArthur, R.H.; MacArthur, J.W. On bird species diversity. Ecology 1961, 42, 594–598. [Google Scholar] [CrossRef]
- Acharya, B.K.; Vijayan, L. Vertical stratification of birds in different vegetation types along an elevation gradient in the Eastern Himalaya, India. Ornithol. Sci. 2017, 16, 131–140. [Google Scholar] [CrossRef]
- Diaz, I.A.; Armesto, J.J.; Reid, S.; Sieving, K.E.; Willson, M.F. Linking forest structure and composition: Avian diversity in successional forests of Chiloé Island, Chile. Biol. Conserv. 2005, 123, 91–101. [Google Scholar] [CrossRef]
- Winkler, H.; Preleuthner, M. Behaviour and ecology of birds in tropical rain forest canopies. Plant Ecol. 2001, 153, 193–202. [Google Scholar] [CrossRef]
- Turner, I.M. Species loss in fragments of tropical rain forest: A review of the evidence. J. Appl. Ecol. 1996, 33, 200–209. [Google Scholar] [CrossRef]
- Rahbek, C. The role of spatial scale and the perception of large-scale species-richness patterns. Ecol. Lett. 2005, 8, 224–239. [Google Scholar] [CrossRef]
- Lee, P.Y.; Rotenberry, J.T. Relationships between bird species and tree species assemblages in forested habitats of eastern North America. J. Biogeogr. 2005, 32, 1139–1150. [Google Scholar] [CrossRef]
- Wiens, J.A. Spatial scaling in ecology. Funct. Ecol. 1989, 3, 385–397. [Google Scholar] [CrossRef]
- Pearson, D.L. Vertical stratification of birds in a tropical dry forest. Condor 1971, 73, 46–55. [Google Scholar] [CrossRef]
- Anderson, S.H.; Shugart, H.H.; Smith, T.M. Vertical and Temporal Habitat Utilization within a Breeding Bird Community; Academic Press: New York, NY, USA, 1979; pp. 203–216. [Google Scholar]
- Terborgh, J. Vertical stratification of a Neotropical Forest bird community. In Proceedings of the Acta XVII Congressus Internationalis Ornithologici, Berlin, Germany, 5–11 June 1978; Nöhring, R., Ed.; Deutsche Ornithologen-Gesellschaft: Berlin, Germany, 1980; pp. 1005–1012. [Google Scholar]
- Greenberg, R. The abundance and seasonality of forest canopy birds on Barro Colorado Island, Panama. Biotropica 1981, 13, 241–251. [Google Scholar] [CrossRef]
- Cody, M.L. Habitat Selection in Birds; Academic Press: Cambridge, MA, USA, 1985. [Google Scholar]
- Haffer, J. Vögel Amazoniens: Ökologie, Brutbiologie und Artenreichtum. J. Ornithol. 1988, 129, 1–53. [Google Scholar] [CrossRef]
- Marra, P.P.; Remsen, J.V. Insights into the maintenance of high species diversity in the Neotropics: Habitat selection and foraging behavior in understory birds of tropical and temperate forests. Ornithol. Monogr. 1997, 48, 445–483. [Google Scholar] [CrossRef]
- Chmel, K.; Riegert, J.; Paul, L.; Novotný, V. Vertical stratification of an avian community in New Guinean tropical rainforest. Popul. Ecol. 2016, 58, 535–547. [Google Scholar] [CrossRef]
- Chmel, K.; Kamga, S.M.; Awa, T.; Ewome, F.L.; Uceda-Gómez, G.; Hořák, D.; Janeček, Š. Vertical stratification and seasonal changes of the avian community in Mount Cameroon lowland rainforest. Afr. J. Ecol. 2021, 59, 655–666. [Google Scholar] [CrossRef]
- Grubb, P.J.; Lloyd, J.R.; Pennington, T.D.; Whitmore, T.C. A comparison of montane and lowland rain forest in Ecuador I. The forest structure, physiognomy, and floristics. J. Ecol. 1963, 55, 567–601. [Google Scholar] [CrossRef]
- Jankowski, J.E.; Merkord, C.L.; Rios, W.F.; Cabrera, K.G.; Revilla, N.S.; Silman, M.R. The relationship of tropical bird communities to tree species composition and vegetation structure along an Andean elevational gradient. J. Biogeogr. 2013, 40, 950–962. [Google Scholar] [CrossRef]
- Richards, P.W. The Tropical Rain Forest: An Ecological Study; Cambridge University Press: Cambridge, UK, 1996. [Google Scholar]
- Walther, B.A.; Clayton, D.H.; Gregory, R.D. Showiness of Neotropical birds in relation to ectoparasite abundance and foraging stratum. Oikos 1999, 87, 157–165. [Google Scholar] [CrossRef]
- Patterson, B.D.; Stotz, D.F.; Solari, S.; Fitzpatrick, J.W.; Pacheco, V. Contrasting patterns of elevational zonation for birds and mammals in the Andes of southeastern Peru. J. Biogeogr. 1998, 25, 593–607. [Google Scholar] [CrossRef]
- Jankowski, J.E.; Ciecka, A.L.; Meyer, N.Y.; Rabenold, K.N. Beta diversity along environmental gradients: Implications of habitat specialization in tropical montane landscapes. J. Anim. Ecol. 2009, 78, 315–327. [Google Scholar] [CrossRef] [PubMed]
- Fleishmann, E.; Mac Nally, R. Patterns of spatial autocorrelation of assemblages of birds, floristics, physiognomy, and primary productivity in the central Great Basin, USA. Divers. Distrib. 2006, 12, 236–243. [Google Scholar] [CrossRef]
- Jayapal, R.; Qureshi, Q.; Chellam, R. Importance of forest structure versus floristics to composition of avian assemblages in tropical deciduous forests of Central Highlands, India. For. Ecol. Manag. 2009, 257, 2287–2295. [Google Scholar] [CrossRef]
- Leuschner, C. Are high elevations in tropical mountains arid environments for plants? Ecology 2000, 81, 1425–1436. [Google Scholar] [CrossRef]
- Ter Braak, C.J.; Smilauer, P. Canoco Reference Manual and User’s Guide: Software for Ordination, Version 5.0; Microcomputer Power: Ithaca, Greece, 2012. [Google Scholar]
- Marrot, P.; Garant, D.; Charmantier, A. Spatial autocorrelation in fitness affects the estimation of natural selection in the wild. Methods Ecol. Evol. 2015, 6, 1474–1483. [Google Scholar] [CrossRef]
- Legendre, P.; Legendre, L. Numerical Ecology, 3rd ed.; Elsevier: Amsterdam, The Netherlands, 2012. [Google Scholar]
- Šmilauer, P.; Lepš, J. Multivariate Analysis of Ecological Data Using CANOCO 5; Cambridge University Press: Cambridge, UK, 2014. [Google Scholar]
- TIBCO Software Inc. Statistica (Data Analysis Software System), Version 13. 2017. Available online: http://statistica.io (accessed on 1 January 2023).
- R Core Team. R: A Language and Environment for Statistical Computing; R Foundation for Statistical Computing: Vienna, Austria, 2020; Available online: https://www.R-project.org/ (accessed on 1 January 2023).
- Terborgh, J. Distribution on environmental gradients: Theory and a preliminary interpretation of distributional patterns in the avifauna of the Cordillera Vilcabamba, Peru. Ecology 1971, 52, 23–40. [Google Scholar] [CrossRef]
- Loiselle, B.A.; Blake, J.G. Temporal variation in birds and fruits along an elevational gradient in Costa Rica. Ecology 1991, 72, 180–193. [Google Scholar] [CrossRef]
- McCain, C.M.; Colwell, R.K. Assessing the threat to montane biodiversity from discordant shifts in temperature and precipitation in a changing climate. Ecol. Lett. 2011, 14, 1236–1245. [Google Scholar] [CrossRef] [PubMed]
- Jankowski, J.E.; Londono, G.A.; Robinson, S.K.; Chappell, M.A. Exploring the role of physiology and biotic interactions in determining elevational ranges of tropical animals. Ecography 2012, 36, 1–12. [Google Scholar] [CrossRef]
- MINFOF. The Management Plan of the Mount Cameroon National Park and Its Peripheral Zone; Action Plan; MINFOF: Bertoua, Cameroun, 2014. [Google Scholar]
- Blake, J.G.; Loiselle, B.A. Diversity of birds along an elevational gradient in the Cordillera Central, Costa Rica. Auk 2000, 117, 663–686. [Google Scholar] [CrossRef]
- Terborgh, J.; Davenport, L.C.; Niangadouma, R.; Dimoto, E.; Mouandza, J.C.; Schultz, O.; Jaen, M.R. The African rainforest: Odd man out or megafaunal landscape? African and Amazonian forests compared. Ecography 2016, 39, 187–193. [Google Scholar] [CrossRef]
- Herzog, S.K.; Kessler, M.; Bach, K. The elevational gradient in Andean bird species richness at the local scale: A foothill peak and a high-elevation plateau. Ecography 2005, 28, 209–222. [Google Scholar] [CrossRef]
- Quitián, M.; Santillán, V.; Espinosa, C.I.; Homeier, J.; Böhning-Gaese, K.; Schleuning, M.; Neuschulz, E.L. Elevation-dependent effects of forest fragmentation on plant–bird interaction networks in the tropical Andes. Ecography 2018, 41, 1497–1506. [Google Scholar] [CrossRef]
- Bell, H.L. A bird community of lowland rainforest in New Guinea. I. Composition and density of the avifauna. Emu 1982, 82, 24–41. [Google Scholar] [CrossRef]
- Deshwal, A.; Stephenson, S.L.; Panwar, P.; DeGregorio, B.A.; Kannan, R.; Willson, J.D. Foraging habitat selection of shrubland bird community in tropical dry forest. Ecol. Evol. 2022, 12, e9192. [Google Scholar] [CrossRef]
- Amahowé, I.O.; Djossa, A.B.; Adomou, A.C.; Kabré, A.T.; Sinsin, B. Vegetation structure and tree diversity in habitats exploited by elephants in Benin (West Africa). J. Appl. Biosci. 2012, 58, 4223–4233. [Google Scholar]
- Maicher, V.; Delabye, S.; Murkwe, M.; Doležal, J.; Altman, J.; Kobe, I.N.; Desmist, J.; Fokam, E.B.; Pyrcz, T.; Tropek, R. Effects of disturbances by forest elephants on diversity of trees and insects in tropical rainforests on Mount Cameroon. Sci. Rep. 2020, 10, 21618. [Google Scholar] [CrossRef] [PubMed]
- Carroll, R.W. Relative density, range extension, and conservation potential of the lowland gorilla (Gorilla gorilla gorilla) in the Dzanga-Sangha region of southwestern Central African Republic. Mammalia 1988, 52, 309–324. [Google Scholar] [CrossRef]
- Kamga, S.M.; Tamungang, S.A.; Awa, T.; Ewome, F.L.; Motombi, F.N.; Hořák, D.; Riegert, J. The Importance of Forest Elephants for Vegetation Structure Modification and Its Influence on the Bird Community of a Mid-Elevation Forest on Mount Cameroon, West-Central Africa. Diversity 2022, 14, 227. [Google Scholar] [CrossRef]
- Bradfer-Lawrence, T.; Gardner, N.; Dent, D.H. Canopy bird assemblages are less influenced by habitat age and isolation than understory bird assemblages in Neotropical secondary forest. Ecol. Evol. 2018, 8, 5586–5597. [Google Scholar] [CrossRef] [PubMed]
- Dinanti, R.V.; Winarni, N.L.; Supriatna, J. Vertical stratification of bird community in Cikepuh wildlife reserve, West Java, Indonesia. Biodiversitas 2018, 19, 134–139. [Google Scholar] [CrossRef]
- Sam, K.; Koane, B.; Jeppy, S.; Sykorova, J.; Novotny, V. Diet of land birds along an elevational gradient in Papua New Guinea. Sci. Rep. 2017, 7, 44018. [Google Scholar] [CrossRef]
- Schleuning, M.; Blüthgen, N.; Flörchinger, M.; Braun, J.; Schaefer, H.M.; Böhning-Gaese, K. Specialization and interaction strength in a tropical plant–frugivore network differ among forest strata. Ecology 2011, 92, 26–36. [Google Scholar] [CrossRef]
- Janes, S.W. Variation in the species composition and mean body size of an avian foliage gleaning guild along an elevational gradient: Correlation with arthropod body size. Oecologia 1994, 98, 369–378. [Google Scholar] [CrossRef]
- Koen, J.H. Medium-term fluctuations of birds and their potential food resources in the Knysna Forest. Ostrich 1992, 63, 21–30. [Google Scholar] [CrossRef]


Disclaimer/Publisher’s Note: The statements, opinions and data contained in all publications are solely those of the individual author(s) and contributor(s) and not of MDPI and/or the editor(s). MDPI and/or the editor(s) disclaim responsibility for any injury to people or property resulting from any ideas, methods, instructions or products referred to in the content. |
© 2023 by the authors. Licensee MDPI, Basel, Switzerland. This article is an open access article distributed under the terms and conditions of the Creative Commons Attribution (CC BY) license (https://creativecommons.org/licenses/by/4.0/).