Article

Impact of Dams on Stream Fish Diversity: A Different Result

1
U.S. Army Engineer Research and Development Center, 3909 Halls Ferry Rd., Vicksburg, MS 39180, USA
2
Mississippi Cooperative Fish and Wildlife Research Unit, U.S. Geological Survey, Starkville, MS 39762, USA
3
Water Quality and Ecology Research Unit, National Sedimentation Laboratory, Agricultural Research Service, U.S. Department of Agriculture, Oxford, MS 38655, USA
4
Biological Sciences, Arkansas State University, Jonesboro, AR 72467, USA
*
Authors to whom correspondence should be addressed.
Diversity 2023, 15(6), 728; https://doi.org/10.3390/d15060728
Submission received: 28 April 2023 / Revised: 24 May 2023 / Accepted: 29 May 2023 / Published: 1 June 2023
(This article belongs to the Section Freshwater Biodiversity)

Abstract

:
Impoundments can drastically change the physical and biological characteristics of fluvial systems. Changes in the physical characteristics, such as reductions in flow, increased sediment deposition, and increased surface area, often influence the system’s biological components, including plant, macroinvertebrate, and fish assemblages. In addition to having direct effects on impounded waterbodies, impoundments can also have wide-ranging effects at the watershed scale, particularly on upstream tributary streams. The purpose of this study was to assess the magnitude of these effects. We analyzed historical data from 26 streams distributed across five sub-basins in the Bluff Hills region of the Yazoo Basin, MS, USA. All five major tributary rivers in this region are impounded by large (11,240–26,143 hectares) reservoirs for flood control. We compared fish assemblages in streams located upstream and downstream of the four reservoirs using PERMANOVA, and contrary to expectations, we found no significant differences between the upstream and downstream assemblages. We explore several possible explanations for this discrepancy and suggest that stream assemblage response to impoundment may be nuanced by the regional species pool, the history of stream conditions in the watershed, and the resistance of the streams to periodic disturbances.

1. Introduction

Because of its unique biogeographic history, the southeastern United States is an epicenter of fish biodiversity in North America [1,2]. Yet, many streams in the region have experienced significant habitat degradation due to anthropogenic watershed alterations, including deforestation, channelization, and dam construction [3,4]. Dams are commonly used to control the flow regimes of rivers, relying on both small impoundments and large flood control reservoirs to mitigate flooding caused by the extensive precipitation from the southeastern United States receives annually. Over 17,000 dams and reservoirs have been constructed in the Tennessee, Lower Mississippi, and South Atlantic Gulf River basins [5,6]. Reservoirs may influence stream fish assemblages through changes in habitat, hydrology, and isolation effects, although disentangling reservoir effects from other factors that influence patterns in fish assemblage structure remains a challenge.
Reservoirs change stream conditions throughout impounded watersheds. Immediately upstream of the impoundment, the rivers and tributaries gain lentic properties: flow is reduced or eliminated, width and depth increase, and suspended sediment settles out of the water column. Stream habitat in the lower reaches of the tributary streams can be converted to wetland habitat as fine sediment aggrades and riparian vegetation spreads into the channel, leading to high production of zooplankton and phytoplankton. Downstream of the impoundment, the sequence of flooding events often becomes decoupled from the natural flow regime due to reservoir releases that, depending on how water storage and the outlet are engineered and managed, may alter temporal flows and physicochemical properties of the water such as turbidity, temperature, and dissolved oxygen levels [7]. Because the outlet of the dam is constrained within a defined bed, the river downstream of the reservoir is often channelized. The decrease in riverbed elevation caused by channelization can cause headcuts (i.e., downcutting of the stream bed in an upstream direction) that degrade tributaries [8,9,10]. As streams become incised, instream habitat progressively changes due to cycles of scouring and aggradation [9,11,12]. As the stream banks become steeper, connection to the floodplain and associated wetlands is reduced, which can also have implications for the biotic community [13]. All these physical changes can drastically change the type, amount, and quality of aquatic habitat available and fish assemblage diversity and composition.
In addition to changes in habitat, reservoirs can play a direct role in altering fish assemblages by influencing the connectivity between populations. Winston et al. [14] reported four native fluvial specialist cyprinids absent upstream of a dam on the Red River in Oklahoma despite their presence elsewhere in the drainage. They conjectured that as the intermittent streams above the dam desiccated during dry seasons, the cyprinid species migrated into the reservoir, where they became naïve prey to piscivores, which are often abundant in reservoirs. The loss of longitudinal connectivity caused by the dam prohibited recolonization by downstream populations. Species with drifting larvae may also be adversely affected by fragmented habitat, as some may require large reaches of free-flowing river habitat and be unable to persist when their larvae or eggs drift into a reservoir and are preyed on or settle on the substrate prematurely. This shift in fish assemblage has been supported by multiple studies that have reported extirpations, higher representation of generalists, and shifts in fish assemblages upstream of reservoirs [15,16,17,18,19,20,21]. Isolation effects and community shifts have also been documented for other aquatic species, including crayfish [22].
We investigated the degree to which fish assemblages in the Yazoo Basin, a major tributary to the Mississippi River, had been impacted by large flood control reservoirs. We expected that the reservoirs would have diminished fish diversity and altered assemblages by reducing network connectivity and changing habitat quality above and below the reservoirs. Specifically, we expected that fish assemblages in tributaries upstream of a reservoir would include a greater representation of tolerant lentic generalists, especially piscivorous species common in reservoirs in southeastern North America, while the assemblages in tributaries downstream from the influence of the tailrace of the dam would retain a fluvial assemblage complete with a greater emphasis on intolerant stream specialists. Moreover, we expected species diversity to be lower above the reservoirs as occasional droughts, siltation, or changes in other environmental conditions following over half a century of impoundment may have produced localized extirpations due to the lack of recolonization from downstream reaches blocked by dams.

2. Materials and Methods
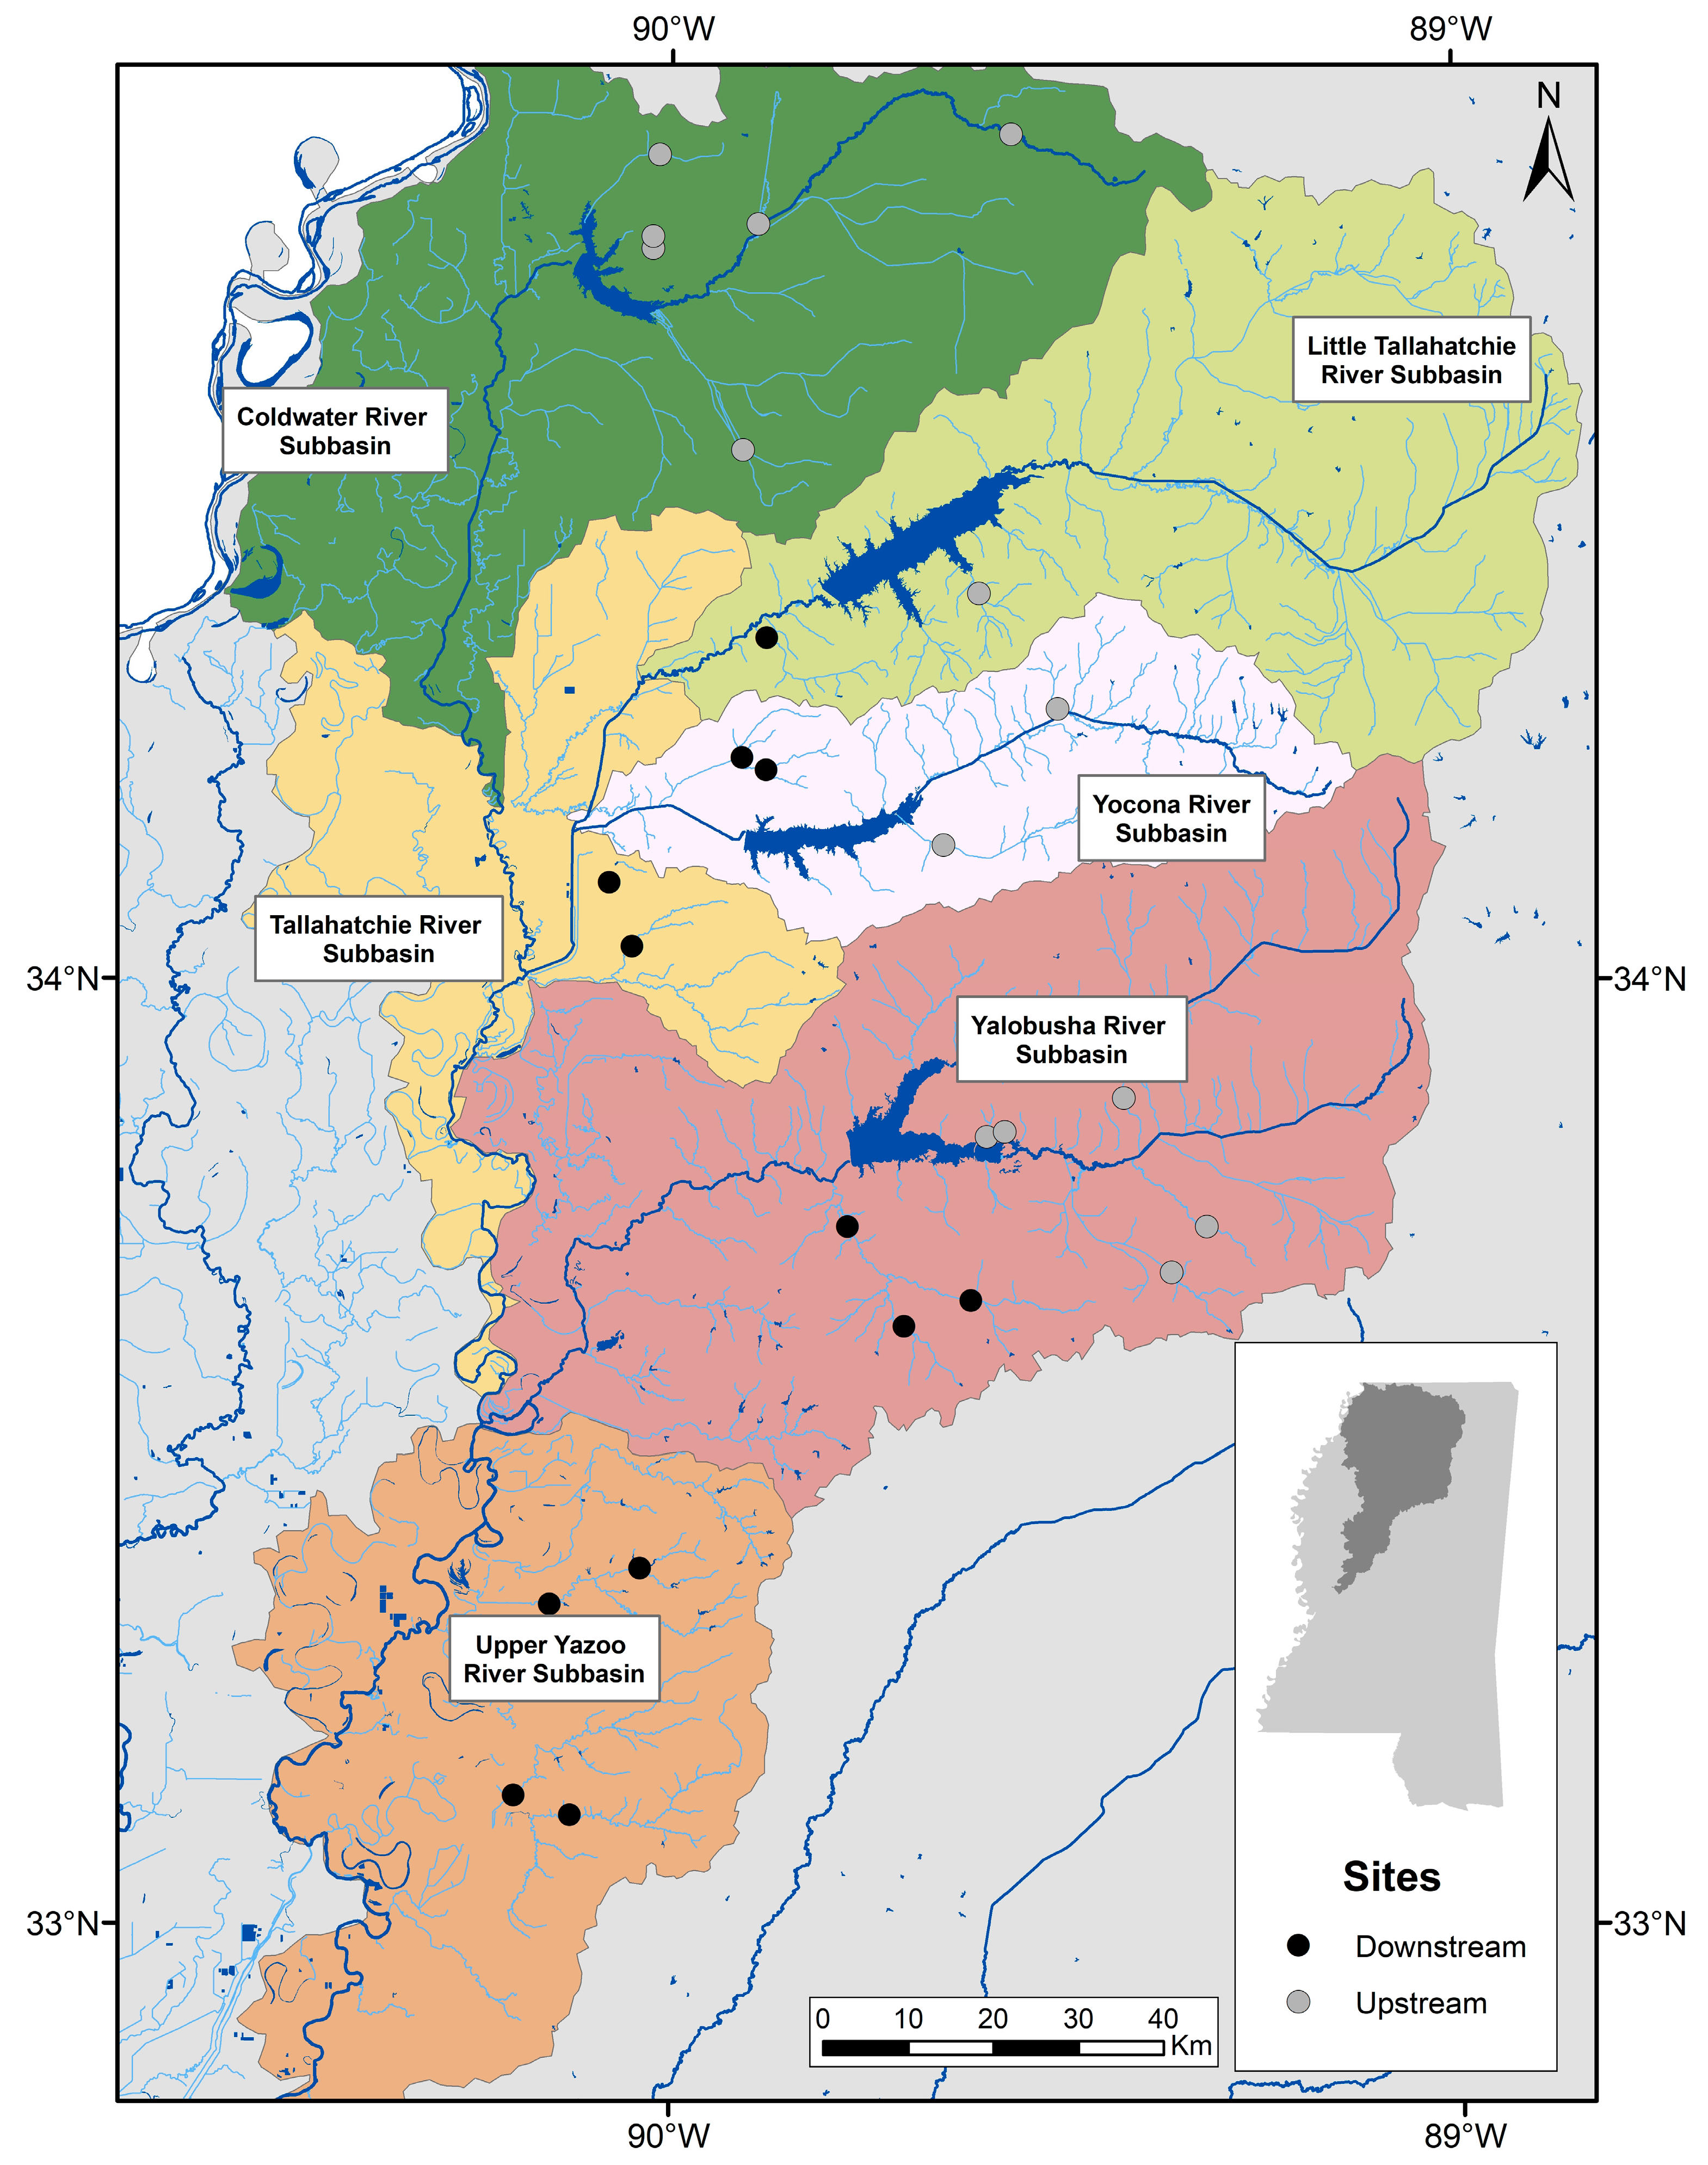
2.1. Study Area

The study was conducted in streams in the Bluff Hill region of the eastern Yazoo Basin in north Mississippi, USA (Figure 1). This region consists of six subbasins that discharge into the Yazoo River. Five of the rivers in these six subbasins (the Coldwater, Little Tallahatchie, Yocona, Skuna, and Yalobusha) are impounded by four flood-control reservoirs (the Arkabutla, Sardis, Enid, and Grenada reservoirs) built between 1938 and 1956 and ranging in size from 4800 to 14,500 ha. These reservoirs are not equipped with fish passage facilities. The annual discharge of the five rivers upstream of the impoundments ranges from 17 to 51 m3s−1 [23]. Streams in the region have a long history of erosion and sedimentation due to the highly erodible loess soils and the conversion of the native hickory-oak forests into agricultural lands in the mid to late 1800s [24,25]. Federal programs were introduced in the 1940s to reduce overland erosion and have been largely successful, and other programs were initiated in the 1980s to reduce instream erosion [26,27]. The regional species pool in the study streams includes over 50 fish species, including two endemics, the Yazoo Shiner Notropis rafinesquei and the Yazoo Darter Etheostoma raneyi [28,29]. Commercial fishing in the Yazoo Basin only occurs downstream of the study area, and to our knowledge, the four reservoirs are not enrolled in a fish stocking program.

2.2. Site Selection

We included sites upstream and downstream of the study reservoirs in most subbasins (Figure 1). To bolster the representation of the downstream fish assemblages, we also included sites from two neighboring unimpounded subbasins, the Tallahatchie River and Upper Yazoo River, that contain tributary streams that flow directly into the Yazoo River downstream of the four reservoirs. Sampling sites were further selected such that (1) no two sites were on the same stream, (2) if grade control structures installed to minimize instream incision [10] were present, sampling sites were established at least 2.5 km downstream of the structures, and (3) sites were located at least 50 m upstream of a road crossing to avoid potential confounding effects associated with road construction. In all, 26 sites were included. Fourteen of the sites were located on tributary streams 1–81 km upstream of the four reservoirs. Twelve sites were located on streams that joined the mainstem rivers at least 3 km downstream of the reservoir tailwaters and positioned 2–31 km above the confluence of the tributary and the river discharging from the reservoir.
No site descriptions were available with this archival dataset. However, in a recent study conducted in the same streams, although not at the same sites, Faucheux [30] reported that streams average 8.3 m in wetted width and 0.7 m in maximum water depth. The substrates are approximately 60% sand and clay, 10% hard clay, 10% silt, and 20% gravel, cobble, and riprap. There were no obvious differences in sites upstream or downstream of the reservoirs. Moreover, for each sampling site in this study, we estimated the catchment area using the StreamStats program [31]. Catchment area indexes stream size and discharge as precipitation quantities are consistent across the region, and for the study sites, catchment area averaged 111.4 sqkm (1.9–556.8 sqkm).

2.3. Fish Sampling

Fish collections consisted of a 200-m backpack electrofishing pass, with a target electrofishing time of 20 min (mean = 23 min, SD = 14 min). Sampling during June—September 1999 and 2000 (i.e., two sampling seasons) coincided with baseflow conditions. At each site, specific conductance was measured before sampling, and the voltage on the backpack unit was adjusted to maintain a relatively constant power. Sampling was conducted in a zig-zag pattern in an upstream direction and covered all types of habitats present. Two netters accompanied the backpack electrofisher to retrieve fish affected by the electric field. After a sample was completed, fish larger than 10 cm in total length were identified by species and returned to the stream. Smaller fish were anesthetized in a solution of MS-222, preserved in 10% buffered formalin, and transported to a lab for identification.
Backpack electrofishing is one of the most commonly used methods for characterizing fish assemblages in streams, although it can be biased by differences in detection probabilities across sites and species [32,33]. Even though capture efficiency tends to increase with fish size, which can result in under-sampling smaller-bodied species [32,34,35], electrofishing typically captures more species compared to other single-gear stream sampling methods [36]. Backpack electrofishing is particularly effective for collecting centrarchid species that seek cover in large woody debris [33]. However, benthic fish (e.g., darters, Ethesosthoma spp.) have lower capture efficiency due to their small size and lack of a gaseous swim bladder that prevents them from surfacing when stunned. Conversely, minnows (Cyprinidae) may be under-sampled due to the difficulty of thoroughly netting large schools and the reduced effectiveness of electrical fields on small-bodied fish [34,37]. These difficulties can bias fish collections by preferentially selecting larger species. It is likely that collection biases affected our characterization of the diversity and composition of fish assemblages, but it is less likely that they affected our upstream versus downstream comparisons because sampling was standardized among all sites.

2.4. Analysis

The analysis was designed to assess the potential effects of the reservoirs on stream fish assemblages while accounting for differences in river subbasin and stream size. Fish data were standardized as catch per unit of effort (CPE), defined as the number of individuals of a given taxon collected divided by the time needed to complete sampling of the stream reach. We applied a multivariate analysis of covariance to test if species CPEs (multiple continuous variables) differed between tributaries upstream and downstream of the reservoirs (categorical variable), while controlling for subbasin (random categorical variable to control for potential differences in species pool across the region) and catchment size (continuous variable to account for differences in stream size). Subbasins in the region could potentially support different fish in each subbasin assemblage, and catchment size influences discharge and stream volume, as well as a multitude of other accompanying physical stream characteristics that shape fish assemblages at any particular site [38,39]. The catchment size for each site was obtained using the StreamStats program [31] and log10-transformed to linearize catchment areas that tend to increase exponentially. The multivariate analysis of covariance was run with a permutation MANCOVA (PERMANCOVA) applied to an among-sites similarity matrix computed with the Bray-Curtis similarity index implemented on the transformed CPE values. Species CPE were fourth root transformed to reduce right-skewness. Non-metric multidimensional scaling (NMDS) was also applied to the resemblance matrix to interpret graphically the results of the PERMANCOVA.
Research has suggested that analysis of assemblages organized by functional group rather than taxonomic group can highlight relationships between fish assemblages and environmental conditions [40], especially changes in stream conditions due to dams [41]. To assess our hypotheses regarding the higher CPE of tolerant, lentic generalists in the upstream tributaries and higher lotic specialists in the downstream tributaries, we repeated the multivariate PERMANCOVA and NMDS analyses outlined above but replaced the taxa CPE values with functional group descriptors including physicochemical tolerances, habitat preferences, and trophic guilds (Table 1). Tolerances (i.e., intolerant, moderate, tolerant) were assessed according to Meador and Carlisle [42], habitat preferences (generalist, lentic, lotic) according to Frimpong and Angermeier [43], and trophic guilds (detritivore, herbivore, invertivore, parasite, piscivore, planktivore) according to Goldstein and Simon [44]. For all three of these functional categorizations, species CPE values were summed across samples according to each category, and then category CPEs were standardized to percentage composition across each sample. These values were then square-root transformed to reduce right-skewness. For each functional categorization, an among-sites matrix was constructed with the Bray-Curtis similarity index. Log10-transformed catchment size was included as a covariate because species differences in trophic guilds, tolerances, and habitat preferences are expected to change with increasing stream size [45], but subbasin was not included as a covariate since analysis of functional guilds generalizes species’ identity to their traits, which allows for community comparisons between areas that are geographically distant [46]. PRIMER-E version 7 software [45] was used for all analyses.
Because one of the primary ways reservoirs can affect stream fish assemblages is by acting as barriers to recolonization after stochastic extinction events, we hypothesized that tributaries upstream of the reservoir would have lower species richness than downstream tributaries. Species richness at each site was estimated using individual-based rarefaction or Chao 1 extrapolation as needed to facilitate comparisons between sites with unequal sample sizes [47]. As noted by Colwell et al. [48], extrapolation provides reliable estimates only up to roughly double the size of a sample, so we rarified or extrapolated all samples to a sample size of 50 fish (smallest catch was 27 fish). Rarefaction and extrapolation estimates were calculated using the iNEXT package in program R [49,50]. Potential differences in species richness among sites above and below reservoirs were assessed using a permutational analysis of covariance (PERANCOVA) applied to an among-site similarity matrix computed with Euclidean distance, with log10-transformed catchment size as a covariate [51]. Subbasin was not included as a covariate in this analysis because previous surveys have indicated that the species pool does not differ in number. The PERANCOVA was applied using PRIMER-E version 7 software [52].

3. Results

Overall, 4483 fish, representing 58 species, were collected from the 26 study sites (Table 1). Except for White Bass Morone chrysops and Smallmouth Buffalo Ictiobus bubalus, the assemblage was composed mostly of non-migratory fishes (Table 1). The average number of fish collected per site was 172 individuals (SD = 126), representing 13 species. One upstream site was removed from further analysis because the laboratory identification data were missing, leading to an extremely low sample size (N = 2 fish). Roughly 40% of the species collected were uncommon and detected in a few locations. Relative to habitat preferences, 43% of the species were lotic, 14% lentic, and 43% generalists. Concerning tolerance, 57% of species were tolerant, 26% were moderately tolerant, and 17% were intolerant. Most of the species were either invertivores (69%) or piscivores (17%).
Contrary to expectations influenced by our literature review, there were no significant differences between the composition of fish assemblages upstream and downstream of reservoirs (Pseudo F = 1.5, p = 0.16). Although the fish assemblage did change with catchment size (Pseudo F = 3.4, p < 0.01), there were no significant differences attributable to subbasin (Pseudo F = 1.01, p = 0.45), nor was the interaction between subbasin and sample location relative to upstream or downstream from the reservoir statistically significant (Pseudo F = 1.1, p = 0.36). The lack of segregation between upstream and downstream sites is made apparent by the large overlap of fish composition among sites illustrated with the NMDS plot (Figure 2). Although the upstream sites seemed more dissimilar as a set (i.e., greater dispersion in Figure 2), their distribution overlapped entirely with the distribution of the downstream sites. Eight species found in the downstream sites were not captured from the upstream sites, and 19 species present in the upstream sites were not captured from the downstream sites. Three of these 27 species were present at more than two sites (Table 1). The majority of species present at many sites were common species found both upstream and downstream of the reservoirs.
No differences were detected between upstream and downstream sites for physicochemical tolerances (Pseudo F = 0.96, p = 0.37) or habitat preferences (Pseudo F = 0.66, p = 0.48), and similar to the species composition, sites above the reservoirs tend to have more variability in ordination space (Figure 3a,c). However, a marginal difference was apparent when fish were grouped according to trophic guild (Pseudo F = 2.8, p = 0.04). The trophic guild ordination (Figure 3b) displays some separation of upstream from downstream sites mostly due to a higher representation of planktivores, herbivores, and detritivores in upstream sites while downstream sites were dominated by insectivores. In general, both upstream and downstream sites were dominated by moderately tolerant to tolerant lotic specialists and by generalists, although a few upstream sites had a greater percentage of planktivores, herbivores, and detritivores.
The species richness analysis concurred with the species composition analysis. Overall, species richness was not markedly different in sites upstream or downstream from the reservoirs (Pseudo F = 0.62, p = 0.45). Species richness estimated at 50 individuals ranged from 7 to 14 species for the majority of sites (Figure 4), but in general upstream sites showed more variability. The confidence intervals for all estimates were quite narrow (typically within two species) indicating relatively good fits for both the rarefaction and extrapolation estimates [48].

4. Discussion

We did not observe a compelling difference in tributary fish assemblages upstream or downstream of impoundments within our study region. This result represents an anomaly in light of the published literature [14,15,16,17,18,19,20,21]. We offer three explanations to account for this anomaly: (1) the history of land use in the Yazoo Basin, (2) the size of the tributaries investigated, and (3) a fish assemblage consisting mostly of non-migratory species. We consider each of these explanations below and argue that the effects of impoundments on fish assemblages may be region-specific. We suggest that the anomaly we observed can assist in refining expectations about fish assemblages and stream fish conservation in impounded river basins.
The Yazoo Basin, originally a hickory-oak hardwood forest, was cleared and converted to agriculture starting in the mid-1800s. By 1940, over 60% of the forests in the basin had been cleared [53]. Deforestation has resulted in widespread soil loss and erosion, which has degraded the quality of the streams in the region. By 1900, many streams were completely aggraded with sand and silt [26]. In response, local communities dredged and channelized the streams [54]. These instream alterations initiated a cycle of channelization, incision, and aggradation that has left a legacy on area streams, despite federal programs to reduce overland erosion beginning in the 1940s and instream erosion beginning in the 1980s [54]. Based on this history, it is possible that species richness was reduced and the fish assemblage was transformed and homogenized before faunal surveys were implemented and before the reservoirs were constructed, in such a way that any effect of the reservoirs on the fish assemblages are overshadowed by the “ghost of land use past” [55]. This explanation is supported by the dominance of tolerant fish species captured during our study (Table 1). Sixty percent of the species are considered tolerant of most physicochemical stream conditions, while another 25% are considered moderately tolerant. Only nine species captured in this study, all classified as intolerant, are generally considered indicators of healthy streams [56]. The representation of tolerant species in our study falls outside the range reported in national assessments. Barbour et al. [57] reported tolerances for 266 species, of which 10% were tolerant, 62% were moderately tolerant, and 28% were intolerant. Similarly, Meador and Carlisle [42] reported that in a sample of 105 species in streams across the U.S., 24% were tolerant, 60% were moderately tolerant, and 16% were intolerant. Considering these two reports, historical changes to landscapes in the Yazoo Basin could have shifted stream fish assemblages towards tolerant and generalist species resilient to impounding.
Most of the studies reporting changes in fish assemblages above reservoirs have been conducted in small basins supporting small reservoirs impounding intermittent or low-order influents [14,18,20,21]. The 4800–14,500 ha reservoirs included in this study had larger tributaries, many of them perennial, which may provide adequate refuge to fish assemblages during droughts or other physicochemical disturbances. This hypothesis is supported by estimates of species richness that are similar between upstream and downstream areas. As additional reinforcement for this argument, Adams and Warren [58] studied the recolonization rate for Yazoo Basin streams that became desiccated during an extreme drought (occurrence <1 in 50 years). All but two of the streams included in our study have a catchment area that is over an order of magnitude larger than the largest catchment area of their desiccated sites, suggesting that the streams included in this study rarely, if ever, become desiccated. Therefore, the fragmentation caused by dams in the Yazoo Basin may not noticeably degrade fish assemblages, as the larger tributaries above the reservoirs may provide sufficient populations for recolonization after rare desiccation events at headwater sites. As additional support for this idea, a recent study [59] also independently tested the influence of Sardis Reservoir (one of the reservoirs included in this analysis) on fish assemblages in low-order headwater streams, and no association was detected between fish assemblage and proximity to Sardis Reservoir. Our study did include a few low-order tributaries that drained directly into a reservoir; in fact, the three lowest richness estimates from the species accumulation curves in Figure 4 represent sites on streams that drain directly into Arkabutla Reservoir. It is possible that these tributaries show isolation effects from periodic extirpations and may be contributing to the higher variation in dissimilarity between upstream tributaries, but that the signal from these smaller tributaries is being overridden by the larger tributaries we included. This suggests that isolation effects, rather than the widespread effects of impoundment, may be limited by the resistance of streams to periodic disturbances.
Dams acting as barriers to potamodromous migrations are another major mechanism that can cause fish assemblage changes in impounded systems. Aadland et al. [60] documented the near total absence of potamodromous fish upstream of dams that were not equipped for fish passage in the Red River of the North, Canada-United States. These findings are supported by similar studies of migratory fishes in Brazil and Puerto Rico [19,61,62,63]. In our study region, the species pool included only two migratory species, white bass and smallmouth buffalo [29]. Conceivably, a mostly non-migratory fish assemblage may not be conspicuously affected by the fragmentation created by reservoirs. Alternatively, potamodromous species still common in the Mississippi River basin (e.g., Blue Sucker Cycleptus elongatus) may have dwindled in the region over the half century the subbasins have been impounded, removing the portion of the assemblages that would normally distinguish fish assemblages in reaches upstream and downstream from reservoirs.
The only apparent difference between sites upstream and downstream from the reservoirs was a marginally significant higher representation of planktivores, herbivores, and detritivores in upstream sites. All but two of the species that formed these guilds were classified as lentic or generalist and commonly occur in reservoirs in southeastern North America. Their representation was irregular across sites, with different species represented at different sites, and when present, they generally occurred in low numbers. Given their low representation and abundance, these common reservoir species did not have a major influence on the species composition or habitat preference analyses, yet they were highlighted by the trophic guild analysis. Hoeinghaus et al. [40] similarly found that analysis of taxonomic descriptions highlighted only regional geographic patterns, while functional groups described patterns associated with environmental conditions irrespective of geography. Thus, while taxonomic identities (e.g., species) are generally suitable for representing aquatic assemblages and implementing conservation measures targeting taxa, our study supports using functional classifications to examine patterns over regional scales where the species pool may differ over subbasins [45,64].

5. Conclusions

Our rather different result suggests the need for refining expectations about similarities in fish assemblages upstream and downstream from impoundments. Typically, the expectation is that impoundments impact upstream fish assemblages through mechanisms such as changes in habitats and loss of longitudinal connectivity. Our study further suggests that the impacts of these mechanisms may not be universal, as the severity of the effects may be nuanced by the regional species pool, the history of stream conditions in the watershed, and the resistance of the streams to periodic disturbances. Additionally, this study highlights how examining stream fish assemblages from several organizational perspectives can give insight to different mechanisms working in the system.

Author Contributions

Conceptualization, N.M.F. and L.E.M.; methodology, N.M.F. and L.E.M.; formal analysis, N.M.F.; investigation, J.F.; resources, J.M.T. and J.F.; data curation, J.M.T.; writing—original draft preparation, N.M.F.; writing—review and editing, L.E.M., J.M.T., and J.F.; visualization, N.M.F.; supervision, L.E.M.; project administration, N.M.F. All authors have read and agreed to the published version of the manuscript.

Funding

This research received no external funding.

Institutional Review Board Statement

Ethical review and approval were waived for this study because it was conducted using historical data collected during field sampling conducted by Arkansas State University during 1999–2000, which predates the establishment of the Arkansas State University IACUC.

Data Availability Statement

No new data were created or analyzed in this study. Contact Arkansas State University for further information on the availability of the data used in this study.

Acknowledgments

We acknowledge Todd Slack, Beth Baker, Michael Colvin, David Ruppel, Carolina Nascimento, and two anonymous reviewers for helpful reviews. We also thank Sam Testa for sharing his knowledge of the original sampling efforts and methods. Any use of trade, firm, or product names is for descriptive purposes only and does not imply endorsement by the U.S. Government. All authors have read and agreed to the published version of the manuscript.

Conflicts of Interest

The authors declare no conflict of interest.

References

  1. McAllister, D.E.; Platania, S.P.; Schueler, F.W.; Baldwin, M.E.; Lee, D.S. Ichthyofaunal patterns on a geographic grid. In The Zoogeography of North American Freshwater Fishes; Hocutt, C.H., Wiley, E.O., Eds.; John Wiley and Sons: New York, NY, USA, 1986; pp. 17–52. ISBN 0-471-86419-6. [Google Scholar]
  2. Jelks, H.L.; Walsh, S.; Burkhead, N.M.; Contreras-Balderas, S.; Diaz-Pardo, E.; Hendrickson, D.A.; Lyons, J.; Mandrak, N.E.; McCormick, F.; Nelson, J.S.; et al. Conservation status of imperiled North American freshwater and diadromous fishes. Fisheries 2008, 33, 372–407. [Google Scholar] [CrossRef]
  3. Warren, M.L., Jr.; Haag, W.R.; Adams, S.B. Forest linkages to diversity and abundance in lowland stream fish communities. In Proceedings of the Conference on Sustainability of Wetlands and Water Resources: How Well Can Riverine Wetlands Continue to Support Society into the 21st Century? Oxford, MS, USA, 23–25 May 2000; Holland, M.M., Warren, M.L., Jr., Stanturf, J.A., Eds.; U.S. Department of Agriculture, Forest Service, Southern Research Station: Ashville, NC, USA, 2002. [Google Scholar]
  4. Bennet, S.J.; Rhoton, F.E. Linking upstream channel instability to downstream degradation: Grenada Lake and the Skuna and Yalobusha river basins, Mississippi. Ecohydrology 2009, 2, 235–247. [Google Scholar] [CrossRef]
  5. Graf, W.L. Dam nation: A geographic census of American dams and their large-scale hydrologic impacts. Water Resour. Res. 1999, 35, 1305–1311. [Google Scholar] [CrossRef]
  6. U.S. Army Corps of Engineers. National Inventory of Dams. 2018. Available online: https://nid.usace.army.mil (accessed on 18 August 2021).
  7. Hannan, H.H. Chemical modifications in reservoir-regulated streams. In The Ecology of Regulated Streams; Ward, J.V., Stanford, J.A., Eds.; Springer: Boston, MA, USA, 1979; pp. 75–94. ISBN 978-1-4684-8613-1. [Google Scholar]
  8. Whitten, C.B.; Patrick, D.M. Engineering Geology and Geomorphology of Stream-Bank Erosion; Report 2, Yazoo River Basin Uplands, Mississippi; Geotechnical Laboratory, US Army Corps of Engineers: Washington, DC, USA, 1981. [Google Scholar]
  9. Simon, A. A model of channel response in disturbed alluvial channels. Earth Surf. Process. Landf. 1989, 14, 11–26. [Google Scholar] [CrossRef]
  10. Biedenharn, D.S.; Elliott, C.M.; Watson, C.C. The WES Stream Investigation and Streambank Stabilization Handbook; US Army Engineer Waterways Experiment Station: Vicksburg, MS, USA, 1997. [Google Scholar]
  11. Schumm, S.A.; Harvey, M.D.; Watson, C.C. Incised Channels: Morphology, Dynamics, and Control; Water Resources Publications: Highlands Ranch, CO, USA, 1984; ISBN 978-1-887201-64-3. [Google Scholar]
  12. Simon, A. Gradation Processes and Channel Evolution in Modified West Tennessee Streams: Process, Response and Form; U.S. Geological Survey Professional Paper 1470: Washington, DC, USA, 1994. [Google Scholar]
  13. Junk, W.; Bayley, P.B.; Sparks, R.E. The flood pulse concept in river-floodplain systems. In Proceedings of the International Large River Symposium (LARS), Honey Harbour, ON, Canada, September 1989; Dodge, D.P., Ed.; Canadian Special Publication of Fisheries and Aquatic Sciences 106: Ottawa, ON, Canada, 1989; pp. 110–127. [Google Scholar]
  14. Winston, M.R.; Taylor, C.M.; Pigg, J. Upstream extirpation of four minnow species due to damming of a prairie stream. Trans. Am. Fish. Soc. 1991, 120, 98–105. [Google Scholar] [CrossRef]
  15. Herbert, M.E.; Gelwick, F.P. Spatial variation of headwater fish assemblages explained by hydrologic variability and upstream effects of impoundment. Copeia 2003, 2003, 273–284. [Google Scholar] [CrossRef]
  16. Falke, J.A.; Gido, K.B. Effects of reservoir connectivity on stream fish assemblages in the Great Plains. Can. J. Fish. Aquat. Sci. 2006, 63, 480–493. [Google Scholar] [CrossRef]
  17. Guenther, C.B.; Spacie, A. Changes in fish assemblage structure upstream of impoundments within the Upper Wabash River Basin, Indiana. Trans. Am. Fish. Soc. 2006, 135, 570–583. [Google Scholar] [CrossRef]
  18. Kashiwagi, M.T.; Miranda, L.E. Influence of small impoundments on habitat and fish communities in headwater streams. Southeast. Nat. 2009, 8, 23–36. [Google Scholar] [CrossRef]
  19. Sá-Oliveira, J.C.; Hawes, J.E.; Isaac-Nahuum, V.J.; Peres, C.A. Upstream and downstream responses of fish assemblages to an Eastern Amazonian hydroelectric dam. Freshw. Biol. 2015, 60, 2037–2050. [Google Scholar] [CrossRef]
  20. Hedden, S.C.; Renner, E.A.; Gido, K.B.; Hase, K.J. Impacts of small impoundments on an intermittent headwater stream community. Southwest. Nat. 2018, 63, 34–41. [Google Scholar] [CrossRef]
  21. Reuter, C.N.; Kaller, M.D.; Walsh, C.E.; Kelso, W.E. Fish assemblage response to altered dendritic connectivity in the Red River Basin, Central Louisiana. Am. Midl. Nat. 2019, 181, 63–80. [Google Scholar] [CrossRef]
  22. Barnett, Z.C.; Adams, S.B. Review of dam effects on native and invasive crayfishes illustrates complex choices for conservation planning. Front. Ecol. Evol. 2021, 8, 621723. [Google Scholar] [CrossRef]
  23. U.S. Geological Survey. National Hydrography Dataset (ver. USGS National Hydrography Dataset Best Resolution (NHD) for Hydrologic Unit (HU) 4–0803 (published 202110102)). 2021. Available online: https://www.usgs.gov/core-science-systems/ngp/national-hydrography/access-national-hydrography-products. (accessed on 5 January 2021).
  24. Hilgard, E.W. Report on the Geology and Agriculture of the State of Mississippi; E. Barksdale State Printer: Jackson, MS, USA, 1860. [Google Scholar]
  25. Dabney, S.M.; Shields, F.D.; Binger, R.L.; Kuhnle, R.A.; Rigby, J.R. Watershed management for erosion and sedimentation control case study Goodwin Creek, Panola County. In Advances in Soil Science, Soil Water and Agronomic Productivity; Lal, R., Stewart, B.A., Eds.; Taylor and Francis: Boca Raton, FL, USA, 2012; pp. 539–568. ISBN 978-1439850794. [Google Scholar]
  26. Williston, H.L. The Yazoo-Little Tallahatchie Flood Prevention Project: A History of the Forest Service’s Role; Forgotten Books: London, UK, 1998; ISBN 978-0265065969. [Google Scholar]
  27. Bledsoe, B.P.; Watson, C.C.; Biedenharn, D.S. Quantification of incised channel evolution and equilibrium. J. Am. Water Resour. Assoc. 2002, 38, 861–870. [Google Scholar] [CrossRef]
  28. Knight, S.S.; Cooper, C.M. Fishes of Otoucalofa Creek, Mississippi prior to major channel modifications. J. Miss. Acad. Sci. 1987, 32, 31–38. [Google Scholar]
  29. Ross, S.T. Inland Fishes of Mississippi; University Press of Mississippi: Jackson, MS, USA, 2001; ISBN 1-57806-246-2. [Google Scholar]
  30. Faucheux, N.M. Assessing the Legacy of Erosion and Flood Control Management Efforts on the Fish Assemblages and Physical Conditions of Yazoo Basin Bluff Hill Streams. Doctoral Dissertation, Mississippi State University, Mississippi State, MS, USA, 2022. [Google Scholar]
  31. U.S. Geological Survey. The StreamStats Program v.4.3.11. 2020. Available online: http://streamstats.usgs.gov (accessed on 6 February 2020).
  32. Rabeni, C.F.; Lyons, J.; Mercado-Silva, N.; Patterson, J.T. Warmwater fish in wadeable streams. In Standard Methods for Sampling North American Freshwater Fishes; Bonar, S.A., Hubert, W.A., Willis, D.W., Eds.; American Fisheries Society: Bethesda, MD, USA, 2009; pp. 43–58. ISBN 978-1-934874-10-3. [Google Scholar]
  33. Price, A.L.; Peterson, J.T. Estimation and modeling of electrofishing capture efficiency for fishes in wadeable warmwater streams. N. Am. J. Fish. Manag. 2010, 30, 481–498. [Google Scholar] [CrossRef]
  34. Mahon, R. Accuracy of catch-effort methods for estimating fish density and biomass in streams. Environ. Biol. Fishes 1980, 5, 343–360. [Google Scholar] [CrossRef]
  35. Wagner, M.D.; Schumann, D.A.; Smith, B.J. Gear effectiveness and size selectivity for five cryptic madtom species (Noturus spp.). J. Appl. Ichthyol. 2019, 35, 673–682. [Google Scholar] [CrossRef]
  36. Poos, M.S.; Mandrak, N.E.; McLaughlin, R.L. The effectiveness of two common sampling methods for assessing imperiled freshwater fishes. J. Fish Biol. 2007, 70, 691–708. [Google Scholar] [CrossRef]
  37. Reid, S.M.; Yunker, G.; Jones, N.E. Evaluation of single-pass backpack electrofishing for stream fish community monitoring. Fish. Manag. Ecol. 2009, 16, 1–9. [Google Scholar] [CrossRef]
  38. Rodriguez-Iturbe, I.; Rinaldo, A. Fractal River Networks: Chance and Self-Organization; Cambridge University Press: New York, NY, USA, 1997; ISBN 0-521-00405-5. [Google Scholar]
  39. Altermatt, F. Diversity in riverine metacommunities: A network perspective. Aquat. Ecol. 2013, 47, 365–377. [Google Scholar] [CrossRef]
  40. Hoeinghaus, D.J.; Winemiller, K.O.; Birnbaum, J.S. Local and regional determinants of stream fish assemblage structure: Inferences based on taxonomic vs. functional groups. J. Biogeogr. 2007, 34, 324–338. [Google Scholar] [CrossRef]
  41. Smith, S.C.F.; Meiners, S.J.; Hastings, R.P.; Thomas, T.; Columbo, R.E. Low-head dam impacts on habitat and the functional composition of fish communities. River Res. Appl. 2017, 33, 680–689. [Google Scholar] [CrossRef]
  42. Meador, M.R.; Carlisle, D.M. Quantifying tolerance indicator values for common stream fish species of the United States. Ecol. Indic. 2007, 7, 329–338. [Google Scholar] [CrossRef]
  43. Frimpong, E.A.; Angermeier, P.L. FishTraits: A database of ecological and life-history traits of freshwater fishes of the United States. Fisheries 2009, 34, 487–495. [Google Scholar] [CrossRef]
  44. Goldstein, R.M.; Simon, T.P. Toward a united definition of guild structure for feeding ecology of North American freshwater fishes. In Assessing the Sustainability and Biological Integrity of Water Resources Using Fish Communities; Simon, T.P., Ed.; CRC Press: Boca Raton, FL, USA, 1999; pp. 123–202. ISBN 978-0849340079. [Google Scholar]
  45. Vannote, R.L.; Minshall, G.W.; Cummins, K.W.; Sedell, J.R.; Cushing, C.E. The river continuum concept. Can. J. Fish. Aquat. Sci. 1980, 37, 130–137. [Google Scholar] [CrossRef]
  46. Troia, M.J.; McManamay, R.A. Biogeographic classification of streams using fish community- and trait-environment relationships. Divers. Distrib. 2019, 26, 108–125. [Google Scholar] [CrossRef]
  47. Chao, A.; Gotelli, N.J.; Hsieh, T.C.; Sander, E.L.; Ma, K.H.; Colwell, R.K.; Ellison, A.M. Rarefaction and extrapolation with Hill numbers: A framework for sampling and estimation in species diversity studies. Ecol. Monogr. 2014, 84, 45–67. [Google Scholar] [CrossRef]
  48. Colwell, R.K.; Chao, A.; Gotelli, N.J.; Lin, S.Y.; Mao, C.X.; Chazdon, R.L.; Longino, J.T. Models and estimators linking individual-based and sample-based rarefaction, extrapolation and comparison of assemblages. J. Plant Ecol. 2012, 5, 3–21. [Google Scholar] [CrossRef]
  49. Hsieh, T.C.; Ma, K.H.; Chao, A. iNEXT: An R package for rarefaction and extrapolation of species diversity (Hill numbers). Methods Ecol. Evol. 2016, 7, 1451–1456. [Google Scholar] [CrossRef]
  50. R Core Team. R: A Language and Environment for Statistical Computing; R Foundation for Statistical Computing: Vienna, Austria, 2021. [Google Scholar]
  51. Anderson, M.J. Permutational Multivariate Analysis of Variance (PERMANOVA); Balakrishnan, N., Colton, T., Everitt, B., Piegorsch, W., Ruggeri, F., Teugels, J.L., Eds.; John Wiley & Sons, Ltd.: Hoboken, NJ, USA, 2017; pp. 1–15. [Google Scholar] [CrossRef]
  52. Clark, K.R.; Gorley, R.N. Primer v7: User Manual/Tutorial; Primer-E: Plymouth, UK, 2015. [Google Scholar]
  53. U.S. Army Corps of Engineers. A comprehensive summary report on streambank erosion control demonstration projects constructed in eight watersheds of the Yazoo River basin. Appendix F. In The Final Report to Congress: The Streambank Erosion Control Evaluation and Demonstration Act of 1974 Section 32, Public Law 93-251; U.S. Army Corps of Engineers: Washington, DC, USA, 1981. [Google Scholar]
  54. Leech, J.R.; Biedenharn, D.S. Sediment Management at the Watershed Level. Coastal and Hydraulics Engineering Technical Note ERDC/CHL CHETN-VII-12; US Army Corps of Engineers, Defense Technical Information Center: Vicksburg, MS, USA, 2012. [Google Scholar]
  55. Harding, J.S.; Benfield, E.F.; Bolstad, P.V.; Helfman, G.S.; Jones, E.B.D. III. Stream biodiversity: The ghost of land use past. Proc. Natl. Acad. Sci. USA 1998, 95, 14843–14847. [Google Scholar] [CrossRef] [PubMed]
  56. Shields, F.D.; Knight, S.S.; Cooper, C.M. Use of the index of biotic integrity to assess physical habitat degradation in warmwater streams. Hydrobiologia 1995, 312, 191–208. [Google Scholar] [CrossRef]
  57. Barbour, M.T.; Gerritsen, J.; Snyder, B.D.; Stribling, J.B. Rapid Bioassessment Protocols for Use in Streams and Wadeable Rivers: Periphyton, Benthic Macroinvertebrates, and Fish, 2nd ed.; EPA 841-B-99-002; U.S. Environmental Protection Agency, Office of Water: Washington, DC, USA, 1999. [Google Scholar]
  58. Adams, S.B.; Warren, M.L. Recolonization by warmwater fishes and crayfishes after severe drought in Upper Coastal Plain hill streams. Trans. Am. Fish. Soc. 2005, 134, 1173–1192. [Google Scholar] [CrossRef]
  59. Hubbell, J.P.; Schaefer, J.F.; Flood, P.; Warren, M.L., Jr.; Sterling, K.A. Fragmentation alters ecological gradients and headwater fish assemblage composition relative to land use in a dendritic river system. Can. J. Fish. Aquat. Sci. 2020, 77, 1281–1291. [Google Scholar] [CrossRef]
  60. Aadland, L.P.; Koel, T.M.; Franzin, W.G.; Stewart, K.W.; Nelson, P. Changes in fish assemblage structure of the Red River of the North. In Historical Changes in Large River Fish Assemblages of the Americas; Symposium 45; Rinne, J.R., Hughes, R.M., Calamussa, B., Eds.; American Fisheries Society: Bethesda, MD, USA, 2005; pp. 293–321. ISBN 978-1888569728. [Google Scholar]
  61. Agostinho, A.A.; Pelicice, F.M.; Gomes, L.C. Dams and the fish fauna of the Neotropical region: Impacts and management related to diversity and fisheries. Braz. J. Biol. 2008, 68, 1119–1132. [Google Scholar] [CrossRef]
  62. Cooney, P.B.; Kwak, T.J. Spatial extent and dynamics of dam impacts on tropical island freshwater fish assemblages. Bioscience 2013, 63, 176–190. [Google Scholar] [CrossRef]
  63. Agostinho, A.A.; Gomes, L.C.; Santos, N.L.C.; Ortega, J.C.G.; Pelicice, F.M. Fish assemblages in Neotropical reservoirs: Colonization patterns, impacts and management. Fish. Res. 2016, 173, 26–36. [Google Scholar] [CrossRef]
  64. Salmaso, N.; Naselli-Flores, L.; Padisák, J. Functional classifications and their application in phytoplankton ecology. Freshw. Biol. 2015, 60, 603–619. [Google Scholar] [CrossRef]
Figure 1. Map of the eastern Yazoo River Basin in northwest Mississippi, USA. Sites sampled by Arkansas State University in 1999–2000, coded by color. Upstream sites are gray, while downstream sites are black.
Diversity 15 00728 g001
Figure 2. Non-metric multidimensional scaling plot of catch per effort data in streams of the eastern Yazoo Basin in North Mississippi, USA. Sites upstream and downstream of dams are coded by color. Grey symbols represent upstream sites, while black symbols represent downstream sites.
Diversity 15 00728 g002
Figure 3. Non-metric multidimensional scaling plots showing site similarity based on species tolerances (a), species trophic levels (b), and species habitat preferences (c) for fish in streams of the eastern Yazoo Basin in North Mississippi, USA.
Diversity 15 00728 g003
Figure 4. Sites upstream and downstream of dams are coded by color. Grey curves represent upstream sites, while black curves represent downstream sites. Solid lines represent rarefied estimates of fish species richness per number of individuals in the sample, while dashed lines represent estimates extrapolated using the Chao 1 estimator. Points on the curve represent the sampled values. The Y-axis denotes species richness; X-axis denotes number of individuals in a sample.
Diversity 15 00728 g004
Table 1. List of species caught in the 26 study sites in the Yazoo Basin, MS, USA. The values represent the number of sites where each species was detected. The percentage of catch was calculated using the total number of fish collected in the study. Asterisks (*) denote migratory species. Migration habits and habitat preferences were assessed using Frimpong and Angermeier [43]. The trophic guild was assessed using Goldstein and Simon [44]. Tolerance was assessed using Meador and Carlisle [42].
Scientific NameCommon NameUpstream SitesDownstream SitesPercentage of CatchHabitat PreferenceTrophic GuildTolerance
Ichthyomyzon castaneusChestnut Lamprey100.18loticparasiteintolerant
Atractosteus spatulaAlligator Gar100.02lenticpiscivoretolerant
Lepisosteus oculatusSpotted Gar140.27lenticpiscivoretolerant
Dorosoma cepedianumGizzard Shad200.31generalistherbivoretolerant
Dorosoma petenenseThreadfin Shad200.47generalistplanktivoretolerant
Campostoma anomalumCentral Stoneroller020.07loticherbivoremoderate
Cyprinella camuraBluntface Shiner61011.02loticinvertivoremoderate
Cyprinella lutrensisRed Shiner121.36generalistinvertivoretolerant
Cyprinella venustaBlacktail Shiner999.44loticinvertivoremoderate
Cyprinus carpioCommon Carp200.04generalistdetritivoretolerant
Luxilus chrysocephalusStriped Shiner242.68loticinvertivoremoderate
Lythrurus fumeusRibbon Shiner010.02loticinvertivoreintolerant
Notemigonus crysoleucasGolden Shiner300.09generalistinvertivoremoderate
Notropis ammophilusOrangefin Shiner230.94loticinvertivoreintolerant
Notropis atherinoidesEmerald Shiner402.05generalistplanktivoretolerant
Notropis buchananiGhost Shiner100.29generalistinvertivoretolerant
Notropis rafinesqueiYazoo Shiner134.60loticinvertivoreintolerant
Opsopoeodus emiliaePugnose Minnow100.04generalistdetritivoremoderate
Pimephales notatusBluntnose Minnow694.13generalistdetritivoretolerant
Pimephales vigilaxBullhead Minnow350.47generalistinvertivoretolerant
Semotilus atromaculatusCreek Chub885.38loticinvertivoretolerant
Erimyzon oblongusCreek Chubsucker340.76loticinvertivoremoderate
Ictiobus bubalus * Smallmouth Buffalo040.20generalistinvertivoretolerant
Moxostoma erythrurumGolden Redhorse100.02generalistinvertivoretolerant
Moxostoma poecilurumBlacktail Redhorse050.31loticdetritivoreintolerant
Ameiurus melasBlack Bullhead100.13generalistinvertivoretolerant
Ameiurus natalisYellow Bullhead9114.39loticinvertivoretolerant
Ameiurus nebulosusBrown Bullhead010.02lenticinvertivoretolerant
Ictalurus punctatusChannel Catfish171.61generalistpiscivoretolerant
Noturus gyrinusTadpole Madtom200.04loticinvertivoretolerant
Noturus hildebrandiLeast Madtom100.09loticinvertivoreintolerant
Noturus nocturnusFreckled Madtom200.20loticinvertivoretolerant
Pylodictis olivarisFlathead Catfish020.13loticpiscivoretolerant
Esox americanusRedfin Pickerel100.02lenticpiscivoremoderate
Aphredoderus sayanusPirate Perch401.03lenticinvertivoremoderate
Labidesthes sicculusBrook Silverside110.42lenticplanktivoretolerant
Fundulus chrysotusGolden Topminnow110.33lenticinvertivoremoderate
Fundulus notatusBlackstripe Topminnow171.96loticinvertivoretolerant
Fundulus olivaceusBlackspotted Topminnow10104.08loticinvertivoremoderate
Gambusia affinisWestern Mosquitofish430.85generalistinvertivoretolerant
Morone chrysops *White Bass100.02generalistpiscivoretolerant
Lepomis cyanellusGreen Sunfish121111.40generalistinvertivoretolerant
Lepomis gulosusWarmouth410.18generalistinvertivoretolerant
Lepomis macrochirusBluegill121212.65generalistinvertivoretolerant
Lepomis megalotisLongear Sunfish4108.48generalistinvertivoretolerant
Lepomis miniatusRedspotted Sunfish110.04generalistinvertivoremoderate
Micropterus punctulatusSpotted Bass260.65generalistpiscivoretolerant
Micropterus salmoidesLargemouth Bass693.86generalistpiscivoretolerant
Pomoxis annularisWhite Crappie200.11lenticpiscivoretolerant
Etheostoma artesiaeRedspotted Darter120.11loticinvertivoremoderate
Etheostoma histrioHarlequin Darter100.04loticinvertivoreintolerant
Etheostoma lynceumBrighteye Darter020.13loticinvertivoreintolerant
Etheostoma parvipinneGoldstripe Darter110.07loticinvertivoreintolerant
Etheostoma swainiGulf Darter110.13loticinvertivoreintolerant
Percina caprodesLogperch010.02loticinvertivoremoderate
Percina maculataBlackside Darter240.25loticinvertivoretolerant
Percina scieraRiver Darter260.76loticinvertivoremoderate
Aplodinotus grunniensFreshwater Drum330.62generalistpiscivoretolerant
Disclaimer/Publisher’s Note: The statements, opinions and data contained in all publications are solely those of the individual author(s) and contributor(s) and not of MDPI and/or the editor(s). MDPI and/or the editor(s) disclaim responsibility for any injury to people or property resulting from any ideas, methods, instructions or products referred to in the content.

