Article

Is the Northern Goshawk an Efficient Bioindicator of Avian Abundance and Species Richness in Urban Environments?

1
Institute of Agricultural and Environmental Sciences, Estonian University of Life Sciences, Kreutzwaldi 5D, 51006 Tartu, Estonia
2
Faculty of Biology, University of Białystok, Ciołkowskiego 1J, 15-245 Białystok, Poland
*
Author to whom correspondence should be addressed.
Diversity 2023, 15(6), 749; https://doi.org/10.3390/d15060749
Submission received: 30 April 2023 / Revised: 31 May 2023 / Accepted: 5 June 2023 / Published: 7 June 2023
(This article belongs to the Special Issue Conservation and Ecology of Raptors)

Abstract

:
Monitoring of biodiversity in expanding urban areas is an essential part of wildlife conservation. There is evidence that raptors, such as Northern Goshawks (Accipiter gentilis), are effective bioindicator species in urban areas, however, their relationship with other bird populations is not clearly established. We asked whether activity patterns of Goshawks are a reliable indicator of wintering bird abundance and diversity in urban ecosystems. We tracked the movement of eight GPS-tagged Goshawks in the city of Tartu (Estonia) and analysed the numbers and diversity of birds in the same area using direct mapping and occasional data obtained from birdwatchers. The direct mapping approach revealed that the number of birds and avian species richness were higher in Goshawk activity hotspots than at random sites in 2022, however, no such differences were detected in 2023. Analysis of occasional citizen-collected data showed no effect of avian abundance nor species richness on the distribution of Goshawk activity. These results suggested that the movements of Goshawks may indicate the abundance and diversity of its prey, however, this relationship depends on the detection methodology. Hence, raptors are a promising bioindicator in urban environments, but results should be interpreted with caution, particularly when using citizen-collected data.

1. Introduction

Urbanised areas have become the most rapidly expanding habitat type worldwide [1] and urbanisation is one of the main threats to biodiversity [2,3,4]. However, a number of wildlife species have adapted to urban environments. Hence, preserving and monitoring biodiversity in human-dominated areas are becoming essential parts of maintaining biodiversity on the global scale [5].
Assessing total biodiversity is laborious and costly. Therefore, it is often evaluated using bioindicators, which are species or assemblages of species reactive to environmental changes [6]. Birds, for example, are highly visible and sensitive to changes in habitat structure and composition, therefore, they are excellent indicators of habitat quality, including that in urban environments [3,5,7]. However, comprehensive avifaunal inventories are often not feasible. Thus, well-chosen bioindicator species or species groups may be an efficient shortcut to evaluate ecosystem quality [8]. For example, large predators, raptors in particular, are considered good indicators of viable ecosystems [9,10]. Indeed, there is accumulating evidence that various raptor species are efficient surrogates for biodiversity in various ecosystems [11,12,13,14].
The Northern Goshawk Accipiter gentilis (hereafter Goshawk) is a flexible avian apex predator inhabiting various landscapes. Primarily, Goshawk is a forest-dwelling species, however, it also thrives in mosaic agricultural landscapes and has recently colonised cities [15]. Therefore, this species has been used as an indicator of biodiversity in forests [12,13], farmland [16] and urban areas [17,18]. Goshawks forage primarily on birds [15]. As the efficacy of a bioindicator is higher for taxa with a stronger ecological connection to the predator [10], Goshawk distributions are expected to effectively indicate avian abundance and diversity.
Northern bird populations, including Goshawk populations, are strongly limited by the occurrence of prey during winter [19,20,21]. Under harsh conditions, many birds inhabit areas in proximity to humans [19,22,23] and may even move to cities from less populated areas [24]. Goshawks, in turn, may follow the movements of their prey between habitats [15]. Hence, cities attract wintering hawks and, in addition to local residents, nonbreeding individuals may be concentrated in these areas. This situation provides an excellent chance to directly study relationships between predators and prey because associations with nests, which bias spatial behaviour, are limited or lacking. Earlier, Natsukawa [18] found that Goshawk nest site selection in a city corresponded to the habitat selection of wintering birds, indicating that Goshawk nest sites may serve as a surrogate for hotspots of avian diversity in urban environments. However, as these previous data sets were temporally separated, the direct link between Goshawks and other birds remains untested.
The past few decades have witnessed the emergence and growth of several new scientific methods. First, several novel technologies, such as GPS-based telemetry, have seen rapid advances. Movement ecology, owing to rapid advances in telemetry technologies, is an active field of research with great potential for investigations of broad, biodiversity-scale issues [25]. This enables the replacement of landscape-level correlations with the actual pinpointing of activity centres of animals. Second, citizen science (i.e., the involvement of non-scientists in data collection for scientific research) has been expanding, in part owing to technological developments [26,27,28]. Citizen science provides an opportunity to conduct research at broad spatial scales, which are impossible to sample extensively using traditional field research models [29,30]. Citizen scientists, for example, collect field data related to species distributions and abundance [27,29,31]. Extensive datasets based on opportunistic observations by amateurs have contributed to faunistic surveys and correlative ecological analyses [29,31,32].
The aim of this study was to test whether Goshawk habitat use is related to the distribution of wintering birds in an urban environment. In particular, we tracked movements of eight GPS-tagged Goshawks in the city of Tartu and analysed the number and diversity of birds in the same area. We hypothesised that the activity centres of Goshawks are positively associated with avian abundance and species richness. We explored the abundance and diversity of birds in two ways. First, we mapped birds in sites preferred by GPS-tracked Goshawks and in control sites; second, we analysed occasional observations of birdwatchers. Hence, by comparison of the results obtained using the two approaches, our findings provide insight into the utility of citizen science for estimating avian abundance and diversity in urban environments.

2. Materials and Methods

This study was conducted in Tartu, Estonia, in north-eastern Europe (58°23′ N 26°43′ E). Tartu is the second largest city in Estonia with a population of c. 100,000 people. The average annual air temperature is 6.1 °C and the coldest month is February (on average −5.3 °C [33]). Tartu has rather diverse land use [34], with the dominant features being residential areas (covering 30.7% of the area), open green areas (28.7%) and roads (20.4%). Afforested areas (9.0%), open lands without vegetation (4.3%) and cultivated lands (3.5%) cover smaller portions of the landscape. Wetlands and water bodies, such as the river Emajõgi passing through the city, hold significant ecological value despite occupying a minor proportion of the area, accounting for 2.7% and 0.7% of the landscape, respectively (Figure 1).
The study was conducted in two winters, in 2021/2022 (February 2022) and 2022/2023 (November 2022–February 2023). In total, seven GPS-tagged Goshawks (six males and one female) were included in the study (Table 1). Each bird was equipped with a 15–30 g (<3% of the body mass) solar-powered GSM/GPRS logger (UAB Ornitela, Vilnius, Lithuania) as a backpack using Teflon harnesses. Seven birds were followed during one winter but an adult male provided data in both study winters. All birds were followed for the entire study periods, i.e., for 28 days in 2021/2022 (84 tracking days in total) and for 120 days in 2022/2023 (600 tracking days in total). However, the datasets varied owing mainly to limited light in the winter, preventing loggers from recharging. Eventually, we used 491 Goshawk locations from 2021/2022 and 1304 locations from 2022/2023 (Table 1).
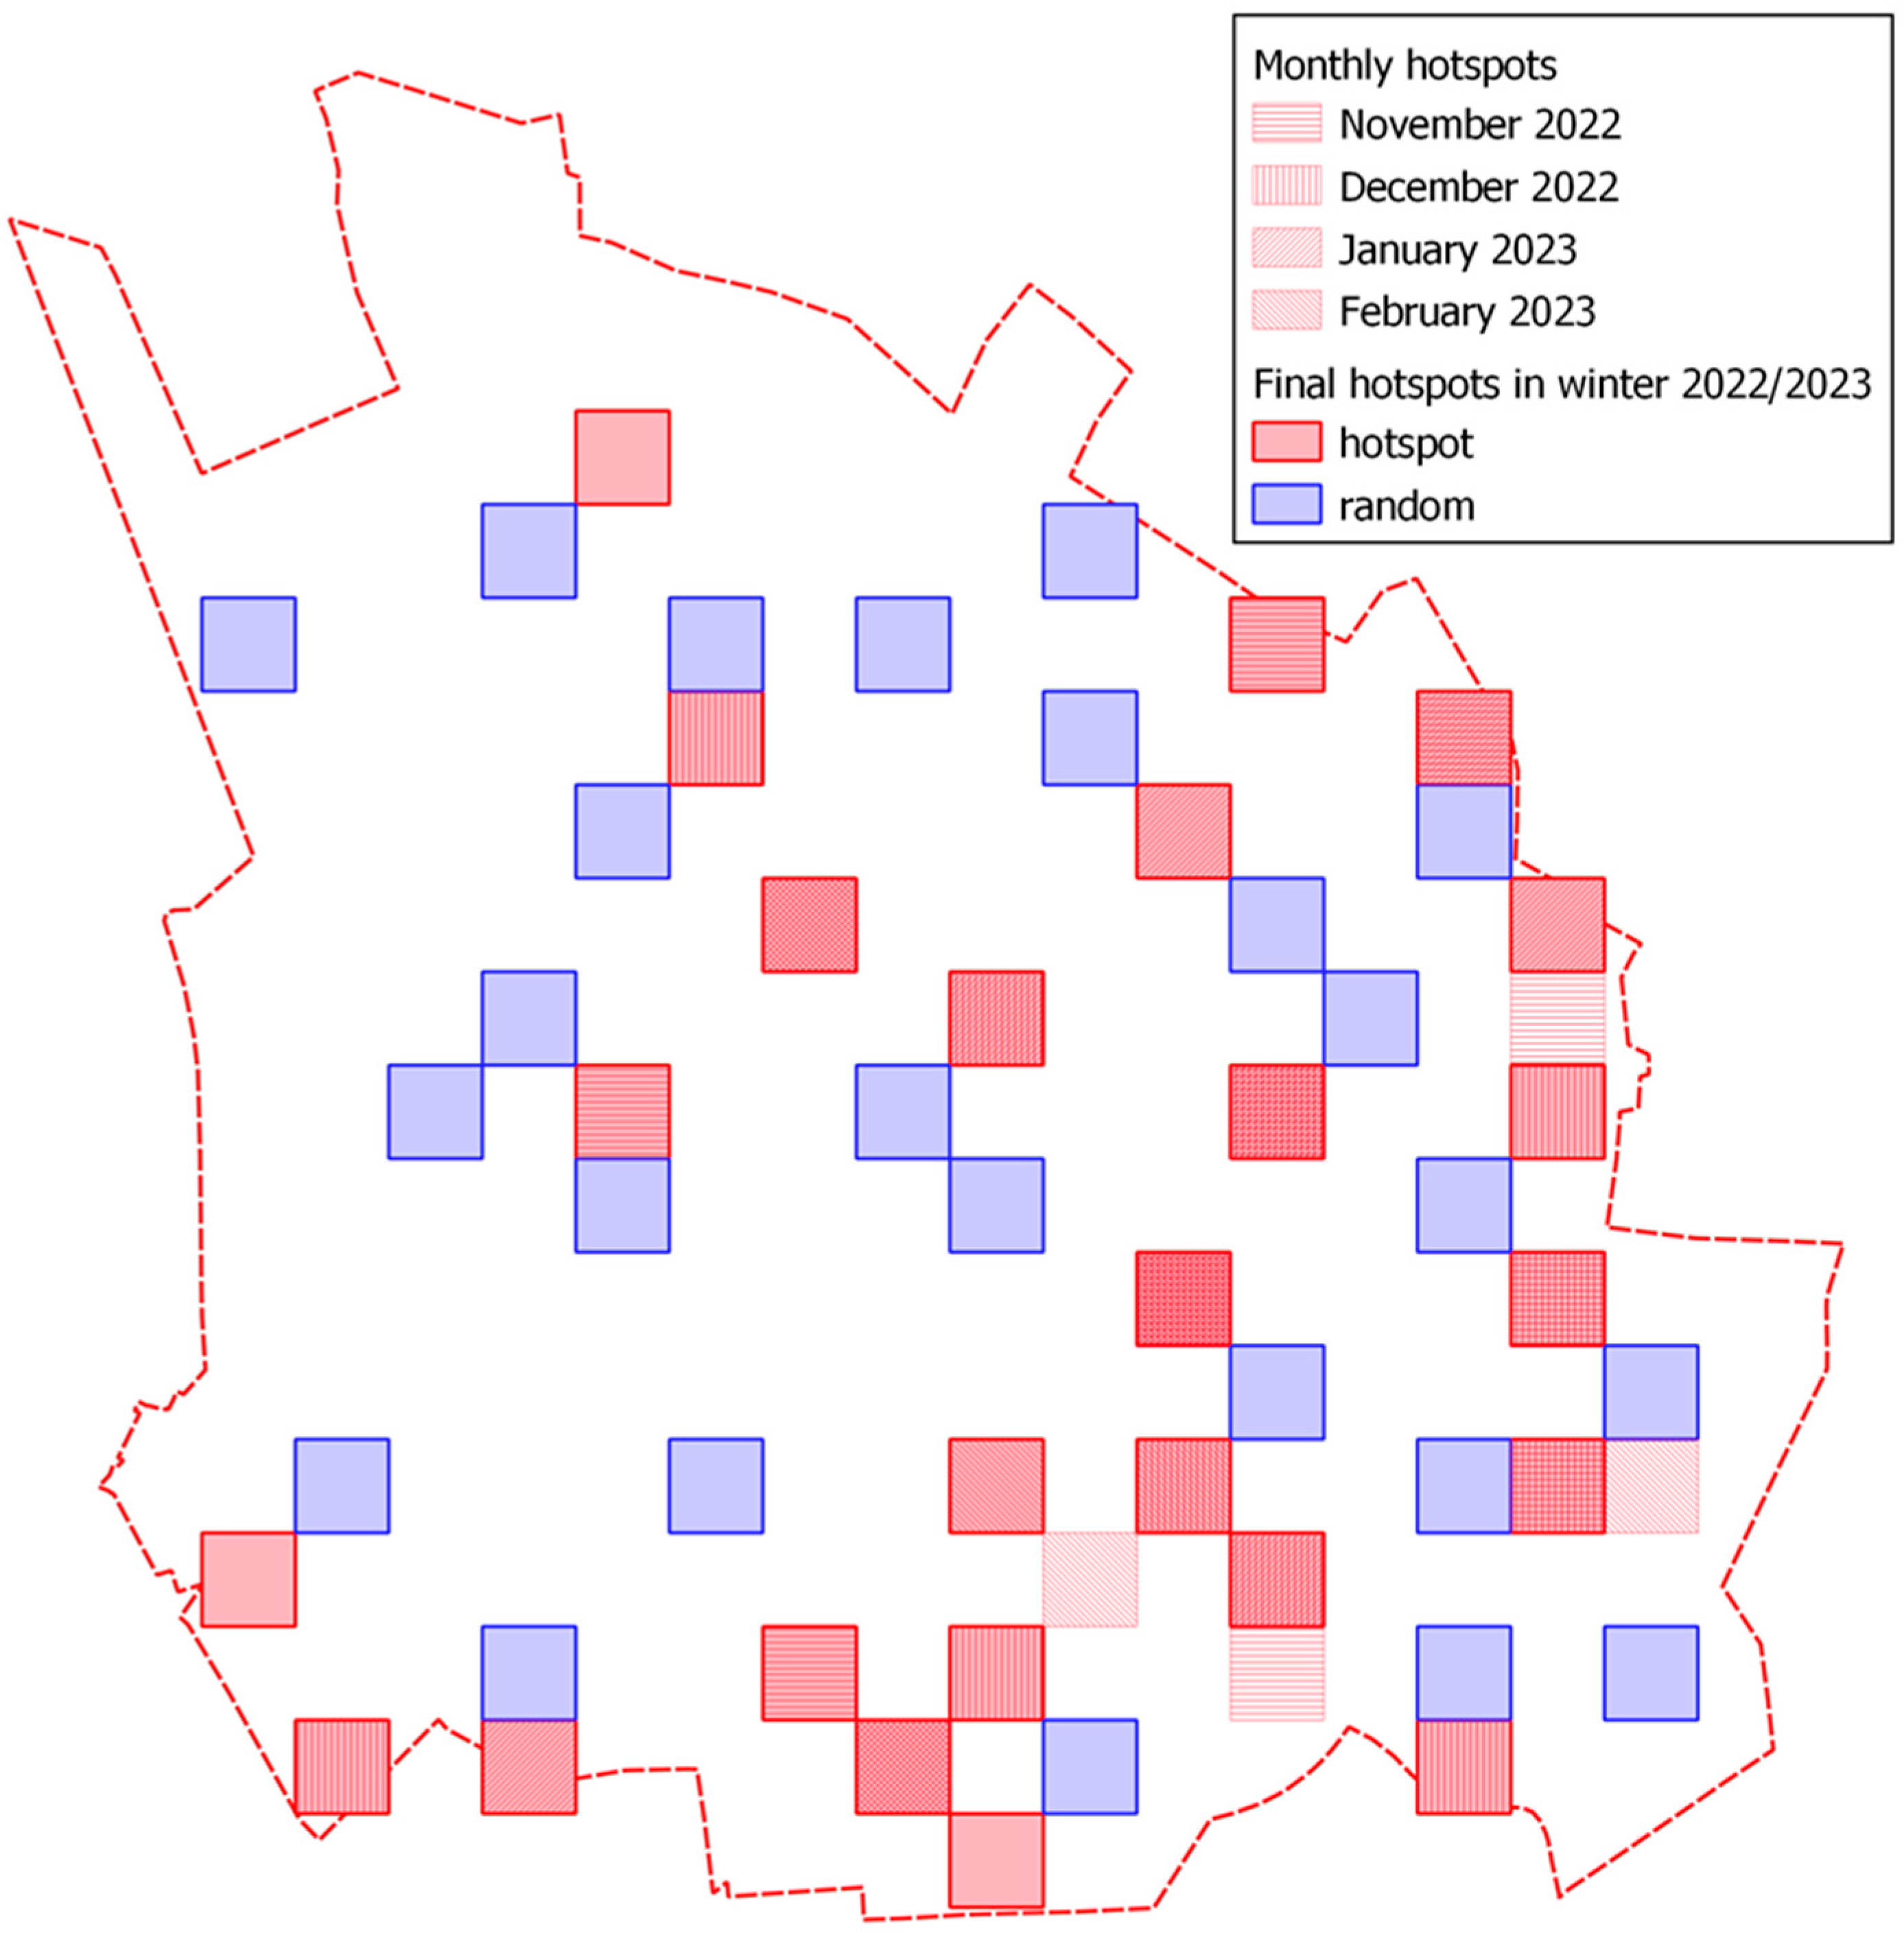
The abundance and distribution of wintering birds in the city of Tartu was determined using two approaches. First, the authors (J.G., P.Me., T.T., and Ü.V.) mapped the birds on 14 to 20 February 2022 and on 14 to 20 February 2023 (Table 2). The city of Tartu was divided into 400 × 400 m squares (Figure 1). Out of 299 squares, 50 squares at town edges that contained >60% of land outside the borders of Tartu and nine squares that were highly (>60%) afforested and were not classified as urban were excluded. The remaining 240 grid squares were overlaid with GPS-telemetry data for Goshawks to select two independent sets (one for each season) of Goshawk activity hotspots and random squares. The hotspots were defined as the 25 grid squares with the highest number of Goshawk GPS-fixes in the given season. To avoid clustering, we selected only the squares with highest number of Goshawk locations and omitted all bordering squares (sharing a corner was allowed). To compare sites used by Goshawks with available urban sites, another 25 squares were randomly drawn from those that were not used by Goshawks. Eventually, only five hotspot squares and three random points were repeatedly selected in the two seasons; additionally, one random point from 2022 was a hotspot in 2023. In 2022/2023, most hotspots were consistent throughout the winter (Figure 2).
Second, we used the data from citizen scientists deposited in PlutoF [35], a portal incorporating observations of Estonian birdwatchers. In early February 2022 and early November 2023, calls were published on social media platforms to encourage bird enthusiasts to collect observations in Tartu and deposit these in the PlutoF database. Collected occasional bird data (in February 2022 and November 2022–February 2023) were analysed using the same grid used in the first approach. We attempted to avoid two potential methodological caveats. First, the study area was not uniformly covered by the bird observations, nor by the home ranges of Goshawks. To avoid the effect of spatial non-overlap of the two data sets, we included only squares with at least one bird sighting and at least one Goshawk record in the analyses. Secondly, the same observers may have visited the same squares repeatedly. To avoid the cumulative effect of repeated visits, only the maximum number of each bird species in each square was included.
In each square, species richness and the abundance of each bird species were calculated. All bird species were included in initial analyses. Thereafter, only medium-sized birds (ducks, pigeons, most corvids, thrushes, etc.) were included as potential prey items for Goshawks. In the analysis of mapping data, the effect of “local” birds identified as potential prey in a given location was analysed separately (i.e., birds flying over were excluded). Owing to the limits of data deposition in the PlutoF database, the latter specification was not possible in the analysis of occasional data.
The bird mapping data were analysed using logistic regression models, where grid square type was a binary response variable, and avian abundance or species richness were covariates. Owing to the strong collinearity, abundance and species richness were analysed via separate models. In the analysis of occasional observations, we used linear models where the number of Goshawk GPS-fixes was a continuous response variable; again, avian abundance or species richness were covariates. Initial models included factor year and its interaction with covariates but final models were developed for each year separately. All continuous variables were log-transformed prior to analyses.

3. Results

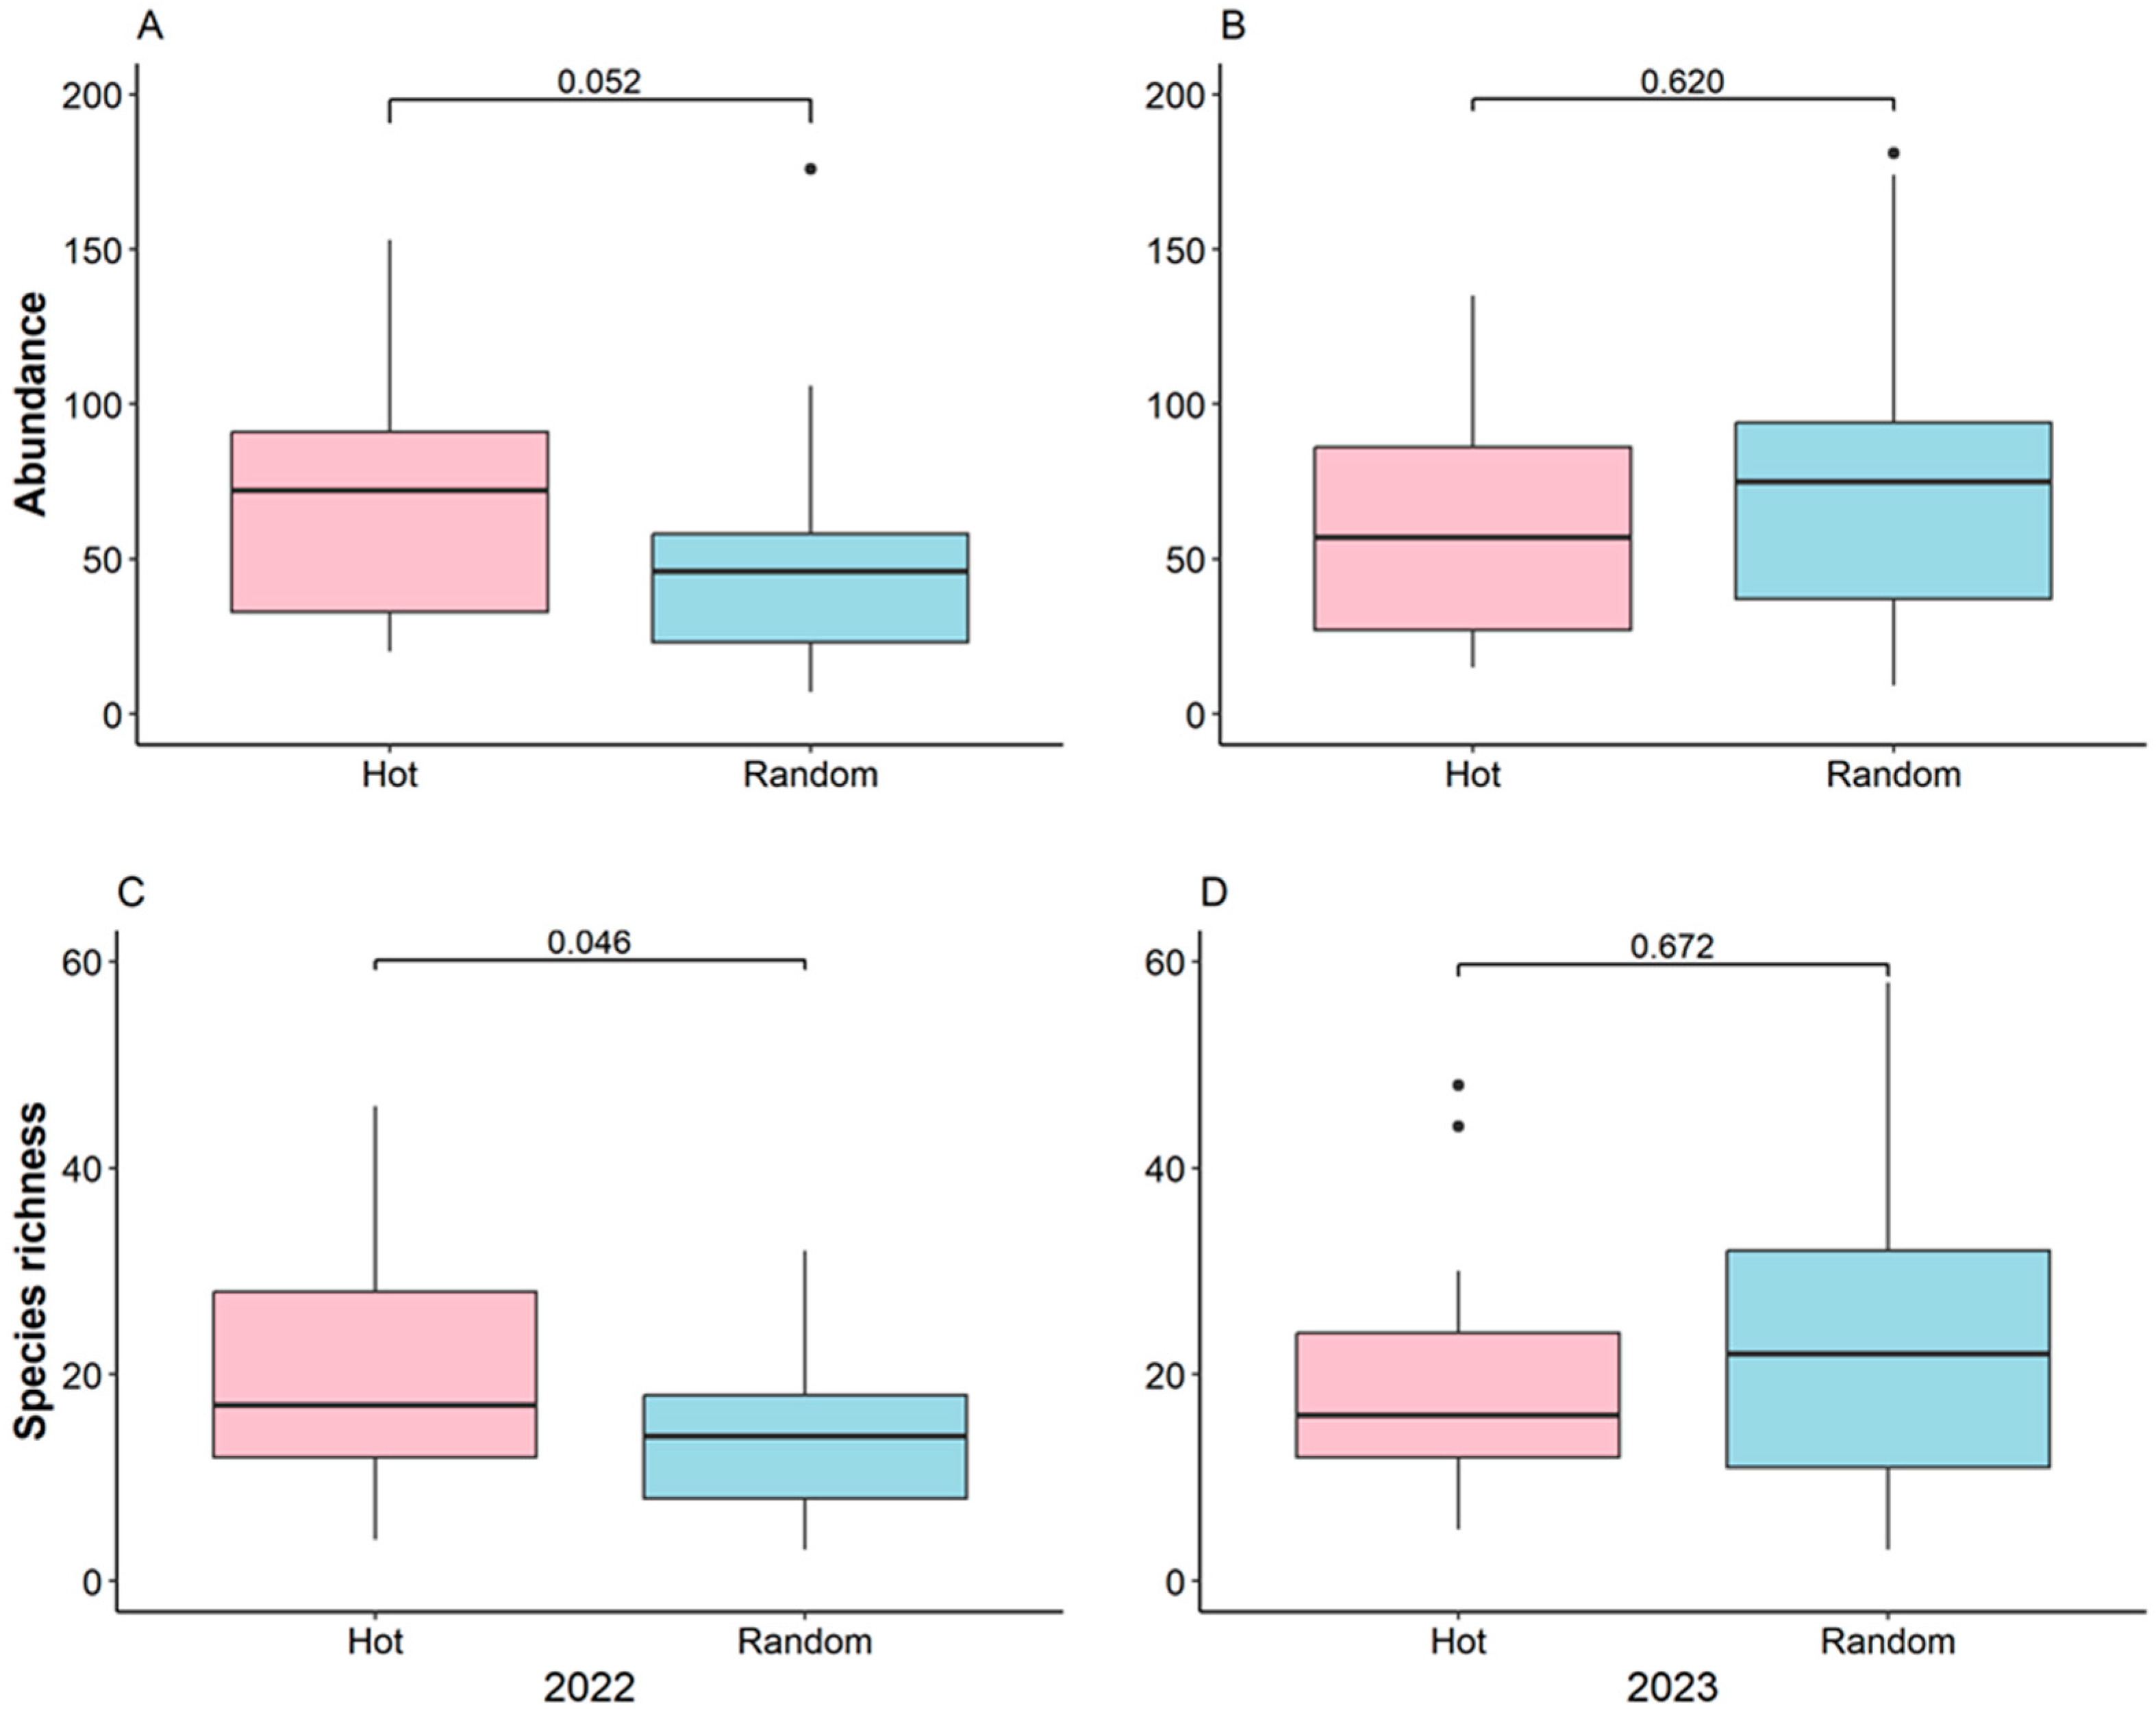
The total number of species, but not the abundance, was always higher in squares with high Goshawk activity (hotspots) than in random squares (Table 2). According to the logistic regression analysis of bird mapping data, bird abundance was nearly significantly higher in Goshawk activity hotspots than in random squares, and the effect of year was also nearly significant (Table 3). In 2022, there were more birds in Goshawk hotspots (i.e., grid squares with high Goshawk activity) than in random squares, however, no such difference was detected in 2023 (Figure 3). Avian species richness had a nearly significant effect on the distribution of Goshawk activity and its interaction with year had a similar effect (Table 3); species richness was significantly higher at Goshawk hotspots in 2022 but not in 2023 (Figure 3). Similar tendencies were detected for the abundances (2022: t = 1.79, p = 0.081; 2023: t = 0.54; p = 0.59) and species richness (2022: t = 1.58, p = 0.121; 2023: t = 0.43; p = 0.672) of ‘local’ birds (Table 3). However, the abundances (2022: t = 0.84, p = 0.631; 2023: t = 0.78; p = 0.438) or species richness of medium-sized birds had no effect on Goshawk activity (2022: t = 1.07, p = 0.292; 2023: t = 0.14; p = 0.886; Table 3).
In the analysis of occasional data, we did not detect an effect of total avian abundance (F3,130 = 2.1, p = 0.101) or species richness (F3,130 = 2.0, p = 0.121) on the number of Goshawk fixes in grid squares (Table 4). Additionally, there was no significant interaction with year (Table 4). Similarly, we did not detect any effects when years were analysed separately (Figure 4). We did not detect an effect of bird abundance (F3,114 = 2.1, p = 0.102; 2022: F1,28 = 0.04, p = 0.836; 2023: F1,86 = 1.02, p = 0.315) or richness (F3,114 = 2.2, p = 0.097; 2022: F 1,28 = 0.09, p = 0.771; 2023: F1,116 = 0.59, p = 0.445) when only medium-sized birds were included in the analysis.

4. Discussion

We used two different approaches to study associations between Goshawk and its prey in urban environments. In the first approach, via direct mapping, we detected a positive association in one winter but not in another. In the second approach, using occasional observations of birdwatchers, we did not detect associations between these parameters.
To address the limitations of short-term studies, we conducted this study over two winters. Variations across years may reflect the effects of weather or other features of particular winters. Furthermore, the results might have been affected by the different period of tracking and the different number (and age) of the tracked birds. However, such effects would have been detected consistently using both approaches whereas we detected differences between years only in our own mapping-based inventories but not in the analysis of citizen-collected data. This suggests that methodological differences influenced our results. Notably, total species richness (but not abundance) in both study winters was higher in Goshawk activity hotspots than in control plots.
Data for avian abundance and distribution collected by citizen scientists did not show any association with Goshawk activity centres in the first study year, which is different from the results of our mapping analysis. The citizen-collected data were rather limited in the first study winter and a substantial amount of information had to be discarded owing to the restricted spatial distribution and lack of spatial overlap with tracking data. Citizen science has other limitations, including the limited skills of participants and biases related to data collection [28,29], which could explain the conflicting results obtained via the two approaches. Evaluations of these limitations are beyond the scope of our paper, however, we stress that citizen-collected data should be analysed with caution and, if possible, results should be validated using another methodology.
Our mapping approach indicated that bird abundance and richness were significantly higher in Goshawk activity centres than in random plots in the first study season but not in the second season. The dataset for 2021/2022 was limited to late winter (i.e., February). The study period in 2021/2022 was temporally restricted and the detected association indicated a direct spatial link between Goshawk individuals and prey. In the next winter, Goshawk data were collected for 3 months, from the beginning of November to early February, and the spatial distribution of activity centres was therefore broader. Although most of the detected hotpots were the same throughout the winter, bird mapping in February may have not fully represented associations in earlier months. It is unclear why medium-sized birds, which are preferable prey for Goshawks, had no effect on its activity. The most plausible explanation is the substantially smaller sample size of this group.
Raptors are well-known indicators of biodiversity and viable ecosystems; prioritisation of conservation efforts based on their occurrence is likely to provide broad ecosystem benefits [10]. However, the efficiency of raptors as biodiversity indicators has been criticised owing to inconsistent results [36,37,38]. Our study, using two different approaches, suggests that conflicting results can be explained, at least in part, by methodological differences.
Raptors have been used as bioindicators at different spatial scales. On one hand, nest sites of raptors often indicate biodiversity at the microhabitat level by indirect non-causative links. For example, Goshawk nests built in diverse old-growth forest stands rich in diverse taxa, such as trees, wood-decaying fungi and butterflies [11,12,13]. Breeding sites of Goshawks could also serve as a useful conservation surrogate for the species richness and functional diversity of wintering birds [18]. However, this association is only correlational and it may be weaker when habitat selection by raptors differs from that of other birds [18]. On the other hand, foraging activity connects raptors directly with taxa at lower trophic levels. As many raptors cover long distances or use spatially distant sites while foraging, their movement and presence/absence data indicate ecosystem quality at the landscape (macrohabitat) scale [16,39]. However, in addition to the distribution of prey, which is determined by habitat suitability, other environmental factors, such as weather or wind conditions and the distribution of perching sites, shape the distribution of raptors [40,41,42]. Furthermore, intra-specific interactions, such as competition and territorialism, should be considered in data analyses. In our study, untracked Goshawks may have held territories in the western part of the town, preventing foraging by tracked Goshawks in this area.

5. Conclusions

Our data suggested that Goshawk movement patterns are potential indicators of the abundance and diversity of prey, however, the results depended on the methodological approach and should be validated in a longer survey. We emphasise that relatively costly GPS tracking can hardly be suggested as a method for bioindication; instead, information on Goshawk (or other predators’) activity centres may be collected via observations by citizen scientists. Although citizen science is a promising source of data for scientific research and conservation purposes, inconsistency in data acquisition may limit its use. Our results support the view that the employment of predators as bioindicators is justified but the interpretation of results requires appropriate caution [10].

Author Contributions

Conceptualisation, Ü.V.; methodology, Ü.V.; validation, Ü.V. and P.M. (Paweł Mirski); formal analysis, Ü.V.; investigation, Ü.V., J.G., P.M. (Pelle Mellov) and T.T.; resources, Ü.V.; data curation, Ü.V.; writing—original draft preparation, Ü.V.; writing—review and editing, P.M. (Paweł Mirski); visualisation, Ü.V. and P.M. (Paweł Mirski); project administration, Ü.V.; supervision, Ü.V.; funding acquisition, Ü.V. All authors have read and agreed to the published version of the manuscript.

Funding

This research was funded by the Estonian Environmental Investments Fund, grant number 18473 and by the Estonian University of Life Sciences, grant number P180271.

Institutional Review Board Statement

Not applicable.

Data Availability Statement

The data collected in bird inventories and occasional records are deposited in the PlutoF data repository and available at https://plutof.ut.ee/ (accessed on 1 April 2023). The movement data of raptors is deposited in the Movebank data repository https://www.movebank.org/ (accessed on 1 April 2023).

Acknowledgments

We are grateful to Urmas Abel, Madis Leivits and Urmas Sellis who helped to trap and tag the most informative Goshawk in 2019, and to Anni Miller and Lisell Toomla who assisted us in bird mapping. Our sincere thanks go also to all birdwatchers whose observations made the current study possible.

Conflicts of Interest

The authors declare no conflict of interest.

References

  1. Grimm, N.B.; Faeth, S.H.; Golubiewski, N.E.; Redman, C.L.; Wu, J.; Bai, X.; Briggs, J.M. Global Change and the Ecology of Cities. Science 2008, 319, 756–760. [Google Scholar] [CrossRef] [Green Version]
  2. Miller, J.R.; Hobbs, R.J. Conservation Where People Live and Work. Conserv. Biol. 2002, 16, 330–337. [Google Scholar] [CrossRef] [Green Version]
  3. Shochat, E.; Lerman, S.B.; Anderies, J.M.; Warren, P.S.; Faeth, S.H.; Nilon, C.H. Invasion, Competition, and Biodiversity Loss in Urban Ecosystems. BioScience 2010, 60, 199–208. [Google Scholar] [CrossRef] [Green Version]
  4. Marzluff, J.M. Worldwide Urbanization and Its Effects on Birds. In Avian Ecology and Conservation in an Urbanizing World; Marzluff, J.M., Bowman, R., Donnelly, R., Eds.; Springer: Boston, MA, USA, 2001; pp. 19–47. ISBN 978-1-4615-1531-9. [Google Scholar]
  5. Savard, J.-P.L.; Clergeau, P.; Mennechez, G. Biodiversity Concepts and Urban Ecosystems. Landsc. Urban Plan. 2000, 48, 131–142. [Google Scholar] [CrossRef]
  6. Paoletti, M.G. Using Bioindicators Based on Biodiversity to Assess Landscape Sustainability. Agric. Ecosyst. Environ. 1999, 74, 1–18. [Google Scholar] [CrossRef] [Green Version]
  7. Faeth, S.H.; Bang, C.; Saari, S. Urban Biodiversity: Patterns and Mechanisms. Ann. N. Y. Acad. Sci. 2011, 1223, 69–81. [Google Scholar] [CrossRef] [PubMed] [Green Version]
  8. Caro, T.M.; O’Doherty, G. On the Use of Surrogate Species in Conservation Biology. Conserv. Biol. 1999, 13, 805–814. [Google Scholar] [CrossRef]
  9. Sergio, F.; Caro, T.; Brown, D.; Clucas, B.; Hunter, J.; Ketchum, J.; McHugh, K.; Hiraldo, F. Top Predators as Conservation Tools: Ecological Rationale, Assumptions, and Efficacy. Annu. Rev. Ecol. Evol. Syst. 2008, 39, 1–19. [Google Scholar] [CrossRef] [Green Version]
  10. Natsukawa, H.; Sergio, F. Top Predators as Biodiversity Indicators: A Meta-Analysis. Ecol. Lett. 2022, 25, 2062–2075. [Google Scholar] [CrossRef]
  11. Sergio, F.; Newton, I.; Marchesi, L. Conservation: Top Predators and Biodiversity. Nature 2005, 436, 192. [Google Scholar] [CrossRef] [Green Version]
  12. Ozaki, K.; Isono, M.; Kawahara, T.; Iida, S.; Kudo, T.; Fukuyama, K. A Mechanistic Approach to Evaluation of Umbrella Species as Conservation Surrogates. Conserv. Biol. 2006, 20, 1507–1515. [Google Scholar] [CrossRef] [PubMed]
  13. Burgas, D.; Byholm, P.; Parkkima, T. Raptors as Surrogates of Biodiversity along a Landscape Gradient. J. Appl. Ecol. 2014, 51, 786–794. [Google Scholar] [CrossRef]
  14. Senzaki, M.; Yamaura, Y.; Nakamura, F. The Usefulness of Top Predators as Biodiversity Surrogates Indicated by the Relationship between the Reproductive Outputs of Raptors and Other Bird Species. Biol. Conserv. 2015, 191, 460–468. [Google Scholar] [CrossRef]
  15. Kenward, R. The Goshawk; T & AD Poyser: Berkhamsted, UK, 2006; ISBN 978-0-7136-6565-9. [Google Scholar]
  16. Mirski, P.; Grosberg, J.; Kull, T.; Mellov, P.; Tõnisalu, G.; Väli, V.; Väli, Ü. Movement of avian predators points to biodiversity hotspots in agricultural landscape. Ecol. Ind. in press.
  17. Natsukawa, H. Raptor Breeding Sites as a Surrogate for Conserving High Avian Taxonomic Richness and Functional Diversity in Urban Ecosystems. Ecol. Indic. 2020, 119, 106874. [Google Scholar] [CrossRef]
  18. Natsukawa, H. Raptor Breeding Sites Indicate High Taxonomic and Functional Diversities of Wintering Birds in Urban Ecosystems. Urban For. Urban Green. 2021, 60, 127066. [Google Scholar] [CrossRef]
  19. Jokimäki, J.; Suhonen, J.; Inki, K.; Jokinen, S. Biogeographical Comparison of Winter Bird Assemblages in Urban Environments in Finland. J. Biogeogr. 1996, 23, 379–386. [Google Scholar] [CrossRef]
  20. Tornberg, R.; Korpimäki, E.; Byholm, P. Ecology of the Northern Goshawk in Fennoscandia. Stud. Avian Biol. 2006, 31, 141–157. [Google Scholar]
  21. Järvinen, O.; Väisanen, R. Quantitative Biogeography of Finnish Land Birds as Compared with Regionality in Other Taxa. Ann. Zool. Fenn. 1980, 17, 67–85. [Google Scholar]
  22. Goławski, A.; Dombrowski, A. The Effects of Weather Conditions on the Numbers of Wintering Birds and the Diversity of Their Assemblages in Villages and Crop Fields in East-Central Poland. Ital. J. Zool. 2011, 78, 364–369. [Google Scholar] [CrossRef] [Green Version]
  23. Tryjanowski, P.; Sparks, T.H.; Biaduń, W.; Brauze, T.; Hetmański, T.; Martyka, R.; Skórka, P.; Indykiewicz, P.; Myczko, Ł.; Kunysz, P.; et al. Winter Bird Assemblages in Rural and Urban Environments: A National Survey. PLoS ONE 2015, 10, e0130299. [Google Scholar] [CrossRef]
  24. Zimaroyeva, A.A.; Matsyura, A.V.; Jankowsky, K. Spatial Patterns of Habitat Distribution of Corvidae (the Case of Urban-Rural Gradient). Biosyst. Divers. 2016, 24, 451–458. [Google Scholar] [CrossRef] [Green Version]
  25. Jeltsch, F.; Bonte, D.; Pe’er, G.; Reineking, B.; Leimgruber, P.; Balkenhol, N.; Schröder, B.; Buchmann, C.M.; Mueller, T.; Blaum, N.; et al. Integrating Movement Ecology with Biodiversity Research—Exploring New Avenues to Address Spatiotemporal Biodiversity Dynamics. Mov. Ecol. 2013, 1, 6. [Google Scholar] [CrossRef] [PubMed] [Green Version]
  26. Dickinson, J.L.; Shirk, J.; Bonter, D.; Bonney, R.; Crain, R.L.; Martin, J.; Phillips, T.; Purcell, K. The Current State of Citizen Science as a Tool for Ecological Research and Public Engagement. Front. Ecol. Environ. 2012, 10, 291–297. [Google Scholar] [CrossRef] [PubMed] [Green Version]
  27. Bonney, R.; Shirk, J.L.; Phillips, T.B.; Wiggins, A.; Ballard, H.L.; Miller-Rushing, A.J.; Parrish, J.K. Next Steps for Citizen Science. Science 2014, 343, 1436–1437. [Google Scholar] [CrossRef] [PubMed]
  28. Fraisl, D.; Hager, G.; Bedessem, B.; Gold, M.; Hsing, P.-Y.; Danielsen, F.; Hitchcock, C.B.; Hulbert, J.M.; Piera, J.; Spiers, H.; et al. Citizen Science in Environmental and Ecological Sciences. Nat. Rev. Methods Prim. 2022, 2, 64. [Google Scholar] [CrossRef]
  29. Dickinson, J.L.; Zuckerberg, B.; Bonter, D.N. Citizen Science as an Ecological Research Tool: Challenges and Benefits. Annu. Rev. Ecol. Evol. Syst. 2010, 41, 149–172. [Google Scholar] [CrossRef] [Green Version]
  30. Chandler, M.; See, L.; Copas, K.; Bonde, A.M.Z.; López, B.C.; Danielsen, F.; Legind, J.K.; Masinde, S.; Miller-Rushing, A.J.; Newman, G.; et al. Contribution of Citizen Science towards International Biodiversity Monitoring. Biol. Conserv. 2017, 213, 280–294. [Google Scholar] [CrossRef] [Green Version]
  31. Pocock, M.J.O.; Chandler, M.; Bonney, R.; Thornhill, I.; Albin, A.; August, T.; Bachman, S.; Brown, P.M.J.; Cunha, D.G.F.; Grez, A.; et al. A Vision for Global Biodiversity Monitoring With Citizen Science. Adv. Ecol. Res. 2018, 59, 169–223. [Google Scholar] [CrossRef]
  32. McKinley, D.C.; Miller-Rushing, A.J.; Ballard, H.L.; Bonney, R.; Brown, H.; Cook-Patton, S.C.; Evans, D.M.; French, R.A.; Parrish, J.K.; Phillips, T.B.; et al. Citizen Science Can Improve Conservation Science, Natural Resource Management, and Environmental Protection. Biol. Conserv. 2017, 208, 15–28. [Google Scholar] [CrossRef] [Green Version]
  33. Statistics Estonia Weather. Available online: https://andmed.stat.ee/en/stat (accessed on 23 May 2023).
  34. Landboard Estonian Topographic Database. Available online: https://geoportaal.maaamet.ee/eng/Spatial-Data/Estonian-Topographic-Database-p305.html (accessed on 15 April 2023).
  35. Abarenkov, K.; Tedersoo, L.; Nilsson, R.H.; Vellak, K.; Saar, I.; Veldre, V.; Parmasto, E.; Prous, M.; Aan, A.; Ots, M.; et al. Plutof-a Web Based Workbench for Ecological and Taxonomic Research, with an Online Implementation for Fungal Its Sequences. Evol. Bioinform. 2010, 2010, 189–196. [Google Scholar] [CrossRef]
  36. Cabeza, M.; Arponen, A.; Van Teeffelen, A. Top Predators: Hot or Not? A Call for Systematic Assessment of Biodiversity Surrogates. J. Appl. Ecol. 2008, 45, 976–980. [Google Scholar] [CrossRef]
  37. Roth, T.; Weber, D. Top Predators as Indicators for Species Richness? Prey Species Are Just as Useful. J. Appl. Ecol. 2008, 45, 987–991. [Google Scholar] [CrossRef]
  38. Santangeli, A.; Girardello, M. The Representation Potential of Raptors for Globally Important Nature Conservation Areas. Ecol. Indic. 2021, 124, 107434. [Google Scholar] [CrossRef]
  39. Väli, Ü.; Mirski, P.; Sein, G.; Abel, U.; Tõnisalu, G.; Sellis, U. Movement Patterns of an Avian Generalist Predator Indicate Functional Heterogeneity in Agricultural Landscape. Landsc. Ecol. 2020, 35, 1667–1681. [Google Scholar] [CrossRef]
  40. Murgatroyd, M.; Photopoulou, T.; Underhill, L.G.; Bouten, W.; Amar, A. Where Eagles Soar: Fine-Resolution Tracking Reveals the Spatiotemporal Use of Differential Soaring Modes in a Large Raptor. Ecol. Evol. 2018, 8, 6788–6799. [Google Scholar] [CrossRef] [PubMed]
  41. Krone, O.; Treu, G. Movement Patterns of White-Tailed Sea Eagles near Wind Turbines. J. Wildl. Manag. 2018, 82, 1367–1375. [Google Scholar] [CrossRef]
  42. Mirski, P.; Väli, Ü. Movements of Birds of Prey Reveal the Importance of Tree Lines, Small Woods and Forest Edges in Agricultural Landscapes. Landsc. Ecol. 2021, 36, 1409–1421. [Google Scholar] [CrossRef]
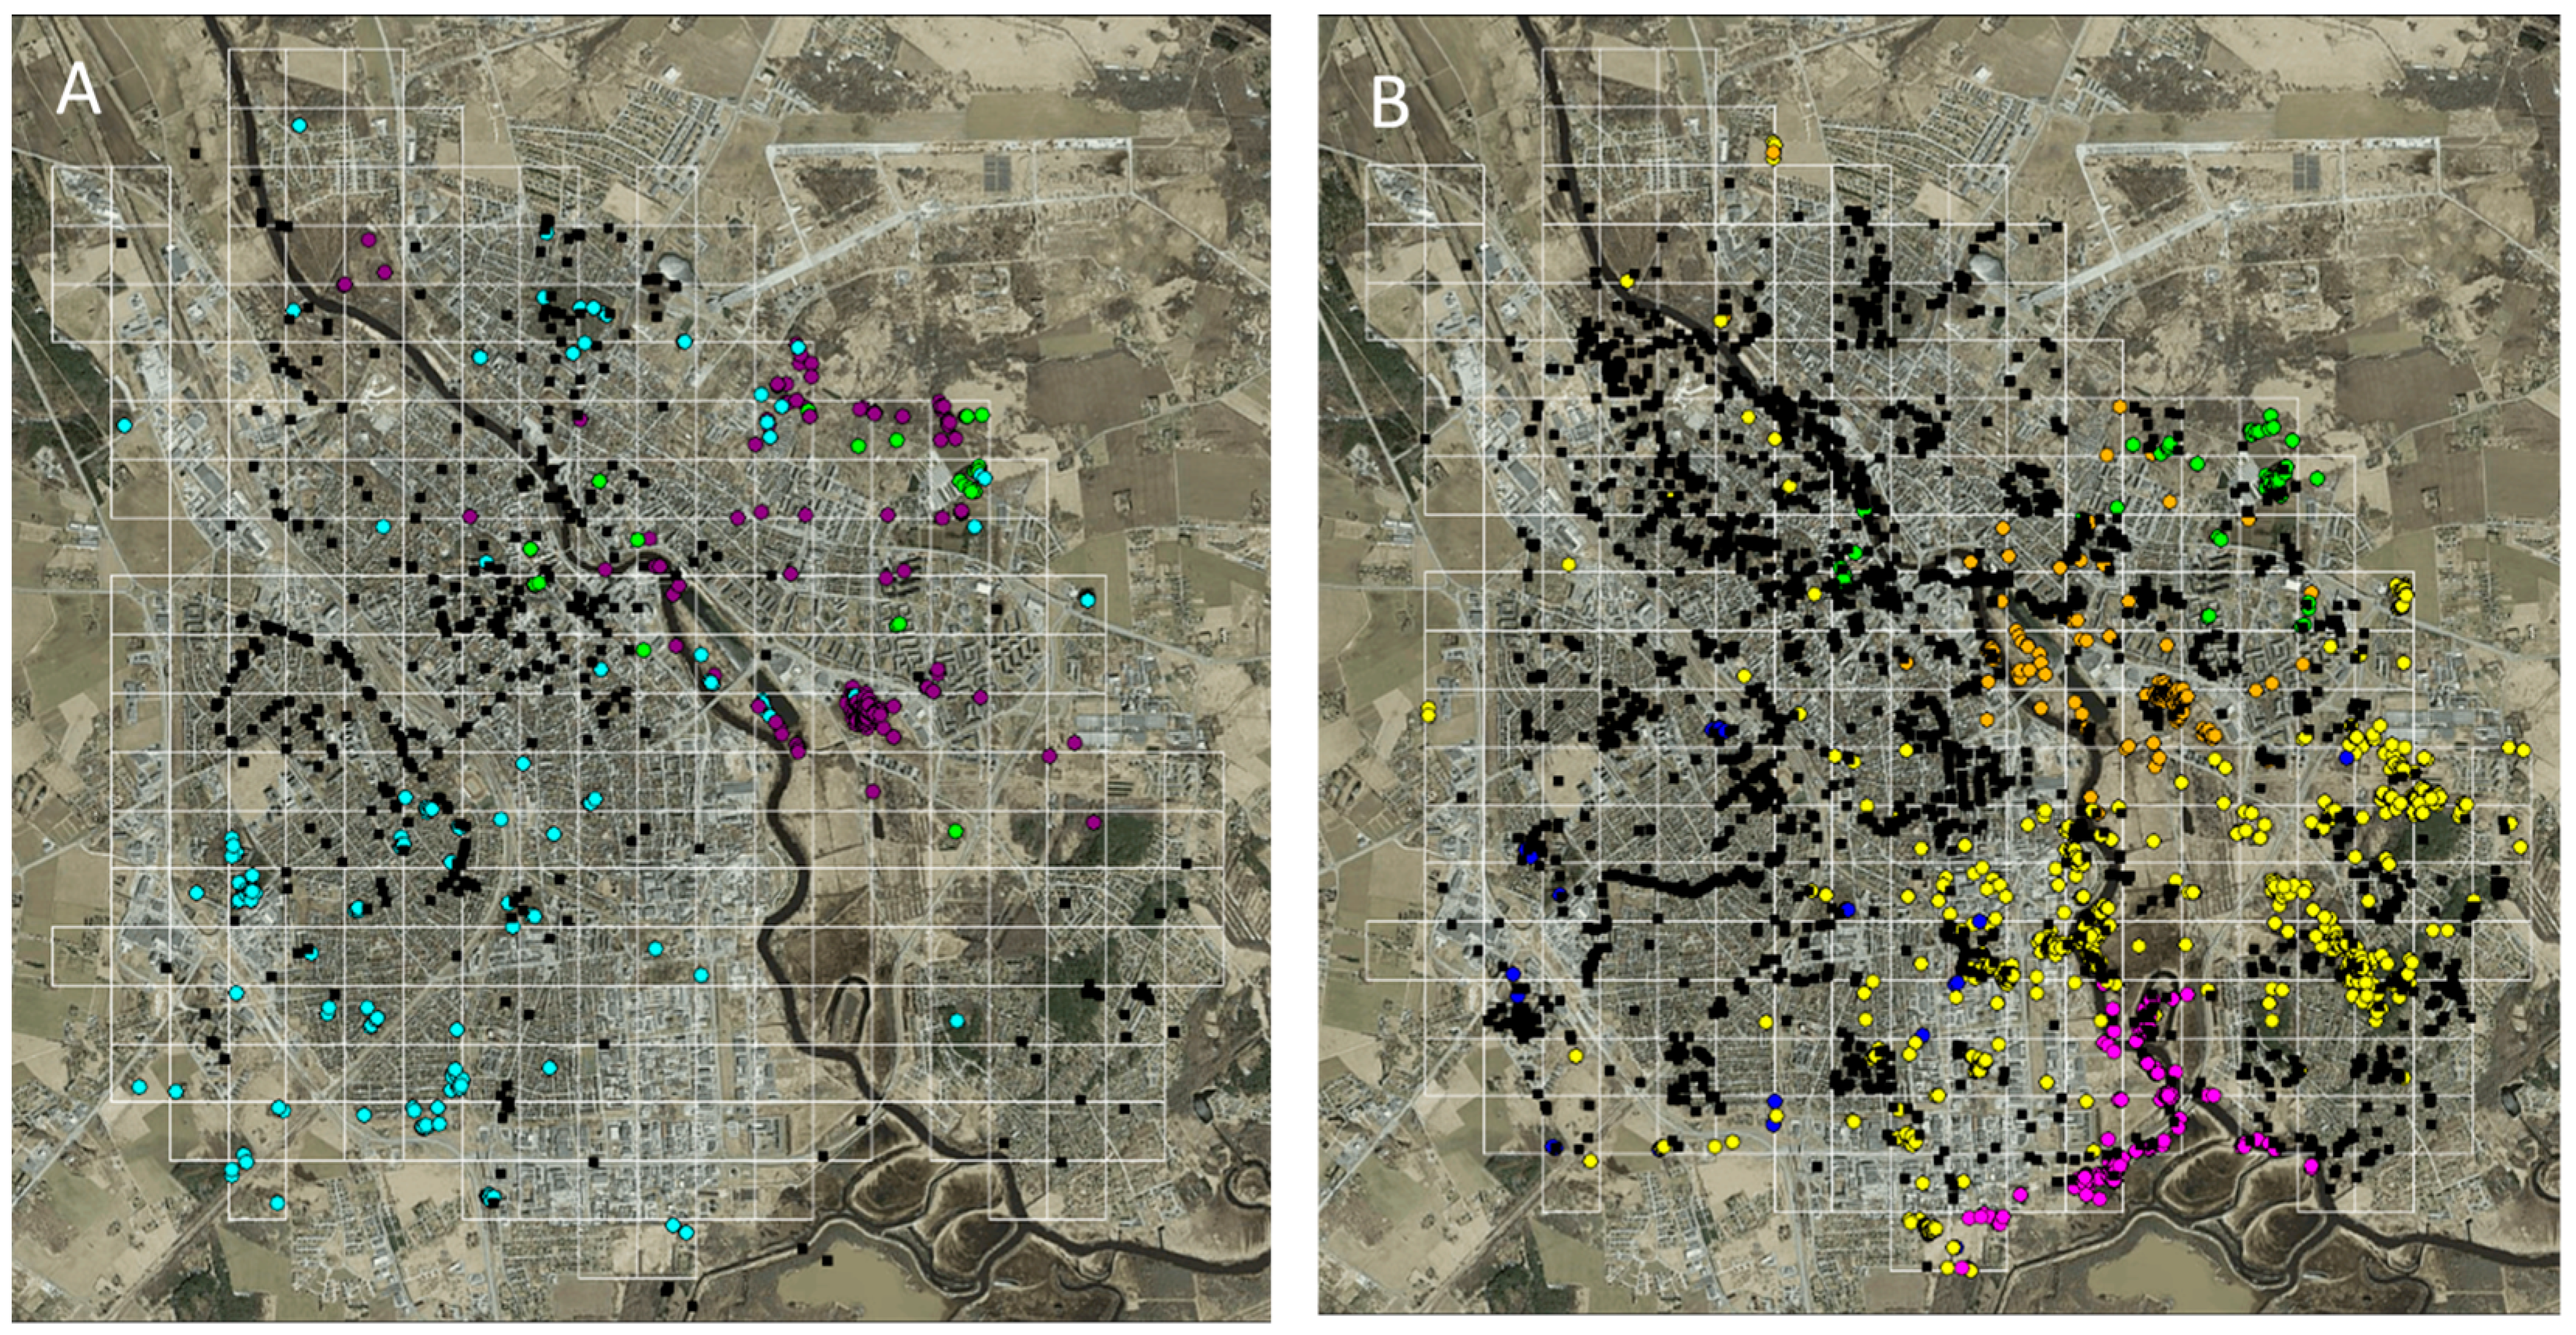
Figure 1. Citizen-collected occasional bird observations (black squares) and registered locations of Goshawks (circles, where individuals are shown in different colours) in (A) February 2022 and (B) November–February 2022/2023.
Diversity 15 00749 g001
Figure 2. Distribution and consistency of Goshawk activity hotspots and the distribution of control plots in the winter 2022/2023.
Diversity 15 00749 g002
Figure 3. (A,B) Mapping-based abundance and (C,D) species richness of wintering birds in 2022 (A,C) and in 2023 (B,D) in the grid squares with high Goshawk activity (hotspots) and in random squares in Tartu. The bold line indicates the median, the box shows quartiles, the whiskers indicate the extreme data points within 1.5× the interquartile range from the quartile boundaries and dots are data points beyond that range. p-values for univariate logistic regression models are indicated in brackets.
Diversity 15 00749 g003
Figure 4. (A,B) Citizen-collected abundance and (C,D) species richness of wintering birds in 2022 (A,C) and in 2023 (B,D) in grid squares of Tartu in relation to the number of registered Goshawk locations.
Diversity 15 00749 g004
Table 1. Age, sex, tracking period and number of GPS-fixes of tracked Goshawks.
Logger No.AgeSexTracking WinterNo. of GPS-Fixes
171095AdultMale2021/202247
190723ImmatureMale2021/2022205
190725ImmatureMale2021/2022239
171095AdultMale2022/202360
190703AdultMale2022/2023146
190728AdultMale2022/202330
212340AdultMale2022/2023853
212347AdultFemale2022/2023215
Table 2. Total numbers of bird individuals and species counted via direct mapping and recorded occasionally by birdwatchers.
YearSquare TypeAll BirdsMedium-Sized Birds“Local” Birds
AbundanceSpecies RichnessAbundanceSpecies RichnessAbundanceSpecies Richness
Mapping data
2022Hotspot16363074612150529
2022Random15082793511139927
2023Hotspot15133563114141333
2023Random18152858011170426
Occasional data
2022 794656536523
2023 17299691038228
Table 3. Logistic regression models describing the effect of avian abundance and species richness (both variables log-transformed) on grid square type (Goshawk activity hotpots vs. random squares).
VariableEstimateSEtp
All birds
Intercept−1801.11051.1−1.710.090
Abundance440.1262.51.680.097
Year0.90.51.710.090
Abundance × Year−0.20.1−1.680.097
Intercept−1680.5945.0−1.780.079
Species richness593.4335.71.770.080
Year0.80.51.780.079
Species richness × Year−0.30.2−1.770.081
‘Local’ birds
Intercept−1553.7978.9−1.590.116
Abundance388.3250.01.550.124
Year0.80.51.590.116
Abundance × Year−0.20.1−1.550.124
Intercept−1051.2834.4−1.260.211
Species richness381.3306.21.250.216
Year0.50.41.260.211
Species richness × Year−0.20.2−1.250.216
Medium-sized birds
Intercept−4.2532.6−0.010.994
Abundance−37.9180.0−0.210.834
Year0.00.30.010.993
Abundance × Year0.00.10.210.834
(Intercept)−495.1515.8−0.960.340
Species richness245.6284.70.860.391
Year0.20.30.960.339
Species richness × Year−0.10.1−0.860.391
Table 4. Linear regression models describing the effect of avian abundance and species richness (both variables log-transformed) on Goshawk activity (number of GPS-fixes in grid squares).
VariableEstimateSEtp
All birds
Intercept0.30.31.260.209
Abundance0.00.10.000.997
Year0.40.31.310.194
Abundance × Year−0.10.2−0.460.643
Intercept−516.2412.8−1.250.213
Species richness−39.8558.3−0.070.943
Year0.30.21.250.213
Species richness × Year0.00.30.070.943
Medium-sized birds
Intercept0.30.21.330.185
Abundance0.00.10.150.879
Year0.40.31.610.109
Abundance × Year−0.10.2−0.710.480
Intercept−799.3452.2−1.770.080
Species richness624.1978.50.640.525
Year0.40.21.770.080
Species richness × Year−0.30.5−0.640.525
Disclaimer/Publisher’s Note: The statements, opinions and data contained in all publications are solely those of the individual author(s) and contributor(s) and not of MDPI and/or the editor(s). MDPI and/or the editor(s) disclaim responsibility for any injury to people or property resulting from any ideas, methods, instructions or products referred to in the content.