Article

Intertidal Gleaning Exclusion as a Trigger for Seagrass Species and Fauna Recovery and Passive Seagrass Rehabilitation

by
Tsiaranto Felan-Ratsimba Fanoro
1,2,3,
Maria Perpétua Scarlet
1 and
Salomão Olinda Bandeira
1,*
1
Department of Biological Sciences, Eduardo Mondlane University, Maputo 1100, Mozambique
2
Faculty of Agronomy and Forestry Engineering, Eduardo Mondlane University, Maputo 1100, Mozambique
3
Leibniz Centre for Tropical Marine Research, Fahrenheitstraße 6, 28359 Bremen, Germany
*
Author to whom correspondence should be addressed.
Diversity 2023, 15(6), 772; https://doi.org/10.3390/d15060772
Submission received: 2 April 2023 / Revised: 22 May 2023 / Accepted: 29 May 2023 / Published: 13 June 2023
(This article belongs to the Section Marine Diversity)

Abstract

:
This study evaluates gleaning exclusion as an approach for the rehabilitation of seagrass ecosystems and as an option for important intertidal resource management that contributes to the social well-being of communities. The monitoring of seagrass plant and invertebrate recovery after the implementation of gleaning exclusion was conducted over 50 plots of 5 m × 5 m each, which were settled in the seagrass meadow of NW Maputo Bay, Mozambique. The exclusion experiment was designed to compensate for the important loss of seagrass in the area due to gleaning activity characterized mainly by digging and revolving sediments to collect mostly clams. Results showed that, in general, seagrass plant shoot density started having significant positive recovery after five months: three months for Halophila ovalis, five months for Halodule uninvervis, and much more time (>six months) for the IUCN Red List endangered Zostera capensis. For invertebrates, 194 individual invertebrates were collected belonging to 13 species. Solen cylindraceus was the most dominant edible invertebrate species in the local community, and Dosinia hepatica for non-edible species. The result of the experiment showed a positive recovery in the abundance and diversity of invertebrates. The results support previous findings, suggesting that the installation of a no-take zone can enhance the health of an ecosystem. Therefore, to limit the violation and conflicts of the no-take zones, the creation of alternative activities for harvesters and the flexibility of restrictions are vital. Further investigation should be considered to obtain an effective management of the zones, including documentation of species, gleaning practices, and an effective restoration of seagrass meadows.

1. Introduction

Seagrasses are marine angiosperms forming an important coastal ecosystem with multiple ecological, services, and social functions [1,2,3], including providing shelter, stabilizing sediment resulting in reduced water turbidity, sequestering carbon for climate change mitigation, taking up a nursery role allowing for the breeding of food and nutrients for fish and invertebrate communities, including many species of value for commercial or subsistence fisheries [4,5]. In the Western Indian Ocean region, seagrass meadows form a hotspot of plant and animal diversity and support the harvesting of invertebrates [6,7]. Invertebrate gleaning (walking) fisheries are common in intertidal seagrass meadows globally, contributing to the food supply of hundreds of millions of people, but the understanding of these fisheries, their impacts, and their ecological drivers is limited. Gleaning, as a small-scale fishery practice or collection of benthic invertebrates or other animals from the substrate of the intertidal area during the spring tide period, has been an important and popular fishing method in intertidal areas from prehistoric times to the present day using none or simple tools such as sticks, stones or gardening hoes [6,7,8,9]. High concentration of fishing and destructive fisheries practices in Mozambique caused the reduction of resources along the coast of the country [10], and gleaning to harvest intertidal associated bivalves caused the loss of over 50% of seagrass coverage in Maputo Bay, Bairro dos Pescadores [11]. Notwithstanding, the causes of the ongoing decline of seagrass in Bairro dos Pescadores remain outside of management control. A significant increase in this activity has been reported [12], targeting bivalves, crustaceans, and gastropods [6]. Gleaners are mainly women, collecting for feeding purposes [2,13].
Gleaning activity is not considered a regular fishing practice [14], yet it secures food for low-income coastal communities, including Bairro dos Pescadores [1]. For the Western Indian Ocean (WIO) region, studies include survey investigations carried out in Tanzania and Inhaca Island; the results report a non-quantified reduction of harvestable species in seagrass and a non-enumerated decrease in seagrass coverage [6,15]. Few considerations have been given to demonstrate the magnitude of its effect on the ecosystem. However, gleaning is a driver in seagrass decline, and it is among the many threats to seagrasses; it negatively affects seagrass health, causing a decline in animal abundance, biomass, and species composition [6,7]. Regarding the ongoing decline of seagrasses, a restoration and rehabilitation approach has been applied to counterbalance coverage of significant loss [16]. Seagrass rehabilitation can be defined as the practice of an intentional activity that initiates or accelerates the recovery of seagrass in an area previously covered in seagrass. In Bairro dos Pescadores, transplantation restoration was previously suggested to reverse constant loss by clam gleaning [17]. Results showed a low survival rate in the long term due to continuous pressure in the area by means of invertebrate harvesting. The case study illustrated the need to tackle harvesting pressure in the first place to limit degradation. Understanding the temporal dynamics of seagrasses and the major influences on seagrass growth is critical for seagrass habitat conservation and administration [18]. Understanding the complexities of these fisheries, their role in facilitating food security, their drivers, and their sustainability is important for the support of effective conservation and for maintaining coastal livelihoods [2].
In addition, possible or practical anti-degradation approaches are given priority in conservation [7]. On that account, addressing the unbalanced exploitation and the installation of sustainable management is the key to solving the environmental and social crisis in Bairro dos Pescadores. The present investigation aims to evaluate the effectiveness of partial gleaning exclusion treatment as an approach for seagrass ecosystem rehabilitation as well as compare the seagrass structure and invertebrate community recovery under exclusion plots and examine the inter-species recovery between invertebrates and seagrasses. In addition, this study provides a management option for the seagrass conservation and gleaning of invertebrates. Furthermore, the conclusion of the survey will help design appropriate management models for the intertidal zone in the area and a model for other zones.

2. Materials and Methods

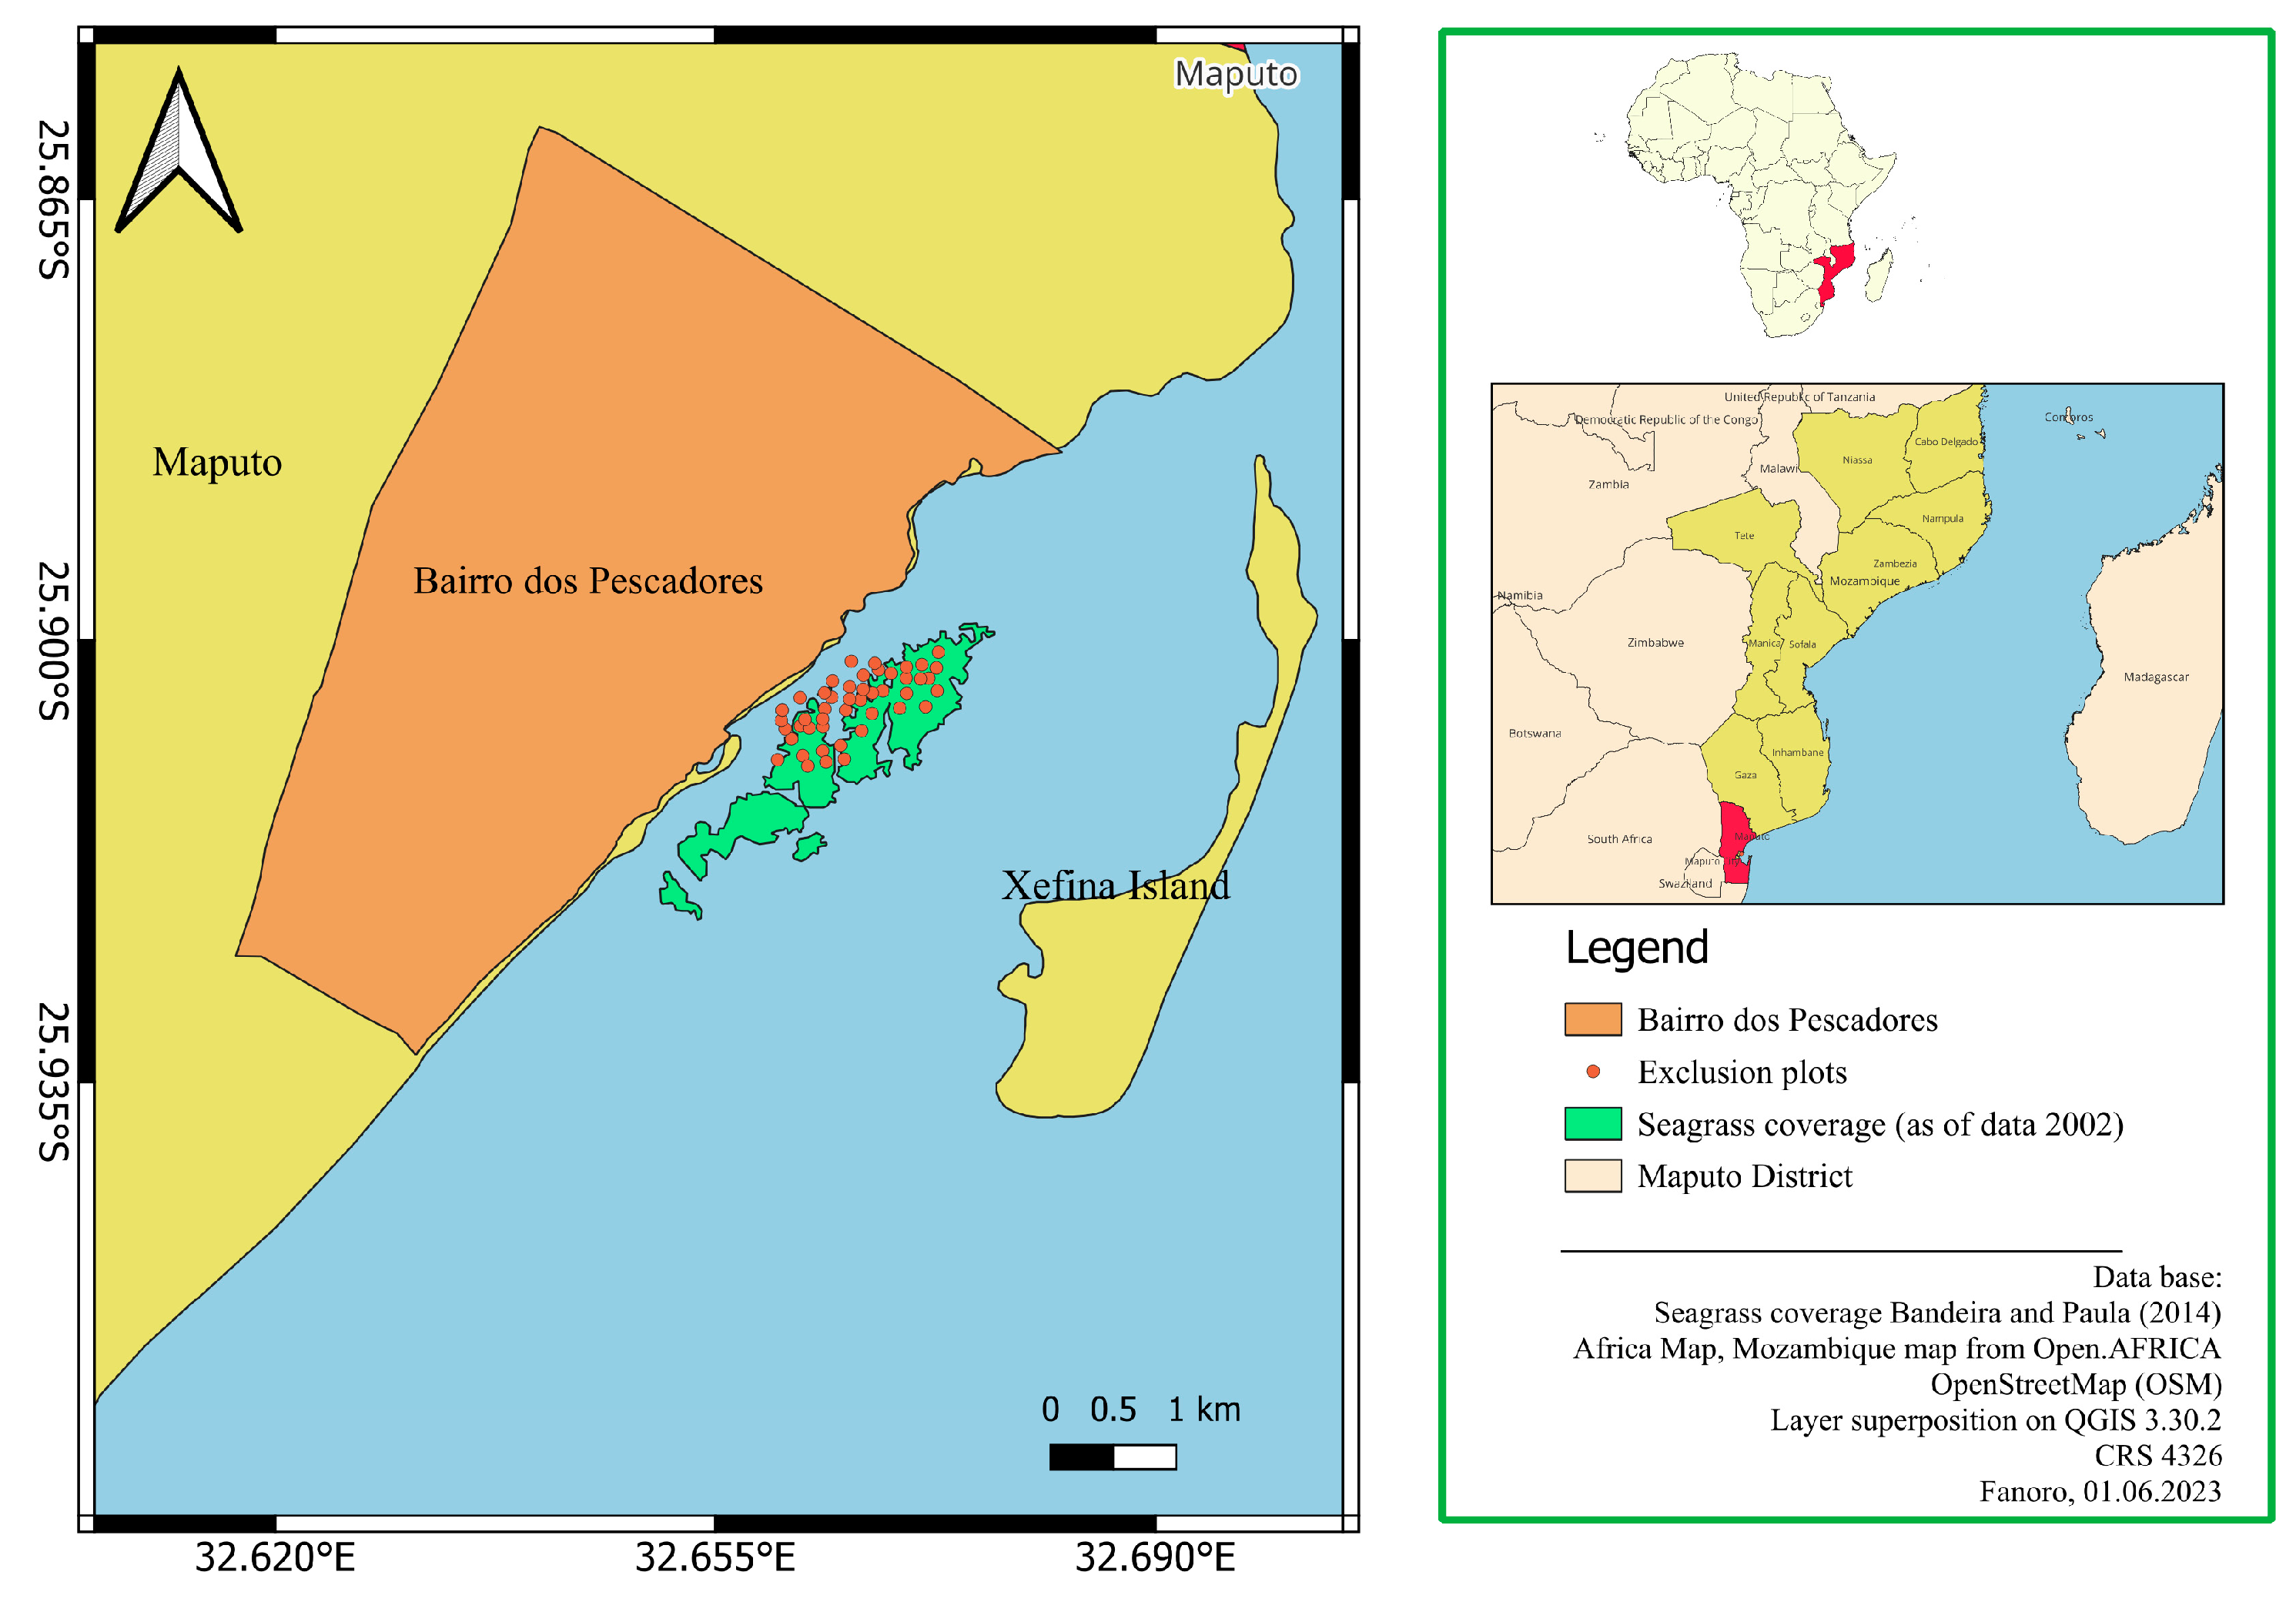
2.1. Location of the Study

This study was conducted in the western Maputo Bay, precisely at Bairro dos Pescadores (25°50′46″ S and 32°39′42″ E) (Figure 1), located within the peri-urban area, approximately 12 km north of Maputo city, capital of Mozambique. The experiments were directed from April to October 2020 in the inter-tidal zone of Bairro dos Pescadores. Maputo Bay has an average depth of up to 10 m [7]. Maputo Bay receives fresh water from six rivers: Incomati to the north, Tembe, Umbeluzi, Matola, and Mulauze Rivers to the west, and Maputo to the south. The intertidal zone spans a larger area to nearby Xefina Grande Island. The bay has semidiurnal tides [7], with a wind regime moving dominantly from the South East to the East during the hot season (October–March) and mainly from the North East during cold periods (June–August). The area is under a sub-tropical climate; seasons are wet–hot, alternating with dry–cool season.
The ecosystem in the intertidal zone of Bairro dos Pescadores consists of mixed submerged aquatic vegetation composed of seagrass plants [7]. The seagrass species are dominated by the petiolate leaf species Halophila ovalis (R. Brown) Hooker F., strap-leaved Halodule uninervis Aschers, constantly submerged Oceana serrulata (R. Brown) Byng & Christenhusz (former Cymodocea serrulata), and the endemic African eelgrass species Zostera capensis Setchell [19]. The study site was chosen due to the presence of extensive seagrass meadows and the proven recurrence of intertidal gleaning activity [7].

2.2. Methods

The research question was addressed using an in situ fieldwork experiment design, using both quantitative and qualitative methods.

2.2.1. Experimental Design

To assess the significance of seagrass-associated invertebrates, fifty squares of partial gleaning exclusion plots of 5 m × 5 m, distanced more than 50 m from one another, were settled using a random distribution system within the seagrass meadows. All fifty squares were demarcated using four wood pickets of 50 cm in each corner, buried down to 40 cm, and 10 cm remained above ground. In this paper, the plots are called “plots of exclusion”, where gleaning was prohibited and monitored. Prior to the fieldwork, gleaner communities were sensitized about the purpose of the no-take plots placed through informal conversations (cf. [20]). The unofficial conversations were conducted during the preliminary phase of the study as adapted from elsewhere [21] and were limited to gleaners that demanded the site during the low tide periods. Nine control plots, impacted by gleaning using digging and sand revolving of the seagrass meadows, were set haphazardly at least 20 m apart each within the study area in May 2023. Quadrates of 0.25 m × 0.25 m were set in an area intensely used for the collection of clams and snails.

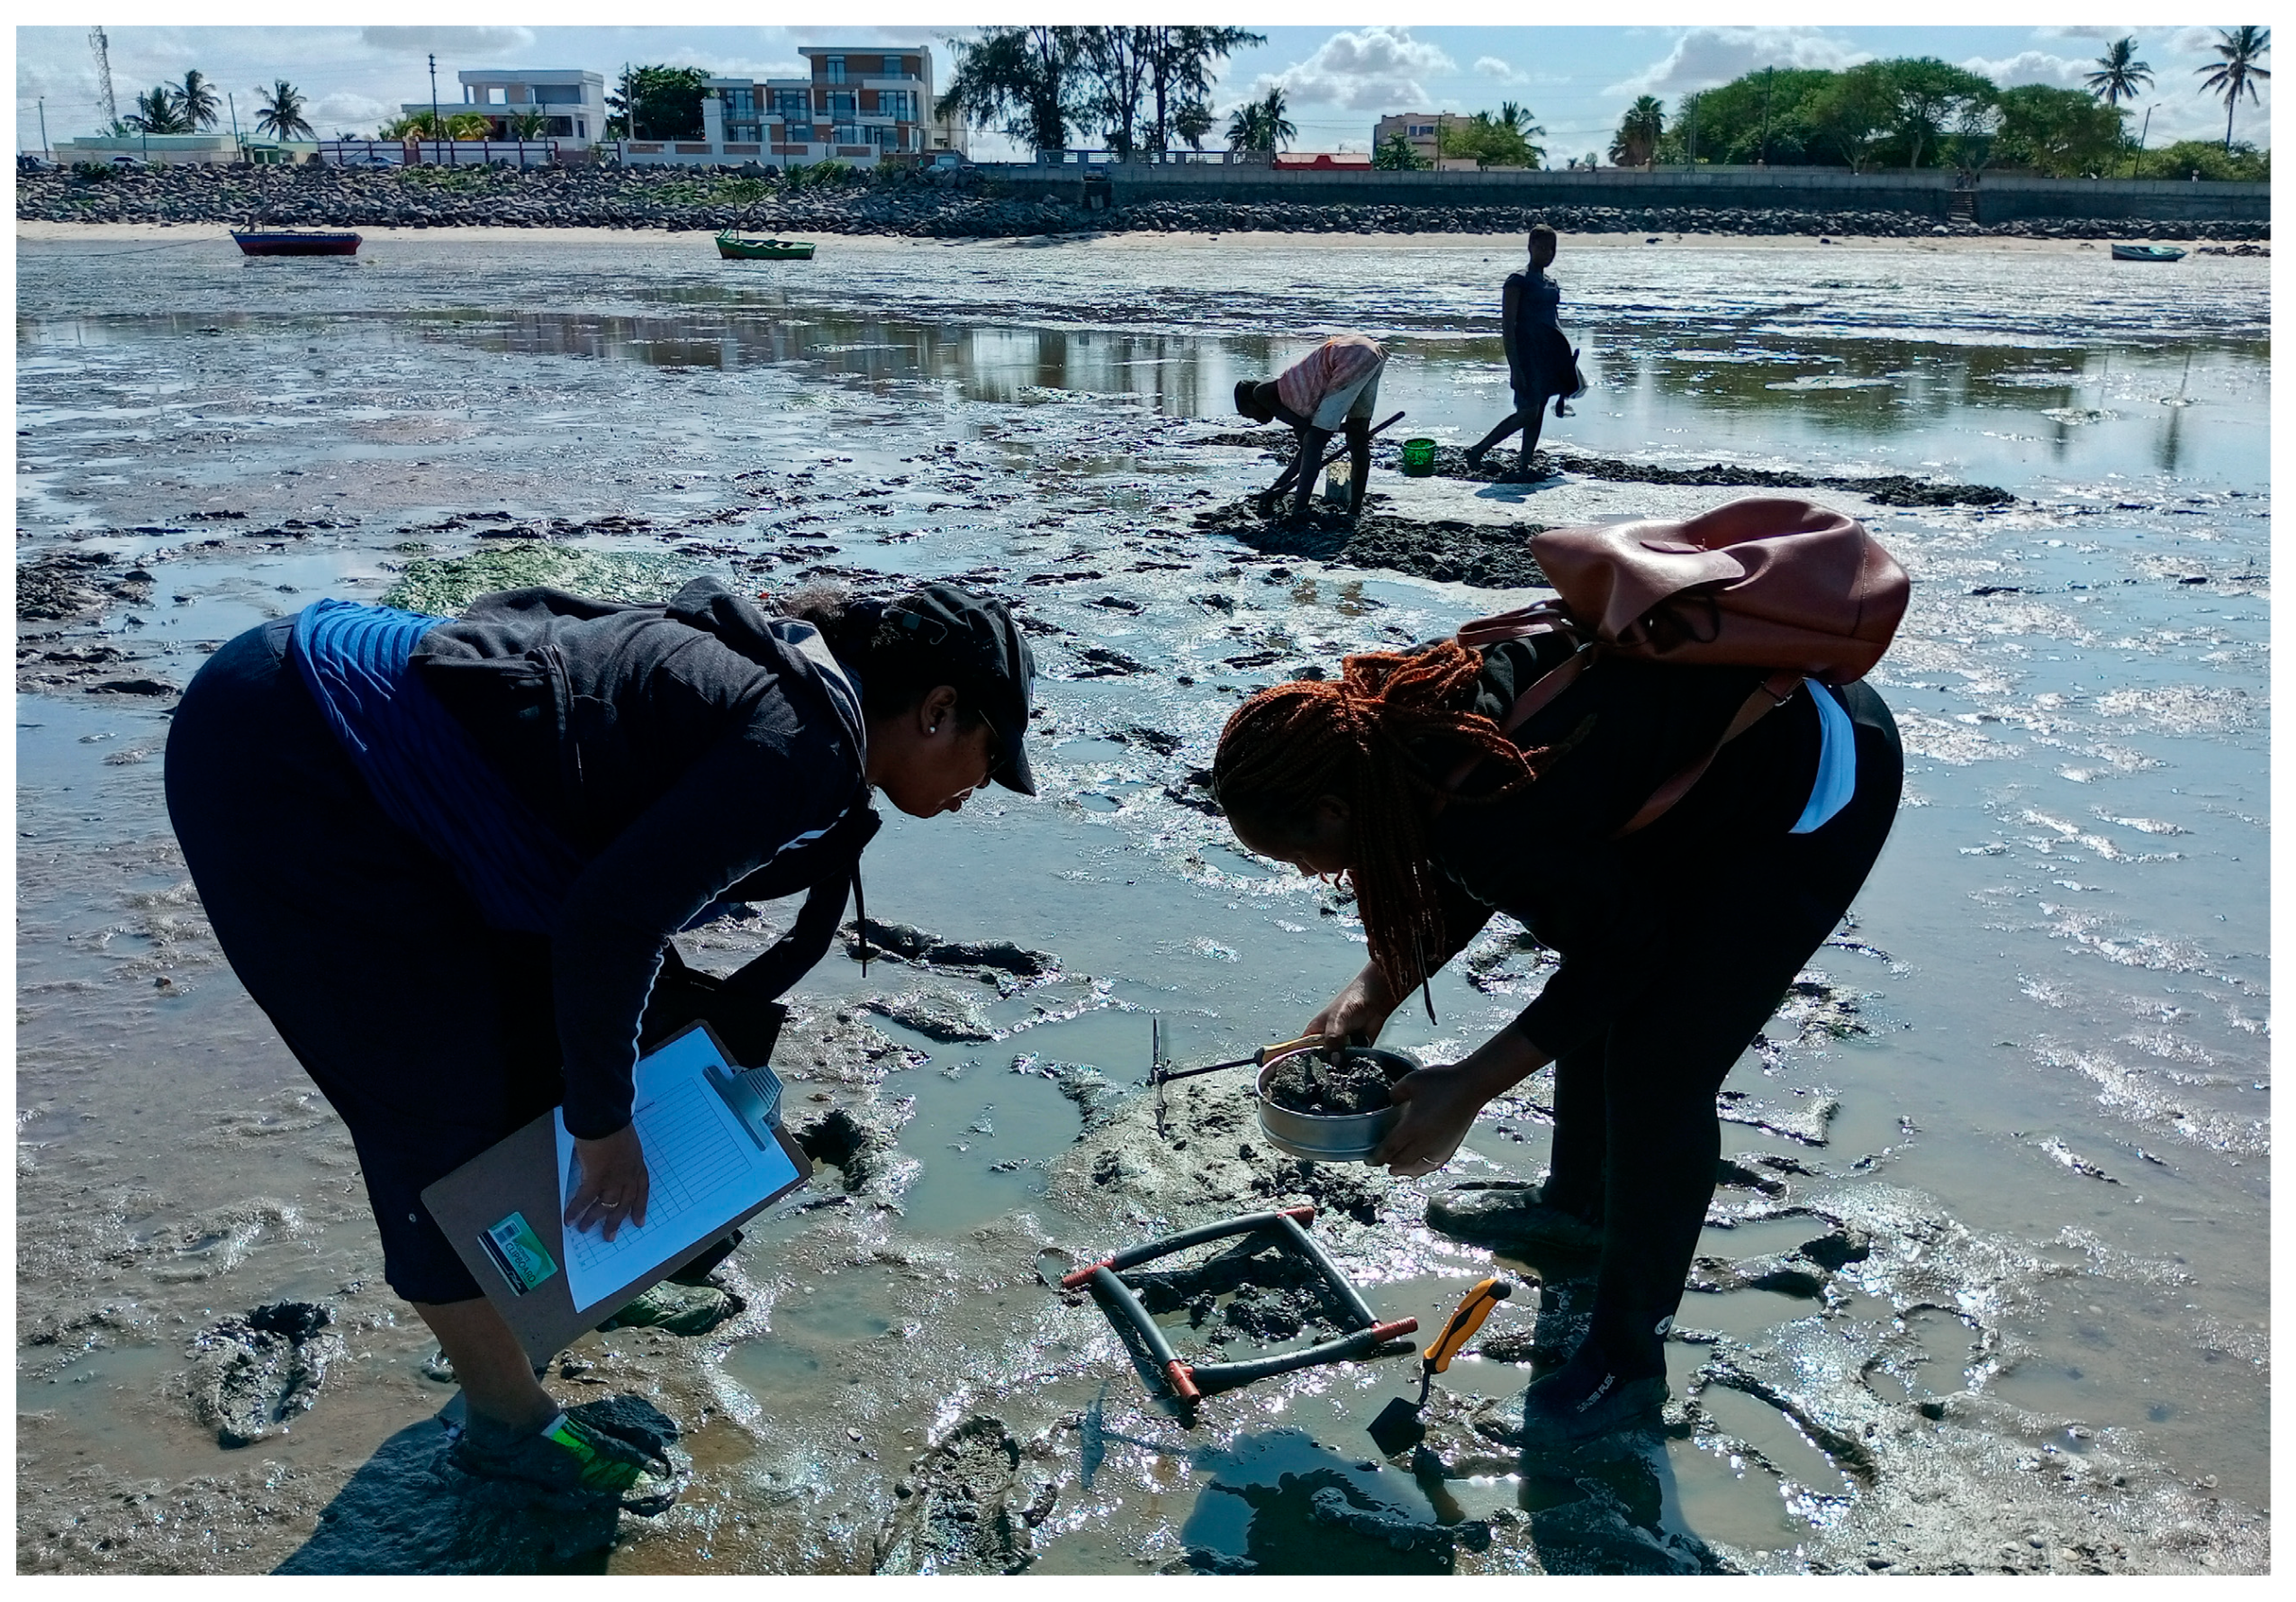
2.2.2. Data Collection

Data were collected monthly from March to September 2020. The date and sampling time varied according to the tide timetable, and all monitoring was performed during low spring tides.
The methods of data collection area presented in the Table 1 below.
Field activity is illustrated in Figure 2.

2.2.3. Data Analysis

Shannon index was calculated using the following equation:
H = i = 1 n p i ( log 2   n i N )
where N = total number of individuals in the sample.
ni = number of individuals of species i.
T pairwise test analysis was run to evaluate the significance of evolution per month. Each group of monthly samples was paired with the baseline data collected in April. All the analysis has been run under SPSS version software. For interpretation, the p-value and confidence interval of difference at a 95% level of accuracy were used to reject the null hypothesis. The null hypothesis states a significant difference between the two means (baseline data and post-treatment data). Before the t-paired test, the normality test was performed on SPSS and interpreted through the value of the Shapiro–Wilk test. Non-normal datasets were corrected using Box–Cox transformation on SPSS. Variables tested include a variance of seagrass shoots and density per month, the correlation between gleaning exclusion duration and plant and invertebrate community evolution, and the diversity of responses in diverse species of animals and plants.
Pearson correlation analysis was run between seagrass species shoot density and coverage trends through the months. This aimed to compare seagrass intraspecies response to the no-take treatment.

3. Results

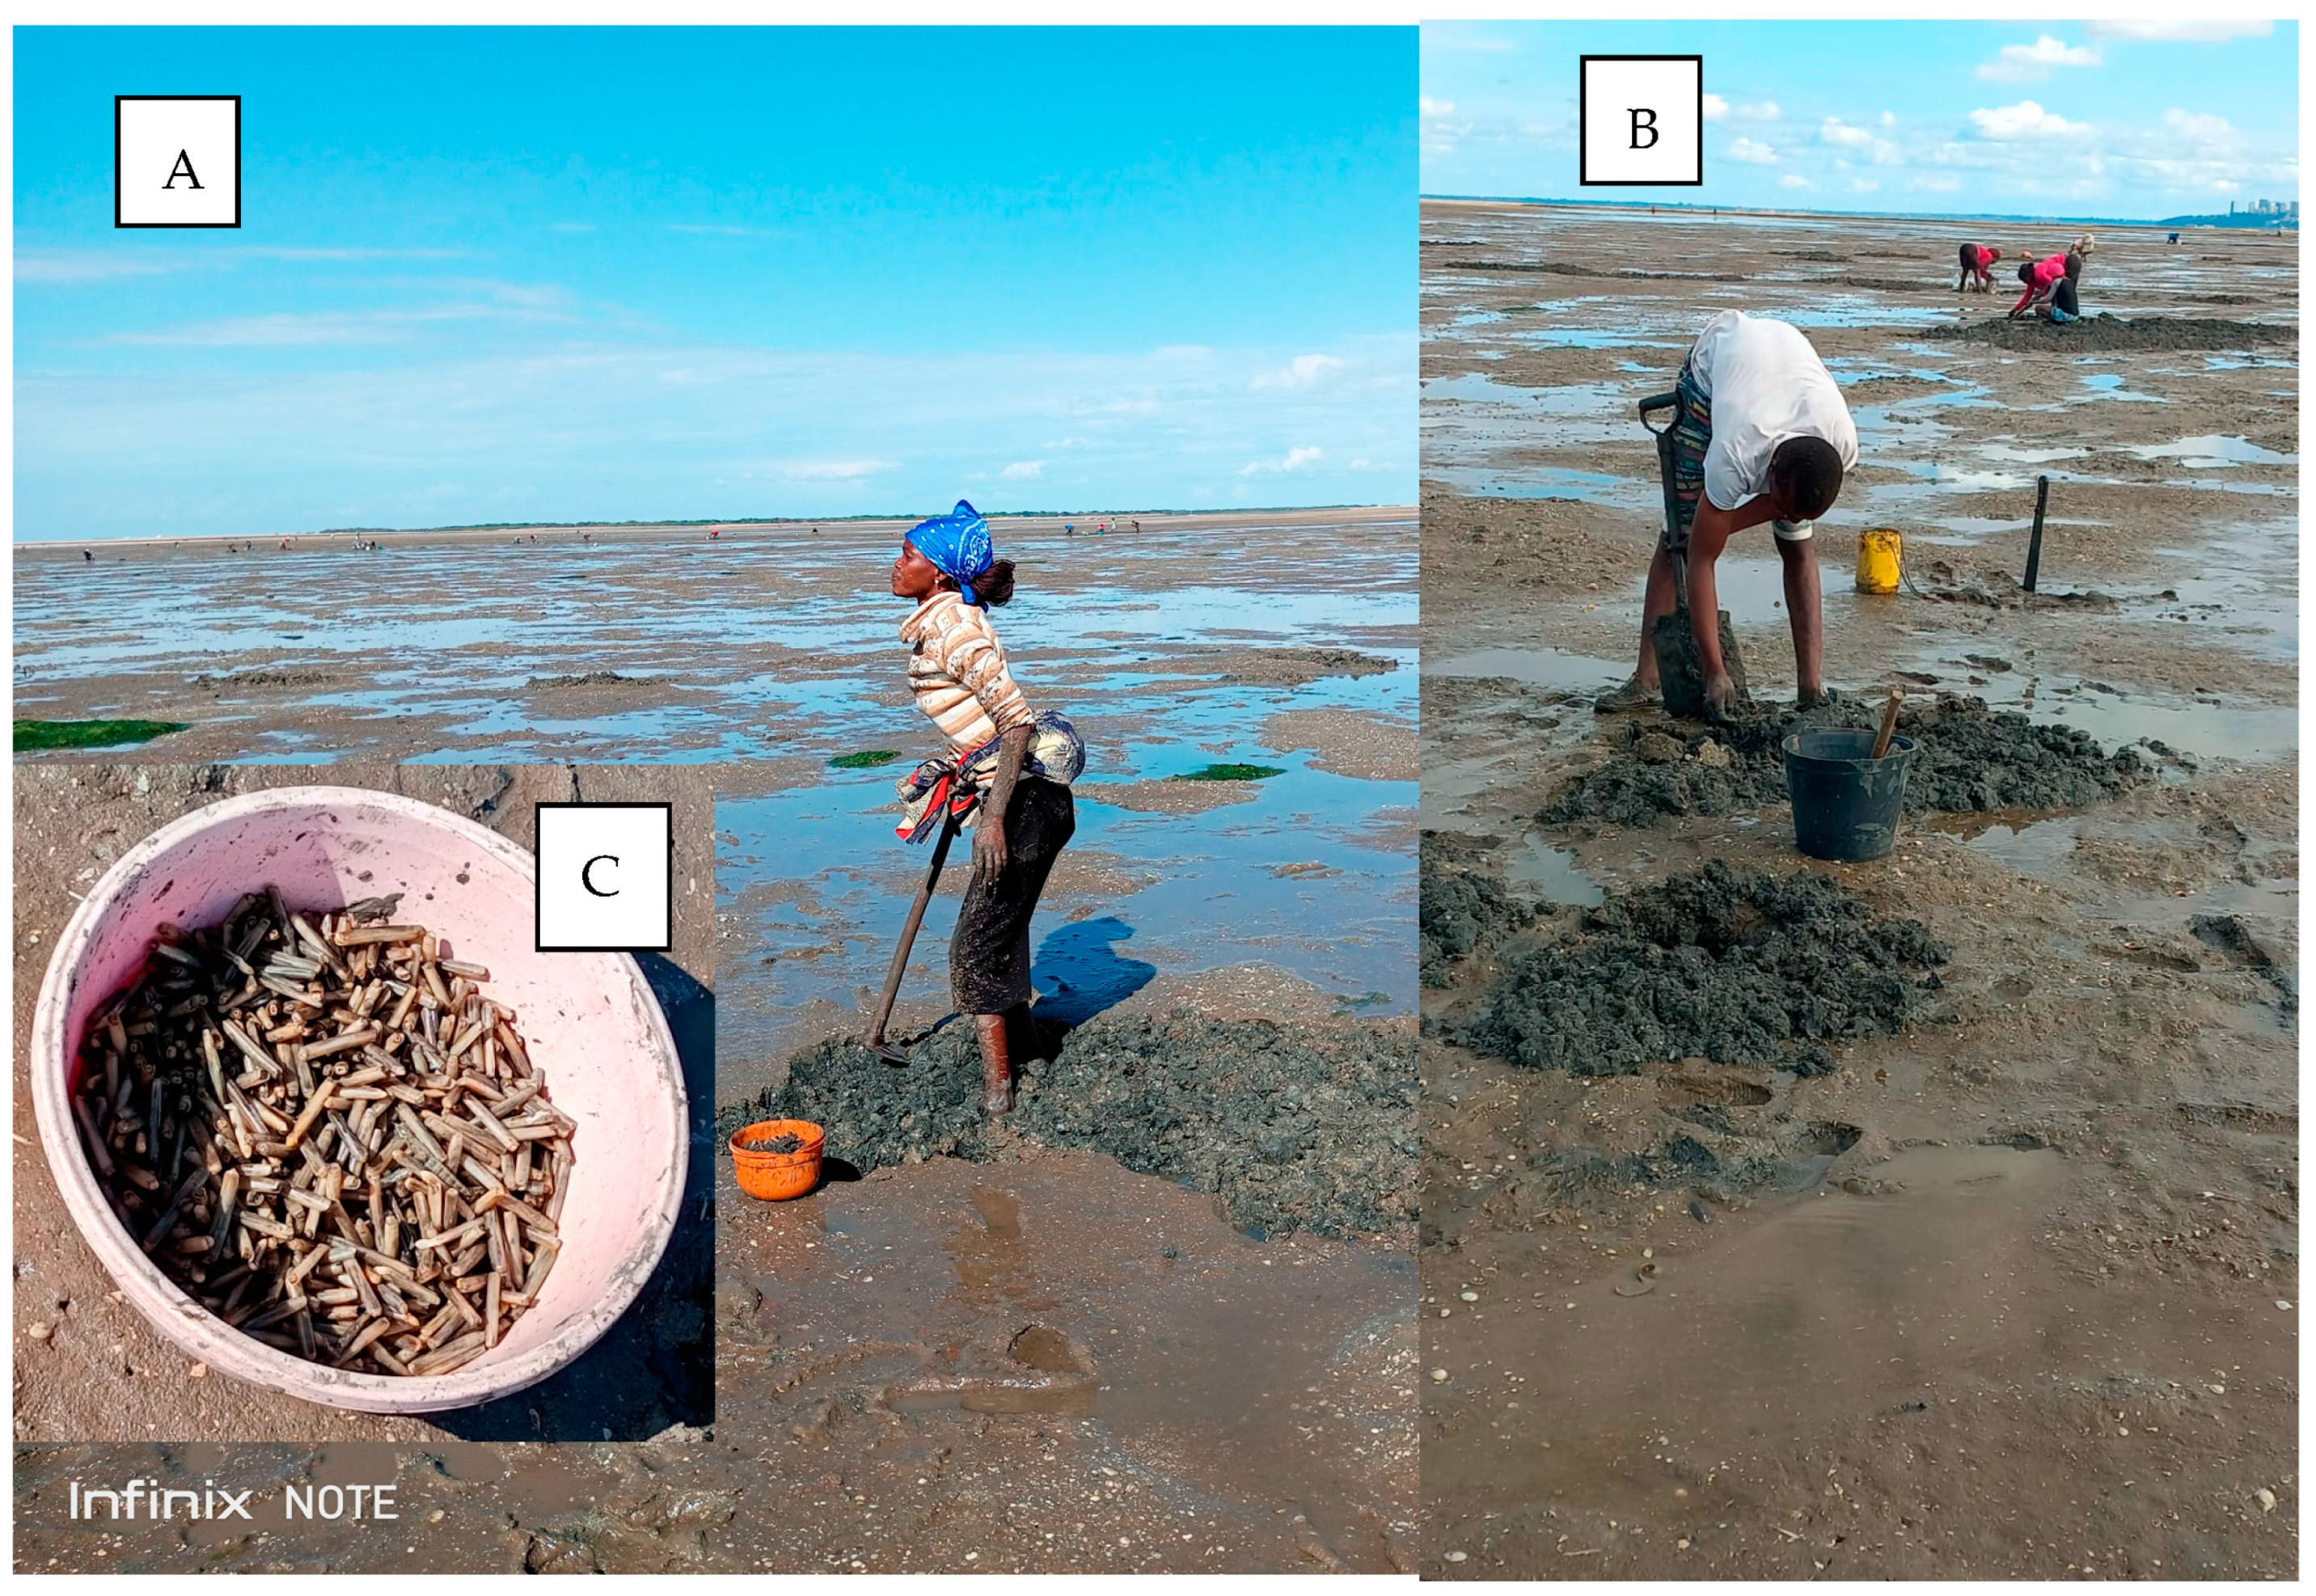
3.1. Level of Gleaning Exclusion

The level of exclusion scores in the experiment falls under the “Good” class. It is interpreted that at least 3 out of 22 visited plots presented a sign of gleaning inside per month. The highest score was recorded in the month of June, followed by April, July, August, and May. Although the lowest score was observed in September, the class value remains within the “Good” class (Figure 3). Throughout the experiment, 31% of plots were completely out of disturbance, 26% presented little damage, a high and frequent sign of digging was observed inside roughly 30% of sampled plots, and 13% were without visible traces of how devastating damages had occurred.

3.2. Seagrass Recovery

General Recovery

Three species were encountered inside the exclusion plots during the monitoring: H. ovalis, H. uninervis, and Z. capensis.
H. ovalis was the most dominant species within the exclusion plots. The species’ coverage increased from 8.3% to 30.32%, and density started from 36 shoots/m2 in June to 148 shoots/m2 in September. The curves (Figure 4) demonstrate a slope decrease from May to June, then a strong slope increase until September.
H. uninervis is the second most dominant species; its density ranges from 12 shoots/m2 in July, to 27 shoots/m2 in September. The percent coverage of the species is of lower value compared to H. ovalis, the lowest value is 0.28%, and the highest value is 2.97%. The species’ curves illustrate two slopes of decrease in April and May. The decreases are then followed by a light increment in June and a much greater decline in July. From July into September, the coverage curve starts to increase into the higher registered value.
Z. capensis is the least dominant species during the monitoring, including the value of coverage and density. The species was absent inside the exclusion plots during May and June and reappeared, followed by an increment from July to September. The shoot density range is from 0 to 15 shoots/m2, and the coverage range is between 0 and 1.5%.
Statistical significance of monthly recovery in plant shoot density was observed in August and September with p < 0.05 at a 95% confidence level. In contrast, the density recovery of May, June, and July is not statistically significant (p > 0.05) compared with the initial data collected at the beginning of the study (Table 2).
Gleaning activity is depicted in Figure 5 below.

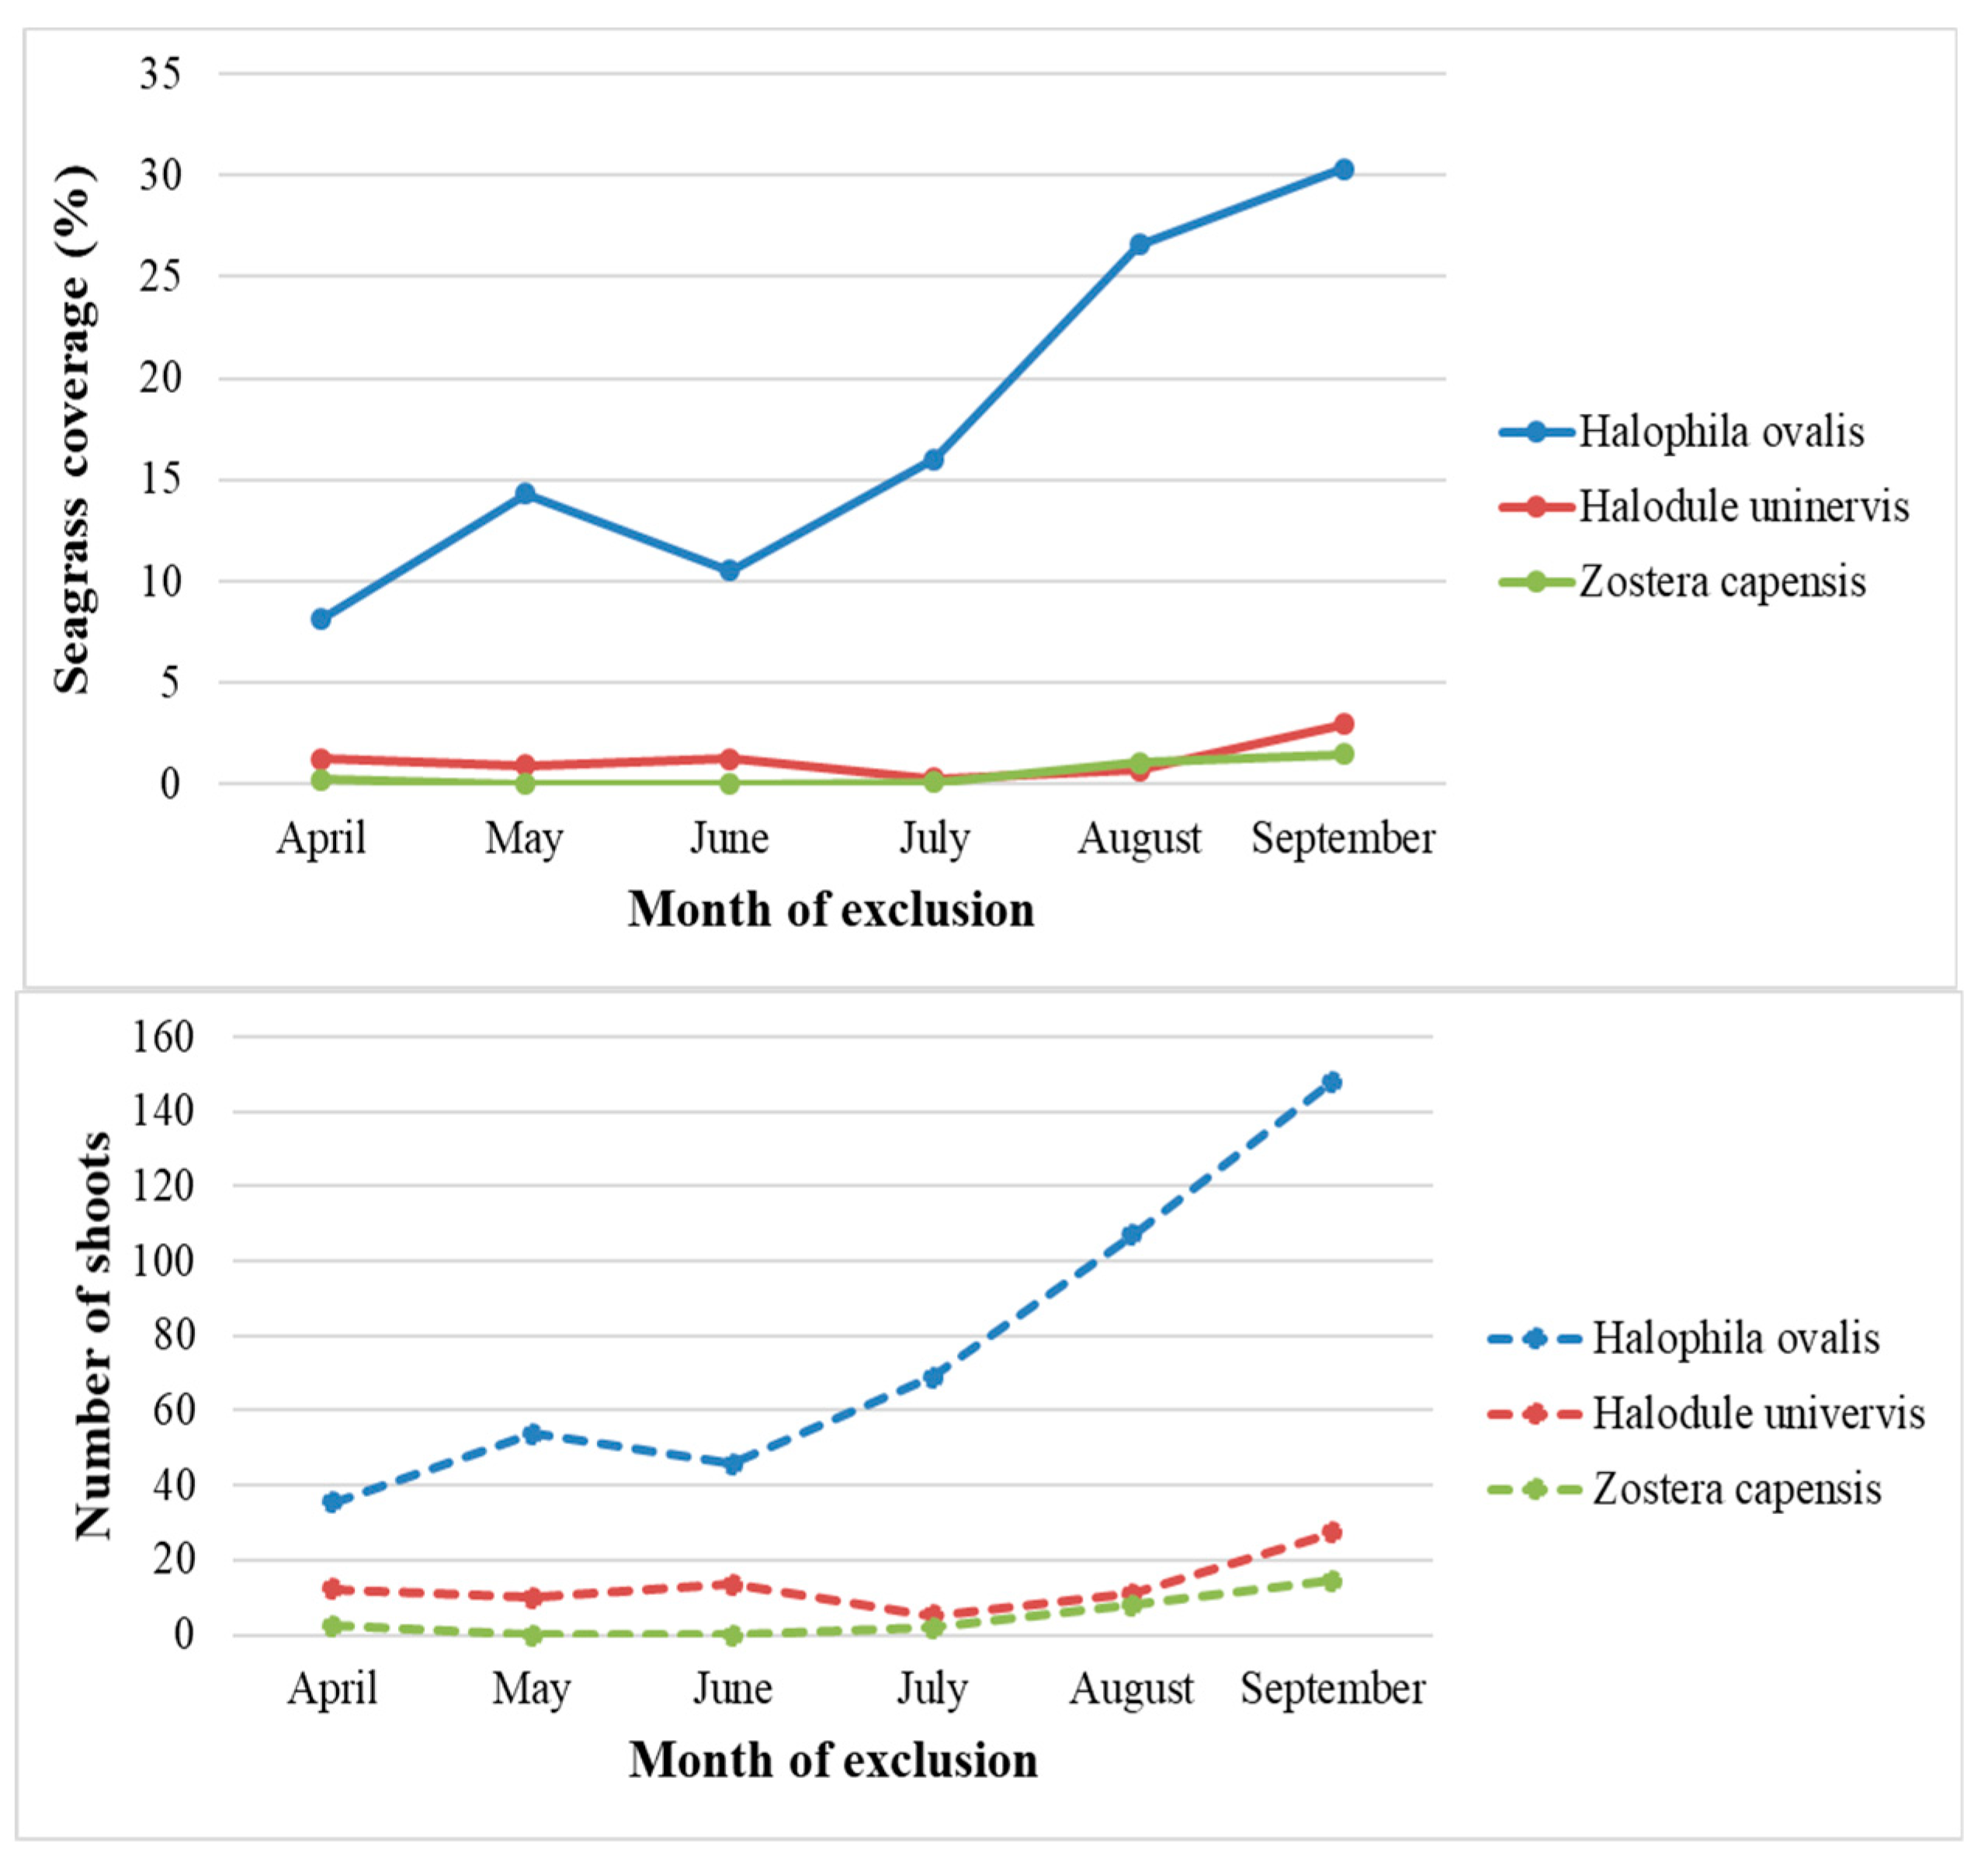
3.3. Interspecies Recovery

Recovery of H. ovalis and Z. capensis has a statistically significant correlation with r = 0.95 at 99% of confidence level (Table 3). The two species also correlate with the total plant shoot density of r = 0.99 and r = 0.97, respectively, at a 99% level of confidence. In contrast, the H. uninervis trend did not correlate with any other variables. However, the gleaning exclusion in the plots showed that the three species had responses over time (Figure 6).
  • H. ovalis
H. ovalis shoot density recovery was statistically significant from July (with p < 0.05). Other previous months showed a statistically non-significant recovery (p > 0.05) (Table 4).
  • H. uninervis
The H. uninervis monthly recovery showed a significant statistical difference with initial data in June at p = 0.041 and September at p = 0.005 (Table 5). For other months, density values showed non-significant statistical recovery compared to the baseline data (p > 0.05) (Table 5).
  • Z. capensis
The Z. capensis shoot density did not show a statistically significant recovery for all of the months of experimentation (p > 0.005) (Table 6).

3.4. Invertebrate Recovery

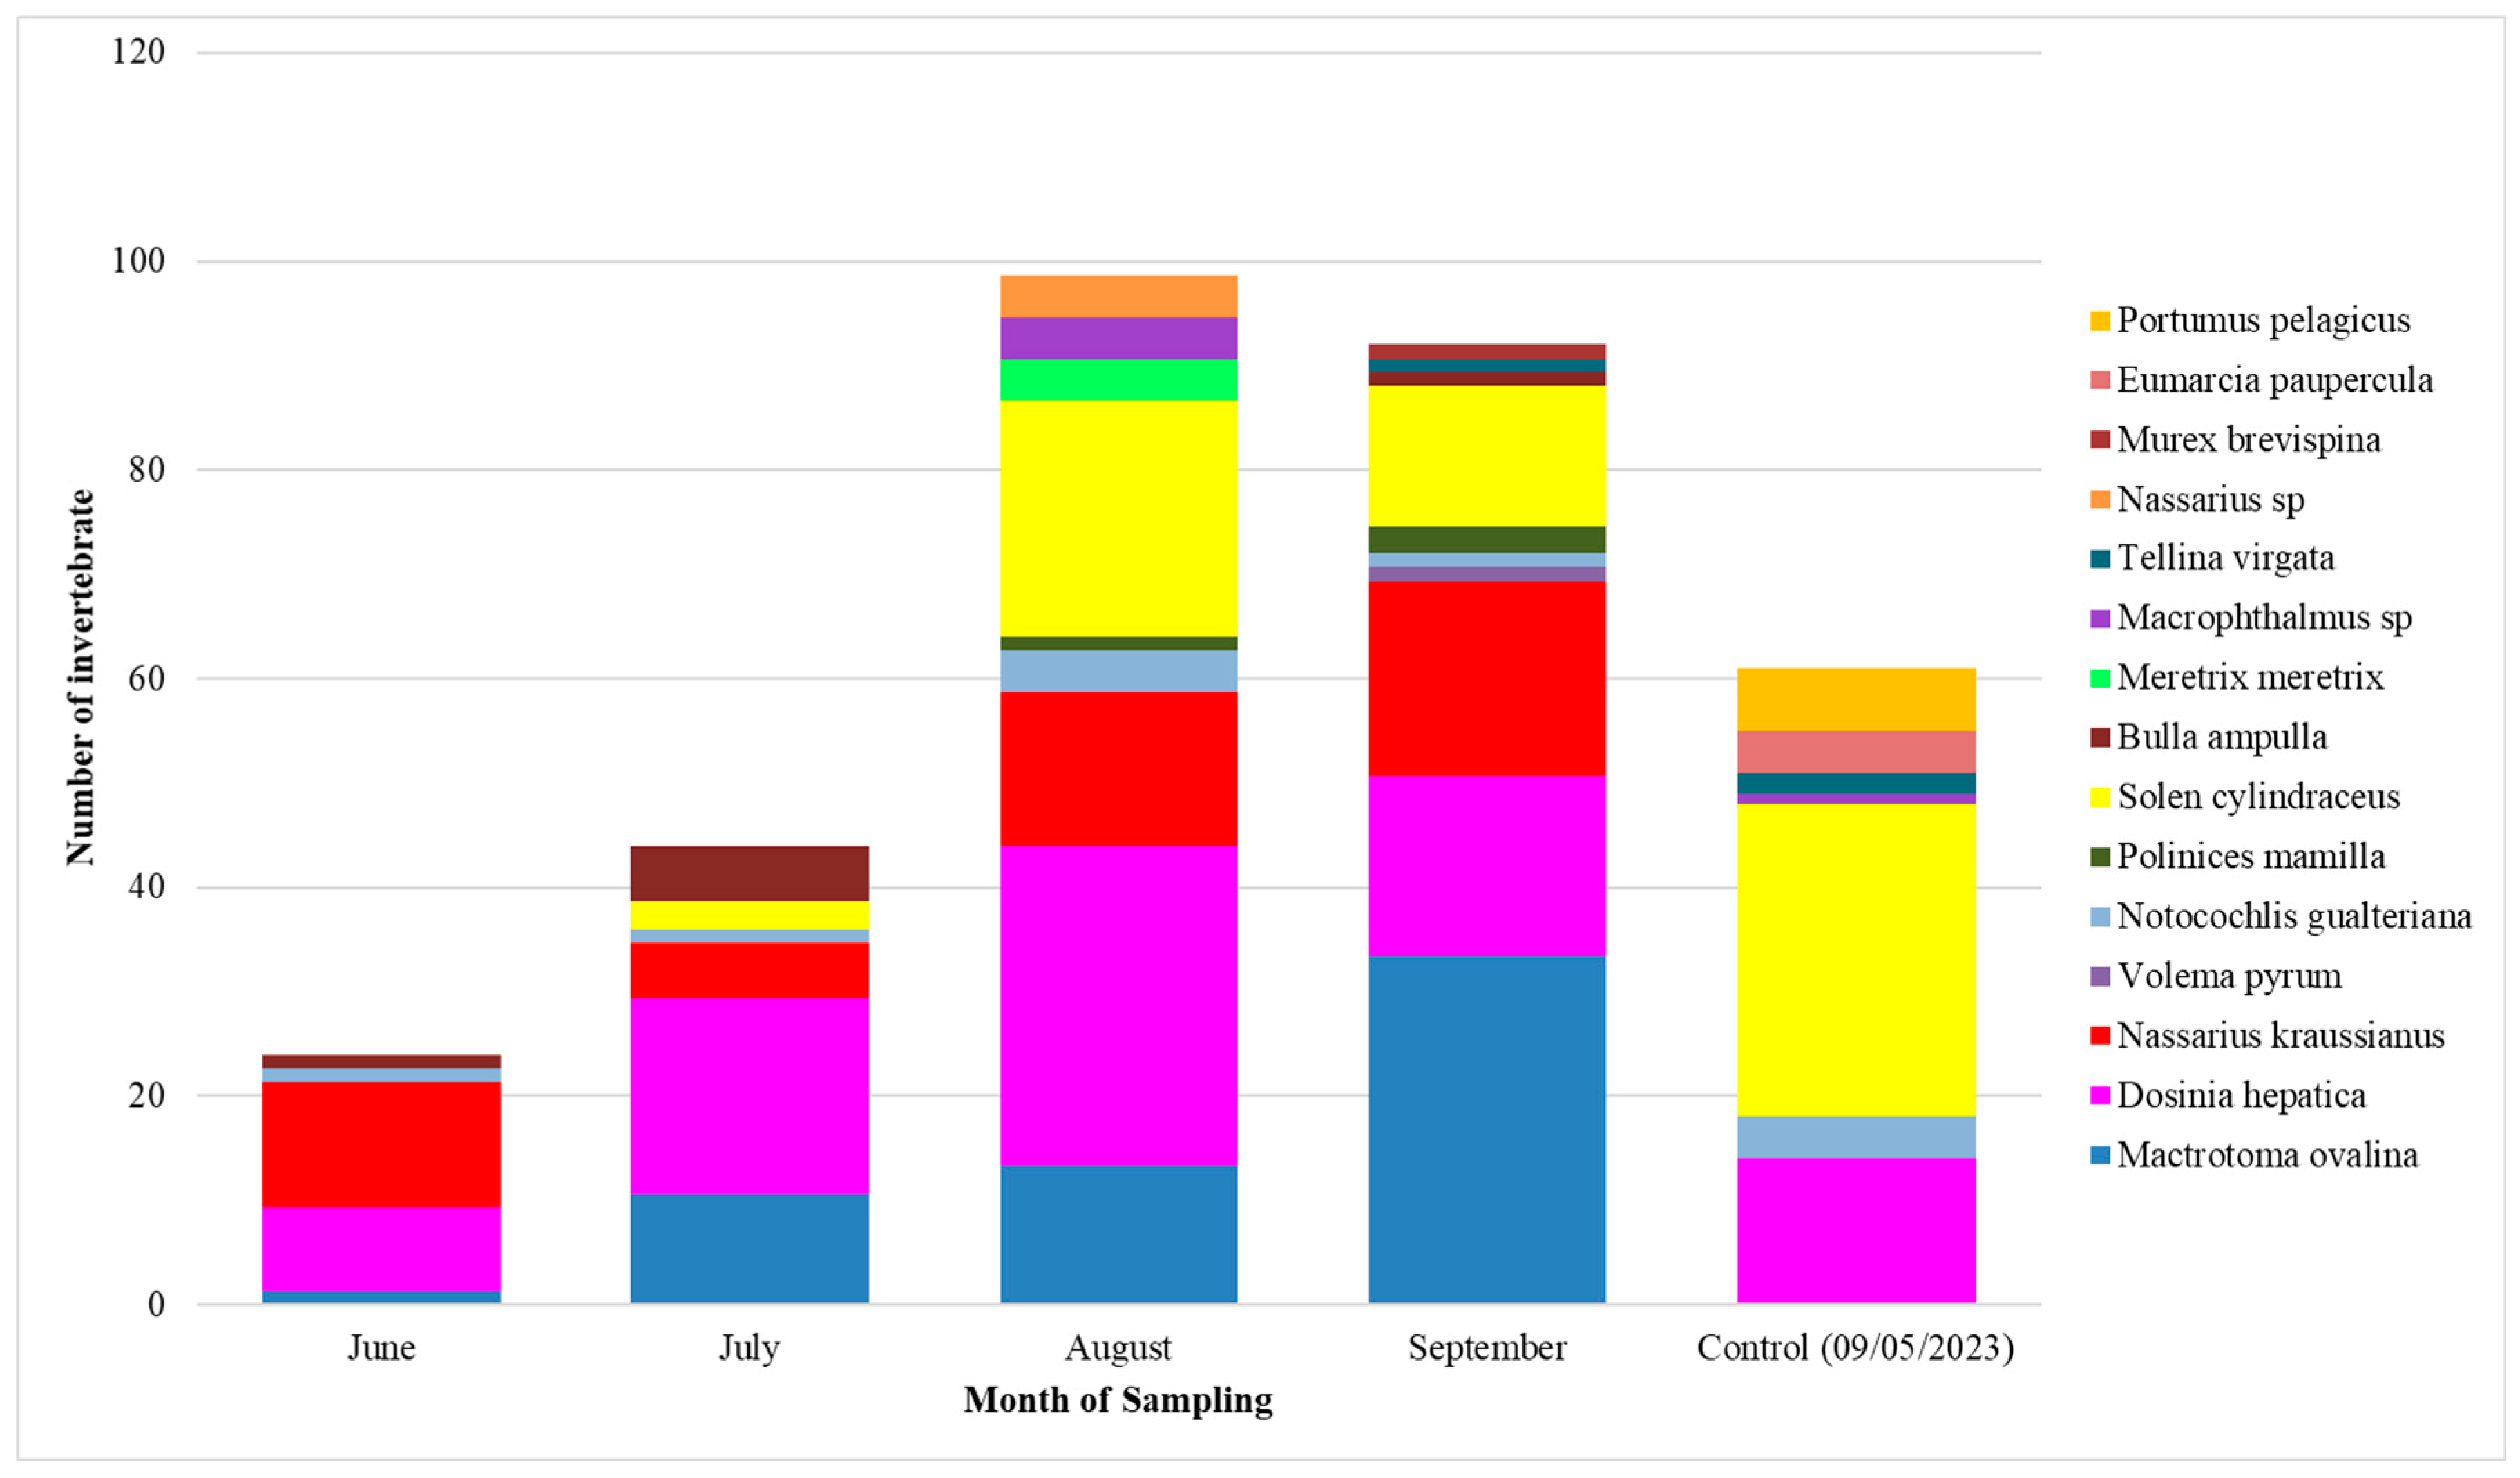
3.4.1. General Recovery

A total of 194 individual invertebrates from 13 invertebrate species were collected during the experimentation. The most abundant invertebrate species were Mactrotoma ovalina and Dosinia hepatica in September and August, respectively, followed by Solen cylindraceus and Nassarius kraussianus. In contrast, Polinices mamilla, Meretrix meretrix, Macropthtalmus sp., Tellina virgata, Nassarius sp., and Murex brevispina were present with low to null density (Table 7).
Invertebrate proportions show that the collected species are mostly Dosinia hepatica (29%), followed by Mactrotoma ovalina (23%), Nassarius gualteriana (20%), and Solen cylindraceus (15%). The remaining 13% is shared between Notocochlis gualteriana, Polinices mamilla, Bulla ampulla, Meretrix meretrix, Nassarius sp., Macrophthalmus sp., Tellina virgata, Volema pyrum, and Murex brevispina (Figure 6).
Extensive digging of the affected or control area, followed by sand revolving, was widespread, which prompted an extensive degradation of the habitat. Consecutively, extensive areas of seagrass meadows are disappearing in the region, and already being hard to see the seagrass Zostera capensis, an IUCN Red List plant species. The impact has prompted a reduction of invertebrate species to 10 species with only one common edible, C. cylindraceus. Dominant species were S.cylindraceous (36%), Nassarius sp. (20%) and D. hepatica (18.3%), and Tellina sp. (13%). The 2/3 of impacted or control areas had no seagrass at all, Halophila ovalis being dominant, followed by Halodule uninervis.

3.4.2. Density Recovery

Density is the number of individuals encountered per unit area. Regardless of the species, June has the lowest value in density (24 individuals per m2), followed by July (44 individuals per species per m2), September (92 individuals per m2), and August with the highest density registered (99 individuals per m2) (Figure 7).

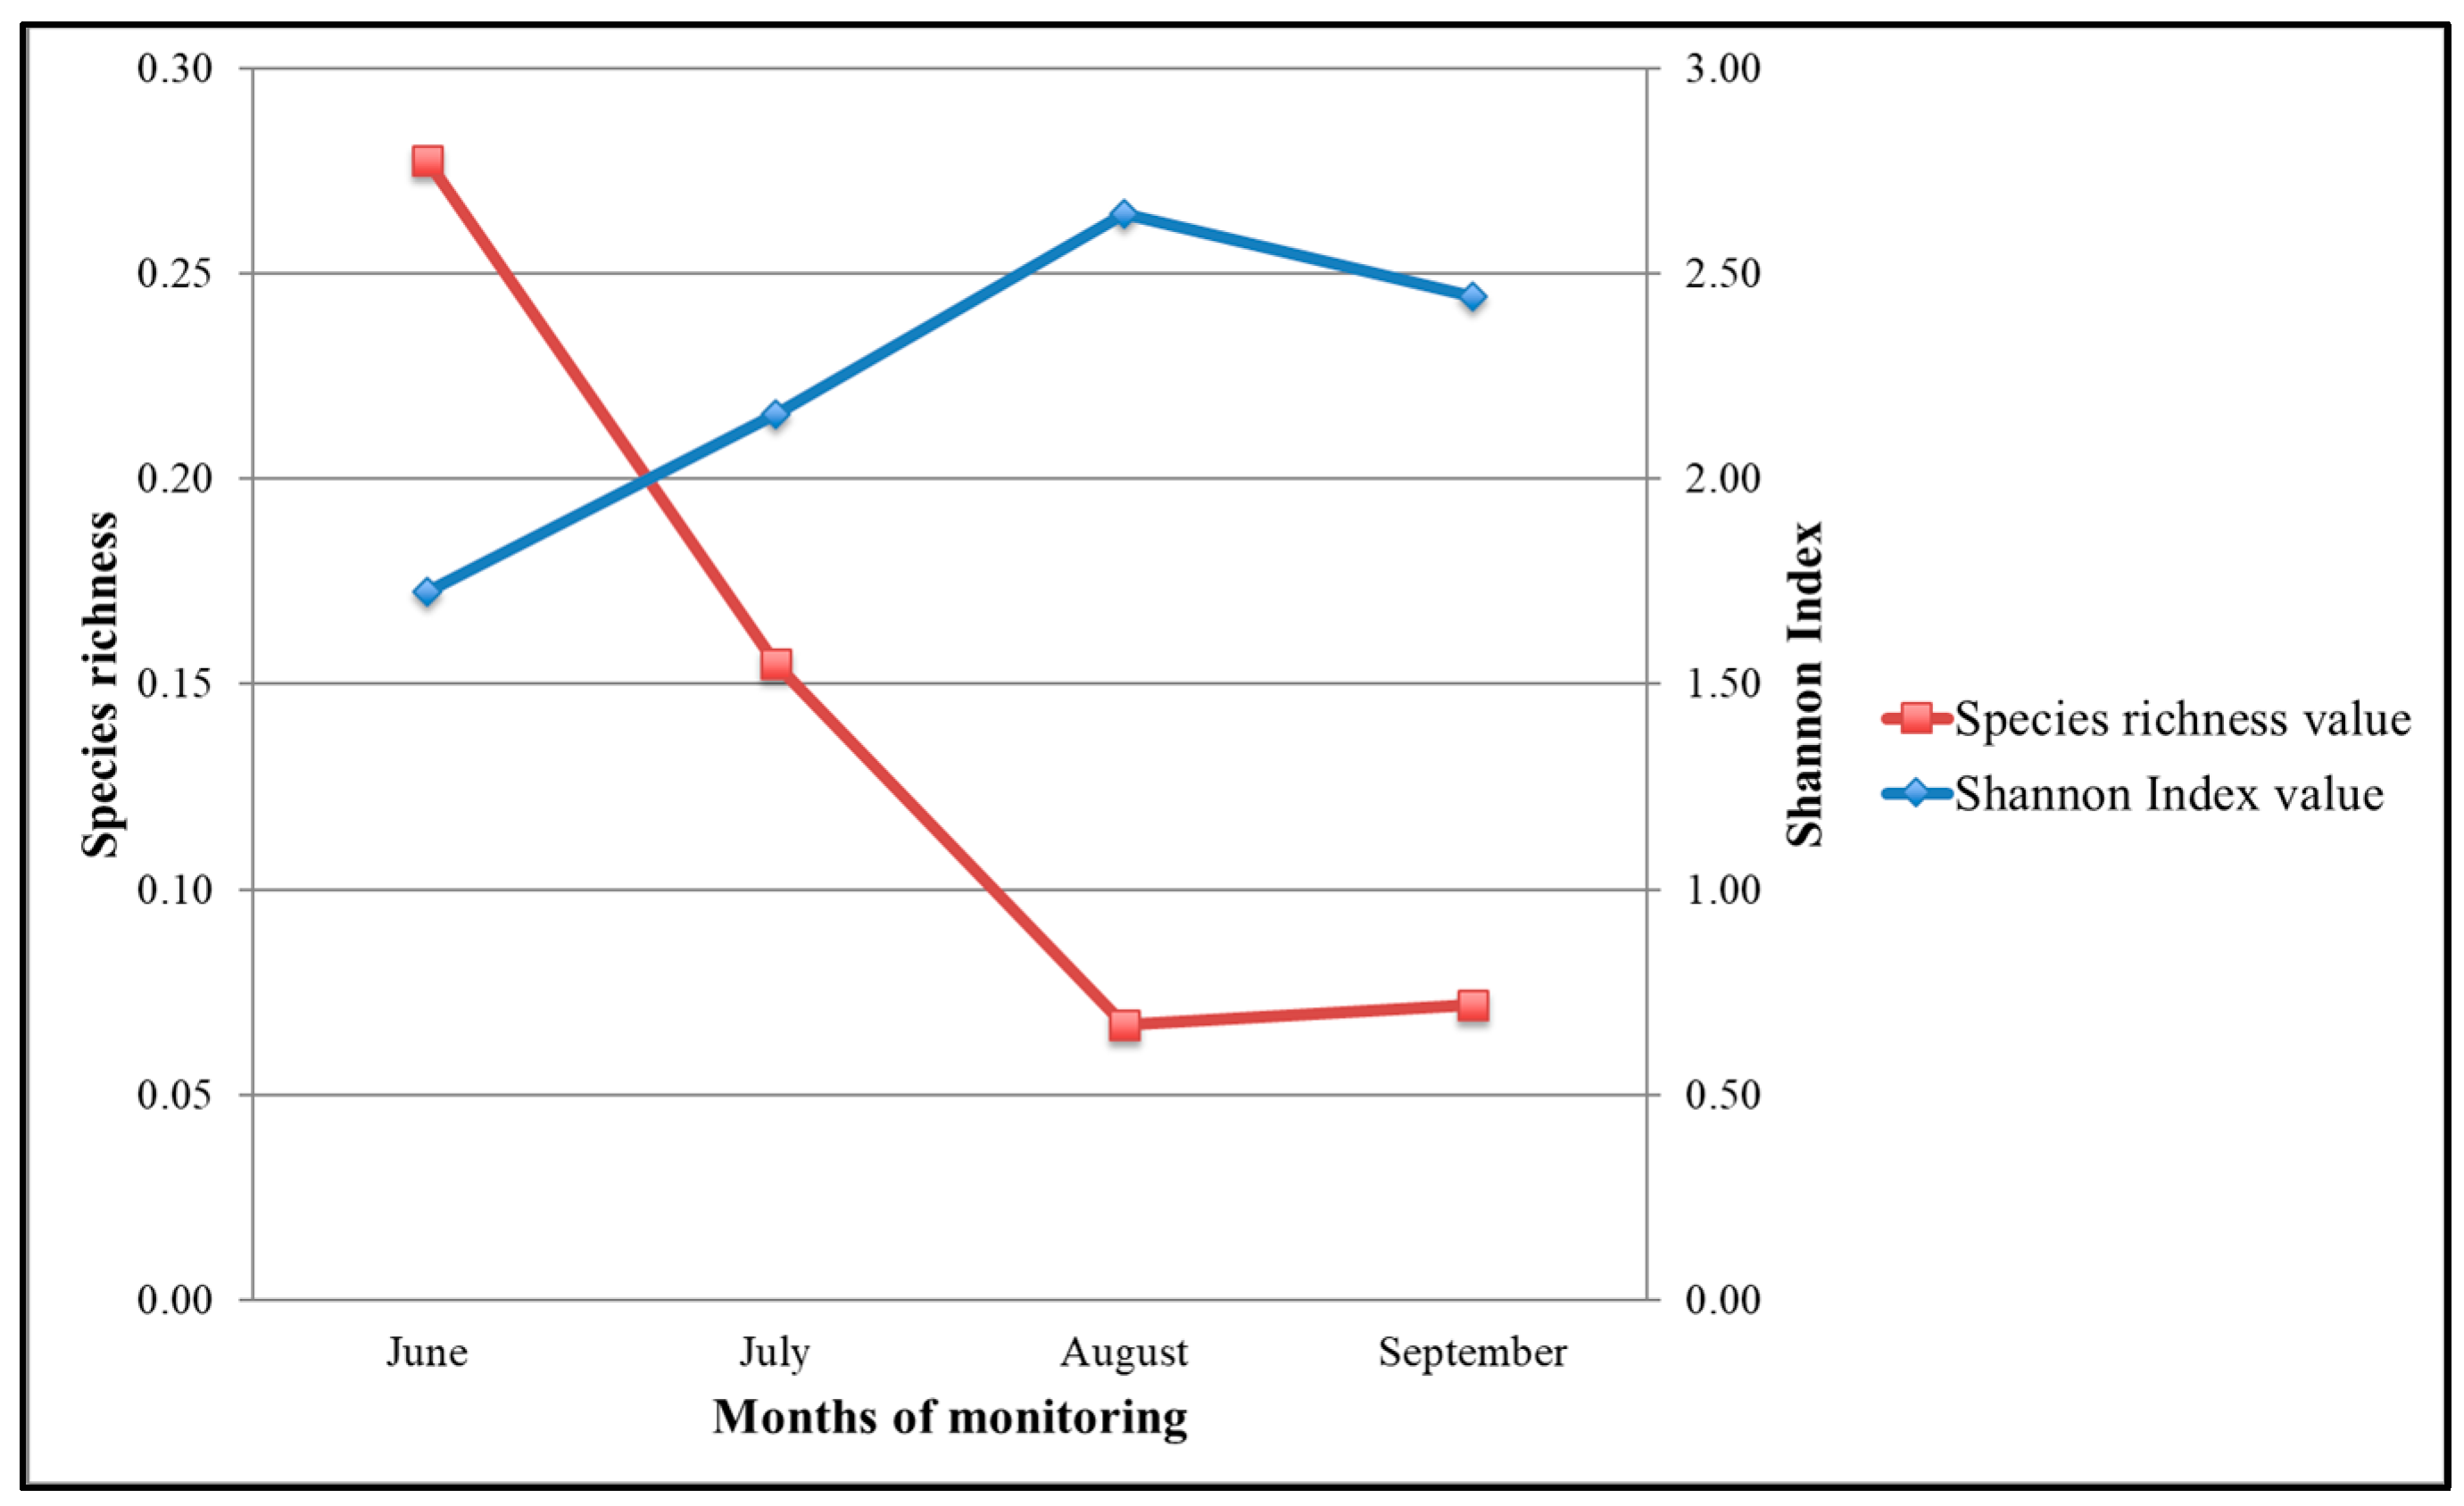
3.4.3. Species Richness and Shannon Index

The values of the curve of richness show a decrease between June and July. They remain constant at the lowest value in August and present a small increase into a higher value in September. For the Shannon Index, the curve shows a constant increase from June to August, followed by a light decrease into September (Figure 8). Regarding the control or affected areas by gleaning, the data of single sampling indicated a Shannon Index value of 0.909.

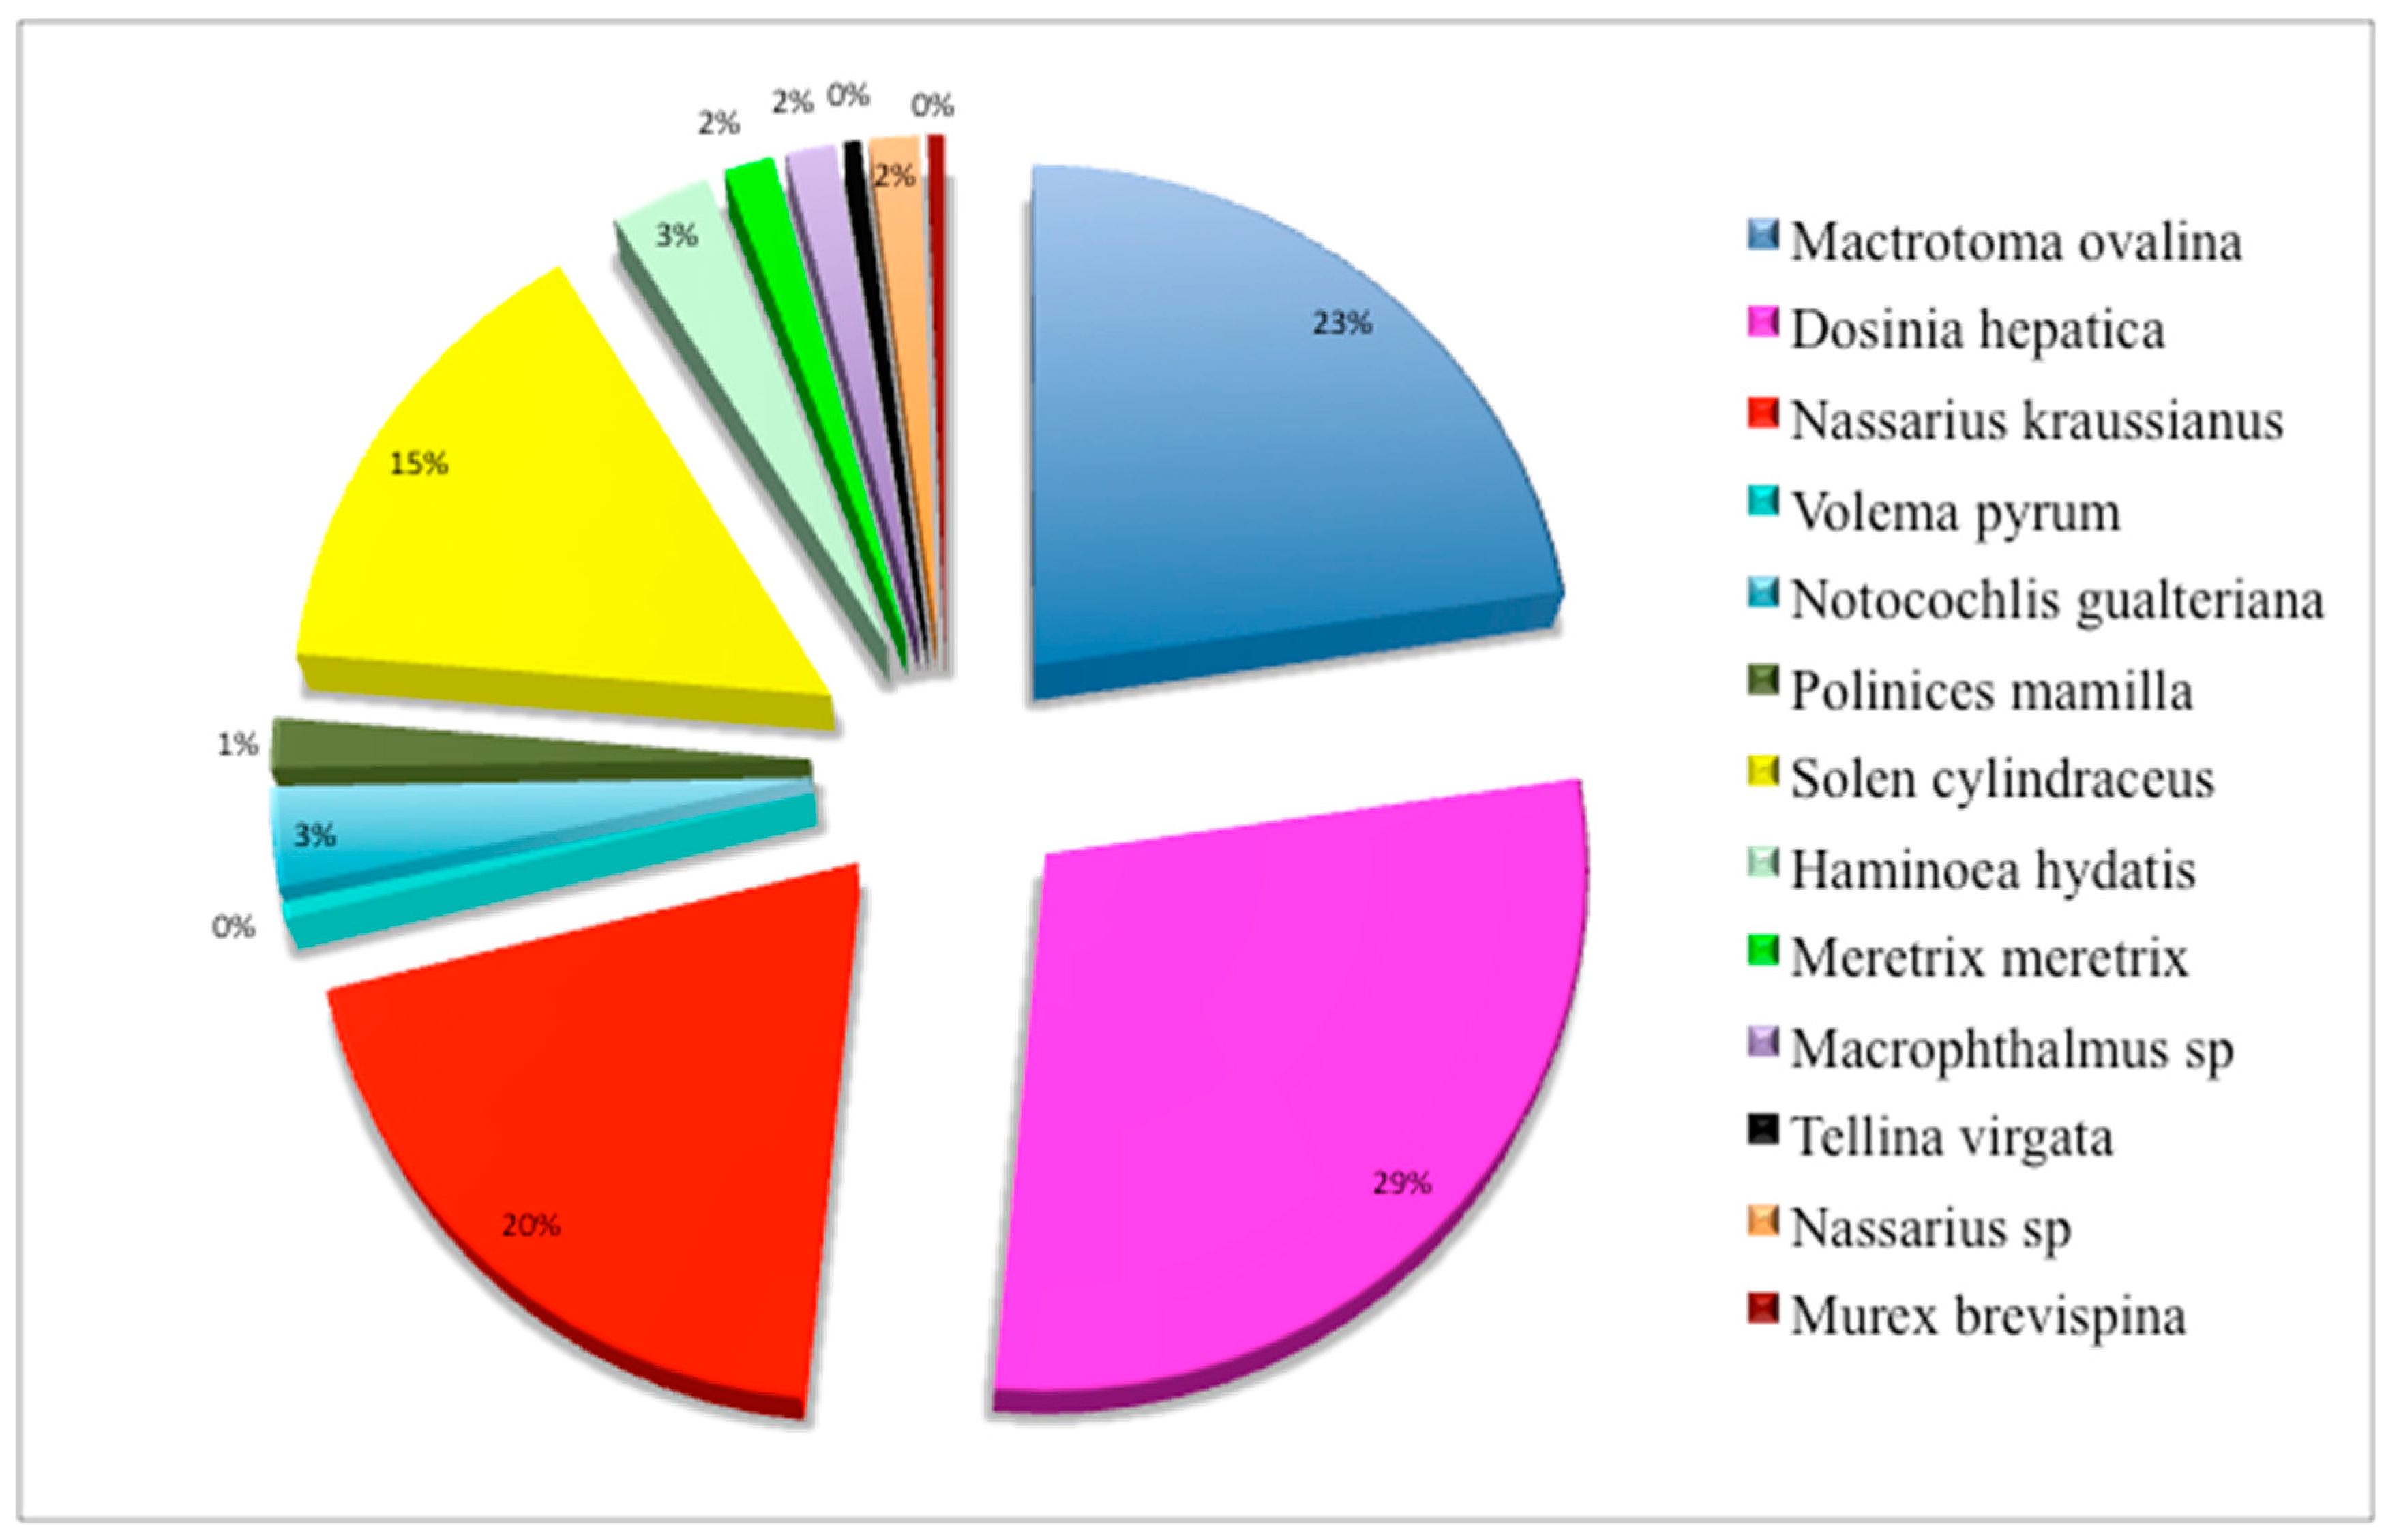
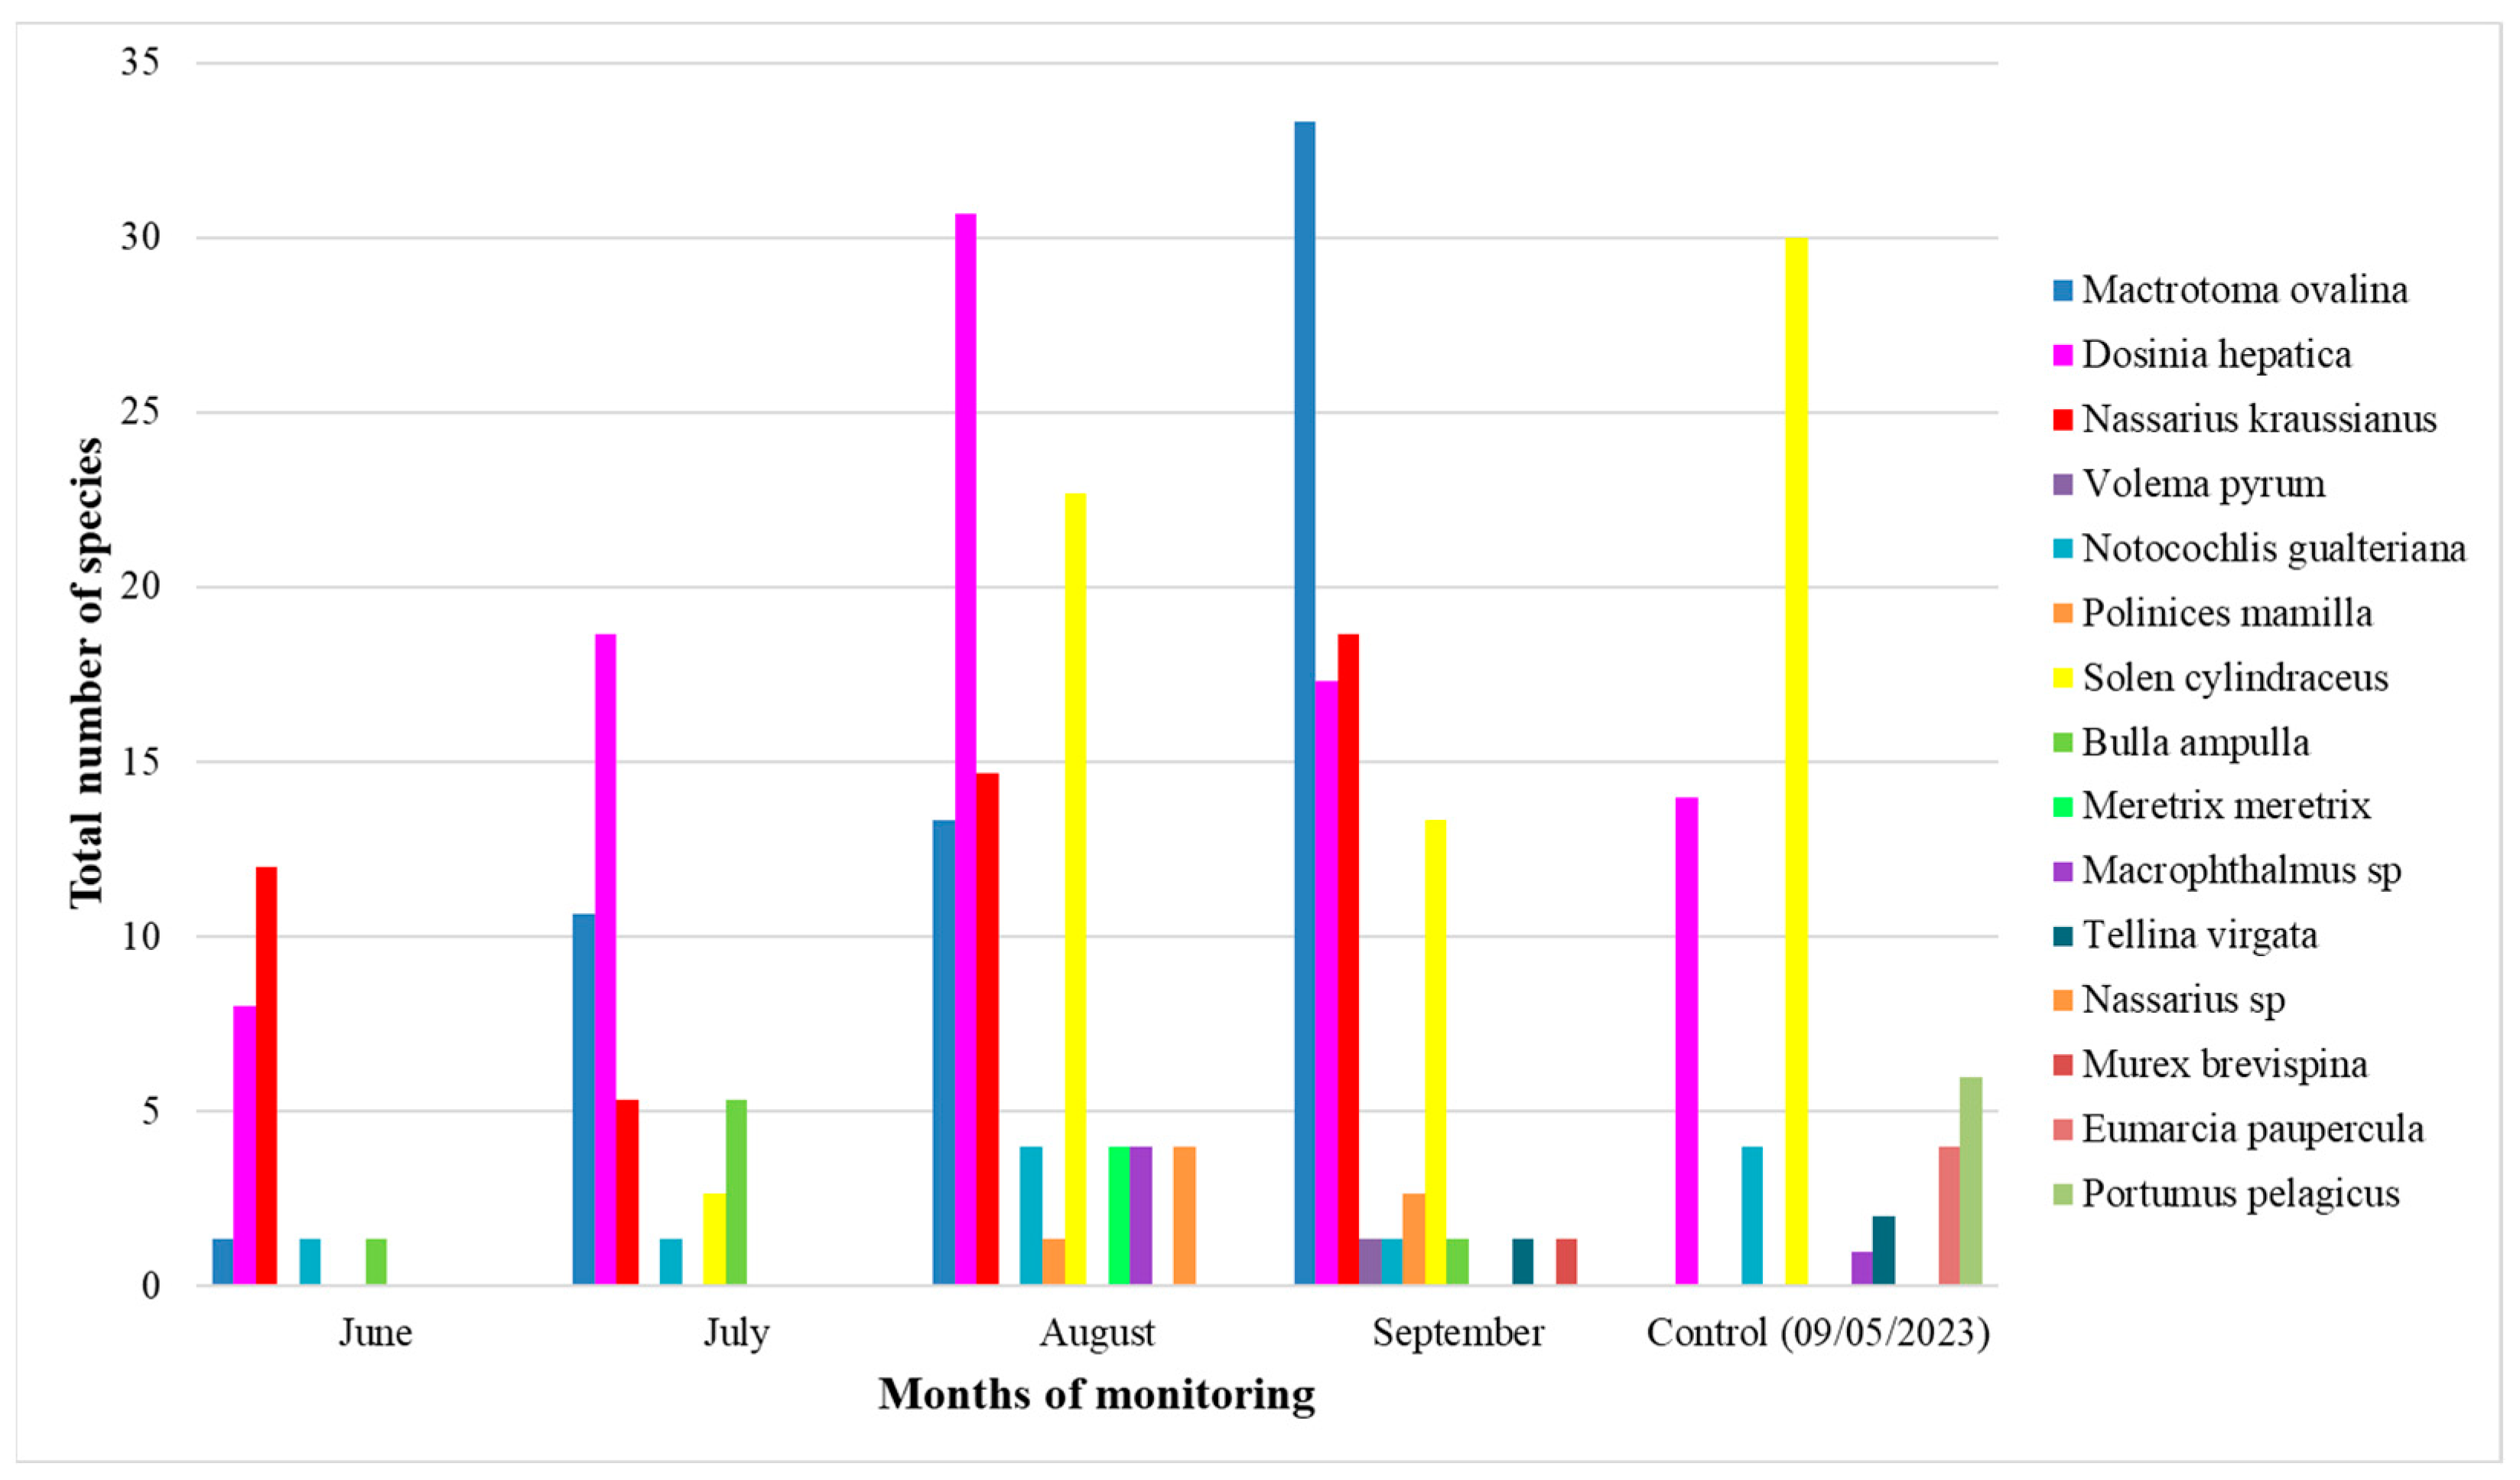
3.4.4. Interspecies Recovery

Interspecies recovery difference is the trend of species density incrementing in each species of invertebrate encountered in the study.
Invertebrates’ dominant groups are M. ovalina, and D. hepatica, with a continuously increasing trend (Figure 9). M. ovalina had the highest density of 33 individuals/m2, followed by D. hepatica, with a density of 31 individuals/m2 in August. In contrast, N. kraussanius and S. cylindraceus densities decrease in July and September, respectively. Polinices mamilla, Nassarius sp., Tellina virgata, and Murex brevispina occur only in August and September.
Species density recovery in invertebrates is poorly and weakly correlated (p > 0.05); the results showed that only S. cylindraceus and D. hepatica are statistically significantly correlated with a Pearson value of r = 0.87 and p = 0.02 at a 95% level of confidence (Table 8).

3.5. Seagrass and Invertebrate Interaction

Interaction between seagrass and invertebrate species is the comparison of density increase trends in plants (seagrasses total density) and animals (edible and non-edible invertebrates). A comparison of trend increases in invertebrates demonstrates that edible invertebrates and non-edible invertebrates’ densities are statistically significantly positively correlated (r = 0.85) (Table 9). Edible species groups have a statistically significant correlation with seagrass shoot and coverage (r = 0.95; r = 0.97) (Table 9). For non-edible invertebrates, seagrass coverage and shoot density have a weak correlation (p > 0.05) with the group significance level of p = 0.11 (Table 9).

4. Discussion

This research aims to explore the feasibility of a no-take zone as an approach to the restoration of a seagrass bed. The major findings are discussed below, with an insight into its implication in management.

4.1. Level of Gleaning Exclusion

Violations or breaching of the exclusion areas were present during the study, explaining why the “Excellent” level has not been achieved (Figure 3). A low number of harvesters were encountered for sensitization during the pre-investigation. Contrary to the implementation of the no-take zone areas that made use of formal meetings [22], the present case consisted of informal conversations with collectors found in the intertidal area. The mentioned contrast in social approaches influenced results, explaining the cause of the violation of the exclusion plots. The two cases of Tanzania and Nicaragua (see [22]) highlight the importance of the local community’s awareness of the success of exclusion or no-take areas. Furthermore, new interdisciplinary research that looks at the practice of sustainable conservation suggests that forming an integral part of future policies with human development favor goal achievement. That is to say, the success of the conservation of species is tied to the well-being of rural communities and the inclusion of local population voices in policies to obtain successful conservation. Since participants are mostly women in gleaning activities, their inclusion in the management approach is critical in coastal conservation. In the present case, the consultation of women collectors preceding the implementation of a no-take approach has considerable outputs, such as the increase in plant coverage and the increase of diversity in some areas (reappearance of Z. capensis). Considering the above-cited finding, a low number of harvesters receiving information could be the reason for setup violation, as well as the inexistence of alternative livelihood activities. Intervention in livelihoods needs to tackle value chains, vulnerabilities especially related to gender, wider socio-economic issues including local rights, and base of given environment, seascape or habitats [23,24].
In addition to the mentioned aspects, plot exclusion was subjected to environmental disturbance, as sedimentation is observed inside the plots free of gleaning. From the observations, deductions can be made that sediments derive from adjacent digging and translocate into the exclusion plot. Exploitation in Bairro dos Pescadores targets the buried razor clam, Solen cylindraceus, where gardening hoes are used as tools, unlike gleaning practices reported in other locations in Nicaragua and Tanzania (see [22]), Inhaca Island, Inhambane in Mozambique [6,7]. Practices consist of the digging of sediment (up to 30 cm), with an extent that reaches about 4 m2, resulting in re-suspension of sediment into adjacent areas (personal observation). Sedimentation was often observed consecutively after gleaners harvested in the proximity of the plots of exclusion and was included inside of the disturbance score, thus, influencing the level of exclusion.

4.2. Seagrass Recovery

The species found inside the exclusion plots are listed as common occurrences in Mozambique and are registered by previous studies (e.g., Ref. [7]). The species were scarce during the present investigation, suggesting a change of composition in the intertidal zone through time (2014–2020). The phenomenon can be attributed to the dynamic nature of the African eelgrass beds, which were observed in South Africa during seagrass distribution studies [19].
Initial meadows were composed of three different species with heterogeneous densities. The recovery rate follows that pre-existing patch, with a significant difference among species. The monitored meadow reflects the rate of adaptation capacity of each species, including the elongation rate [25]. The recovery observed in the meadow is suggested to correspond to the adaptation capacity of each species, respectively; the results align with previous findings for existing species. H. ovalis is reported to have a strong ability to grow through rhizome elongation [26]. H. uninervis is tolerant to sedimentation and burial [27,28]. Z. capensis, has a low elongation rate since this species is rather adapted to strong tidal currents and long exposing periods, at least in South Africa [19]; nonetheless, BP may experience rather long exposition periods, and tidal currents are moderate [20]. Z. capensis recovery can take one year, as documented [20]. Sampling carried out in May 2023 at the affected or control plots could not find Z. capensis, already an IUCN Red List species. This species might already be extinct in this site (Bairro dos Pescadores) similar to the observation within Portinho, Inhaca Island (eastern Maputo Bay) [29].

4.3. Invertebrate Recovery

4.3.1. General Recovery

Some of the known invertebrate species, such as Meretrix meretrix, Eumarcia paupercula, and Polinices mammilla were rarely spotted or not found at all during the field sampling, even though the first two are the most common clams in Maputo Bay, they are now dwindling [11]. Changes in invertebrate communities’ structure could be influenced by a cascade effect in seagrass ecosystems [30]. For instance, detritus enrichment, as related to the estuarine nature of BP, favors grazers associated with the ecosystem. Vegetation increase can be associated with the increase of invertebrate diversity and density in the present investigation. However, targeted invertebrates for consumption are incrementing at a similar rate as non-edible species (Table 8). The reason for this may be that disturbance through exploitation was statistically non-significant to the fauna recovery. Previous findings suggest that commercial and consumable species have a higher population decline rate compared to other species [30]. As observed in this study, the affected areas could only document one commercial species, S. cylincraceus. Therefore, the recovery rate could be influenced by biological and ecological factors and differs from the declining rate. Thus, correlation analysis shows that targeted invertebrates’ population recovery correlates with seagrass structure. This aligns with the findings from China [31], showing a positive correlation between the two variables. The authors concluded that disturbance as a factor influenced the variables rather than the dependence between them. The finding is supported by previous research concluding that the recovery of ecosystems offers more suitable habitats for fauna [32,33]. Hence, gleaning exclusion inhibits the decrease of invertebrates through the limitation of harvesting and anthropogenic disturbance. Much the same as with previous cases, in Chwaka Bay (Zanzibar), a 5-year decrease of 71% and 64% of gastropods and bivalves, respectively, in two independent experiments attributed to exploitation, were documented [15]. Gleaning presents high-pressure circumstances on targeted invertebrate species more than on the non-targeted species [6]. A local reduction, probable near extinction of commercial species Meretrix meretrix from Bairro dos Pescadores, was observed. The case is similar to the large cowries in Dar-Es-Salam and Zanzibar in Tanzania: the species disappear from gleaning areas while remaining common in protected zones [34].

4.3.2. Interspecies Recovery

Changes observed in the population of invertebrates result from multiple factors, including abiotic and biotic factors. Results emphasize that the exploitation exclusion treatment creates changes in the habitats and affects each species’ recovery differently. Grazer species’ abundance tends to correlate with seagrass coverage [35]. Other factors, such as environmental conditions and diet (algivorous and filter feeder species), may also play a role in the control and abundance of other species [36]. In fact, the local disappearance of Eumarcia paupercula from Bairro dos Pescadores appears related to sedimentation increase. E. paupercula is vulnerable to sedimentation disturbance, as a bioturbance caused by the presence of sand prawn (Callianas kraussi) has negatively impacted the species feeding as filterer bivalves [37]. Adjacent to BP, bivalves Salmacoma litoralis and Anadara antiquata also disappeared seemingly due to land reclamation that enabled sedimentation and change of habitat [11], with no relation to anthropogenic impacts.

4.4. Management Option

Increasing the duration of exclusion has resulted in an increase in animal density and seagrass coverage as depicted in a the graphic abstract (Figure 10). The gleaning exclusion exerts change into the plant structure in the experiment, keeping the plant rooted for a long time, thus, permitting their growth. It was postulated that seagrass variations are most likely influenced by anthropogenic disturbance [6,38]; therefore, the consequences of gleaning activities are non-negligible pressures in intertidal habitats [39], as observed with the seagrass in Bairro dos Pescadores. Gleaning in the area targets mainly buried species, namely razor clam, S. cylindraceus. Henceforth, the activity consists of digging of sediment up to 10 cm, with an extent varying from 0.1 to 8 m2. The activity usually uproots the plant, removing and cutting the plant rhizomes and roots in the process. Afterward, the plants are left outside the sediment, exposed to sunlight until the low tide period ends. Based on that observation, gleaning disturbance results in the die-off of plants and a lowering recolonization process of the uprooted.
A partial no-take settlement can enhance the recovery of the meadows. A similar case has been observed in Nicaragua, where the settlement of a partial no-take zone or Fiji Model for cockle harvests has resulted in the increase of cockles in the adjacent area after a period of two years [22]. The Fiji Model consists of establishments of small-scale permanent marine reserves interspersed with open fishing areas. It has been used for invertebrate management, but the approach design possesses similarities with gleaning exclusion. Some aspects of the present studies were comparable to the Fiji Model. However, some phases differ, including the process of sensitization and the inclusion of local communities into the approach. The Fiji Model passes through a continuous network of six formal monthly meetings and uncountable informal meetings to build trust and support the legitimacy of the no-take reserves rules [22]. For the present study, sensitization was limited to informal conversations with harvesters encountered in the gleaning zone. Despite the fact that results showed a positive recovery in seagrass, and so does the case of Inhaca (eastern Maputo Bay) [20] and invertebrate communities, the inclusion of local communities in the approach was limited and influenced results through the presence of violation inside the plots of exclusion. Considering the level of gleaning exclusion maintained in the present study, there are probabilities that an increase in the score of exclusion could result in a faster and/or higher recovery in seagrass plants as tested out at Inhaca, western Maputo Bay [20] and invertebrates. Moreover, lessons learned from the Fiji Model comprise the inclusion of communities and flexibility in designing management measures. These lessons are essential for seagrass conservation success [22].
Therefore, we suggest that gleaning exclusion is utilized as a tool in the management approach to address the management of gleaning and the decline of the seagrass ecosystem in Bairro dos Pescadores. However, the inclusion of local communities and actors such as municipalities and other flexibility features should be taken into consideration. Flexibility, in turn, consists of considering the communities’ needs in the design of the management of the local community. It can involve the determination of location, size, management monitoring of the resource, and sanction for local violators such as the ones used in the Fiji Model in Menai Bay, Zanzibar [22]. The Menai (Zanzibar) case displayed that poaching in the no-take restricted area was higher before religious festivity and that a temporary opening of the restricted region was proposed to limit invasion and increase the effectiveness of the approach [22]. Even though no typical detail concerning the correlation between cultural events and the intensity of harvesting was observed in Bairro dos Pescadores, it is important to consider the aspects in future management when using the no-take approach with locally based MPA management. Furthermore, an array of management options can be tested, such as discussion with communities and other actors, exploring options for temporary closures of harvesting season to allow for the recovery of edible invertebrates; test options for quotas for gleaners; limiting access to the site to people, for example, locals living within the vicinity of the gleaning site (similar to small scale fishing schemes); discussions of value chains with the aim of allowing for a fair trade value between gleaners and end users, such as, restaurant owners. The vision of a seagrass management plan is needed but will require a better organization of the communities that could be done in a Community-Based Organization (CBO) fashion, also having solid support from other entities such as municipalities, dedicated Non-Governmental Organizations (NGOs), the private sector, and research institutions.

5. Conclusions

In this experiment, the gleaning or harvesting of invertebrates is the main disturbance intended for control. Informal sensitizations were made in the gleaning area to inform local harvesters before the implementation of 50 exclusion plots with monthly monitoring for six months, using the exclusion score to follow up on the seagrass and invertebrates’ recovery. As a result, a gleaning exclusion level classified as “Good” has been settled in Bairro dos Pescadores for the six-month experiment. The results show a positive response after the fifth month of exclusion for H. ovalis and H. uninervis and after the sixth month for Z. capensis. For the invertebrate species, the Shannon Index increased from 1.72 to 2.45. For the interspecies recovery comparison, only H. ovalis and Z. capensis have a significant linear correlation with r = 0.95. The results indicate that increasing the duration of exclusion will result in an increase in invertebrate density for both edible and non-edible species. Therefore, gleaning exclusion can be implemented as a tool for seagrass rehabilitation in Bairro dos Pescadores.
To address the challenge of the ongoing loss of seagrass with fitted management for Bairro dos Pescadores, the following recommendation and information gaps assessment are needed. Such includes an update on seagrass status, its coverage, and change detection in the intertidal zone, including rates of degradation and impacts by communities. Following a recent assessment of value changes, and invertebrate harvesting on-site [7], regular documentation on socio-ecological setting is needed, covering the investigation of the organizational systems and actors involved in seagrass invertebrate fisheries. Such discussion, including brainstorming on alternative livelihoods, needs to engage different actors such as the municipality, civil society, community representatives, and potential private entities who are part of the value chains of invertebrate resources extracted within BP.
For the purposes of seagrass restoration, it is recommended the implementation of no-take periods to allow seagrass and invertebrate fishery recovery. The stakeholders mentioned the need to come together for this to be successful. This is an easy model to guarantee that seagrass and related invertebrates will populate again in BP. Such skims could be utilized to document seagrass donor areas nearby BP for future facilitation of a rather active restoration of seagrass meadows. Seagrass restoration methods should follow standard methods [40,41]. The future of BP seagrass resources will ultimately rely on a concerted management intervention crafted with the engagement of all relevant actors whose forums also discuss the livelihood needs of the communities.

Author Contributions

Conceptualization: S.O.B. and T.F.-R.F.; methodology: S.O.B., T.F.-R.F. and M.P.S.; fieldwork: T.F.-R.F.; data curation: S.O.B. and M.P.S.; writing: T.F.-R.F. and S.O.B.; review and editing: S.O.B. and M.P.S.; project administration and funding, S.O.B. All authors have read and agreed to the published version of the manuscript.

Funding

The REFORM scholarship program (UEM, Mozambique), funded by the Intra-Africa academic mobility scheme of the European Union as part of the Master’s thesis of T.F.-R.F. The projects MASMA “seagrass protect”/WIOMSA (Grant No.: MAS-MA/OP/2018/02), AKDN—Fundação Aga Khan and FCT—Fundação para a Ciência e a Tecnologia, (COBIO-NET project) supported fieldwork. APC funded by WIOSAP/UNEP (Grant Number: GEF Project ID: 4940; SSFA/2019/2480).

Institutional Review Board Statement

Not applicable.

Informed Consent Statement

Not applicable.

Data Availability Statement

Data of this study area kept under Universidade Eduardo Mondlane (UEM).

Acknowledgments

We thank the UEM Faculty of Agronomy and Forestry Engineering and, The Department of Biological Sciences. Cidália Moisés, Assucena Chissico, and Dulce Congolo were instrumental in supporting fieldwork. Our acknowledgments are extended to Almeida Guissamulo and to Josefa Vera Bandeira.

Conflicts of Interest

The authors declare no conflict of interest. The study was solely designed, implemented, and written by the authors.

References

  1. Nordlund, L.M.; Unsworth, R.K.F.; Gullström, M.; Cullen-Unsworth, L.C. Global significance of seagrass fishery activity. Fish Fish. 2018, 19, 399–412. [Google Scholar] [CrossRef] [Green Version]
  2. Furkon, N.N.; Ambo-Rappe, R.; Cullen-Unsworth, L.C.; Unsworth, R.K.F. Social-ecological drivers and dynamics of seagrass gleaning fisheries. Ambio 2020, 49, 1271–1281. [Google Scholar] [CrossRef] [Green Version]
  3. Unsworth, R.K.F.; Mtwana Nordlund, L.; Cullen-Unsworth, L.C. Seagrass meadows support global fisheries production. Conserv. Lett. 2018, 12, e12566. [Google Scholar] [CrossRef]
  4. Unsworth, R.K.F.; Cullen, L.C. Recognising the necessity for Indo-Pacific seagrass conservation. Conserv. Lett. 2010, 3, 63–73. [Google Scholar] [CrossRef]
  5. Duarte, C.M.; Losada, I.J.; Hendriks, I.E.; Mazarrasa, I.; Marbà, M. The role of coastal plant communities for climate change mitigation and adaptation. Nat. Clim. Chang. 2013, 3, 961–968. [Google Scholar] [CrossRef] [Green Version]
  6. Nordlund, L.M.; Gullström, M. Biodiversity loss in seagrass meadows due to local invertebrate fisheries and harbor activities. Estuar. Coast. Shelf Sci. 2013, 135, 231–240. [Google Scholar] [CrossRef]
  7. Chitará-Nhandimo, S.; Chissico, A.; Mubai, M.E.; Cabral, A.D.S.; Guissamulo, A.; Bandeira, S. Seagrass Invertebrate Fisheries, Their Value Chains and the Role of LMMAs in Sustainability of the Coastal Communities—Case of Southern Mozambique. Diversity 2022, 14, 170. [Google Scholar] [CrossRef]
  8. de Boer, W.F.; Prins, H.H.T. Human exploitation and benthic community structure on a tropical intertidal flat. J. Sea Res. 2002, 48, 225–240. [Google Scholar] [CrossRef]
  9. McKenzie, L.J.; Yoshida, R.L.; Aini, J.W.; Andréfouet, S.; Colin, P.L.; Cullen-Unsworth, L.C.; Hughes, A.T.; Payri, C.E.; Rota, M.; Shaw, C.; et al. Seagrass ecosystem contributions to people’s quality of life in the Pacific Island Countries and Territories. Mar. Pollut. Bull. 2021, 167, 112307. [Google Scholar] [CrossRef]
  10. Rosendo, S.; Brown, K.; Joubert, A.; Jiddawi, N.; Mechisso, M. A clash of values and approaches: A case study of marine protected area planning in Mozambique. Ocean. Coast. Manag. 2011, 54, 55–65. [Google Scholar] [CrossRef]
  11. Bandeira, S.; Amone-Mabuto, M.; Chitará-Nhandimo, S.; Scarlet, M.P.; Rafael, J. Impact of Cyclones and Floods on Seagrass Habitats. In Cyclones in Southern Africa. Sustainable Development Goals Series; Nhamo, G., Chikodzi, D., Eds.; Springer: Berlin/Heidelberg, Germany, 2021; pp. 279–288. [Google Scholar] [CrossRef]
  12. Cullen-Unsworth, L.C.; Coliier, C.J.; Nordlung, L.; Paddock, J.; Backer, S.; Unsworth, R.K.F.; Mckenzie, L.J. Seagrasses meadows globally as coupled social-ecological system: Implication for Human Wellbeing. Mar. Pollut. Bull. 2014, 83, 387–397. [Google Scholar] [CrossRef]
  13. Furkon, N.M.; Ambo-Rappe, R. Invertebrate gleaning: Forgotten fisheries. IOP Conf. Ser. Earth Environ. Stud. 2019, 253, 012029. [Google Scholar] [CrossRef]
  14. Shalli, M.S. The role of local taboos in the management of marine fisheries resources in Tanzania. Mar. Policy 2017, 85, 71–78. [Google Scholar] [CrossRef]
  15. Fröcklin, S.; de la Torre-Castro, M.; Håkansson, E.; Carlsson, A.; Magnusson, M.; Jiddawi, N.S. Towards improved management of tropical invertebrate fisheries: Including time series and gender. PLoS ONE 2014, 9, e91161. [Google Scholar] [CrossRef] [Green Version]
  16. Tan, Y.M.; Darby, O.; Kendrick, G.A.; Statton, J.; Sinclair, E.A.; Fraser, M.W.; Macreadie, P.I.; Gillies, C.L.; Coleman, R.A.; Waycott, M.; et al. Seagrass Restoration Is Possible: Insights and Lessons From Australia and New Zealand. Front. Mar. Sci. 2020, 7, 617. Available online: https://www.frontiersin.org/articles/10.3389/fmars.2020.00617 (accessed on 28 May 2023). [CrossRef]
  17. Bandeira, S.; Gullström, M.; Balidy, H.; Samussone, D.; Cossa, D. Seagrass meadows in Maputo Bay. In The Maputo Bay Ecosystem; Bandeira, S., Paula, J., Eds.; WIOMSA: Zanzibar Town, Tanzania, 2014; pp. 147–169. [Google Scholar]
  18. Qiu, G.; Short, F.T.; Fan, H. Temporal variation of intertidal seagrass in southern China (2008–2014). Ocean Sci. J. 2017, 52, 397–410. [Google Scholar] [CrossRef]
  19. Adams, J.B. Distribution and status of Zostera capensis in South African estuaries—A review. S. Afr. J. Bot. 2016, 107, 63–73. [Google Scholar] [CrossRef]
  20. Amone-Mabuto, M.; Hollander, J.; Lugendo, B.; Adams, J.B.; Bandeira, S. A field experiment exploring disturbance-and-recovery, and restoration methodology of Zostera capensis to support its role as a coastal protector. Nord. J. Bot. 2022, 2023, e03632. [Google Scholar] [CrossRef]
  21. Tan, Y.M.; Saunders, J.E.; Yaakub, S.M. A proposed decision support tool for prioritising conservation planning of Southeast Asian seagrass meadows: Combined approaches based on ecosystem services and vulnerability analyses. Bot. Mar. 2018, 61, 305–320. [Google Scholar] [CrossRef]
  22. Crawford, B.; Herrera, M.D.; Hernandez, N.; Leclair, C.R.; Jiddawi, N.; Masumbuko, S.; Haws, M. Small scale fisheries management: Lessons from cockle harvesters in Nicaragua and Tanzania. Coast. Manag. J. 2010, 38, 195–215. [Google Scholar] [CrossRef]
  23. Francis, J.; Nilsson, A.; Waruinge, D. Marine Protected Areas in the Eastern African Region: How Successful Are They? AMBIO A J. Hum. Environ. 2002, 31, 503–511. [Google Scholar] [CrossRef]
  24. Acosta-Alba, I.; Nicolay, G.; Mbaye, A.; Dème, M.; Andres, L.; Oswald, M.; Zerbo, H.; Avadi, A. Mapping fisheries value chains to facilitate their sustainability assessment: Case studies in the Gambia and Mali. Mar. Policy 2022, 135, 104854. [Google Scholar] [CrossRef]
  25. Boström, C.; Baden, S.; Vockelmann, A.C.; Dromph, K.; Fredriksen, S.; Gustafsson, C. Distribution, structure and function of Nordic eelgrass (Zostera marina) ecosystems: Implications for coastal management and conservation. Aquat. Conserv. Mar. Freshw. Ecosyst. 2014, 24, 410–434. [Google Scholar] [CrossRef] [PubMed] [Green Version]
  26. Nakaoka, M.; Aioi, K. Growth of seagrass Halophila ovalis at dugong trails compared to existing within-patch variation in a Thailand intertidal flat. Mar. Ecol. Prog. Ser. 1999, 184, 97–103. [Google Scholar] [CrossRef] [Green Version]
  27. Terrados, J.; Duarte, C.M.; Fortes, M.D.; Borum, J.; Agawin, N.S.R.; Bach, S.; Thampanya, U.; Kamp-Nielsen, L.; Kenworthy, W.J.; Geertz-Hansen, O.; et al. Changes in Community Structure and Biomass of Seagrass Communities along Gradients of Siltation in SE Asia, Estuarine. Coast. Shelf Sci. 1998, 46, 757–768. [Google Scholar] [CrossRef]
  28. Duarte, C.M.; Terrados, J.; Agawin, N.S.R.; Fortes, M.D.; Bach, S.; Kenworthy, W.J. Response of a mixed Philippine seagrass meadow to experimental burial. Mar. Ecol. Prog. Ser. 1997, 147, 285–294. [Google Scholar] [CrossRef] [Green Version]
  29. Bandeira, S.O. Diversity and distribution of seagrasses around Inhaca Island, southern Mozambique. S. Afr. J. Bot. 2002, 68, 191–198. [Google Scholar] [CrossRef] [Green Version]
  30. Van Katwijk, M.M.; Bos, A.R.; de Jonge, V.N.L.; Hanssen, S.A.M.; Hermus, D.C.R.; de Jong, D.J. Guidelines for seagrass restoration: Importance of habitat selection and donor population, spreading of risks, and ecosystem engineering effects. Mar. Pollut. Bull. 2009, 58, 179–188. [Google Scholar] [CrossRef] [PubMed]
  31. Xu, Q.; Guo, D.; Zhang, P.; Zhang, X.; Li, W.; Wu, Z. Seasonal variation in species composition and abundance of demersal fish and invertebrates in a Seagrass Natural Reserve on the eastern coast of the Shandong Peninsula, China. Chin. J. Oceanol. Limnol. 2016, 34, 330–341. [Google Scholar] [CrossRef]
  32. Pogoreutz, C.; Kneer, D.; Litaay, M.; Asmus, H.; Ahnelt, H. The influence of canopy structure and tidal level on fish assemblages in tropical Southeast Asianseagrass meadows. Est. Coastal Shelf Sci. 2012, 107, 58–68. [Google Scholar] [CrossRef]
  33. Horinouchi, M. Review of the effects of within-patch scale structural complexity on seagrass fishes. J. Exp. Mar. Biol. Ecol. 2007, 350, 111–129. [Google Scholar] [CrossRef]
  34. Newton, L.C.; Parkes, E.V.H.; Thompson, R.C. The effects of shell collectinon the abundance of gastropods on Tanzanian shores. Biol. Conserv. 1993, 63, 241–245. [Google Scholar] [CrossRef]
  35. Hays, C.G. Effect of nutrient availability, grazer assemblage and seagrass source population on the interaction between Thalassia testudinum (turtle grass) and its algal epiphytes. J. Exp. Mar. Biol. Ecol. 2005, 314, 53–68. [Google Scholar] [CrossRef]
  36. Cerco, C.F.; Noel, M.R. Monitoring, modeling, and management impacts of bivalve filter feeders in the oligohaline and tidal fresh regions of the Chesapeake Bay system. Ecol. Model. 2010, 221, 1054–1064. [Google Scholar] [CrossRef]
  37. Pillay, D.; Branch, G.; Forbes, A. The influence of bioturbation by the sand prawn Callianassa kraussi on feeding survival of the bivalve Eumarcia paupercula and gastropod Nassarius kraussianus. J. Exp. Mar. Bio. Ecol. 2006, 344, 1–9. [Google Scholar] [CrossRef]
  38. Waycott, M.; Duarte, C.M.; Carruthers, T.J.B.; Orth, R.J.; Dennison, W.C.; Olyarnik, S.; Calladine, A.; Fourqurean, J.W.; Heck, K.L., Jr.; Randall Hughes, A.; et al. Accelerating loss of seagrasses across the globe threatens coastal ecosystems. Proc. Natl. Acad. Sci. USA 2009, 106, 12377–12381. [Google Scholar] [CrossRef] [Green Version]
  39. Al-Wazzan, Z.; Giménez, L.; Behbehani, M.; Le Vay, L. Intertidal bait gleaning on rocky shores in Kuwait. J. Ocean. Coast. Manag. 2020, 188, 105111. [Google Scholar] [CrossRef]
  40. UNEP-Nairobi Convention/WIOMSA. Guidelines for Seagrass Ecosystem Restoration in the Western Indian Ocean Region; UNEP: Nairobi, Kenya, 2020; p. 63. [Google Scholar]
  41. Gamble, C.; Debney, A.; Glover, A.; Bertelli, C.; Green, B.; Hendy, I.; Lilley, R.; Nuuttila, H.; Potouroglou, M.; Ragazzola, F.; et al. Seagrass Restoration Handbook; Zoological Society of London: London, UK, 2021. [Google Scholar]
Figure 1. Geographical setting of Bairro dos Pescadores in the western Maputo Bay and the gleaning exclusion plots. Seagrass map adapted [17].
Diversity 15 00772 g001
Figure 2. Sampling in control sites, affected by digging and revolving of sands as the back picture indicates. Photo credit: S. Bandeira.
Diversity 15 00772 g002
Figure 3. Level of gleaning exclusion per monitoring (April to September). Score of exclusion: (1) red, very low score; (2) marron, low score; (3) light green, medium score; (4) green, good score and (5) dark green, excellent score.
Diversity 15 00772 g003
Figure 4. Seagrass species plant coverage and shoot density (number/m2) along monitoring months (April–September).
Diversity 15 00772 g004
Figure 5. Control plot where gleaning was not excluded. C: S. cylindraceus. Credits. S. Bandeira (A,C), P. Scarlett (B).
Diversity 15 00772 g005
Figure 6. Proportion (in %) of identified species of invertebrates in exclusion plots.
Diversity 15 00772 g006
Figure 7. Invertebrate species density (ind/m2) per month (June–September).
Diversity 15 00772 g007
Figure 8. Species richness and Shannon Index within gleaning exclusion experiment.
Diversity 15 00772 g008
Figure 9. Composition and inter-species density recovery in different plot replicates (three replicates for the four months of exclusion) per month (June–September).
Diversity 15 00772 g009
Figure 10. Graphical abstract.
Diversity 15 00772 g010
Table 1. Summary of method used for data collection.
VariablesMethods
GleaningLevel of exclusionQualitative description of each plot of exclusion (5 m × 5 m) focuses on violation signs, mainly human footprints, gardening hoe traces, removal of seagrass plants, removal of poles, and sedimentation. The variable was set between 5 and 0, where 0 represents the bad conditions of the plot, and 5 represents the best conditions. Each disturbance indicator present in the plot is accounted for to give the final score. The score of a plot was obtained after the subtraction of the disturbance value from 5, the maximum level score of an exclusion plot. Each score corresponds to a class: Excellent–Good–Medium–Low–Very low.
SeagrassDensityIn situ direct shoot counting within 3 subsamples of 0.25 m × 0.25 m selected randomly inside of plots of exclusion.
CoverageIn situ species coverage estimations were done under a subsample of 0.25 m × 0.25 m quadrats placed randomly inside exclusion plots.
InvertebrateDensityNumber of species per unit area estimated from individual collected species within 3 sets of subsamples per exclusion plots. Sieve of 0.25 mm mesh size was used.
RichnessDiversity index calculated with Menhinick’s index.
Shannon IndexIndex combining density and richness calculated using the formula shown below.
Table 2. T samples paired test results for total plant shoot density. * Denotes significant statistical difference (p < 0.05).
MeanSDSE95% C.I. DifferenceTdfSig. (2-Tailed)
LowerUpper
April–May−5.5921.554.59−15.153.96−1.22210.237
April–June−5.6818.353.91−13.822.45−1.45210.161
April–July−7.5919.054.06−16.040.85−1.87210.076
April–Aug−20.6835.127.49−36.25−5.11−2.76210.012 *
April–Sept−37.8645.699.74−58.12−17.61−3.89210.001 *
Table 3. Inter-correlations of seagrass shoots density.
Variable HOHUZCS
HOPearson Correlation1
Sig. (2-tailed)-
HUPearson Correlation0.6881
Sig. (2-tailed)0.13-
ZCPearson Correlation0.951 **0.7921
Sig. (2-tailed)0.0040.06-
SPearson Correlation0.992 **0.770.973 **1
Sig. (2-tailed)00.0730.001-
Note. Variable represents shoots. HO = Halophila ovalis; HU = Halodule uninervis; ZC = Zostera capensis; S = Total plant shoot density. ** Correlation is significant at the 0.01 level (2-tailed).
Table 4. T samples paired test results for H. ovalis species. * Denotes significant statistical difference (p < 0.05).
MeanSDSE95% C.I. DifferenceTdfSig. (2-Tailed)
LowerUpper
April–May−4.7719.154.08−13.263.72−1.17210.255
April–June−2.9114.603.11−9.383.57−0.93210.361
April–July−7.5515.603.33−14.46−0.63−2.27210.034 *
April–Aug−17.6828.856.15−30.47−4.89−2.88210.009 *
April–Sept−28.8241.638.88−47.28−10.36−3.25210.004 *
Table 5. T samples paired test results for H. uninervis species. * Denotes significant statistical difference (p < 0.05).
MeanSDSE95% C.I. DifferenceTdfSig. (2-Tailed)
LowerUpper
April–May−1.864.350.93−3.790.06−2.01210.057
April–June−3.828.241.76−7.47−0.17−2.17210.041 *
April–July−0.683.170.68−2.090.72−1.01210.324
April–Aug−2.145.471.17−4.560.29−1.83210.081
April–Sept−6.459.552.04−10.69−2.22−3.17210.005 *
Table 6. T samples paired result for Z. capensis species.
MeanSDSE95% C.I. DifferenceT df Sig. (2-Tailed)
LowerUpper
April–May1.054.901.05−1.133.221.00210.329
April–June1.054.901.05−1.133.221.00210.329
April–July0.644.791.02−1.492.760.62210.540
April–Aug−0.867.561.61−4.212.49−0.54210.597
April–Sept−2.598.511.82−6.371.18−1.43210.168
Table 7. Species density along the months in Bairro dos Pescadores. ++: Species present with great density; +: species present; *: species present with low density; −: species absent.
Species (Edible Species with E Annotation)June (ind/m2)July (ind/m2)August (ind/m2)September (ind/m2)
Mactrotoma ovalina1 *11 +13 +33 ++
Dosinia hepatica8 *19+31 ++17 +
Nassarius kraussianus12 +515 +19 +
Volema pyrum E0 0 0 1 *
Notocochlis gualteriana1 *1 *4 *1 *
Polinices mamilla E0 0 1 *3 *
Solen cylindraceus E0 3 *23 ++13 +
Haminoea hydatis1 *5 *0 1 *
Meretrix meretrix E0 0 4 *1 *
Macrophthalmus sp.0 0 4 *0
Tellina virgata0 0 0 1 *
Nassarius sp.0 0 0 4 *
Murex brevispina0 0 0 1 *
Table 8. Inter-correlation of invertebrate species density.
Variable MODHNKSCTD
MOPearson Correlation1
Sig. (2-tailed)-
DHPearson Correlation0.591
Sig. (2-tailed)0.22-
NKPearson Correlation0.770.7011
Sig. (2-tailed)0.070.12-
SCPearson Correlation0.630.87 *0.721
Sig. (2-tailed)0.180.020.11-
TDPearson Correlation0.83 *0.91 *0.88 *0.92 **1
Sig. (2-tailed)0.0410.010.020.009-
Note. Variable represents species density/m2. MO = Mactra ovalina; DH = Dosinia hepatica; NK = Nassarius kraussanius; SC = Solen cylindraceus; TD = Total invertebrate density. *. Correlation is significant at the 0.05 level (2-tailed). **. Correlation is significant at the 0.01 level (2-tailed).
Table 9. Correlation between invertebrates (edible and non-edible) and seagrass structure (density and coverage).
Variable EINEISC
EIPearson Correlation1
Sig. (2-tailed)-
NEIPearson Correlation0.85 *1
Sig. (2-tailed)0.029-
SPearson Correlation0.95 **0.7151
Sig. (2-tailed)0.0040.11-
CPearson Correlation0.97 **0.7690.979 **1
Sig. (2-tailed)0.0010.0740.001-
Note. Variable represents invertebrate density, seagrass plant shoot density, and seagrass plant coverage. EI = Edible invertebrate; NEI = non-edible invertebrate; S = Total plant shoot density; C = Total plant coverage. *. Correlation is significant at the 0.05 level (2-tailed). **. Correlation is significant at the 0.01 level (2-tailed).
Disclaimer/Publisher’s Note: The statements, opinions and data contained in all publications are solely those of the individual author(s) and contributor(s) and not of MDPI and/or the editor(s). MDPI and/or the editor(s) disclaim responsibility for any injury to people or property resulting from any ideas, methods, instructions or products referred to in the content.

