Abstract
Entodon challengeri (Paris) Cardot has important environmental monitoring and medical value. It is critical we inspect the influence of climate warming on its spatiotemporal distribution pattern. Based on actual geographical distribution records and environmental datasets, a MaxEnt model coupled with ArcGIS was executed to display the potential suitable habitats of E. challengeri in China under future climate warming scenarios. We showed the following. (i) The simulation accuracy of the MaxEnt model was excellent, with an AUC value of 0.918. (ii) Annual precipitation and precipitation during the wettest month were the critical factors that restricted the distribution range of E. challengeri. (iii) Current suitable habitats were concentrated in the northern temperate zone in eastern China. (iv) Under climate warming scenarios, on the spatial scale, the distributional pattern presented a shrinkage in the south and expansion in the north, which was more obvious in the RCP8.5 than in the RCP2.6 scenario. On the time scale, shrinkage of the potential distributional range was greater in the 2070s than in the 2050s. (v) The distributional centroids shifted to the northeast. In general, future climate warming will have a great negative effect on the suitability of habitats of E. challengeri.
1. Introduction
Global climate warming is indisputably occurring and is expected to increase in the near future. It is a process that affects living things and ecosystems all over the world either directly or indirectly. If the environment mutates, reductions or even extinctions of biological populations can easily occur. In fact, global biodiversity is suffering serious threats from habitat changes caused by climate warming [1,2], particularly those species that are sensitive and difficult to adapt to such climatic circumstances. As a result, plants are changing their geographical distribution range [3]. Predicting the impact of climate warming on suitable plant habitats has become a hot topic. Currently, most studies focus on invasive [4], endemic [5], ecological valuable [6], economically valuable [7,8], and ornamental plants [9]. Overall, the main objects of the above studies are seed plants.
Bryophytes are spore plants, and their species richness is the second largest of terrestrial higher plants [10]. Most bryophytes have only monolayer cells in their leaves, and the epidermis of their leaves lacks a cuticle. They are sensitive to environmental pollutants and show a rapid response. Bryophytes are poikilohydric plants, and it is reported that the stronger the water-holding capacity of bryophytes is, the easier it is for them to adsorb metal ions [11]. As such, bryophytes are generally considered the ideal indicator plant of environmental pollution [12]. Using bryophytes as biomonitors to explore environmental quality monitoring is a sensitive, accurate, and direct method and has become one of the hotspots of environmental science research worldwide [13].
The first step in using bryophytes as biomonitors is to understand their dynamic spatiotemporal distribution pattern and collect sufficient plant samples. Therefore, in future field surveys and sampling, an accurate and realistic distributional map is urgently required as a guide. Bryophytes are extremely sensitive to climatic change and are more vulnerable to global warming than other higher plants [14], and environmental factors determine its distribution [15]. Therefore, climate warming parameters can be set in advance to predict future dynamic changes in its population area to better understand the field distribution of important bryophyte resources.
Climate change has an important impact on the geographical distribution of species [16]. Although most studies show that climate warming will reduce the cover of bryophytes [17], the distribution range of some species is still expanding [18]. The differential responses of suitable habitats indicate that bryophytes have different adaptations to overcome climate warming. In other words, climate warming has interspecific differences on distinct species of the same taxa. One probable reason for this is that different species have respective physiological responses to climate warming, which then affect the population distribution range. In addition, the reductions caused by climate warming are not consistent across sites and appear to be dependent on interactions between temperature and moisture regimes, where species might react uniquely [19]. As a consequence, the distribution area of target species should be simulated separately to obtain more pertinent and accurate results.
Species distribution models (SDMs) make it possible to predict species occurrences in novel conditions. In recent years, SDMs have been increasingly applied to provide valuable information. Along with technological developments in geographic information systems (GISs), scientists have focused on numerous scientific problems related to the geographical distribution of species under climate warming. In particular, the potential geographical distribution of plants can be accurately predicted with GISs and SDMs. Among these models, the maximum entropy (MaxEnt) model is one of the most widely used and has great applicability. MaxEnt builds models by using datasets of current distributional records of species and environmental variables to assess the ecological needs of species and then projects the calculated results to different frames of time and space to predict the distribution range [20]. Extensive studies have confirmed the high predictive accuracy of the MaxEnt model [21,22].
Entodon challengeri (Paris) Cardot, whose synonym is Entodon compressus (Hedw.) Müll. Hal., belongs to the family Entodontaceae [23]. It has important value in China as an indicator species of atmospheric heavy metal pollution [24] as well as for its use as a diuretic and to reduce swelling [25]. Because of the inherent needs of current significant issues, such as the environment and medicine, the demand for E. challengeri in China is on the rise. Nevertheless, a lack of understanding of the geographical potential distribution of E. challengeri has restricted further relevant research. Consequently, it is essential to gain insight into the potential distribution of E. challengeri under current as well as future climate scenarios.
This study aimed to address the following: (i) determine the critical environmental variables that restrict the distribution range of E. challengeri in China; (ii) reveal the distribution pattern of E. challengeri under the current climatic scenario; and (iii) predict and characterize the spatiotemporal shifts of E. challengeri in geographical range over future climatic scenarios. On the one hand, our results provide survey ranges for field investigations and species collections of E. challengeri. On the other hand, our study identified habitats that are no longer suitable for the survival of E. challengeri under climate warming scenarios for which protection plans will be needed in the future.
2. Materials and Methods
2.1. Geographical Occurrence Records
Geographical occurrence records of E. challengeri were collected from the published literature and databases, including the Global Biodiversity Information Facility (GBIF: https://www.gbif.org/, accessed on 31 January 2021); GBIF Occurrence Download https://doi.org/10.15468/dl.fb4t9x, accessed on 31 January 2021), National Specimen Information Infrastructure (NSII: http://www.nsii.org.cn, accessed on 31 January 2021), and Chinese Virtual Herbarium (CVH: http://www.cvh.ac.cn, accessed on 31 January 2021). Furthermore, field surveys were conducted for a period of five years (2017–2021) to collect distribution data of E. challengeri in China. For records lacking geographical information, Google Earth (http://earth.google.com/web/, accessed on 31 January 2021) was used to perform geographical analysis. To reduce the prediction bias caused by data spatial autocorrelation, we used SDMtoolbox 2.4 (http://www.sdmtoolbox.org/, accessed on 31 January 2021) in ArcGIS to divide the vector map of China into a grid with a resolution of arc-5 min to automatically eliminate points with similar distances. After thinning, 114 valid occurrence records were retained for modeling (Supplementary Information File S1).
2.2. Environmental Variable Datasets
Nineteen bioclimatic variable datasets (Table 1) of the current (1952–2000) and future (2050s: 2041–2060 and 2070s: 2061–2080) climate scenarios were downloaded from the WorldClim database (https://www.worldclim.org/, accessed on 1 February 2021). The future climate scenarios were calculated using the Community Climate System Model (CCSM), and two typical representative concentration pathways (RCP2.6, RCP8.5) were selected. RCP2.6 and RCP8.5 represented the lowest and highest carbon dioxide emission scenarios, respectively. The spatial resolution of the environmental variables was 30 arc seconds (approximately 1 km2).

Table 1.
The nineteen bioclimatic variables used in the MaxEnt model.
Through a three-step screening process, the important environmental variables affecting the distribution of E. challengeri-suitable habitats were determined. First, all environmental variables used for screening were added to the MaxEnt model using the jackknife test, and the variables with low contribution rates were deleted. Second, because the presence of collinearity among the bioclimatic variables can limit model performance [26], to avoid possible correlation among various environmental variables affecting the prediction accuracy, the ArcGIS spatial analysis tool was used to analyze the Pearson correlation of nineteen bioclimatic variables. Then, the factors with high collinearity (|r ≥ 0.8|) were removed. Third, the principle of selection was used to screen out variables with a relatively high contribution rate and low correlation for repeated operation in the MaxEnt model. Thus, seven bioclimatic variables were selected for model analyses: Bio2, Bio3, Bio9, Bio11, Bio12, Bio13, and Bio14. Additionally, altitude, aspect, and slope, due to their relation to distribution, were included in the simulation. Altogether, there were ten variables included in the model prediction.
2.3. Software and Digital Maps
ArcGIS 10.3 was developed by the American Institute of Environmental Systems. MaxEnt v3.4.4k was obtained from the website (https://biodiversityinformatics.amnh.org/open_source/maxent/, accessed on 2 February 2021). A 1:1,000,000 administrative regionalization digital map of China was downloaded from the National Basic Geographic Information System (http://www.webmap.cn/main.do?method=index, accessed on 2 February 2021).
2.4. Operation and Accuracy of the MaxEnt Model
Initially, according to the requirements of the MaxEnt model, the species distributional occurrence dataset was saved in CSV format, and the environmental variable datasets were transformed from raster to ASCII format by the ‘From Raster to ASCII’ tool in ArcGIS. Next, the species distributional occurrence records along with environmental variable datasets were imported into the MaxEnt. We set up at least 10 repetitions and generated random prediction models, and the average model was selected for prediction. The random 75% distributional occurrence records were used for the model training dataset, and the residual 25% were used for the validation dataset. Then, the jackknife test was selected, response curves were drawn for the sensitivity analysis of various environmental variables, the other parameters were set as default values, and the MaxEnt model was run [27].
The performance of the MaxEnt model was examined by using a repetitive data-splitting process (cross-validation) based on assessment metrics, that is, receiver operating characteristic (ROC) analysis. The ROC curve takes the ratio that actually exists and is predicted to exist as the ordinate, the ratio that actually does not exist but is predicted to exist as the abscissa, and the size of the enclosed area under the ROC curve (AUC) as the indicator to measure the accuracy of the model prediction [28]. The range of AUC values was 0–1, with values closer to 1 having a stronger correlation between the selected environmental variables and the geographical distribution of the predicted species, and thus having a higher prediction accuracy. Specifically, an AUC below 0.8 is poor, 0.7–0.8 is fair, 0.8–0.9 is good, 0.9–1 is excellent, and 1 is perfect [29]. Additionally, we calculated the true skill statistic (TSS) to assess model accuracy [30].
2.5. Spatiotemporal Distribution Pattern and Calculation of Area
The output results of the MaxEnt model were the existence probability (P) of E. challengeri in China, and the data format was ASCII. The ArcToolbox of ArcGIS was used to convert the datasets to the raster format. We then implemented the reclassification program in ArcGIS to divide the distributional value level and the corresponding distribution range. Subsequently, we used the grid calculator to calculate the area of expansion or reduction habitats under future climatic scenarios.
2.6. Migration Routes of Distributional Centroids
The migration routes of distributional centroids of E. challengeri were calculated using the SDMtoolbox [31]. It concentrated the species distribution into an independent central point and created a vector file depicting the direction and magnitude of changes over time.
3. Results
3.1. Accuracy Test of the MaxEnt Model Using the ROC Curve and AUC Value
The training AUC and TSS obtained via MaxEnt analysis were 0.918 and 0.926, respectively. The output results show an excellent model performance, and the model was robust in predicting the distribution of the target species (Figure 1).
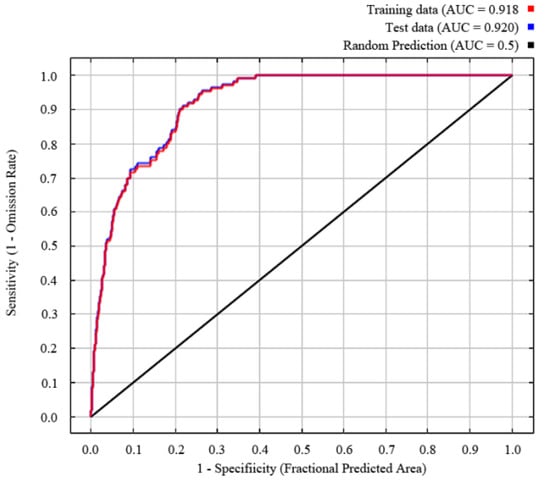
Figure 1.
Model suitability test and AUC value.
3.2. Critical Environmental Variables Affecting the Distribution of E. challengeri
The results of the jackknife test reflect the contribution of different environmental variables to the gain in distribution area. In this method, the training scores of ‘Without variable’, ‘With only variable’, and ‘With all variables’ were calculated, and the judgment criteria were as follows. The score is higher when it is ‘Without variable’, indicating that the variable has a high predictive ability and makes a great contribution to the species distribution. When it is ‘With only variable’, the training score ability of the model decreases significantly, indicating that the variable has more unique information and is more important for species distribution. The model training score is the highest when it is ‘With all variables’, which means that all variables have the best predictive effect when they are used for model prediction. The results of the jackknife test revealed that the order of importance of environmental variables affecting the prediction effect was Bio12, Bio13, Bio3, Alt., Bio11, Slo., Bio14, Bio2, Asp., and Bio9 (Figure 2). The extent to which each environmental variable contributed to the MaxEnt model showed that Bio12 and Bio13 were the critical limiting factors for the potential distribution of E. challengeri, with single-factor contribution rates of 31.7% and 18.8%, respectively. The cumulative contribution rate of other environmental factors was 49.5% (Table 2). Furthermore, the response curve between the dominant environmental variables and the distribution probability showed that the threshold ranges of Bio12 and Bio13 were 300–1750 mm (Figure 3a) and 130–540 mm (Figure 3b), respectively. In the above ranges, the potential distribution probability of E. challengeri was high.
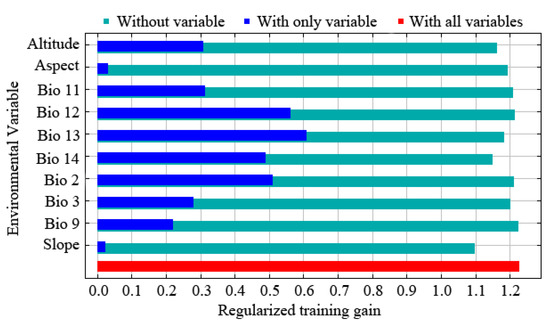
Figure 2.
The importance of environmental variables for the distribution of Entodon challengeri in China according to a jackknife test.
Table 2.
Contribution rates of ten environmental variables influencing the distribution of Entodon challengeri.
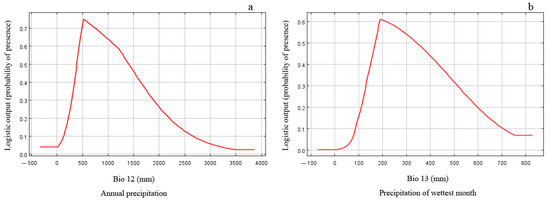
Figure 3.
Response curves of predicted probabilities to critical environmental factors. (a) Bio12 is annual precipitation. (b) Bio13 is precipitation of wettest month.
3.3. Current Distribution Pattern of E. challengeri
Under current climate conditions, the predicted map demonstrated that the actual occurrence records (Figure 4a) were consistent with the simulated suitable habitats (Figure 4b). The threshold value of the probability of the existence of E. challengeri was 0.13. The suitability levels of habitats of E. challengeri were divided into unsuitable (0–0.13), low (0.13–0.34), moderate (0.34–0.57), and high (0.57–1) suitability habitats using the method of nature breaks. The northern temperate areas in eastern China (102–129° E, 23–50° N) offered a suitable range for the E. challengeri current, with a total area of 4.32 × 10⁶ km2 (Table 3). High-suitability habitats of E. challengeri were concentrated in eastern China (Anhui Province, Hubei Province, Jiangsu Province, Jiangxi Province, Zhejiang Province, and Fujian Province), southwestern China (Guizhou Province, the junction of Guizhou Province, Hubei Province, Hunan Province, and Chongqing City), northern China (Hebei Province, Beijing City, Shanxi Province, and Shandong Province) and northeastern China (Liaoning Province) (Figure 4).
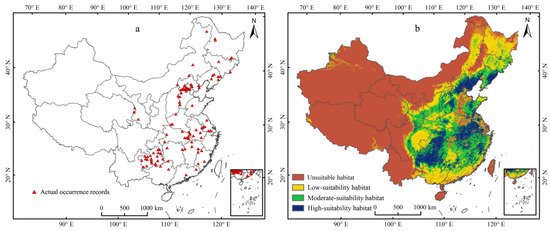
Figure 4.
The actual and predicted distribution of Entodon challengeri under the current climate scenario based on the MaxEnt model in China. (a) Actual occurrence records. (b) Current geographical distribution predicted using the MaxEnt model. Unsuitable habitat is represented by red; low-suitability habitat is represented by yellow; moderate-suitability habitat is represented by green; high-suitability habitat is represented by blue.
Table 3.
Dynamic distributional area of Entodon challengeri under future climate scenarios.
3.4. Dynamic Spatiotemporal Distribution of E. challengeri under Future Scenarios
In terms of spatial scale, among the different levels of suitable habitats, the high-suitability habitats of E. challengeri decreased most significantly (Figure 5a–d). In addition, although the suitable habitats experienced gains and losses under the future climate scenarios, the range of losses was larger than the range of gains (Figure 6a–d). Gains and losses were predicted to occur in the northernmost and southernmost regions of China, respectively. In detail, the gains were located in northeast China, including in the Greater Khingan Mountains and the Lesser Khingan Mountains. The losses mainly occurred in the southern regions of the Yunnan, Guangdong, Guangxi, and Fujian Provinces, followed by the Sichuan Basin. The total suitable area of E. challengeri showed a decline of 8.80–35.88% within all future scenarios compared with the current area; in particular, the decline in the RCP8.5 scenario was greater than that in the RCP2.6 scenario. In terms of temporal scale, high-suitability habitats, total suitable area, and losses varied more in the 2070s than in the 2050s (Table 3).
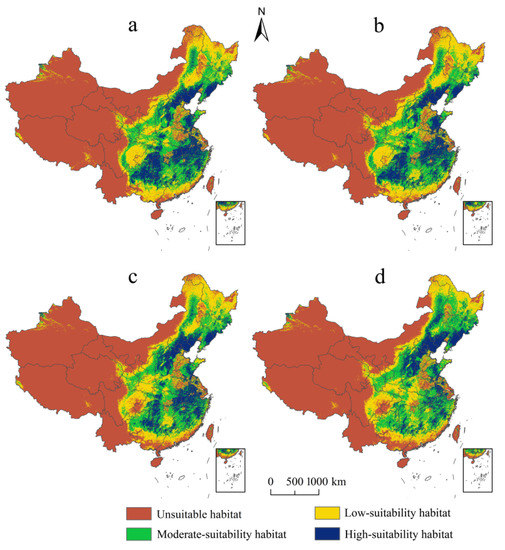
Figure 5.
Potential distribution of Entodon challengeri under future climate scenarios. (a) Potential distribution in RCP2.6–2050s. (b) Potential distribution in RCP2.6–2070s. (c) Potential distribution in RCP8.5–2050s. (d) Potential distribution in RCP8.5–2070s. Unsuitable habitat is represented by red; low-suitability habitat is represented by yellow; moderate-suitability habitat is represented by green; high-suitability habitat is represented by blue.
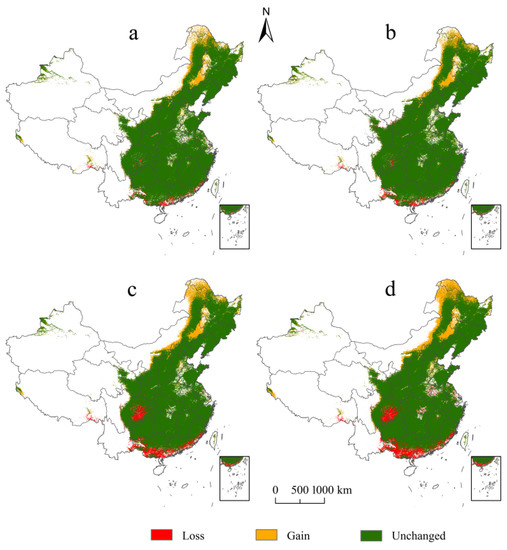
Figure 6.
Comparison of the distribution of Entodon challengeri between current and future climate scenarios. (a) Comparison of the potential distribution between the current conditions and RCP2.6–2050s. (b) Comparison of the potential distribution between the current conditions and RCP2.6–2070s. (c) Comparison of the potential distribution between the current conditions and RCP8.5–2050s. (d) Comparison of the potential distribution between the current conditions and RCP8.5–2070s. Habitat loss is represented by red; habitat gain is represented by yellow; unchanged habitat is represented by green.
3.5. Migration Routes of Distributional Centroids of E. challengeri
The current distributional centroid was predicted to be located in Henan Province (114°30′36″ E, 32°36′36″ N). In RCP2.6, the distributional centers were located in northern Anhui Province, and they moved from the centroid (115°24′36.05″ E, 33°18′36″ N) in the 2050s to the centroid (115°37′48″ E, 33°32′24.09″ N) in the 2070s. In RCP8.5, the center (116°16′12.03″ E, 34°34′11.93″ N) in the 2050s located in Anhui Province migrated to the center (117°36′36″ E, 37°10′12.07″ N) in the 2070s in Shandong Province. Taken together, the centroids migrated to the northeast of high latitudes, and the migration distance in RCP8.5 was far greater than that in RCP2.6 (Figure 7).
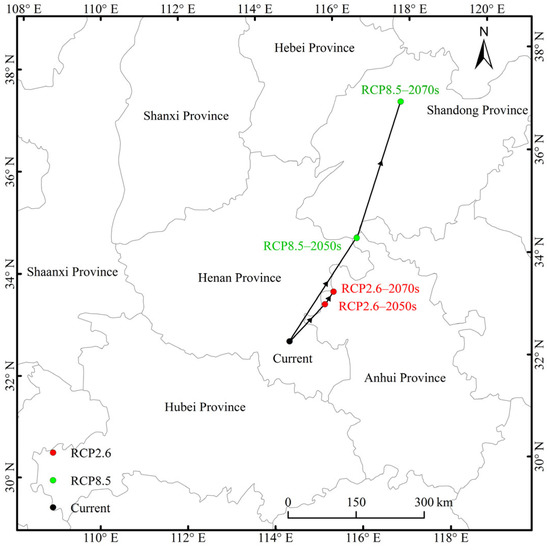
Figure 7.
Migration routes of Entodon challengeri under future climate scenarios. The black dot represents the current suitable distribution center, the red dots represent suitable distribution centers under the RCP2.6 climate scenario in the 2050s and 2070s, and the green dots represent the suitable distribution centers under the RCP8.5 climate scenario in 2050s and 2070s.
4. Discussion
4.1. Performance of the MaxEnt Model
The response relationship between species distribution and environmental factors is one of the important components of ecological research. In recent years, studies have increasingly used the MaxEnt model to predict the geographical distribution of bryophytes [32,33]. In this study, the relationship between the geographical distribution of E. challengeri and climate warming was examined in spatial and temporal dimensions. Consistent with previous studies, the distribution prediction map showed a good match with the actual occurrence records when the MaxEnt model was used [34]. This study confirmed that the MaxEnt model was applicable to determine the geographical distribution of E. challengeri in China, and the prediction results of the MaxEnt model were reliable.
4.2. Critical Environmental Factors Affecting the Distribution of E. challengeri
In large-scale geographical space, the distribution of plants is influenced by temperature and precipitation. According to recent reports, water is generally regarded as an important factor in the distribution of bryophytes [35]. For example, our previous studies showed that precipitation of driest month (Bio14) is a critical factor for the distribution of Sphagnum bogs [36], and annual precipitation (Bio12) is the most important factor influencing Climacium dendroides (Hedw.) F. Weber & D. Mohr [33]. In this study, Bio12 and precipitation of wettest month (Bio13) were the critical environmental factors, being dominant over the other variables that restricted the distribution of E. challengeri. Water dominates the distribution of bryophytes, which may be attributed to its origin. The reasons for this may be that bryophytes are transitional groups moving from aquatic to terrestrial habitats and that the reproductive process must be completed with the participation of water. Therefore, water is an essential condition for the flourishing population of bryophytes and thus affects geographical distribution.
4.3. Suitable Habitats for E. challengeri under the Current Climate Scenario
Each species occupies a limited distribution range on the Earth’s surface. This study found that the suitable habitats for E. challengeri were mainly concentrated in the northern temperate zone of eastern China. This may be because the floristic type of E. challengeri is in the north temperate zone. Compared to other climate zones, the north temperate zone has a suitable humidity and temperature for E. challengeri. And E. challengeri is a shady plant that colonizes under forest canopies [37]. In regions with suitable climatic habitats, bryophytes with north temperate flora may spread widely [38]. Thus, the floristic properties of plants and climate conditions together determine the geographical distribution of plants [39].
4.4. Spatiotemporal Shifts in Suitable Habitats under Future Climate Scenarios
The geographical distribution range of plants is constantly changing. The impact of climate warming on the geographical distribution of plants is reflected in the changes in distribution range and area. Climate warming generally decreases the suitable distributional area of bryophytes. For example, Désamoré et al. predicted that the distributional area of Homalothecium sericeum (Hedw.) Schimp. in southern Europe will decrease significantly by the 2080s [40]. Our study demonstrated that the area of predicted climatically suitable habitats for E. challengeri under future climate conditions was significantly fewer than its current distribution. Generally, the negative impact of climate warming on the distribution pattern of different species is similar but to different degrees.
Moreover, the adverse effects were predicted to be more pronounced in RCP8.5 than in RCP2.6 and more serious in the 2070s than in the 2050s. This means that climate warming threatens the survival of E. challengeri, and with the intensification of climate warming over time, the range of suitable habitat areas will decrease further. Compared with the present distribution range, the future predicted distribution range showed a trend of ‘northern expansion and southern shrinkage’. Additionally, the northern range boundaries of climatically suitable habitats for E. challengeri in China were predicted to extend further north. Notably, southern China and the Sichuan Basin were at high risk for habitat loss, and special attention should be given to their preferential protection. These two zones are typified by flat terrain, fertile soil, and warm and humid climates [41], which are ideal suitable habitats for E. challengeri. Hence, the loss area predicted in this study should be taken as the priority area for monitoring.
4.5. Migration Routes of Centroid under Future Climate Scenarios
A species may cope with climate change in four ways: survival, adaptation, migration, or extinction [42]. If the key environmental factors exceed the threshold range for optimal growth, in the context of global warming, plants may be forced to migrate to find new suitable habitats to expand their range of population distribution or may go extinct if their migration speed cannot catch up with the speed of climate change [43]. Many studies and observations have indicated that global warming promotes the migration of plants to higher latitudes [2,44]. Most plant species that lack an effective and rapid migration ability will have difficulty finding suitable habitat areas [45]. However, plants with short life cycles and fast reproductive cycles, such as bryophytes, migrate faster than trees with long reproductive cycles. According to a new study in Europe covering 40 representative bryophyte species, the species has expanded and migrated to the north because of climate warming [46]. Similarly, our present study predicted latitudinal shifts upward. The migration distance in RCP8.5 was greater than that in RCP2.6, which implies that a higher concentration of greenhouse gas emissions stimulated intense migrations of E. challengeri.
Whether E. challengeri will become extinct depends on multiple factors, such as its understory habitat, adaptability, and spore production. Worryingly, global climate change and the range of native species are proceeding at different speeds, with the former shifts much quicker and thus in the long term rendering current distributions climatically unsuitable for many species. This climate change is the main driver of species relocation to new areas. A new study noted that even bryophytes that have highly efficient wind dispersal systems will not be able to withstand the rate of climate change over the next few decades [46]. Even so, the ideal habitats for E. challengeri are moving toward higher cold zones due to a need to adapt to climate warming through migration. Regarding natural spread, the dispersal routes of bryophytes are mainly along the mountains. Extinction in a short time period is not the primary strategy for this species in combating climate warming.
4.6. Future Studies
Although environmental factors typically emerge as the overriding correlates at broad spatial scales, other drivers of ecological processes are crucial predictors at finer spatial scales. In addition, anthropogenic disturbances and habitat fragmentation may exacerbate a crisis in the wild population of bryophytes [36]. Due to the limitations of time and data, the environmental variables selected in this study were not sufficiently comprehensive. Henceforth, before further research can be carried out, human activities, topography, vegetation, and spore dispersal ability need to be supplemented to increase the accuracy of the prediction results. Likewise, microhabitats should be considered in the model. Again, the distribution points obtained from our field investigations were concentrated in summer, and the short-term field survey was not sufficient to cover the whole country. Hence, the improvement and application of the research results still need support via long-term data collection and monitoring. Finally, the next step is to carry out research on the functional efficiency of the natural reserve for E. challengeri [47].
5. Conclusions
This present study was the first attempt to gather national occurrence records of E. challengeri in China and predict its distributional habitats by using the MaxEnt model and ArcGIS. The distributional map provided in this study is an important record and can be used for future field investigations. Climate warming is predicted to have adverse effects on the suitable habitats of E. challengeri. Greater intensity and longer periods of climate warming may drive greater suitable habitat loss. Specifically, the reductions will occur in southern China and the Sichuan Basin, which are no longer suitable for the survival of E. challengeri, and care should be taken to preserve the above two areas. Precipitation was shown to play a dominant role in the distribution. Future climate warming may trigger the centroids to move to higher latitudes in the northeast direction. Due to its growth under forest canopies, the management plan of E. challengeri depends on the comprehensive management of forestry.
Supplementary Materials
The following supporting information can be downloaded at: https://www.mdpi.com/article/10.3390/d15070871/s1. Supplementary Information File S1. Geographical distributional records of E. challengeri in China.
Author Contributions
Data curation, Y.L., M.C.; Software, W.Y.; Writing—review and editing, M.C. All the authors reviewed and approved the final manuscript for submission. All authors have read and agreed to the published version of the manuscript.
Funding
This research was funded by the National Natural Science Foundation of China (31700168), Jiangxi Provincial Natural Science Foundation (20202BABL213044, 20212BAB203023), and Science and Technology Project of Educational Department in Jiangxi Province (GJJ200327). The funders had no role in the study design, data collection and analysis, decision to publish, or preparation of the manuscript.
Institutional Review Board Statement
Not applicable.
Data Availability Statement
All data generated or analyzed during this study are included in this published article and its Supplementary Information files.
Acknowledgments
The authors would like to gratefully acknowledge the contributors of the database used in this study. Also, we extend our appreciation to the esteemed editor and anonymous reviewers for their instructive comments on the earlier versions of this manuscript.
Conflicts of Interest
The authors declare no conflict of interest.
References
- Barbarossa, V.; Bosmans, J.; Wanders, N.; King, H.; Biekens, M.F.P.; Huijbregts, M.A.J.; Schipper, A.M. Threats of global warming to the world’s freshwater fishes. Nat. Commun. 2021, 12, 1701. [Google Scholar] [CrossRef]
- Bellard, C.; Bertelsmeier, C.; Leadley, P.; Thuiller, W.; Courchamp, F. Impacts of climate change on the future of biodiversity. Ecol. Lett. 2012, 15, 365–377. [Google Scholar] [CrossRef] [PubMed]
- Dullinger, S.; Gattringer, A.; Thuiller, W.; Moser, D.; Zimmermann, N.E.; Guisan, A.; Willner, W.; Plutzar, C.; Leitner, M.; Mang, T.; et al. Extinction debt of high-mountain plants under twenty-first-century climate change. Nat. Clim. Chang. 2012, 2, 619–622. [Google Scholar] [CrossRef]
- Zhang, X.J.; Wang, Y.R.; Peng, P.H.; Wang, G.Y.; Zhao, G.Y.; Zhou, Y.X.; Tang, Z.H. Mapping the distribution and dispersal risks of the alien invasive plant Ageratina adenophora in China. Diversity 2022, 14, 915. [Google Scholar] [CrossRef]
- Zhang, K.; Zhang, Y.; Tao, J. Predicting the potential distribution of Paeonia veitchii (Paeoniaceae) in China by incorporating climate change into a maxent model. Forests 2019, 10, 190. [Google Scholar] [CrossRef]
- Cruz-Jiménez, I.; Delgado-Sánchez, P.; Guerrero-González, M.d.l.L.; Puente-Martínez, R.; Flores, J.; De-Nova, J.A. Predicting geographic distribution and habitat suitability of Opuntia streptacantha in paleoclimatic, current, and future scenarios in Mexico. Ecol. Evol. 2023, 13, e10050. [Google Scholar] [CrossRef]
- Puchałka, R.; Paź-Dyderska, S.; Woziwoda, B.; Dyderski, M.K. Climate change will cause climatic niche contraction of Vaccinium myrtillus L. and V. vitis-idaea L. in Europe. Sci. Total Environ. 2023, 892, 164483. [Google Scholar] [CrossRef]
- Khan, A.M.; Li, Q.; Saqib, Z.; Khan, N.; Habib, T.; Khalid, N.; Majeed, M.; Tariq, A. MaxEnt modelling and impact of climate change on habitat suitability variations of economically important chilgoza pine (Pinus gerardiana Wall.) in South Asia. Forests 2022, 13, 715. [Google Scholar] [CrossRef]
- Zhang, K.L.; Yao, L.J.; Meng, J.S.; Tao, J. Maxent modeling for predicting the potential geographical distribution of two peony species under climate change. Sci. Total Environ. 2018, 634, 1326–1334. [Google Scholar] [CrossRef]
- Maksimova, V.; Klavina, L.; Bikovens, O.; Zicmanis, A.; Purmalis, O. Structural characterization and chemical classification of some bryophytes found in Latvia. Chem. Biodivers. 2013, 10, 1284–1294. [Google Scholar] [CrossRef]
- Chiarenzelli, J.R.; Aspler, L.B.; Ozarko, D.L.; Hall, G.E.M.; Powis, K.B.; Donaldson, J.A. Heavy metals in lichens, ‚southern district of Keewatin Northwest Territories Canada. Chemosphere 1997, 35, 1329–1341. [Google Scholar] [CrossRef]
- Cowden, P.; Aherne, J. Assessment of atmospheric metal deposition by moss biomonitoring in a region under the influence of a long standing active aluminium smelter. Atmos. Environ. 2019, 201, 84–91. [Google Scholar] [CrossRef]
- Trujillo-Gonzalez, J.M.; Zapata-Muñoz, Y.L.; Torres-Mora, M.A.; García-Navarro, F.J.; Jiménez-Ballesta, C.R. Assessment of urban environmental quality through the measurement of lead in bryophytes: Case study in a medium-sized city. Environ. Geochem. Health 2020, 42, 3131–3139. [Google Scholar] [CrossRef]
- Bates, J.W.; Thompson, K.; Grime, J.P. Effects of simulated long-term climatic change on the bryophytes of a limestone grassland community. Glob. Chang. Biol. 2005, 11, 757–769. [Google Scholar] [CrossRef]
- He, X.L.; He, K.S.; Hyvönen, J. Will bryophytes survive in a warming world? Perspect. Plant Ecol. Evol. Syst. 2016, 19, 49–60. [Google Scholar] [CrossRef]
- Dyderski, M.K.; Paz, S.; Frelich, L.E.; Jagodziński, A.M. How much does climate change threaten European forest tree species distributions. Glob. Chang. Biol. 2018, 24, 1150–1163. [Google Scholar] [CrossRef]
- Wu, J.G. The danger and indeterminacy of forfeiting perching space of bryophytes from climate shift: A case study for 115 species in China. Environ. Monit. Assess. 2022, 194, 233. [Google Scholar] [CrossRef]
- Mao, L.H.; Li, Y.; Liu, C.; Fang, Y.M. Prediction of potential distribution of Haplocladium microphyllum in China based on MaxEnt model. Chin. J. Ecol. 2017, 36, 54–60. (In Chinese) [Google Scholar] [CrossRef]
- Koncz, P.; Hermanutz, L.; Marino, P.; Wheeler, J.; Cranston, B. Bryophyte community diversities and expected change under a warming climate in contrasting habitats of the Torngat Mountains, Labrador. Bryologist 2018, 121, 174–182. [Google Scholar] [CrossRef]
- Chan, L.M.; Brown, J.L.; Yoder, A.D. Integrating statistical genetic and geospatial methods brings new power to phylogeography. Mol. Phylogenet. Evol. 2011, 59, 523–537. [Google Scholar] [CrossRef]
- Liao, Y.; Song, X.; Ye, Y.; Gu, J.; Wang, R.; Zhuogabayong; Zhao, D.; Shao, X. Climate change may pose additional rhreats to the endangered endemic species Encalypta buxbaumioidea in China. Diversity 2023, 15, 269. [Google Scholar] [CrossRef]
- Scrivanti, L.R.; Anton, A.M. Impact of climate change on the Andean distribution of Poa scaberula (Poaceae). Flora 2021, 278, 151805. [Google Scholar] [CrossRef]
- Iwatsuki, Z.; Tan, B.C. Entodon challengeri (Paris) Cardot, the correct name for E. compressus sensu Mizushima and Crum and Anderson. Taxon 2001, 50, 1125–1128. [Google Scholar] [CrossRef]
- Jiang, P.H.; Luo, Y.L.; Peng, K.J.; Chen, C. Progress on the research of bryophytes applied to monitoring of air pollution by heavy metal. Environ. Pollut. Control 2015, 37, 82–87. (In Chinese) [Google Scholar] [CrossRef]
- Harris, E.S.J. Ethnobryology: Traditional uses and folk classification of bryophytes. Bryologist 2008, 111, 169–217. [Google Scholar] [CrossRef]
- Dormann, C.F.; Elith, J.; Bacher, S.; Buchmann, C.; Carl, G.; Carré, G.; Lautenbach, S. Collinearity: A review of methods to deal with it and a simulation study evaluating their performance. Ecography 2013, 36, 27–46. [Google Scholar] [CrossRef]
- Phillips, S.J.; Dudík, M. Modeling of species distributions with Maxent: New extensions and a comprehensive evaluation. Ecography 2008, 31, 161–175. [Google Scholar] [CrossRef]
- Phillips, S.J.; Anderson, R.P.; Schapire, R.E. Maximum entropy modeling of species geographic distributions. Ecol. Model. 2006, 190, 231–259. [Google Scholar] [CrossRef]
- Vanagas, G. Receiver operating characteristic curves and comparison of cardiac surgery risk stratification systems. Interact. Cardiovasc. Thorac. Surg. 2004, 3, 319–322. [Google Scholar] [CrossRef]
- Allouche, O.; Tsoar, A.; Kadmon, R. Assessing the accuracy of species distribution models: Prevalence, kappa and the true skill statistic (TSS). J. Appl. Ecol. 2006, 43, 1223–1232. [Google Scholar] [CrossRef]
- Brown, J.L. SDMtoolbox: A python-based GIS toolkit for landscape genetic, biogeographic and species distribution model analyses. Methods Ecol. Evol. 2014, 5, 694–700. [Google Scholar] [CrossRef]
- Wierzcholska, S.; Dyderski, M.K.; Jagodziński, A.M. Potential distribution of an epiphytic bryophyte depends on climate and forest continuity. Glob. Planet. Chang. 2020, 193, 103270. [Google Scholar] [CrossRef]
- Cong, M.Y.; Jian, M.F.; Xu, Y.Y.; Tang, L.Y.; Li, J.J.; Yang, W.J.; Zhu, Y.M. Geographical distribution and migration routes of the medical bryophyte, Climacium dendroides, under climate warming in China. Plant Biosyst. 2021, 156, 663–670. [Google Scholar] [CrossRef]
- Kruijer, H.; Raes, N.; Stech, M. Modelling the distribution of the moss species Hypopterygium tamarisci (Hypopterygiaceae, Bryophyta) in Central and South America. Nova Hedwig. 2010, 91, 399–420. [Google Scholar] [CrossRef]
- Wang, Z.M.; Ye, W.; Xing, F.W. Bryophyte diversity on a tropical continental island (Hainan, China): Potential vulnerable species and environmental indicators. J. Bryol. 2019, 41, 350–360. [Google Scholar] [CrossRef]
- Cong, M.Y.; Xu, Y.Y.; Tang, L.Y.; Yang, W.J.; Jian, M.F. Predicting the dynamic distribution of Sphagnum bogs in China under climate change since the last interglacial period. PLoS ONE 2020, 15, e0230969. [Google Scholar] [CrossRef]
- Tian, Y.; Li, Y.H. Comparative analysis of bacteria associated with different mosses by 16S rRNA and 16S rDNA sequencing. J. Basic Microbiol. 2017, 57, 57–67. [Google Scholar] [CrossRef]
- Delgadillo, C.; Villaseñor, J.L.; Ortiz, E. The potential distribution of Grimmia (Grimmiaceae) in Mexico. Bryologist 2012, 115, 12–22. [Google Scholar] [CrossRef]
- Lin, S.L.; Chen, L.; Peng, W.X.; Yu, J.H.; He, J.K.; Jiang, H.S. Temperature and historical land connectivity jointly shape the floristic relationship between Hainan Island and the neighbouring landmasses. Sci. Total Environ. 2021, 769, 144629. [Google Scholar] [CrossRef]
- Désamoré, A.; Laenen, B.; Stech, M.; Papp, B.; Hedenäs, L.; Mateo, R.G.; Vanderpoorten, A. How do temperate bryophytes face the challenge of a changing environment? Lessons from the past and predictions for the future. Glob. Chang. Biol. 2012, 18, 2915–2924. [Google Scholar] [CrossRef]
- Lu, S.F.; Zhou, S.Y.; Yin, X.J.; Zhang, C.; Li, R.L.; Chen, J.H.; Ma, D.X.; Yi, W.; Yu, Z.X.; Chen, Y.H. Patterns of tree species richness in Southwest China. Environ. Monit. Assess. 2021, 193, 97. [Google Scholar] [CrossRef] [PubMed]
- Beniston, M. Climatic change in mountain regions: A review of possible impacts. Clim. Chang. 2003, 59, 5–31. [Google Scholar] [CrossRef]
- Matesanz, S.; Valladares, F. Ecological and evolutionary responses of Mediterranean plants to global change. Environ. Exp. Bot. 2014, 103, 53–67. [Google Scholar] [CrossRef]
- Zhang, X.H.; Wei, H.Y.; Zhao, Z.F.; Liu, J.; Zhang, Q.Z.; Zhang, X.Y.; Gu, W. The global potential distribution of invasive plants: Anredera cordifolia under climate change and human activity based on random forest models. Sustainability 2020, 12, 1491. [Google Scholar] [CrossRef]
- Varol, T.; Canturk, U.; Cetin, M.; Ozel, H.B.; Sevik, H. Impacts of climate change scenarios on European ash tree (Fraxinus excelsior L.) in Turkey. For. Ecol. Manag. 2021, 491, 119199. [Google Scholar] [CrossRef]
- Zanatta, F.; Engler, R.; Collart, F.; Broennimann, O.; Mateo, R.G.; Papp, B.; Muñoz, J.; Baurain, D.; Guisan, A.; Vanderpoorten, A. Bryophytes are predicted to lag behind future climate change despite their high dispersal capacities. Nat. Commun. 2020, 11, 5601. [Google Scholar] [CrossRef]
- Draper, D.; Rosselló-Graell, A.; Garcia, C.; Gomes, C.T.; Sérgio, C. Application of GIS in plant conservation programmes in Portugal. Biol. Conserv. 2003, 113, 337–349. [Google Scholar] [CrossRef]


Disclaimer/Publisher’s Note: The statements, opinions and data contained in all publications are solely those of the individual author(s) and contributor(s) and not of MDPI and/or the editor(s). MDPI and/or the editor(s) disclaim responsibility for any injury to people or property resulting from any ideas, methods, instructions or products referred to in the content. |
© 2023 by the authors. Licensee MDPI, Basel, Switzerland. This article is an open access article distributed under the terms and conditions of the Creative Commons Attribution (CC BY) license (https://creativecommons.org/licenses/by/4.0/).