Article

Seasonal Variations in Plant Species Diversity and Phylogenetic Diversity in Abandoned Farmland of China’s Huang–Huai Plain

1
College of Geography and Environmental Science, Henan University, Kaifeng 475001, China
2
Key Laboratory of Geospatial Technology for the Middle and Lower Yellow River Regions, Ministry of Education, Henan University, Kaifeng 475001, China
*
Authors to whom correspondence should be addressed.
Diversity 2023, 15(8), 922; https://doi.org/10.3390/d15080922
Submission received: 24 June 2023 / Revised: 6 August 2023 / Accepted: 9 August 2023 / Published: 11 August 2023
(This article belongs to the Section Plant Diversity)

Abstract

:
Amidst urbanization and industrialization in China, abandoned farmland plays a crucial role in safeguarding plant diversity within agricultural landscapes. This study aimed to examine the patterns of seasonal variation in plant diversity within abandoned farmland habitats in the Huang–Huai Plain region. Nonparametric tests were employed to analyze plant species diversity and phylogenetic diversity across seasons. Redundancy analysis and linear regression were conducted to examine the associations between plant species composition, species diversity, phylogenetic diversity, and soil environmental factors. Our results showed that plant species diversity, richness, and phylogenetic diversity were highest in spring, followed by summer, and lowest in autumn. The phylogenetic structure of plant communities demonstrated a tendency to diverge in spring, become random in summer, and cluster in autumn. Soil available potassium and soil organic matter emerged as important factors influencing plant species composition. The content of soil organic matter and ammonium nitrogen level exhibited a significantly positive correlation with the species diversity and phylogenetic diversity of plants. This study underscores the significance of considering seasonal and temporal scales when investigating plant diversity and provides a theoretical basis for biodiversity conservation in agricultural landscapes.

1. Introduction

The agricultural landscape is one of the most significant types of land cover on Earth’s terrestrial surface, and biodiversity plays a crucial role in the ecological functions, processes, and services of agricultural landscapes [1,2,3]. Globally, the increasing food demand of the growing population, the continuous expansion of agricultural land, and the encroachment on natural and seminatural habitats have led to the fragmentation of regional landscape patterns and the loss of biodiversity [3,4]. Moreover, agricultural intensification and the widespread use of chemical fertilizers, pesticides, and herbicides further threaten farmland biodiversity [5,6,7]. In this context, the residual natural and seminatural habitats in agricultural landscapes, such as abandoned farmlands, wooded areas, hedges, and ditches, are crucial biological shelters that can significantly increase the variety of plants, surface animals, birds, microorganisms, and other organisms, as well as the availability of ecosystem services [8,9,10,11]. Therefore, the existence of nonagricultural habitats such as abandoned farmland plays an important role in conserving biological diversity in agricultural landscapes.
As a result of urbanization and industrialization, the loss of the rural population often leads to a large-scale abandonment of land [12]. Human disturbance drastically diminished after the farmland was abandoned, and the plant community gradually regenerated. A large number of studies have shown that the abandonment of arable land promotes the increase in plant diversity, and the rise in plant diversity is conducive to the growth and stability of agricultural yield, the increase in pollinators, the decrease in weeds, and the decrease in insect pests [13]. As a result, abandoned farmland is crucial for sustaining biodiversity, increasing agricultural productivity, and providing habitat for species as well as other ecosystem services [14]. In China, abandoned farmland accounts for approximately 20% of the total arable land [15], and the extent and degree of abandonment are increasing [16], underscoring the importance of studying plant diversity in abandoned farmland.
Plant species diversity can directly reflect the composition and changing of plants in a community. However, plant diversity is not limited to species diversity alone; it also encompasses functional diversity and phylogenetic diversity [17]. Phylogenetic diversity, which considers evolutionary relationships among species, has been increasingly employed to investigate plant diversity in recent years [18]. Phylogenetic diversity provides supplementary information and different perspectives for understanding species coexistence and spatial distribution patterns from the perspectives of ecology and evolution [19,20]. Additionally, the phylogenetic structure can reflect the interspecific relationships and driving forces of community construction, making it especially suitable for studying the early succession period of community recovery [21,22].
Climate, soil, and other environmental factors vary significantly across seasons [23,24,25], and these seasonal changes affect soil fertility, plant growth, plant reproduction, and plant community structure [26,27]. Therefore, studying the seasonal variation in plant species diversity and phylogenetic diversity is important for maintaining ecosystem stability and protecting biodiversity. Previous studies on plant diversity have mainly focused on different habitats [28,29], spatial scales [30,31,32,33], gradients (water, soil nutrients, elevation, etc.) [34,35], and human disturbances [36,37]. The seasonal variation in plant diversity remains underexplored.
The Huang–Huai Plain in China is a critical grain-producing area, characterized by four distinct seasons and a long history of farming tradition. However, the region’s ecological environment security and biodiversity protection are currently under significant pressure due to the need for food security and supply. As an agricultural landscape nonagricultural habitat, abandoned farmland has much plant diversity. Natural and seminatural habitats, including abandoned farmland, can support agricultural production and the preservation of biodiversity. However, despite the potential significance of abandoned farmland in ecological conservation, limited research has been conducted on the seasonal changes in plant diversity of such areas, with existing studies primarily focusing on the changes in plant diversity over different years of abandonment [38,39,40].
In the Huang–Huai Plain, a primarily agricultural region characterized by significant variations in temperature, rainfall, and soil environmental factors across seasons, human activities have varying degrees of impact during different periods. Given these contextual factors, our study aims to investigate two hypotheses: (1) distinct differences exist in the plant community structure and plant diversity characteristics across abandoned farmland in different seasons, and (2) soil environmental factors are significantly correlated with the plant species diversity and phylogenetic diversity of abandoned farmland.
To investigate these hypotheses, we conducted plant surveys and collected soil samples to analyze changes in plant diversity and the relationship between plant diversity and soil environmental factors. Our study aimed to address the following questions: (1) What is the structure of the plant community in abandoned farmland in the Huang–Huai Plain, and how does it change across seasons? (2) What are the seasonal changes in plant diversity, and is there a correlation between species diversity and phylogenetic diversity? (3) What is the relationship between the plant community and soil environmental factors in abandoned farmland?

2. Materials and Methods

The study area is located at the Agricultural Ecological Experimental Station of Henan University, in Kaifeng City, Henan Province, China (114°18′12″ E, 34°52′06″ N). Prior to 2017, this experimental station was abandoned farmland, which was subsequently restored into an ecological farm for the cultivation of various vegetables, pumpkins, tubers, legumes, and other crops. Starting from September 2020, all cultivated crops were cleared, and the farmland was abandoned. Within the experimental station, a total of 12 plots of abandoned farmland were established, covering a total area of 276 square meters (23 m × 12 m). Each abandoned plot had a rectangular shape with an area of 15 square meters (3 m × 5 m) and was demarcated with 50 cm high partition boards. There was a 50 cm buffer zone between the plots, and weed cloth was laid to prevent interference from plants outside the plots. The research area is situated on China’s Huang–Huai Plain, which has a monsoon climate of medium latitudes. The average annual temperature in the study area is 14.4 °C, with an annual precipitation of 631 mm. The soil texture of the study area is predominantly composed of the Yellow River sediment and sandy soil, with a soil pH of 8.66. In the agricultural landscape of the Huang–Huai Plain, nonagricultural habitats were primarily in the early stage of community succession. The community was mainly composed of functional groups of annual and monocotyledon plants, with a simple community structure and apparent dominant populations [41].

2.1. Plant Surveys

To assess the plant communities, surveys were conducted in 12 plots during the growing season, which occurred between spring and autumn in 2022. Specifically, the surveys were carried out in the spring (March to May), summer (June to August), and autumn (September to November) when the plants were actively growing in the area under study. The surveys were conducted twice during each season to capture any potential changes in plant growth, resulting in a total of six surveys per plot. During each survey, data were collected on the average height, coverage, and the total number of plants for each species present in the plot. Five individuals of each species were randomly measured using a steel ruler to calculate their average height. Coverage was estimated by visually assessing the proportion of each species’ coverage area to the total plot area. The plant data for each season represent the average of the two surveys conducted during that particular season.

2.2. Calculation of Plant Species Diversity Indices

The importance values (IV) of each species in each plot were determined using the following methodology:
I V = R D + R C + R H 3 × 100 %
where RD is the relative density of a species, calculated as the number of plants of the species in the plot divided by the total number of plants in the plot; RC is the relative coverage of a species, calculated as the coverage of the species divided by the sum of the coverage of all plants in the plot; and RH is the relative height of a species, calculated as the average height of the species divided by the sum of the average height of all plants in the plot.
This study utilized four commonly used species diversity indices, namely the Shannon Diversity Index, the Simpson Dominance Index, the Pielou Evenness Index, and the Margalef Richness Index, to comprehensively evaluate different aspects of species diversity within the study area. The calculation formulas for each index are as follows:
Shannon Diversity Index [42]:
H = i = 1 s P i l n P i
Simpson Dominance Index [43]:
D = i = 1 S P i 2
Pielou Evenness Index [44]:
J = H l n S
Margalef Richness Index [45]:
R = S 1 l n N
where Pi is the proportion of the importance value (IV) of a species to the overall importance value of all species. S denotes the total number of species in the community, while N represents the total number of plants in the community.

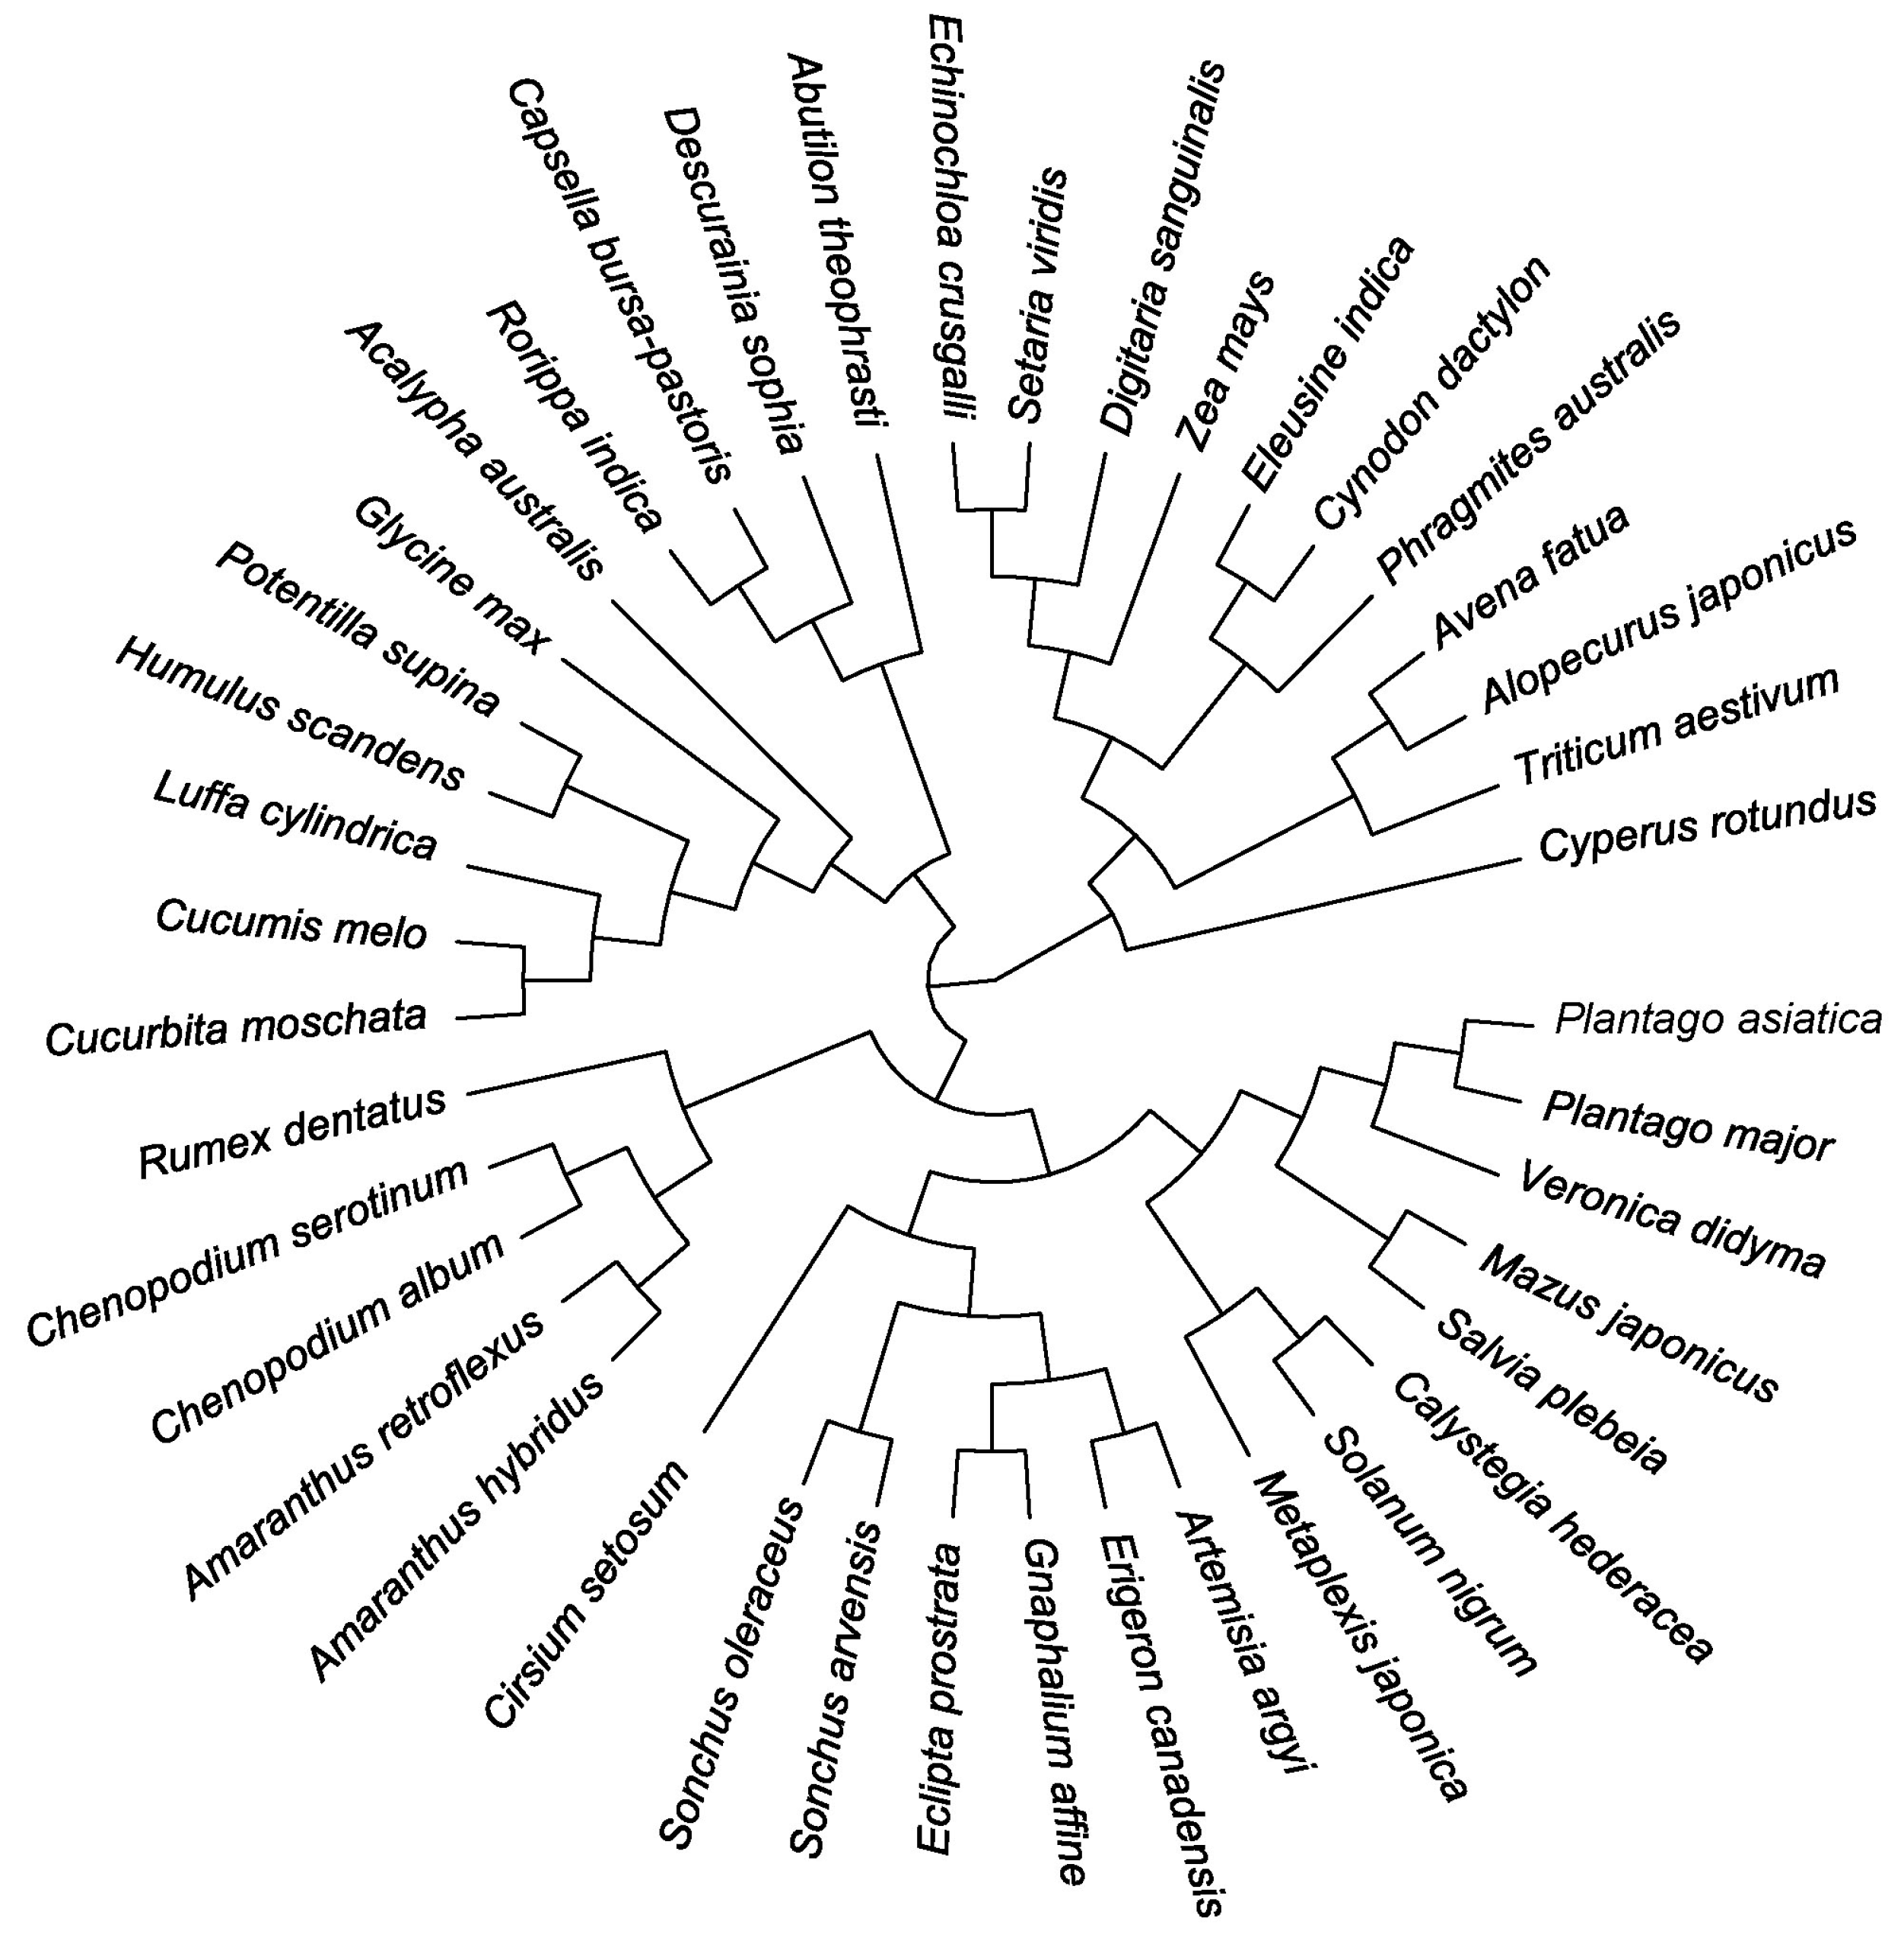
2.3. Construction of Phylogenetic Tree and Calculation of Phylogenetic Indices

The Latin names and family information of all the herbaceous plants surveyed in the study region were verified using the Angiosperm Phylogeny Group IV (APG IV) classification system [46] and the Plant Science Data Center website (https://www.plantplus.cn/cn (accessed on 5 November 2022)).
To construct the phylogenetic tree, we utilized the “V.PhyloMaker2” package in the R software [47] and visualized the tree using the “ggtree” package [48] (Figure 1).
To characterize the phylogenetic diversity, we chose the Phylogenetic Diversity Index (PD), which represents the sum of the length of evolutionary branches of all species in the community [49]. The phylogenetic structure was evaluated using the Net Relatedness Index (NRI) and the Net Nearest Taxa Index (NTI) [50,51].
The NRI and NTI were calculated using the following formulae:
N R I = 1 × M P D s M P D m d s S D M P D m d s
N T I = 1 × M N T D s M N T D m d s S D M N T D m d s
Here, MPD represents the average phylogenetic distance between all species pairs in a community, while MPDs and MNTDs denote the average observed paired phylogenetic distance and the average observed nearest neighbor phylogenetic distance, respectively. MPDmds and MNTDmds represent the average paired phylogenetic distance and the average nearest neighbor phylogenetic distance, respectively, under 999 null model simulations. SD is the standard deviation.

2.4. Determination of Soil Physical and Chemical Properties

We conducted measurements of various soil environmental factors, including soil available phosphorus (AP), available potassium (AK), ammonium nitrogen (AN), soil organic matter (SOM), soil pH, and soil moisture content (SMC). In May and October of 2022, we randomly collected three soil samples at a depth of 20 cm in each plot using a soil auger and divided them into two layers of 0–10 cm and 10–20 cm. The mean values of the two sets of soil data were used to represent the soil properties of the study area.
Soil moisture content was measured using thermogravimetric analysis. The potentiometric approach was employed to determine the pH value of the soil. Soil organic matter was quantified using a high-temperature external heating potassium dichromate oxidation spectrophotometric technique, and ammonium nitrogen content was measured using the indophenol blue colorimetric method. The available phosphorus in the soil was assessed using the sodium hydrogen carbonate solution–Mo–Sb anti-spectrophotometric method, and soil available potassium was determined using the ammonium acetate extraction–flame spectrophotometry method [52,53,54].

2.5. Data Analysis

In this study, all plant classifications were based on the APG IV classification system [46]. The data were organized using Excel 2021. The diversity indices of species were calculated using R’s “vegan” package [55]. The Phylogenetic Diversity Index (PD) and Phylogenetic Structure Index (NTI and NRI) were computed using the “picante” package [56]. The Kruskal–Wallis test was used to analyze the significance of variations in each diversity index between seasons [57]. The species diversity indices and phylogenetic diversity indices were subjected to Spearman correlation analysis using the “corrplot” package [58,59], with a significance level set at 0.05.
To assess the link between soil environmental factors and plant species composition, data on plant abundance were analyzed using detrended correspondence analysis (DCA analysis), revealing that all of the first axes’ lengths were under 3. Therefore, redundancy analysis (RDA) was used, and z-score standardization was applied to the soil environmental factor data to eliminate the influence of different units among the factors. A Monte Carlo permutation test with 999 permutations was performed for all ordination axes in RDA to evaluate the significance of the relationship between soil environmental factors and changes in plant community [60]. Both RDA and DCA analyses were performed using the “vegan” package. Additionally, linear regression analysis was conducted on soil environmental factors and plant species diversity (Shannon Index) and phylogenetic diversity (PD) indices using the “lm” function in the R software.
All statistical analyses were performed using R 4.2.1 [61].

3. Results

3.1. Seasonal Variations in Plant Community Structure

In the research region, a total of 17 families and 34 plant species were identified in the spring, summer, and autumn. Annual herbs predominated in the study area, with Chenopodium serotinum, Abutilon theophrasti, Humulus scandens, and Echinochloa crusgalli being the most common species (Table 1).
In the spring, 1442 individual plants were investigated, comprising 17 families, 28 genera, and 30 species. In the summer, 1093 individual plants from 11 families, 18 genera, and 19 species were investigated. In the autumn, 1098 individual plants were surveyed, belonging to 7 families, 14 genera, and 15 species.
Our results reveal a clear seasonal trend in the richness of families, genera, and species, with the highest number observed during spring, followed by summer and autumn, in descending order (Figure 2).

3.2. Seasonal Variations in Plant Species Diversity and Phylogenetic Diversity

In this study, we calculated plant diversity indicators during spring, summer, and autumn (Table 2) and observed a gradual decline in the seasonal variations in the Shannon Diversity Index, Margalef Richness Index, and PD Index of the plants. Conversely, the phylogenetic structure indices, NTI and NRI, showed a progressive increase with changing seasons from spring to autumn.

3.2.1. Seasonal Variation in Plant Species Diversity

According to the findings (Figure 3), the Shannon Diversity Index had a trend toward constant decline, but there was no discernible seasonal variation. Summer and autumn had a higher Pielou Evenness Index than spring (p < 0.01). The Margalef Richness Index exhibited a significant decrease with seasonal variations, with spring displaying considerably higher richness than summer (p < 0.01) and autumn (p < 0.01).

3.2.2. Seasonal Variations in Plant Phylogenetic Diversity and Phylogenetic Structure

When analyzing the phylogenetic diversity (PD) from spring to autumn (Figure 4), significant seasonal variances were observed, along with a significant decline in the PD (p < 0.05).
The seasonal changes in phylogenetic structural indices, NTI and NRI, were evident, with both indices increasing from spring to autumn (Figure 5). Notably, significant differences (p < 0.01) were observed between spring and autumn, as well as between summer and autumn.
In spring, the NRI and NTI were both less than 0, indicating that the phylogenetic structure of the plant community diverged and there were more distantly related species in the community. The NRI and NTI were close to 0 in summer, indicating that the phylogenetic structure of the plant community tended to be random in summer. The NTI and NRI were greater than 0 in autumn, indicating that the phylogenetic structure of the plant community was clustered, and there were more closely related species in the community.

3.3. Correlations among Various Plant Diversity Indices

The Shannon Diversity Index, the Pielou Evenness Index, and the Margalef Richness Index were all highly significantly correlated with the Phylogenetic Diversity Index (PD) (p < 0.001). Among the phylogenetic diversity and phylogenetic structure indices, PD, NTI, and NRI were all highly significantly correlated (p < 0.001) (Table 3, Figure 6).

3.4. Relationship between Plant Species Composition, Plant Diversity, and Soil Environmental Factors

The RDA ordination diagram (Figure 7) showed the relationship between plant species composition and soil environmental factors. Overall, RDA axes I and II explained 59.22% of the variation in the plant community in the 0–20 cm soil layer. Soil ammonium nitrogen (AN) and soil organic matter (SOM) content showed a significant positive correlation (Figure 7c).
Two soil factors, AK and SOM, significantly affected the variation in the plant community in the 0–20 cm soil layer (p < 0.05). Among them, AK had a significant impact on the plant community variation in both the 0–10 cm and 10–20 cm soil layers (Table 4).
Linear regression analysis (Figure 8) showed that the soil AN and SOM content were significantly positively correlated with the plant Shannon Diversity Index and Phylogenetic Diversity Index (PD). However, no significant correlation was found between the other four soil environmental factors and species or phylogenetic diversity.

4. Discussion

4.1. Seasonal Variation in Plant Species Diversity and Phylogenetic Diversity in Abandoned Farmland

This study revealed that abandoned farmland plant communities in the Huang–Huai Plain exhibit significant changes in species richness, evenness, and phylogenetic diversity throughout the year. Spring had the highest plant species diversity, richness, and phylogenetic diversity, which gradually decreased with seasonal changes, reaching its lowest point in autumn. This may be because, with the rapid growth of plants in summer, some more adaptable dominant species take over the ecological niche of other species, leading to a significant decrease in species [62,63]. In addition, some plants have fully undergone their growth cycle before autumn, which can also lead to fewer species.
In spring, the plant diversity was the highest, the phylogenetic structure tended to diverge, and competitive exclusion was the primary mechanism of plant construction. Spring is the initiation stage of herbaceous plant growth, with lower vegetation coverage and underutilized resources. Many new species take advantage of this environment to swiftly establish, germinate, grow, and flower, potentially increasing plant diversity [64,65]. Niche differentiation plays a significant role in shaping the plant community, while the competition among plant species occupying similar ecological niches intensifies, resulting in a greater genetic dissimilarity and divergence in the phylogenetic structure [66].
In summer, plant species diversity, species richness, and phylogenetic diversity were at levels between those of spring and autumn. The phylogenetic structure of plant communities in summer tended to be random, and the combined effects of habitat filtering and competitive exclusion may influence community construction. The study area has a temperate monsoon climate with four distinct seasons. Summer temperatures and precipitation are significantly higher, leading to rapid plant growth and intense competition for resources. This results in higher herbaceous plant coverage and denser vegetation, strengthening plant interactions. Some species with competitive advantages occupy the ecological niches of others, reducing diversity [62,63]. Additionally, the higher temperatures and precipitation during summer can also significantly influence plant diversity. Numerous studies have demonstrated that increasing temperatures tend to decrease plant diversity [67,68], while increased precipitation often promotes plant diversity [69,70]. The plant diversity in summer was between those of spring and autumn, possibly due to the combined effects of higher temperatures, increased precipitation, and intensified plant interactions.
Autumn was found to have the lowest plant species diversity, richness, and phylogenetic diversity due to unfavorable conditions with reduced essential resources like temperature and precipitation. Plant growth, flowering, and leafing decline, with some species completing their growth cycle [63,71], potentially leading to decreased species richness. Habitat filtering becomes the dominant factor influencing community development [72]. Moreover, under habitat filtration, species with similar functions or traits tend to occupy similar ecological niches, leading to the convergence of species’ functional characteristics and genetic relationships. Consequently, the phylogenetic diversity during autumn is notably low, with a tendency for the phylogenetic structure to cluster [73,74].
In general, environmental filtering leads to the emergence of closely related species with similar adaptive abilities in the same habitat, resulting in a phylogenetically aggregated community structure. Conversely, competitive exclusion prevents closely related species with similar ecological niches from coexisting in the same environment, causing species within a community to diverge in phylogenetic structure [50]. In this study, interspecific competition primarily influenced community assembly in spring, while environmental filtration was the dominant factor in autumn. As the seasons progressed from spring to autumn, environmental conditions became increasingly important in shaping plant communities, replacing interspecific competition.
We found significant correlations between the Phylogenetic Diversity Index and the Shannon Diversity Index, the Pielou Evenness Index, and the Margalef Richness Index (Table 3). This indicates that phylogenetic diversity is affected by species richness, evenness, and diversity. The higher the species diversity, the higher the phylogenetic diversity, similar to most studies’ results [75,76]. It has been suggested that the alpha diversity of a community is significantly correlated at the species and phylogenetic levels, and to a certain extent, its diversity index can represent each other [77].

4.2. Relationship between Plant Community, Plant Diversity, and Soil Environmental Factors

The results of this study indicate that soil environmental factors, particularly soil available potassium (AK) and soil organic matter (SOM), play an important role in determining plant species composition. Among these factors, AK has a more significant impact on the changes in plant community structure. Potassium (K+) is an essential macronutrient for plant growth, as it is the most abundant cation in plants and participates in various physiological functions and processes. Potassium is indispensable for regulating plant metabolism, growth, development, and responses to abiotic stress [78,79]. However, only 2% of K+ exists in water-soluble and exchangeable forms that are directly available for plants, and this low availability of potassium results in its deficiency in both soil and plants [78]. After agricultural fields are abandoned, the absence of human-induced fertilization can result in a potassium (K+) deficiency in the soil, making soil available potassium a crucial limiting factor for plant growth in abandoned lands.
This study revealed that soil ammonium nitrogen (AN) and soil organic matter (SOM) content were significantly positively correlated with plant species diversity and phylogenetic diversity (Figure 8). Soil nitrogen and organic matter are important nutrients for plant growth, which can affect plant biomass, competitiveness, and functional traits [80,81]. Many studies have shown that soil nitrogen content, organic matter content, and plant diversity have significant correlations [82,83,84], but this relationship is not always positive [85]. For instance, a study conducted in Haikou Malin Volcano Park showed that different vegetation types (plantations, secondary forests, and abandoned lands) had significantly different correlations with soil total nitrogen (TN), soil organic matter (SOM), and plant diversity [83]. Generally speaking, excessively high or low contents of soil total nitrogen and soil organic carbon have negative effects on plant diversity, while moderate contents have positive effects on plant diversity [82]. In this study, AN and SOM contents showed significant positive correlations with plant diversity, which might be due to the fact that abandoned land, without human disturbance and fertilization, is more conducive to the accumulation and stabilization of soil organic matter and ammonium nitrogen [86]. In addition, plant diversity in abandoned land could increase the input of organic carbon into the soil, enhance soil microbial activity and diversity, and thus improve the mineralization and transformation of soil organic nitrogen [81,87]. Therefore, soil AN and SOM content have positive correlations with plant diversity.

5. Conclusions

This study revealed significant seasonal dynamics in the community structure, species diversity, and phylogenetic diversity of plants in abandoned farmland in the Huang–Huai Plain. The number of plant families, genera, and species was highest in spring, followed by summer, and lowest in autumn. Similarly, species diversity, richness, and phylogenetic diversity showed a decreasing trend with the change in seasons, with the highest values observed in spring, followed by summer, and the lowest in autumn. The phylogenetic structure of plant communities tended to be divergent in spring, random in summer, and aggregated in autumn. Species diversity was found to be positively correlated with the phylogenetic diversity of plant communities. Soil available potassium (AK) and soil organic matter (SOM) emerged as important factors influencing plant species composition. Specifically, the content of soil organic matter (SOM) and ammonium nitrogen (AN) level were significantly positively correlated with the species diversity and phylogenetic diversity of plants.
We discovered that, even within the same year, changes in plant diversity were significant; in addition, the plant phylogenetic structure exhibited contrary traits between spring and autumn. It is therefore recommended that future research on plant diversity consider seasonal and temporal dynamics to provide a more comprehensive understanding of the ecological processes driving plant community diversity.

Supplementary Materials

The following supporting information can be downloaded at: https://www.mdpi.com/article/10.3390/d15080922/s1, Table S1: Original plant data used in this study; Table S2: Original soil data used in this study.

Author Contributions

Conceptualization, P.Y. and X.L.; methodology, P.Y., P.L. and X.L.; software, P.Y., W.L. and P.L.; validation, P.L., X.L. and S.D.; formal analysis, S.D.; investigation, P.Y., W.L., J.Z., Y.L. and K.W.; resources, X.L.; data curation, P.Y., W.L., J.Z., Y.L. and K.W.; writing—original draft preparation, P.Y.; writing—review and editing, X.L. and S.D.; visualization, P.Y.; supervision, X.L. and S.D.; project administration, S.D.; funding acquisition, X.L. and S.D. All authors have read and agreed to the published version of the manuscript.

Funding

This research was funded by the National Natural Science Foundation of China, Grant Number 42171091, and the Science and Technology Department of Henan Province, Grant Number 212102310224.

Institutional Review Board Statement

Not applicable.

Informed Consent Statement

Not applicable.

Data Availability Statement

The data presented in this study are available in the article/Supplementary Material.

Acknowledgments

We would like to express our gratitude to the Agricultural Ecological Experimental Station of Henan University for providing us with the study area. Additionally, we extend our appreciation to Guofu Liang, Panpan Zhang, Jimei He, Pengfei Li, and Yu Wang from Henan University, for their invaluable contributions to the plant investigation and laboratory experiments.

Conflicts of Interest

The authors declare no conflict of interest.

References

  1. Altieri, M.A. The ecological role of biodiversity in agroecosystems. Agric. Ecosyst. Environ. 1999, 74, 19–31. [Google Scholar] [CrossRef] [Green Version]
  2. Lu, X.; Liang, G.; Tang, Q.; Ding, S.; Li, Q.; Zhang, X. Plant species of the non-agricultural habitats in the lower reaches of the Yellow River plain agro-landscape. Acta Ecol. Sin. 2014, 34, 789–797. [Google Scholar] [CrossRef]
  3. Pilling, D.; Belanger, J.; Hoffmann, I. Declining biodiversity for food and agriculture needs urgent global action. Nat Food 2020, 1, 144–147. [Google Scholar] [CrossRef] [Green Version]
  4. Tsioumani, E. The State of the World’s Biodiversity for Food and Agriculture: A Call to Action? Environ. Policy Law 2019, 49, 110–112. [Google Scholar] [CrossRef]
  5. Brooker, R.W.; George, T.S.; Homulle, Z.; Karley, A.J.; Newton, A.C.; Pakeman, R.J.; Schob, C. Facilitation and biodiversity-ecosystem function relationships in crop production systems and their role in sustainable farming. J. Ecol. 2021, 109, 2054–2067. [Google Scholar] [CrossRef]
  6. Hossain, M.M.; Begum, M.; Hashem, A.; Rahman, M.M.; Haque, M.E.; Bell, R.W. Continuous Practice of Conservation Agriculture for 3–5 Years in Intensive Rice-Based Cropping Patterns Reduces Soil Weed Seedbank. Agriculture 2021, 11, 895. [Google Scholar] [CrossRef]
  7. Canning, A.D. Rediscovering wild food to diversify production across Australia’s agricultural landscapes. Front. Sustain. Food Syst. 2022, 6, 865580. [Google Scholar] [CrossRef]
  8. Wretenberg, J.; Part, T.; Berg, A. Changes in local species richness of farmland birds in relation to land-use changes and landscape structure. Biol. Conserv. 2010, 143, 375–381. [Google Scholar] [CrossRef]
  9. Edlund, M.; Smith, H.G. Organic farming at local and landscape scales benefits plant diversity. Ecography 2010, 33, 514–522. [Google Scholar] [CrossRef]
  10. Hille, S.; Andersen, D.K.; Kronvang, B.; Baattrup-Pedersen, A. Structural and functional characteristics of buffer strip vegetation in an agricultural landscape—High potential for nutrient removal but low potential for plant biodiversity. Sci. Total Environ. 2018, 628–629, 805–814. [Google Scholar] [CrossRef]
  11. Egli, L.; Meyer, C.; Scherber, C.; Kreft, H.; Tscharntke, T. Winners and losers of national and global efforts to reconcile agricultural intensification and biodiversity conservation. Glob. Chang. Biol. 2018, 24, 2212–2228. [Google Scholar] [CrossRef] [PubMed]
  12. Li, S.; Li, X. Progress and prospect on farmland abandonment. Acta Geogr. Sin. 2016, 71, 370–389. [Google Scholar] [CrossRef]
  13. Isbell, F.; Adler, P.R.; Eisenhauer, N.; Fornara, D.; Kimmel, K.; Kremen, C.; Letourneau, D.K.; Liebman, M.; Polley, H.W.; Quijas, S.; et al. Benefits of increasing plant diversity in sustainable agroecosystems. J. Ecol. 2017, 105, 871–879. [Google Scholar] [CrossRef] [Green Version]
  14. Robleño, I.; Storkey, J.; Solé-Senan, X.O.; Recasens, J. Using the response–effect trait framework to quantify the value of fallow patches in agricultural landscapes to pollinators. Appl. Veg. Sci. 2018, 21, 267–277. [Google Scholar] [CrossRef] [Green Version]
  15. Li, L.; Pan, Y.Z.; Zheng, R.B.; Liu, X.P. Understanding the spatiotemporal patterns of seasonal, annual, and consecutive farmland abandonment in China with time-series MODIS images during the period 2005–2019. Land Degrad. Dev. 2022, 33, 1608–1625. [Google Scholar] [CrossRef]
  16. Zhang, X.; Zhao, C.; Dong, J.D.; Ge, Q. Spatio-temporal pattern of cropland abandonment in China from 1992 to 2017: A Meta-analysis. Acta Geogr. Sin. 2019, 74, 411–420. [Google Scholar] [CrossRef]
  17. Swenson, N.G. The role of evolutionary processes in producing biodiversity patterns, and the interrelationships between taxonomic, functional and phylogenetic biodiversity. Am. J. Bot. 2011, 98, 472–480. [Google Scholar] [CrossRef] [Green Version]
  18. Cadotte, M.W.; Jonathan Davies, T.; Regetz, J.; Kembel, S.W.; Cleland, E.; Oakley, T.H. Phylogenetic diversity metrics for ecological communities: Integrating species richness, abundance and evolutionary history. Ecol. Lett. 2010, 13, 96–105. [Google Scholar] [CrossRef]
  19. Jones, H.P.; Barber, N.A.; Gibson, D.J. Is phylogenetic and functional trait diversity a driver or a consequence of grassland community assembly? J. Ecol. 2019, 107, 2027–2032. [Google Scholar] [CrossRef] [Green Version]
  20. Cavender-Bares, J.; Kozak, K.H.; Fine, P.V.; Kembel, S.W. The merging of community ecology and phylogenetic biology. Ecol. Lett. 2009, 12, 693–715. [Google Scholar] [CrossRef]
  21. Kraft, N.J.B.; Ackerly, D.D. Functional trait and phylogenetic tests of community assembly across spatial scales in an Amazonian forest. Ecol. Monogr. 2010, 80, 401–422. [Google Scholar] [CrossRef]
  22. Emerson, B.C.; Gillespie, R.G. Phylogenetic analysis of community assembly and structure over space and time. Trends Ecol. Evol. 2008, 23, 619–630. [Google Scholar] [CrossRef] [PubMed]
  23. Yu, G.; Wang, J.; Ma, Z.; Chang, F.; Liu, B.; You, S. Responses of plant diversity to seasonal changes in the lakeside wetland of Bosten Lake. Plant Sci. 2022, 40, 462–471. [Google Scholar] [CrossRef]
  24. Zhao, W.; Wang, D.-D.; Huang, K.-C.; Liu, S.; Reyila, M.; Sun, Y.-F.; Li, J.-N.; Cui, B.-K. Seasonal variation in the soil fungal community structure of Larix gmelinii forests in Northeast China. Front. Microbiol. 2023, 14, 1106888. [Google Scholar] [CrossRef]
  25. Chen, Y.; Han, M.; Yuan, X.; Cao, G.; Zhu, B. Seasonal changes in soil properties, microbial biomass and enzyme activities across the soil profile in two alpine ecosystems. Soil Ecol. Lett. 2021, 3, 383–394. [Google Scholar] [CrossRef]
  26. Sorce, C.; Nannipieri, F.; Ciccarelli, D. Ecophysiological and morpho-functional responses of mediterranean plants on coastal dunes: How they vary across seasons. Estuar. Coast. Shelf Sci. 2021, 259, 107480. [Google Scholar] [CrossRef]
  27. Ren, H.; Han, G.; Li, M.H.; Gao, C.; Jiang, L. Ethylene-regulated leaf lifespan explains divergent responses of plant productivity to warming among three hydrologically different growing seasons. Glob. Chang. Biol. 2021, 27, 4169–4180. [Google Scholar] [CrossRef]
  28. Martello, F.; dos Santos, J.S.; Silva-Neto, C.M.; Cassia-Silva, C.; Siqueira, K.N.; de Ataide, M.V.R.; Ribeiro, M.C.; Collevatti, R.G. Landscape structure shapes the diversity of plant reproductive traits in agricultural landscapes in the Brazilian Cerrado. Agr. Ecosyst. Environ. 2023, 341, 108246. [Google Scholar] [CrossRef]
  29. Swierszcz, S.; Nobis, M.; Maslak, M.; Smieja, A.; Kojs, P.; Nowak, S.; Nowak, A. Varied response of underground and aboveground plant matter: Functional diversity of three different vegetational types after translocation to reclaimed postindustrial land. Land Degrad. Dev. 2019, 30, 2287–2297. [Google Scholar] [CrossRef]
  30. Dembicz, I.; Velev, N.; Boch, S.; Janisova, M.; Palpurina, S.; Pedashenko, H.; Vassilev, K.; Dengler, J. Drivers of plant diversity in Bulgarian dry grasslands vary across spatial scales and functional-taxonomic groups. J. Veg. Sci. 2021, 32, e12935. [Google Scholar] [CrossRef]
  31. Li, Y.; Xu, H.; Chen, J.; Xiao, Y.H.; Ni, Y.L.; Zhang, R.Y.; Ye, W.H.; Lian, J.Y. Effects of soil resource availability on patterns of plant functional traits across spatial scales. Ecol. Evol. 2022, 12, e8587. [Google Scholar] [CrossRef]
  32. Walther, G.; Jandt, U.; Kattge, J.; Romermann, C. Functional rarity of plants in German hay meadows—Patterns on the species level and mismatches with community species richness. Ecol. Evol. 2022, 12, e9375. [Google Scholar] [CrossRef] [PubMed]
  33. Mugnai, M.; Ferretti, G.; Gesuelli, E.; Nuti, L.; Di Natale, S.; Corti, E.; Viciani, D.; Lazzaro, L. Site dependence of local variations in taxonomic and functional diversity of plant communities in semi-natural dry grasslands. Plant Ecol. 2023, 224, 95–111. [Google Scholar] [CrossRef]
  34. Liu, M.X.; Xu, L.; Mu, R.L.; Zhang, G.J.; Yu, R.X.; Li, L. Plant community assembly of alpine meadow at different altitudes in Northeast Qinghai-Tibet Plateau. Ecosphere 2023, 14, e4354. [Google Scholar] [CrossRef]
  35. Viana, J.L.; Dalling, J.W. Soil fertility and water availability effects on trait dispersion and phylogenetic relatedness of tropical terrestrial ferns. Oecologia 2022, 198, 733–748. [Google Scholar] [CrossRef] [PubMed]
  36. Rahmanian, S.; Hejda, M.; Ejtehadi, H.; Farzam, M.; Memariani, F.; Pysek, P. Effects of livestock grazing on soil, plant functional diversity, and ecological traits vary between regions with different climates in northeastern Iran. Ecol. Evol. 2019, 9, 8225–8237. [Google Scholar] [CrossRef] [PubMed] [Green Version]
  37. Duan, T.T.; Zhang, J.; Wang, Z. Responses and Indicators of Composition, Diversity, and Productivity of Plant Communities at Different Levels of Disturbance in a Wetland Ecosystem. Diversity 2021, 13, 252. [Google Scholar] [CrossRef]
  38. Hauchhum, R.; Singson, M.Z. Tree species composition and diversity in abandoned Jhum lands of Mizoram, North East India. Trop. Ecol. 2020, 61, 187–195. [Google Scholar] [CrossRef]
  39. Cao, G.; Tsuchiya, K.; Zhu, W.; Okuro, T. Vegetation dynamics of abandoned paddy fields and surrounding wetlands in the lower Tumen River Basin, Northeast China. Peerj 2019, 7, e6704. [Google Scholar] [CrossRef] [Green Version]
  40. Liu, K.; Liang, T.; Qiang, W.Y.; Du, G.Z.; Baskin, J.M.; Baskin, C.C.; Bu, H.Y.; Yang, H.; Xiao, S. Changes in seed germination strategy along the successional gradient from abandoned cropland to climax grassland in a subalpine meadow and some implications for rangeland restoration. Agr. Ecosyst. Environ. 2020, 289, 106746. [Google Scholar] [CrossRef]
  41. Lu, X.; Liu, J.; Tang, Q.; Liang, G.; Ding, S. Characteristics of non-agricultural habitat plant functional groups in agricultural landscape of Huanghuaihai Plain. Acta Ecol. Sin. 2019, 39, 6721–6730. [Google Scholar] [CrossRef]
  42. Shannon, C.E. A mathematical theory of communication. Bell Syst. Tech. 1948, 27, 379–423. [Google Scholar] [CrossRef] [Green Version]
  43. Simpson, E.H. Measurement of diversity. Nature 1949, 163, 668. [Google Scholar] [CrossRef]
  44. Pielou, E.C. The measurement of diversity in different types of biological collections. J. Theor. Biol. 1966, 13, 131–144. [Google Scholar] [CrossRef]
  45. Margalef, R. Diversidad de especies en las comunidades naturales. P. Inst. Biol. Apl. 1951, 9, 15–27. [Google Scholar]
  46. Chase, M.W.; Christenhusz, M.J.M.; Fay, M.F.; Byng, J.W.; Judd, W.S.; Soltis, D.E.; Mabberley, D.J.; Sennikov, A.N.; Soltis, P.S.; Stevens, P.F. An update of the Angiosperm Phylogeny Group classification for the orders and families of flowering plants: APG IV. Bot. J. Linn. Soc. 2016, 181, 1–20. [Google Scholar] [CrossRef] [Green Version]
  47. Jin, Y.; Qian, H.V. PhyloMaker2: An updated and enlarged R package that can generate very large phylogenies for vascular plants. Plant Divers. 2022, 44, 335–339. [Google Scholar] [CrossRef]
  48. Yu, G. Data Integration, Manipulation and Visualization of Phylogenetic Trees; Chapman and Hall/CRC: New York, NY, USA, 2022. [Google Scholar]
  49. Faith, D.P. Conservation evaluation and phylogenetic diversity. Biol. Conserv. 1992, 61, 1–10. [Google Scholar] [CrossRef]
  50. Webb, C.O.; Ackerly, D.D.; McPeek, M.A.; Donoghue, M.J. Phylogenies and Community Ecology. Annu. Rev. Ecol. Evol. Syst. 2002, 33, 475–505. [Google Scholar] [CrossRef] [Green Version]
  51. Webb, C.O.; Ackerly, D.D.; Kembel, S.W. Phylocom: Software for the analysis of phylogenetic community structure and trait evolution. Bioinformatics 2008, 24, 2098–2100. [Google Scholar] [CrossRef] [Green Version]
  52. Page, A.L. Methods of Soil Analysis. Part 2. Chemical and Microbiological Properties; American Society of Agronomy, Soil Science Society of America: Madison, WI, USA, 1983. [Google Scholar]
  53. Rooij, G.H.d. Methods of Soil Analysis. Part 4. Physical Methods. Vadose Zone J. 2004, 3, 722–723. [Google Scholar] [CrossRef]
  54. Wang, S.; Chen, H.Y.; Tan, Y.; Fan, H.; Ruan, H. Fertilizer regime impacts on abundance and diversity of soil fauna across a poplar plantation chronosequence in coastal Eastern China. Sci. Rep. 2016, 6, 20816. [Google Scholar] [CrossRef] [Green Version]
  55. Dixon, P. VEGAN, a package of R functions for community ecology. J. Veg. Sci. 2003, 14, 927–930. [Google Scholar] [CrossRef]
  56. Kembel, S.W.; Cowan, P.D.; Helmus, M.R.; Cornwell, W.K.; Morlon, H.; Ackerly, D.D.; Blomberg, S.P.; Webb, C.O. Picante: R tools for integrating phylogenies and ecology. Bioinformatics 2010, 26, 1463–1464. [Google Scholar] [CrossRef] [PubMed] [Green Version]
  57. Kruskal, W.H.; Wallis, W.A. Use of ranks in one-criterion variance analysis. J. Am. Stat. Assoc. 1952, 47, 583–621. [Google Scholar] [CrossRef]
  58. Simko, T.W.a.V. R Package ‘Corrplot’: Visualization of a Correlation Matrix (Version 0.92). Available online: https://github.com/taiyun/corrplot (accessed on 14 November 2022).
  59. Spearman, C. The proof and measurement of association between two things. Am. J. Psychol. 1961, 15, 72–101. [Google Scholar] [CrossRef]
  60. Fishman, G. Monte Carlo: Concepts, Algorithms, and Applications; Springer Science & Business Media: Berlin, Germany, 2013; pp. 1–698. [Google Scholar]
  61. R Core Team. R: A Language and Environment for Statistical Computing; R Foundation for Statistical Computing: Vienna, Austria, 2022; pp. 1–3871. [Google Scholar]
  62. Kompała-Bąba, A.; Sierka, E.; Dyderski, M.K.; Bierza, W.; Magurno, F.; Besenyei, L.; Błońska, A.; Ryś, K.; Jagodziński, A.M.; Woźniak, G. Do the dominant plant species impact the substrate and vegetation composition of post-coal mining spoil heaps? Ecol. Eng. 2020, 143, 105685. [Google Scholar] [CrossRef]
  63. Wu, W.; Wang, X.; Ren, Z.; Zhou, X.; Du, G. N-Induced Species Loss Dampened by Clipping Mainly Through Suppressing Dominant Species in an Alpine Meadow. Front. Plant Sci. 2022, 13, 815011. [Google Scholar] [CrossRef]
  64. Doležal, J.; Lanta, V.; Mudrák, O.; Lepš, J.; Wilson, S. Seasonality promotes grassland diversity: Interactions with mowing, fertilization and removal of dominant species. J. Ecol. 2018, 107, 203–215. [Google Scholar] [CrossRef]
  65. Mao, J.; Shi, X.; Thornton, P.E.; Piao, S.; Wang, X. Causes of spring vegetation growth trends in the northern mid–high latitudes from 1982 to 2004. Environ. Res. Lett. 2012, 7, 014010. [Google Scholar] [CrossRef] [Green Version]
  66. Zhang, W.; Huang, D.; Wang, R.; Liu, J.; Du, N. Altitudinal Patterns of Species Diversity and Phylogenetic Diversity across Temperate Mountain Forests of Northern China. PLoS ONE 2016, 11, e0159995. [Google Scholar] [CrossRef] [PubMed] [Green Version]
  67. Harrison, S. Plant community diversity will decline more than increase under climatic warming. Philos. Trans. R. Soc. 2020, 375, 20190106. [Google Scholar] [CrossRef] [PubMed] [Green Version]
  68. Wu, Q.; Ren, H.; Wang, Z.; Li, Z.; Liu, Y.; Wang, Z.; Li, Y.; Zhang, R.; Zhao, M.; Chang, S.X. Additive negative effects of decadal warming and nitrogen addition on grassland community stability. J. Ecol. 2020, 108, 1442–1452. [Google Scholar] [CrossRef]
  69. Natalia, R.; Sergey, K.; Michał, S.; Xianyong, C.; Snezhana, Z. Postglacial history of the Steppe Altai: Climate, fire and plant diversity. Quat. Sci. Rev. 2020, 249, 106616. [Google Scholar] [CrossRef]
  70. Harrison, S.; Spasojevic, M.J.; Li, D. Climate and plant community diversity in space and time. Proc. Natl. Acad. Sci. USA 2020, 117, 4464–4470. [Google Scholar] [CrossRef]
  71. Zani, D.; Crowther, T.W.; Mo, L.; Renner, S.S.; Zohner, C.M. Increased growing-season productivity drives earlier autumn leaf senescence in temperate trees. Science 2020, 370, 1066–1071. [Google Scholar] [CrossRef] [PubMed]
  72. Diamond, J.M. Assembly of Species Communities; Harvard University Press: Cambridge, MA, USA, 1975; pp. 342–444. [Google Scholar]
  73. Chai, Y.; Xu, J.; Liu, H.; Liu, Q.; Zhang, C.; Kang, M.; Liang, C.; Wang, R.; Gao, X.; Zhang, F.; et al. Species composition and phylogenetic structure of major shrublands in North China. China J. Plant Ecol. 2019, 43, 793–805. [Google Scholar] [CrossRef]
  74. Weiher, E.; Keddy, P.A. Assembly rules, null models, and trait dispersion: New questions from old patterns. Oikos 1995, 74, 159–164. [Google Scholar] [CrossRef] [Green Version]
  75. Barfknecht, D.F.; Gibson, D.J. Are metapopulation species drivers of metacommunity structure in sandstone outcrop communities? J. Veg. Sci. 2023, 34, e13167. [Google Scholar] [CrossRef]
  76. Ben Saadi, C.; Cayuela, L.; de Dios, G.B.; de Aledo, J.G.; Matas-Granados, L.; Salinas, N.; Cuadros, M.D.L.; Macia, M.J. Latitudinal patterns and environmental drivers of taxonomic, functional, and phylogenetic diversity of woody plants in western Amazonian terra firme forests. Front. Plant Sci. 2022, 13, 978299. [Google Scholar] [CrossRef]
  77. Ouyang, J.; Liu, G.; Zhou, W. Community assembly of riparian vegetation in the middle and lower reaches of the Yangtze River. Plant Sci. J. 2020, 38, 751–761. [Google Scholar] [CrossRef]
  78. Ankit, A.; Kamali, S.; Singh, A. Genomic & structural diversity and functional role of potassium (K(+)) transport proteins in plants. Int. J. Biol. Macromol. 2022, 208, 844–857. [Google Scholar] [CrossRef] [PubMed]
  79. Anil Kumar, S.; Kaniganti, S.; Hima Kumari, P.; Sudhakar Reddy, P.; Suravajhala, P.; Suprasanna, P.; Kishor, P.B.K. Functional and biotechnological cues of potassium homeostasis for stress tolerance and plant development. Biotechnol. Genet. Eng. Rev. 2022, 5, 1–44. [Google Scholar] [CrossRef]
  80. Wang, X.-Y.; Ge, Y.; Wang, J. Positive effects of plant diversity on soil microbial biomass and activity are associated with more root biomass production. J. Plant Interact. 2017, 12, 533–541. [Google Scholar] [CrossRef] [Green Version]
  81. Lange, M.; Eisenhauer, N.; Sierra, C.A.; Bessler, H.; Engels, C.; Griffiths, R.I.; Mellado-Vazquez, P.G.; Malik, A.A.; Roy, J.; Scheu, S.; et al. Plant diversity increases soil microbial activity and soil carbon storage. Nat. Commun. 2015, 6, 6707. [Google Scholar] [CrossRef] [Green Version]
  82. Jiang, L.; Hu, D.; Wang, H.; Lv, G. Discriminating ecological processes affecting different dimensions of alpha- and beta-diversity in desert plant communities. Ecol. Evol. 2022, 12, e8710. [Google Scholar] [CrossRef] [PubMed]
  83. Cheng, X.L.; Yuan, L.X.; Nizamani, M.M.; Zhu, Z.X.; Friedman, C.R.; Wang, H.F. Taxonomic and phylogenetic diversity of vascular plants at Ma’anling volcano urban park in tropical Haikou, China: Reponses to soil properties. PLoS ONE 2018, 13, e0198517. [Google Scholar] [CrossRef] [Green Version]
  84. Zhang, Y.; Wang, G.H.; Gou, Q.Q.; Zhang, Y.; Liu, J.; Gao, M. Succession of a natural desert vegetation community after long-term fencing at the edge of a desert oasis in northwest China. Front. Plant Sci. 2023, 14, 1091446. [Google Scholar] [CrossRef]
  85. An, H.B.; Zhang, B.; Thomas, B.; Beck, R.; Willms, W.D.; Li, Y.J.; Hao, X.Y. Short term recovery of vegetation and soil after abandoning cultivated mixedgrass prairies in Alberta, Canada. Catena 2019, 173, 321–329. [Google Scholar] [CrossRef]
  86. Ge, J.M.; Wang, S.; Fan, J.; Gongadze, K.; Wu, L.H. Soil nutrients of different land-use types and topographic positions in the water-wind erosion crisscross region of China’s Loess Plateau. Catena 2020, 184, 104243. [Google Scholar] [CrossRef]
  87. Song, X.; Fang, C.; Yuan, Z.Q.; Li, F.M. Long-Term Growth of Alfalfa Increased Soil Organic Matter Accumulation and Nutrient Mineralization in a Semi-Arid Environment. Front. Env. Sci. 2021, 9, 649346. [Google Scholar] [CrossRef]
Figure 1. Phylogenetic tree showing the evolutionary relationships among the plant species surveyed in the study area. The classification of plant species was based on the Angiosperm Phylogeny Group IV (APG IV) system. The phylogenetic tree was generated and displayed using the “V.PhyloMaker2” and “ggtree” packages in R. The tree provides a framework for understanding the evolutionary history and relationships between the different plant species in the study area.
Diversity 15 00922 g001
Figure 2. Seasonal changes in plant community characteristics in the study area: (a) seasonal shift in the number of families, genera, and species in plant communities; (b) seasonal shift in the importance value (IV) of dominating families in plant communities.
Diversity 15 00922 g002
Figure 3. Seasonal variation in plant species diversity indices: (a) seasonal variation characteristics of the Shannon Diversity Index; (b) seasonal variation characteristics of the Pielou Evenness Index; (c) seasonal variation characteristics of the Simpson Dominance Index; (d) seasonal variation characteristics of the Margalef Richness Index. The p-value of the Kruskal–Wallis test between seasons is shown above each plot, with p < 0.05 represented by a “*” to indicate a significant difference.
Diversity 15 00922 g003
Figure 4. Seasonal variation in plant Phylogenetic Diversity Index (PD). The “*” indicates a significant difference.
Diversity 15 00922 g004
Figure 5. Seasonal variation in plant phylogenetic structure indices: (a) seasonal variation characteristics of the Net Nearest Taxa Index (NTI) from spring to autumn; (b) seasonal variation characteristics of the Net Relatedness Index (NRI) from spring to autumn. The NTI and NRI show seasonal variations in plant phylogenetic structure from spring to autumn. The “*” indicates a significant difference.
Diversity 15 00922 g005
Figure 6. Spearman correlation among plant diversity indices. The number represents the correlation coefficient between two diversity indices. A correlation coefficient greater than zero indicates a positive correlation, while a correlation coefficient less than zero indicates a negative correlation.
Diversity 15 00922 g006
Figure 7. Redundancy analysis (RDA) of soil environmental factors and plant communities. The soil environmental factors shown include soil organic matter (SOM), soil moisture content (SMC), available potassium (AK), ammonium nitrogen (AN), available phosphorus (AP), and soil pH. The soil environmental factors and plant species composition RDA plots for soil layers of 0–10 cm, 10–20 cm, and 0–20 cm are presented in panels (ac), respectively. RDA axes I and II explain 56.24%, 62.27%, and 59.22% of the variation in the soil layers of 0–10 cm, 10–20 cm, and 0–20 cm, respectively.
Diversity 15 00922 g007
Figure 8. Linear regression analysis of soil environmental factors and diversity indices. Panels (a,b) show the relationship between ammonium nitrogen (AN), soil organic matter (SOM), and the Shannon Diversity Index. Panels (c,d) show the relationship between the same soil factors and the Phylogenetic Diversity Index (PD). The level of statistical significance is denoted by asterisks: “*”, “**”, and “***” indicate p-values of <0.05, 0.01, and 0.001, respectively.
Diversity 15 00922 g008
Table 1. Seasonal variation in dominant plant species importance values. Species listed in this table are dominant plant species with average importance values greater than 1%, classified using the Angiosperm Phylogeny Group IV (APG IV) classification system.
SpeciesFamilyImportance Values
SpringSummerAutumn
Chenopodium serotinumAmaranthaceae42.52%19.51%0.32%
Alopecurus japonicusPoaceae9.85%0.00%0.00%
Cyperus rotundusCyperaceae4.29%1.95%0.00%
Descurainia sophiaBrassicaceae6.09%0.00%0.00%
Abutilon theophrastiMalvaceae6.31%16.35%6.17%
Rumex dentatusPolygonaceae2.54%0.61%0.00%
Humulus scandensMoraceae5.99%12.87%20.24%
Sonchus arvensisAsteraceae2.62%2.43%2.39%
Echinochloa crusgalliPoaceae4.38%18.27%23.12%
Setaria viridisPoaceae1.72%9.48%10.44%
Chenopodium albumAmaranthaceae2.88%4.49%2.69%
Cucumis acidusCucurbitaceae1.30%5.76%3.32%
Digitaria sanguinalisPoaceae2.40%3.98%26.03%
Table 2. Seasonal variation in plant diversity indices, presented as the means ± standard deviations of 12 samples.
SeasonShannonSimpsonPielouMargalefPDNTINRI
Spring1.79 ± 0.240.74 ± 0.080.78 ± 0.071.87 ± 0.32936 ± 121−0.2 ± 1.34−0.5 ± 0.89
Summer1.72 ± 0.120.79 ± 0.030.91 ± 0.021.3 ± 0.19682 ± 66.70.08 ± 0.77−0.2 ± 0.66
Autumn1.62 ± 0.180.77 ± 0.030.91 ± 0.031.16 ± 0.27566 ± 1241.12 ± 0.591.55 ± 1.4
Table 3. The significance of the Spearman correlation analysis of each diversity index. Significance results are indicated by asterisks: “*”, p < 0.05; “**”, p < 0.01; “***”, p < 0.001.
ShannonSimpsonPielouMargalefPDNTINRI
Shannon 0 ***0.023 *0 ***0 ***0.1570.167
Simpson0 *** 0 ***0.033*0.1050.7140.776
Pielou0.023 *0 *** 0 ***0 ***0.1290.017 *
Margalef0 ***0.033 *0 *** 0 ***0.025 *0.001 **
PD0 ***0.1050 ***0 *** 0 ***0 ***
NTI0.1570.7140.1290.025 *0 *** 0 ***
NRI0.1670.7760.017 *0.001 **0 ***0 ***
Table 4. Values of soil environmental factors and their explanatory power for changes in plant communities. Monte Carlo permutation test analysis was conducted to determine the significance of soil environmental factors on plant community changes across 0–10 cm, 10–20 cm, and 0–20 cm soil layers. M ± SD represents the mean ± standard deviation of soil environmental factors in 12 plots. R2 represents the proportion of variation in plant community changes explained by the soil environmental factors. Significance levels are indicated as follows: “*”, p < 0.05; “**”, p < 0.01.
Soil FactorsUnit0–10 cm10–20 cm0–20 cm
M ± SDR2pM ± SDR2pM ± SDR2p
pH-8.13 ± 0.060.5010.036 *8.17 ± 0.100.2460.3018.15 ± 0.080.3520.132
AKmg/kg246.60 ± 16.860.6480.009 **234.70 ± 11.950.5620.036 *240.65 ± 13.460.7580.002 **
APmg/kg54.34 ± 13.060.1390.52842.54 ± 6.420.3070.20748.44 ± 6.540.0520.806
ANmg/kg28.33 ± 2.310.2140.33426.47 ± 3.050.5770.023 *2740 ± 2.470.4290.102
SOMg/kg10.92 ± 2.360.470.05610.95 ± 2.440.5490.026 *10.94 ± 2.350.4930.038 *
SMC%16.76 ± 1.390.2880.22218.07 ± 1.460.3650.12317.41 ± 1.330.3680.127
Disclaimer/Publisher’s Note: The statements, opinions and data contained in all publications are solely those of the individual author(s) and contributor(s) and not of MDPI and/or the editor(s). MDPI and/or the editor(s) disclaim responsibility for any injury to people or property resulting from any ideas, methods, instructions or products referred to in the content.

