
Vertical Stratification of Butterfly Assemblages Persists in Highly Disturbed Forest Fragments of the Brazilian Atlantic Forest


Abstract
:1. Introduction
2. Materials and Methods
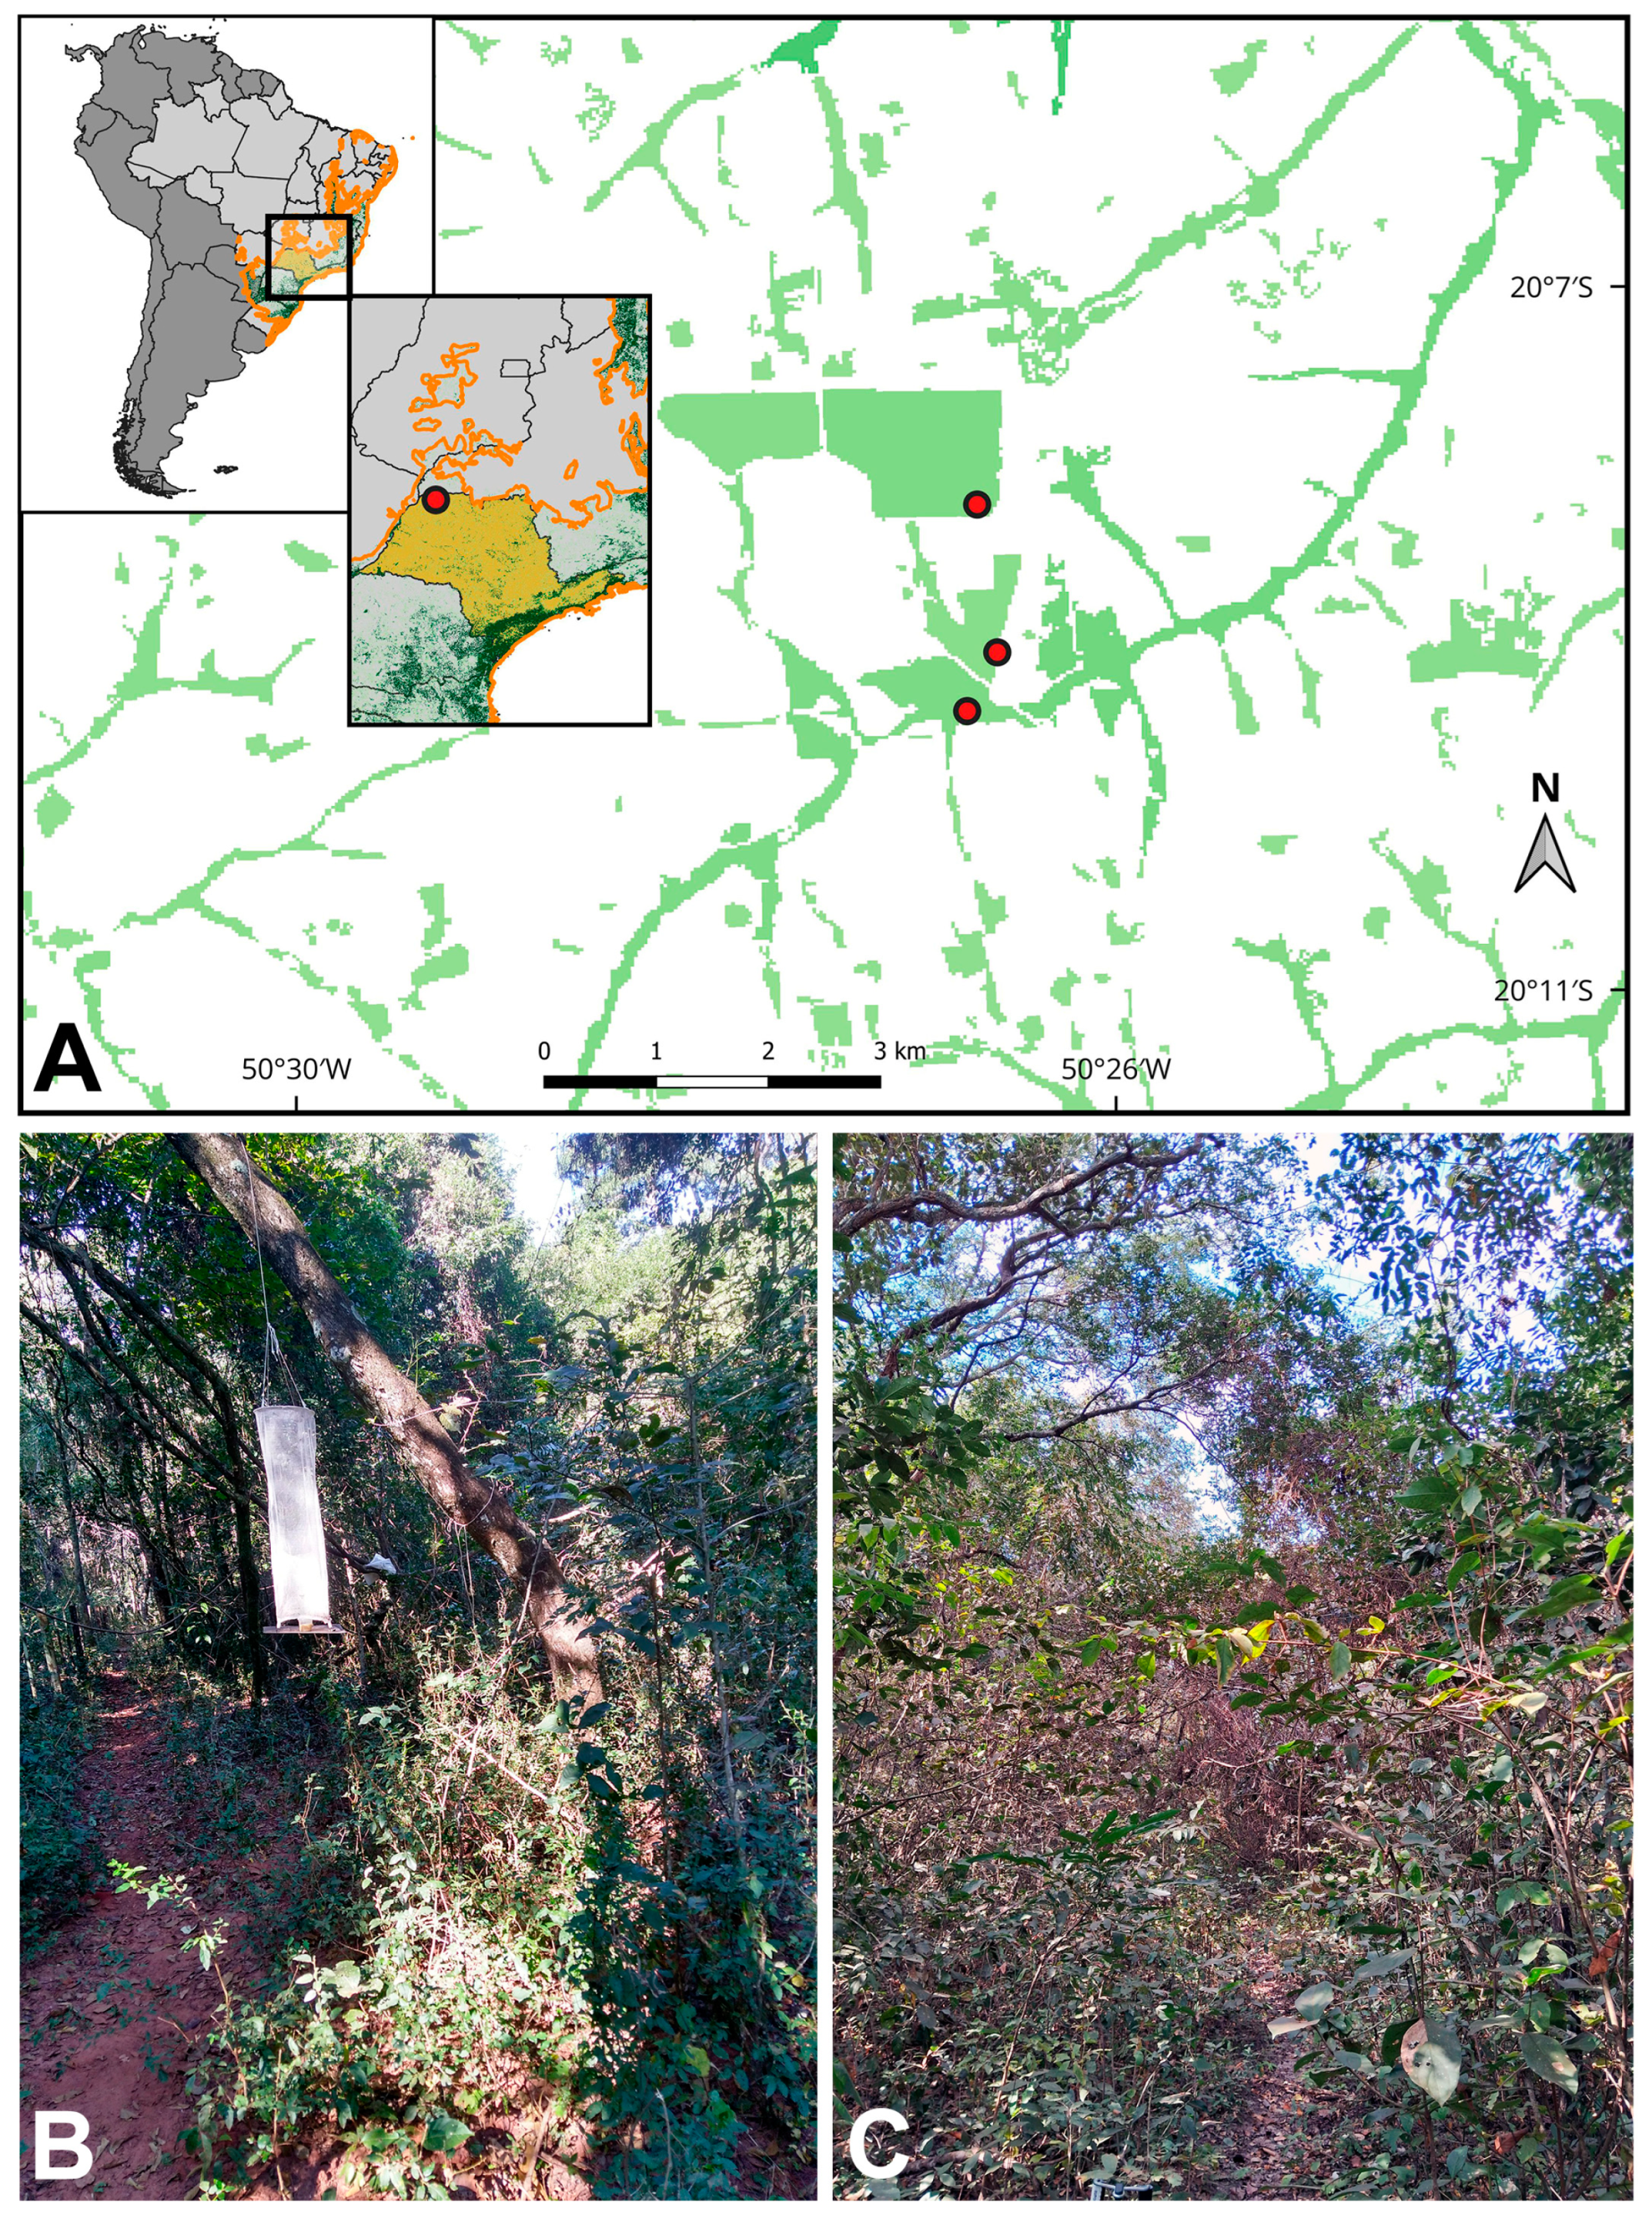
2.1. Study Area
2.2. Butterfly Sampling
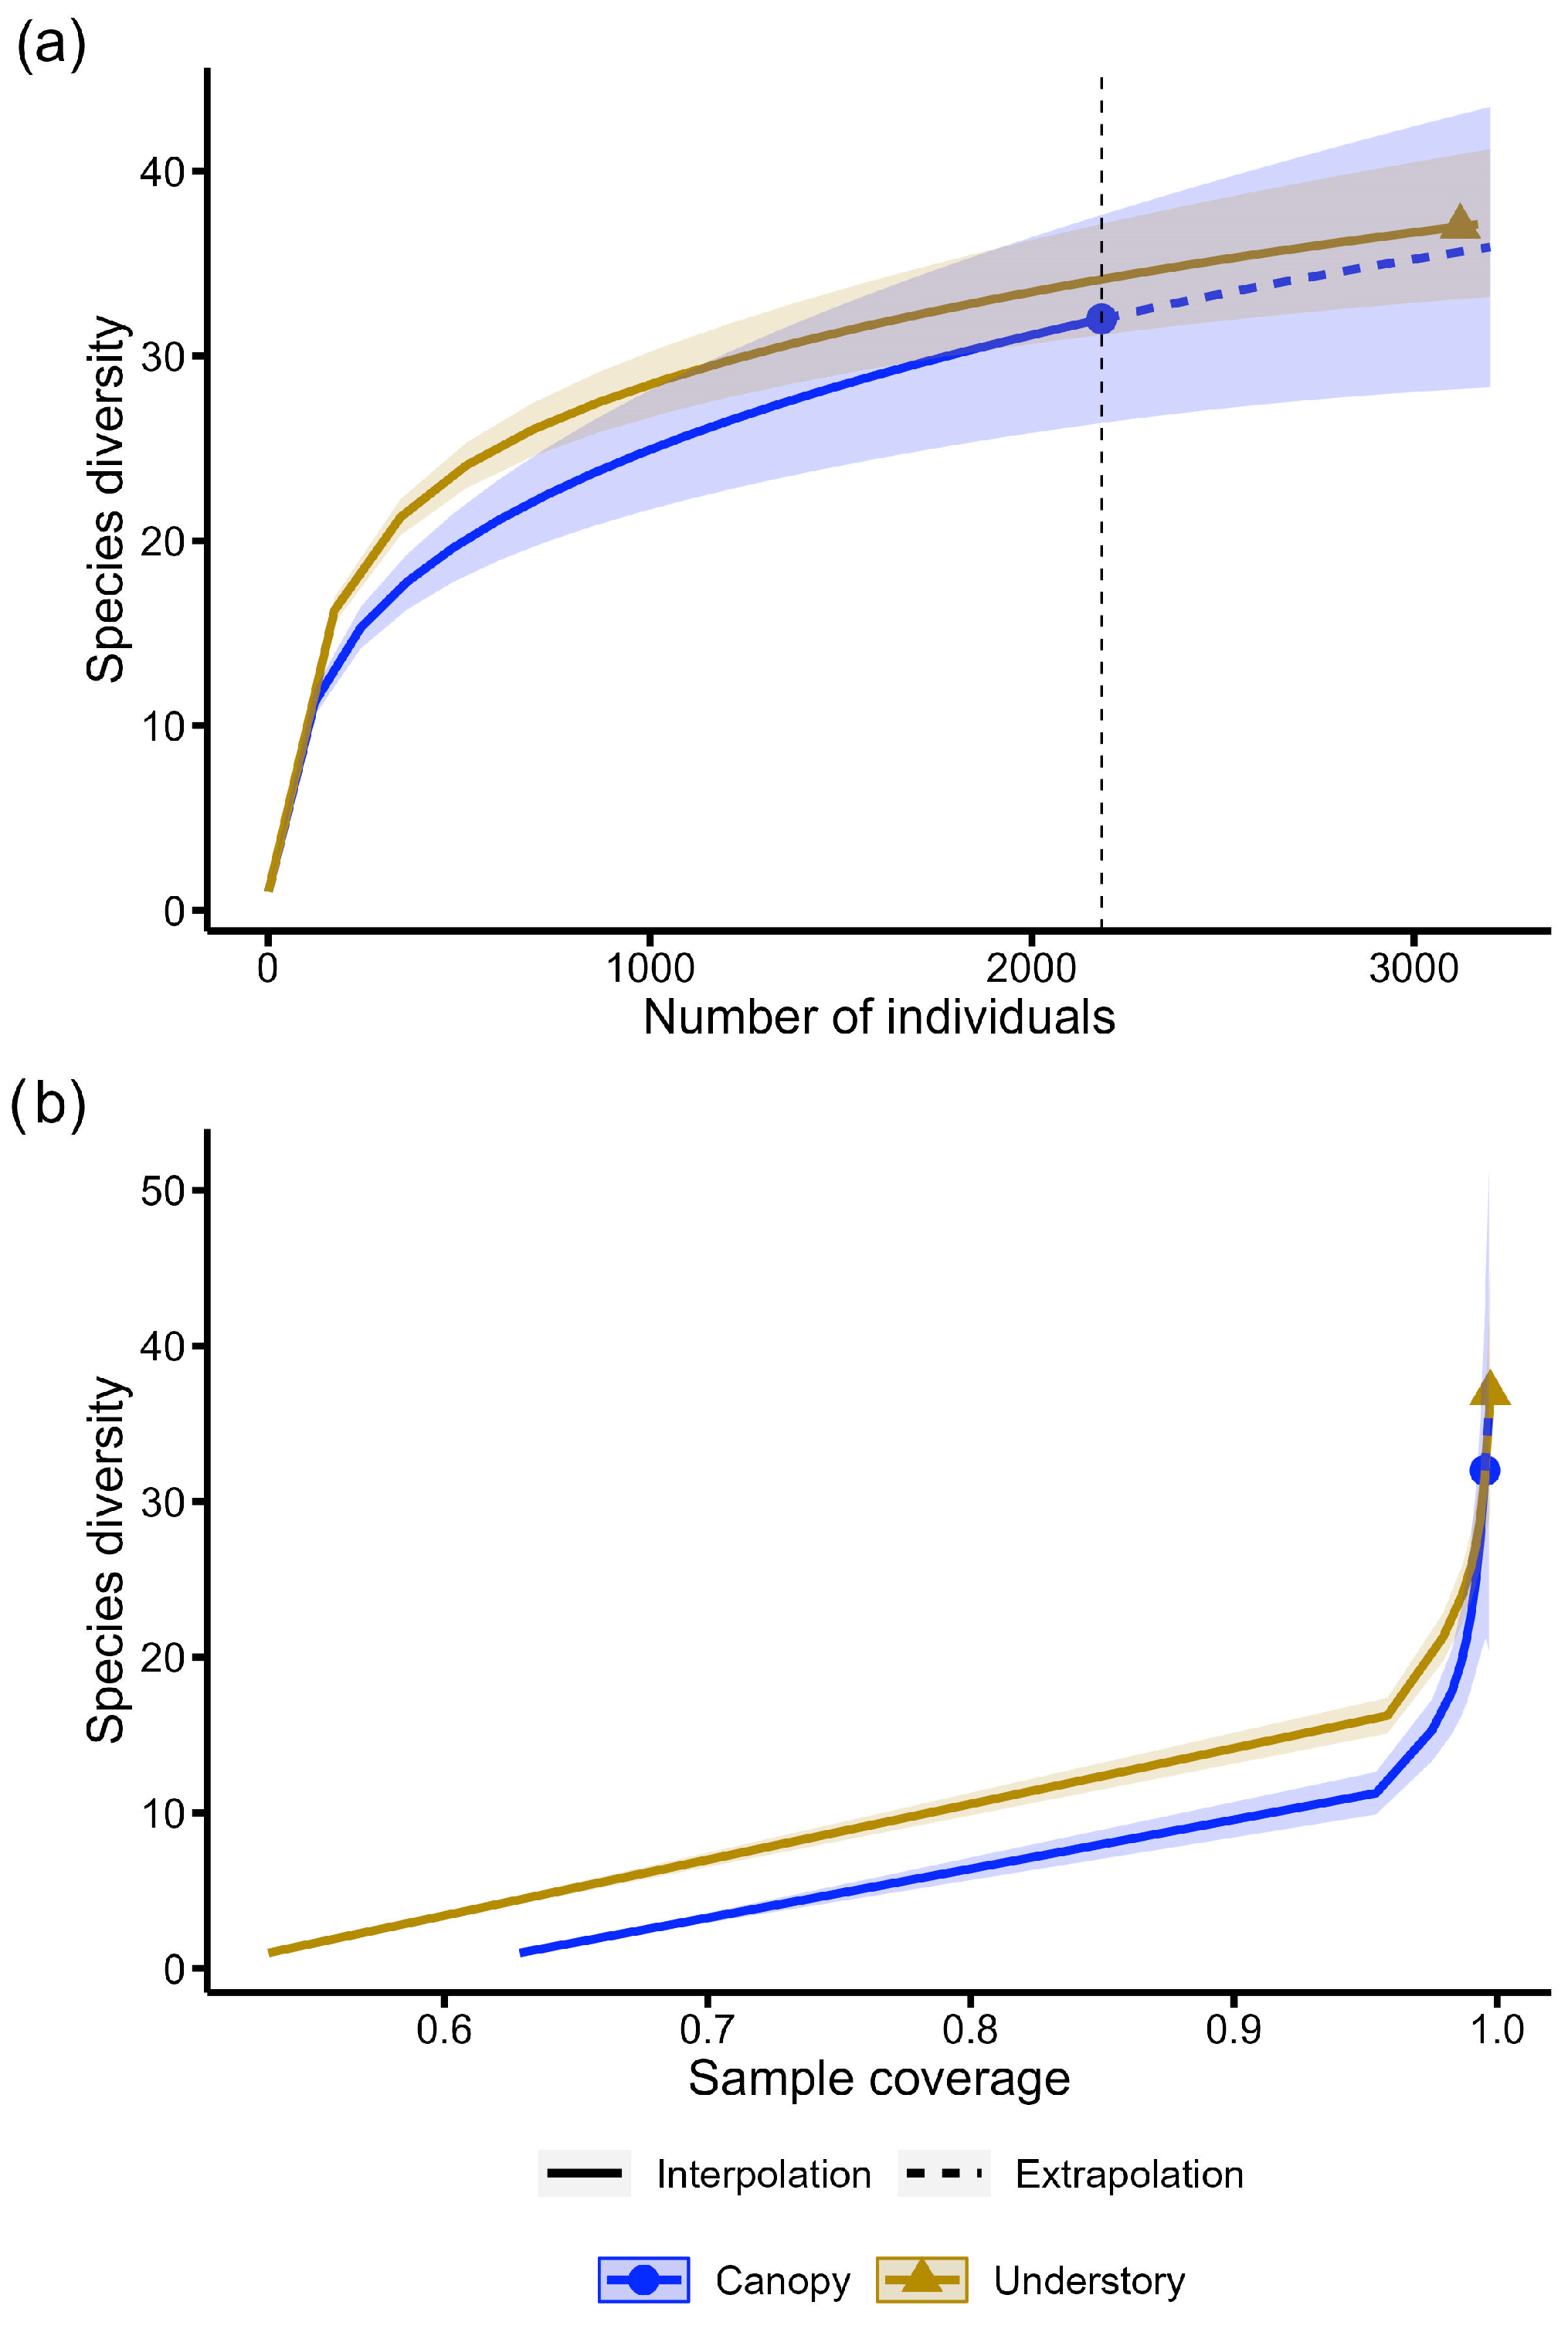
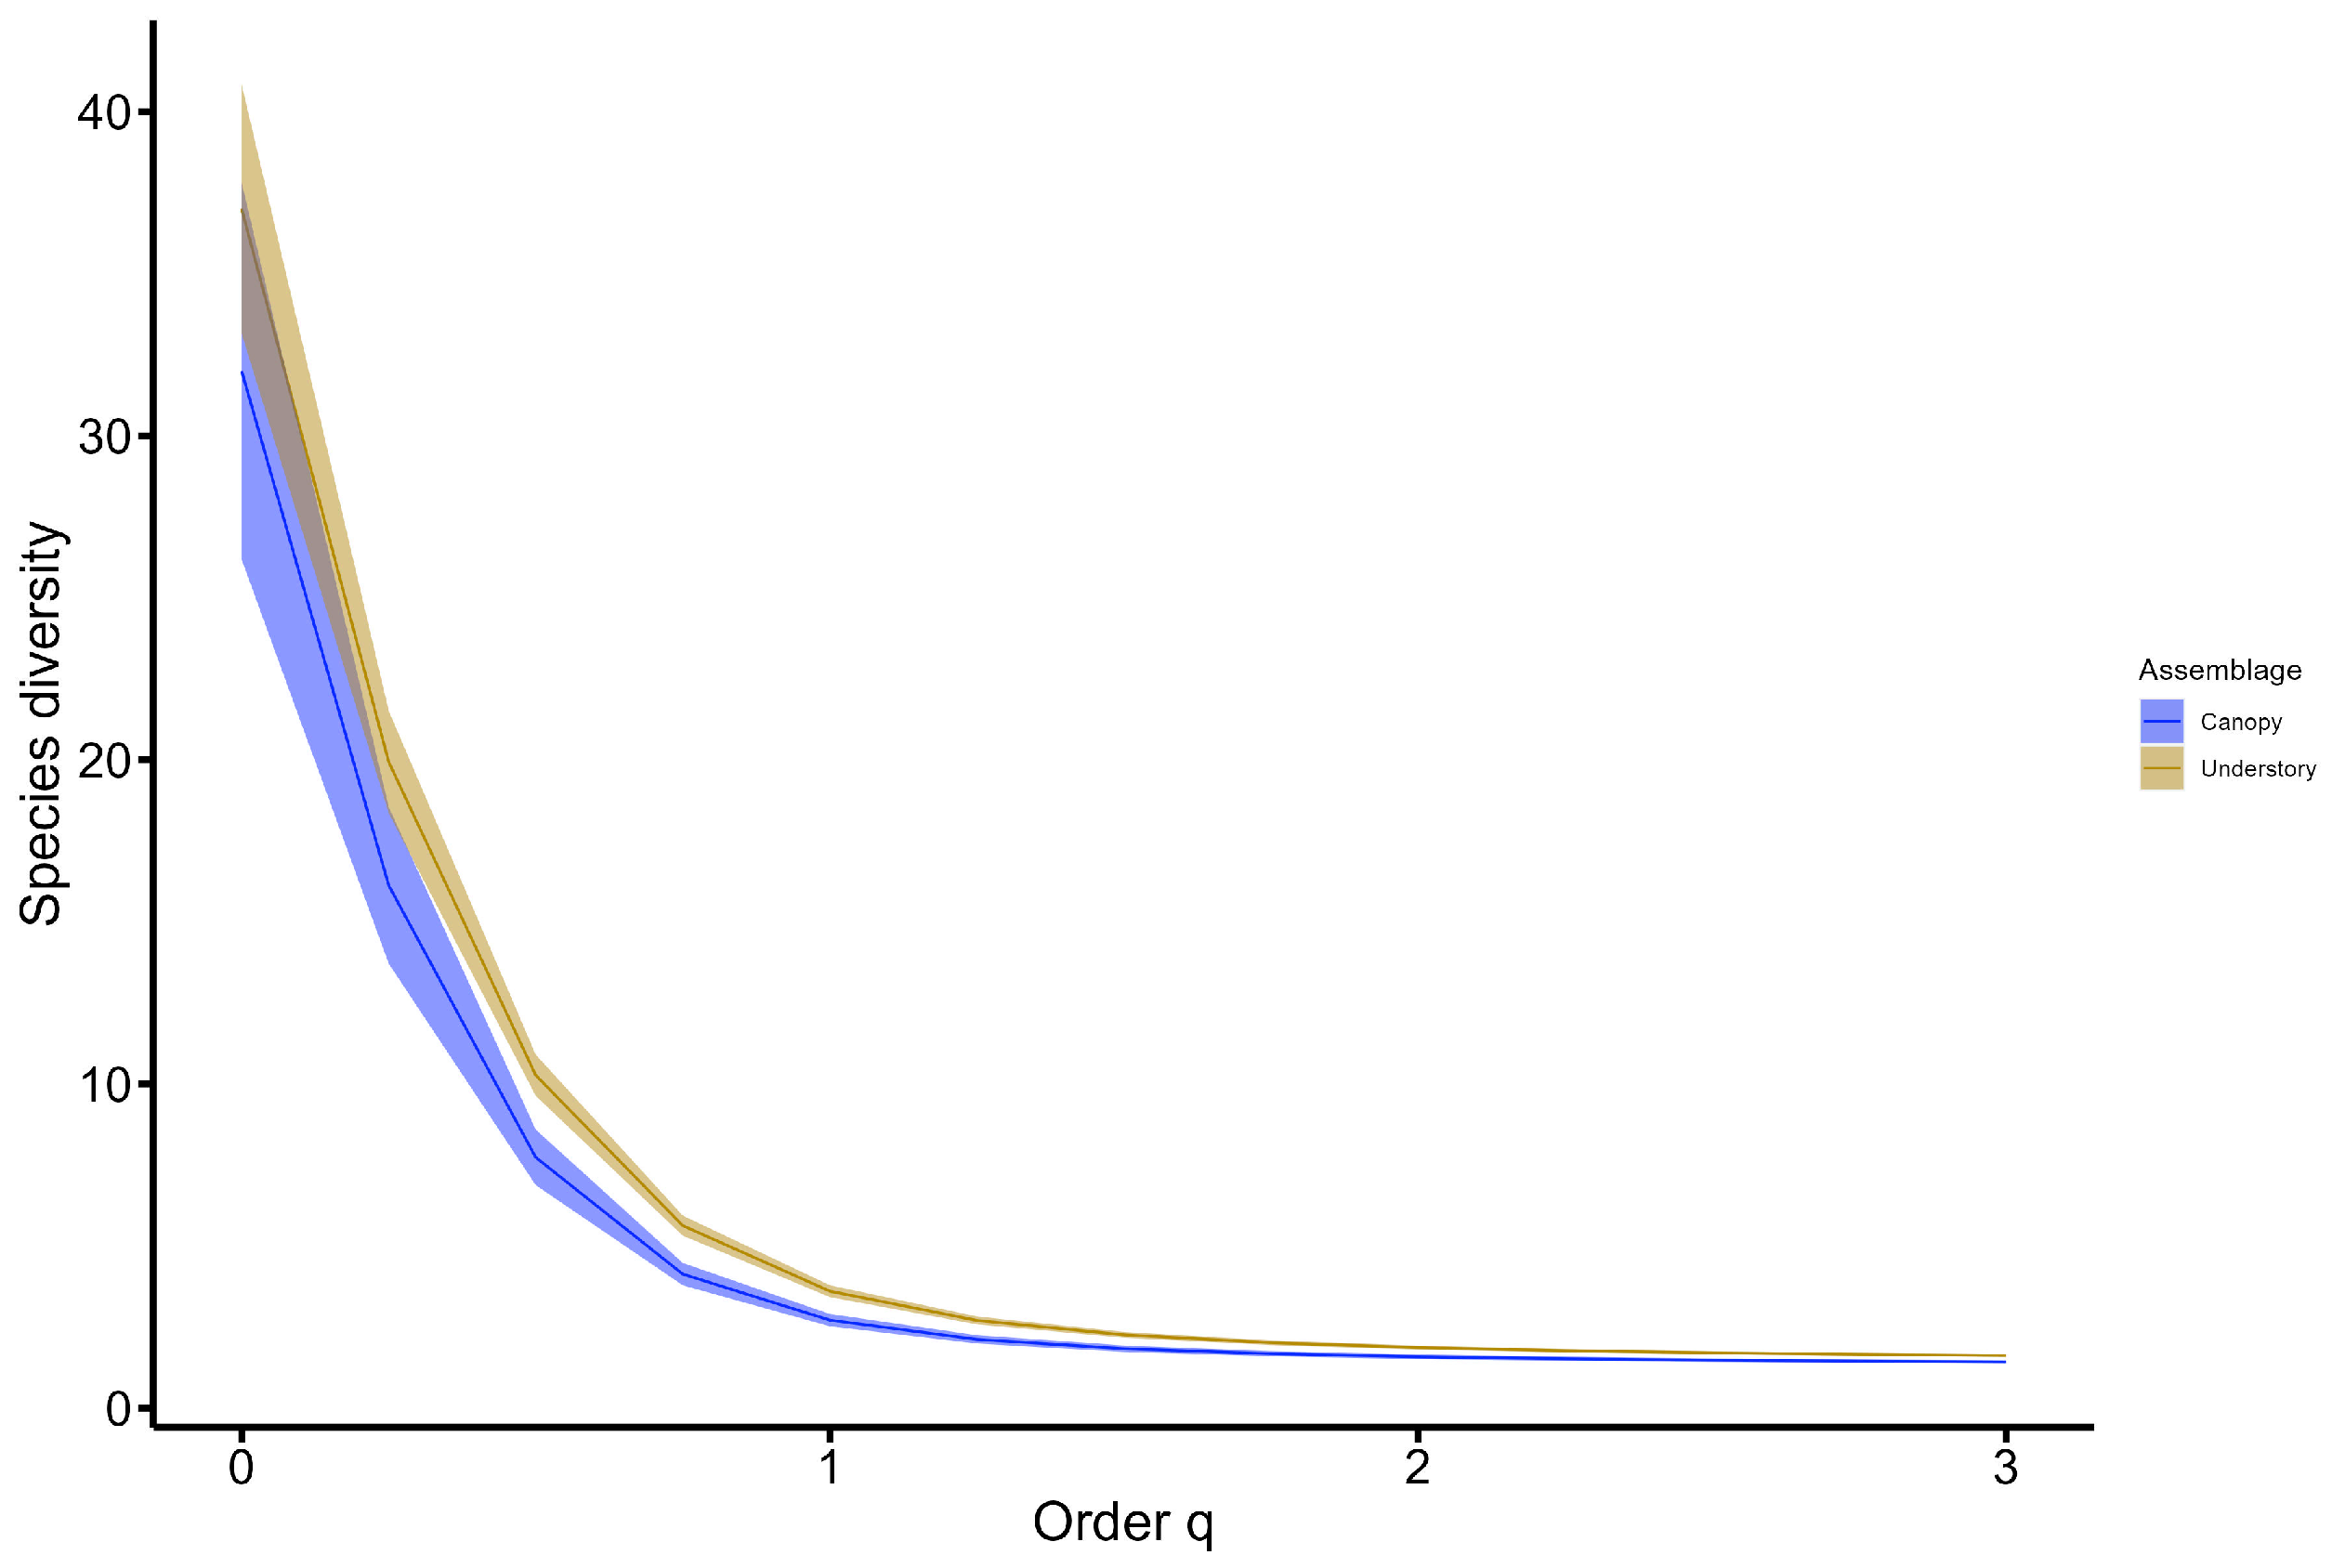
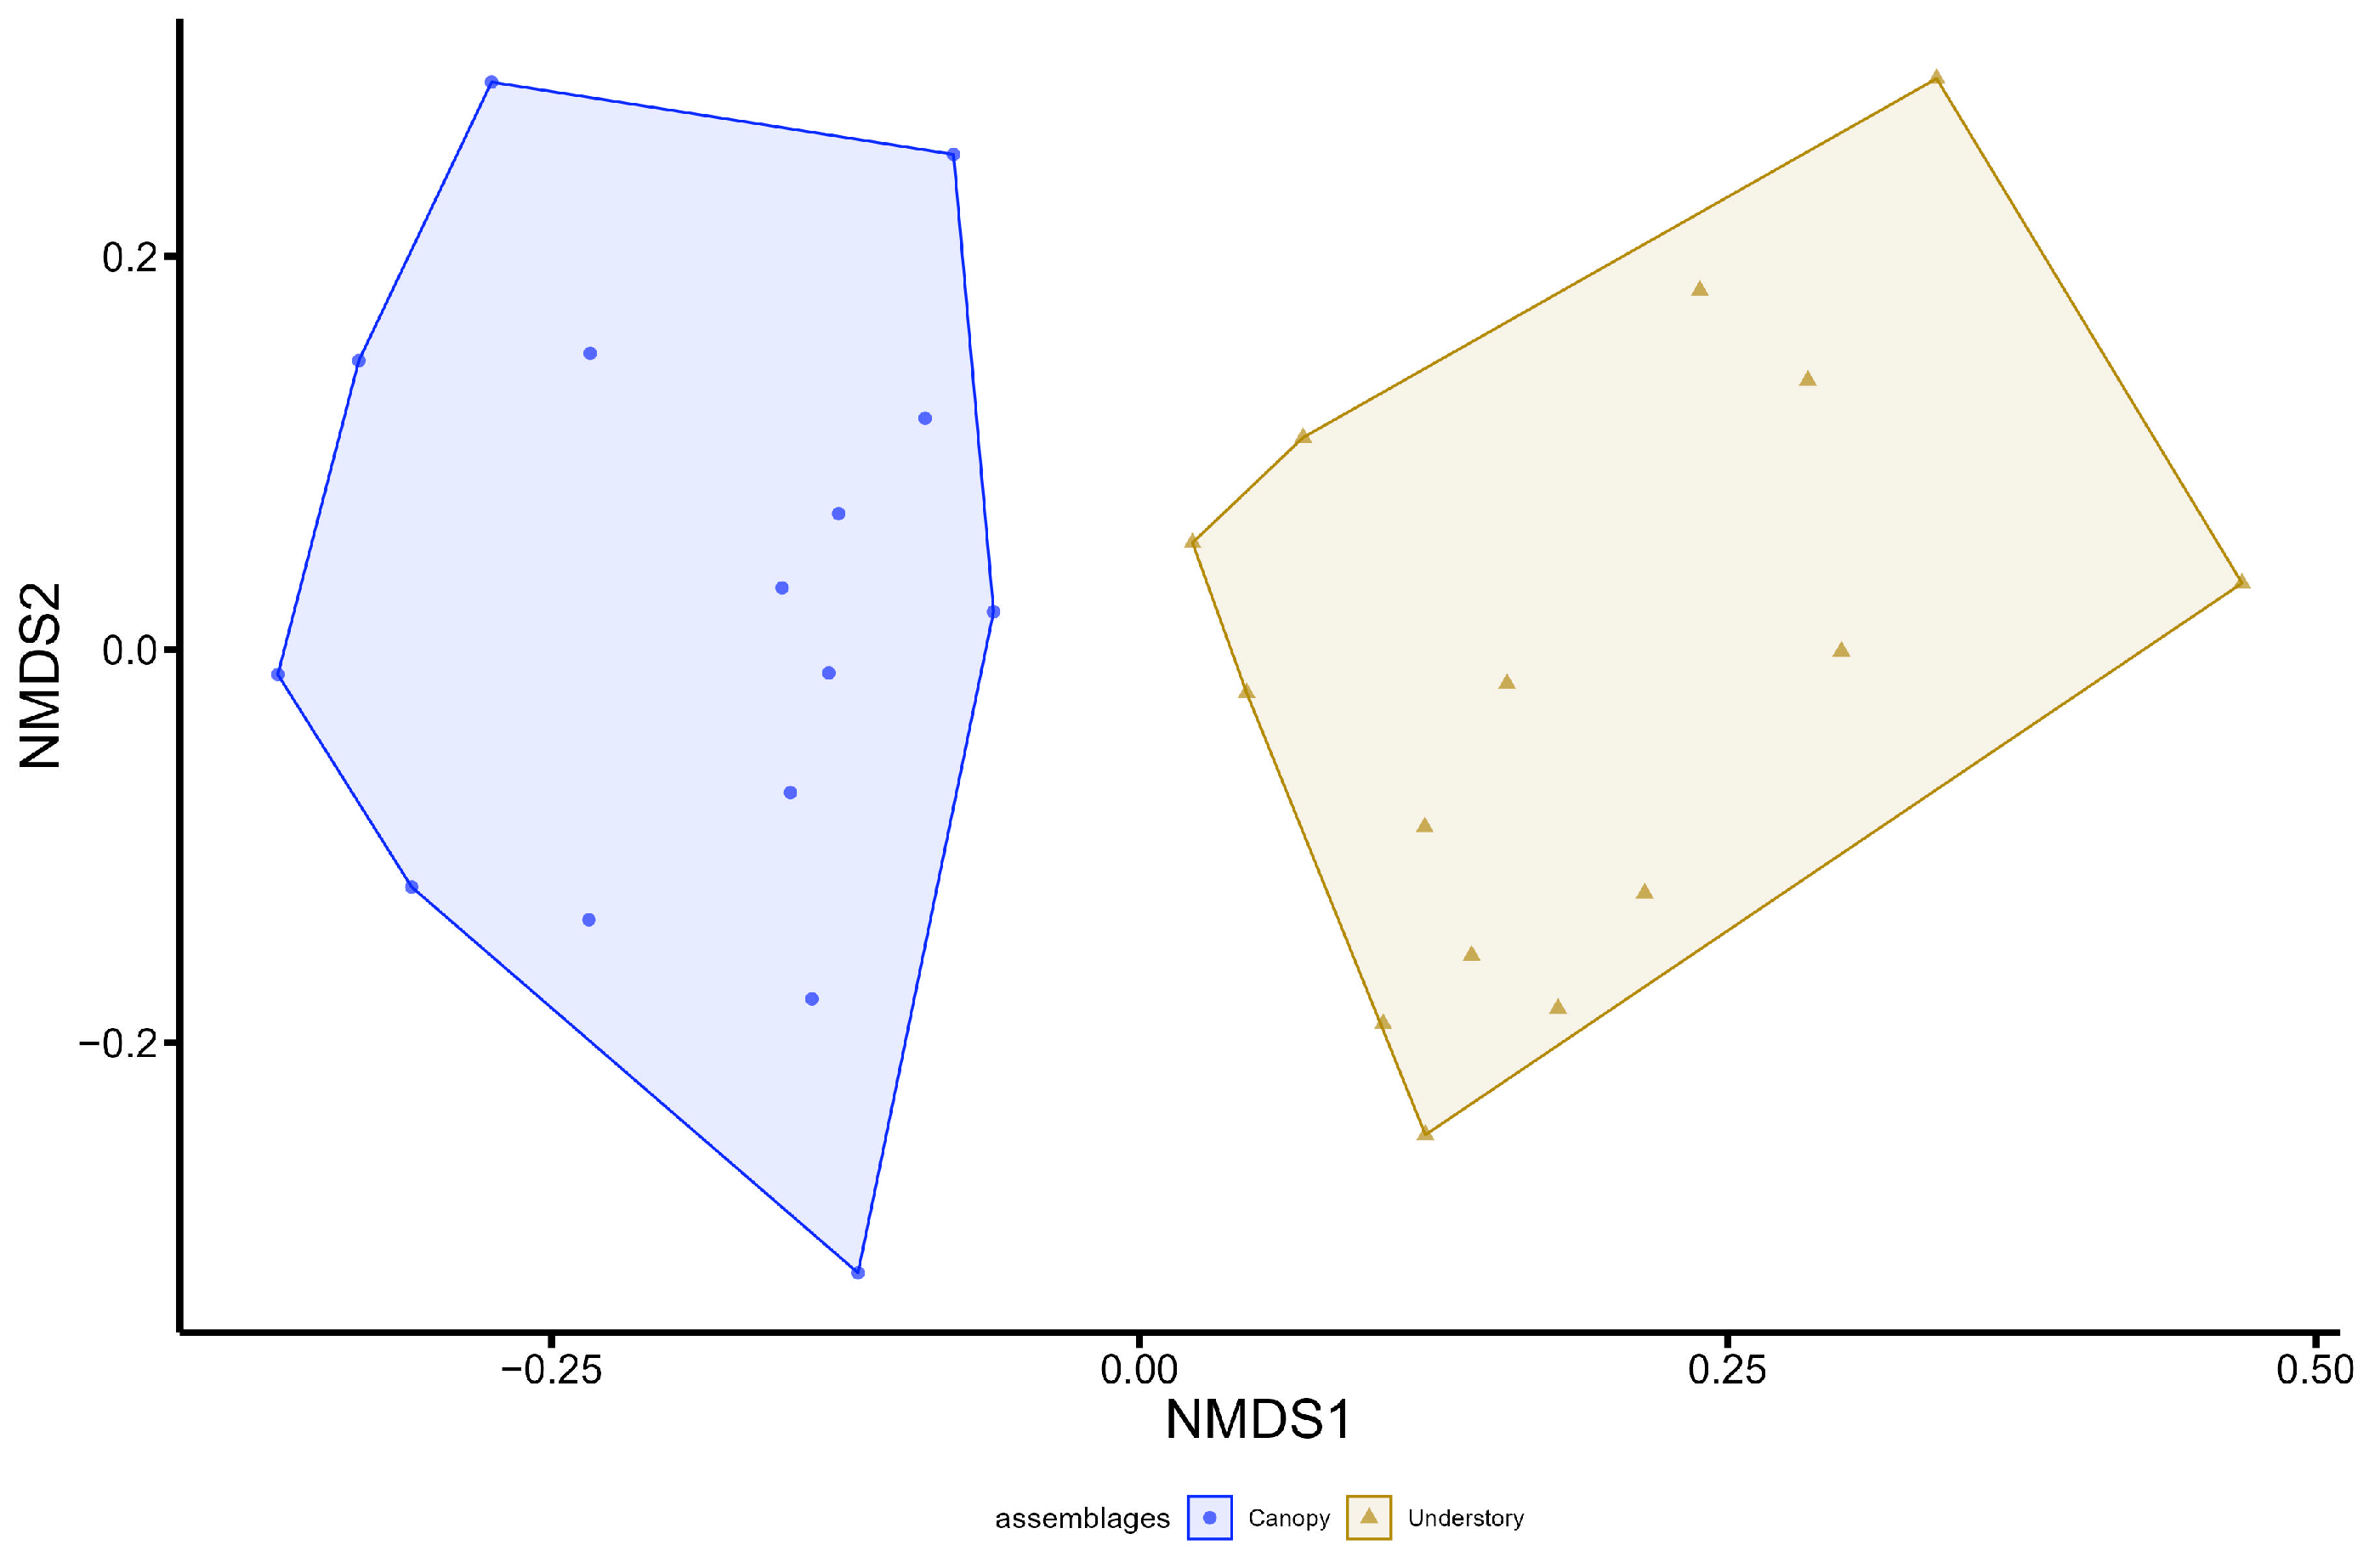
2.3. Data Analyses
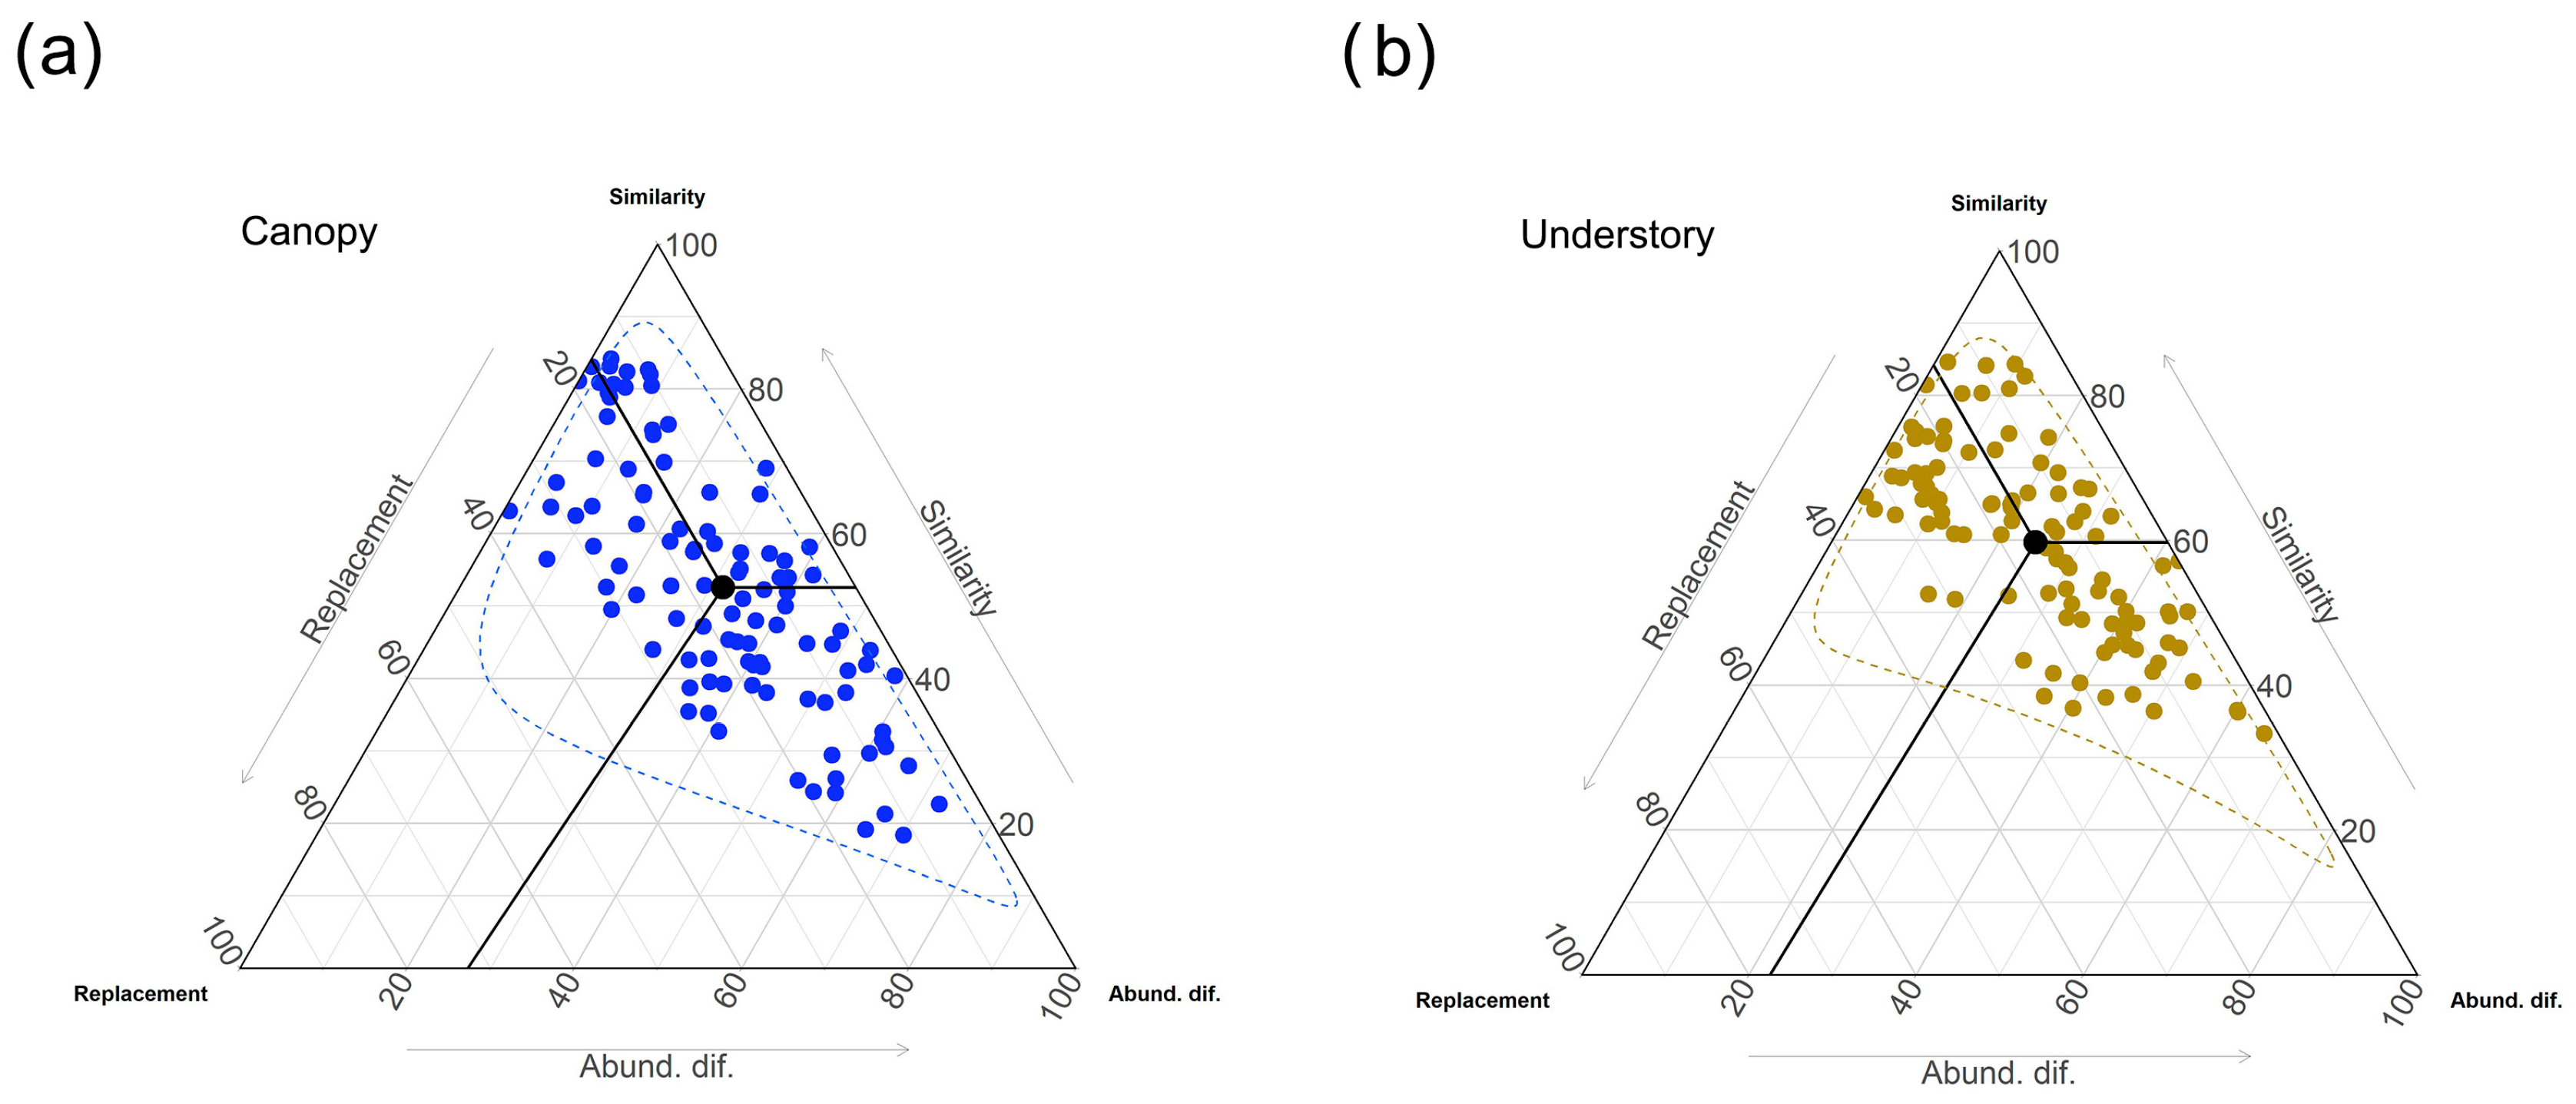
3. Results
4. Discussion
Supplementary Materials
Author Contributions
Funding
Institutional Review Board Statement
Data Availability Statement
Acknowledgments
Conflicts of Interest
References
- Foley, J.A.; Defries, R.; Asner, G.P.; Barford, C.; Bonan, G.; Carpenter, S.R.; Chapin, F.S.; Coe, M.T.; Daily, G.C.; Gibbs, H.K.; et al. Global consequences of land use. Science 2005, 309, 570–574. [Google Scholar] [CrossRef] [PubMed]
- Butchart, S.H. Global Biodiversity: Indicators of Recent Declines. Science 2010, 328, 1164–1168. [Google Scholar] [CrossRef]
- Zalles, V.; Hansen, M.C.; Potapov, P.V.; Parker, D.; Stehman, S.V.; Pickens, A.H.; Parente, L.L.; Ferreira, L.G.; Song, X.-P.; Hernandez-Serna, A.; et al. Rapid expansion of human impact on natural land in South America since 1985. Sci. Adv. 2021, 7, eabg1620. [Google Scholar] [CrossRef]
- Murcia, C. Edge effects in fragmented forests: Implications for conservation. Trends Ecol. Evol. 1995, 10, 58–62. [Google Scholar] [CrossRef]
- Didham, R.K. The influence of edge effects and forest fragmentation on leaf-litter invertebrates in central Amazonia. In Tropical Forest Remnants: Ecology, Management, and Conservation of Fragmented Communities; Laurance, W.F., Bierregaard, R.O., Jr., Eds.; University of Chicago Press: Chicago, IL, USA, 1997; pp. 55–70. [Google Scholar]
- Turton, S.M.; Freiburger, H.J. Edge and Aspect Effects on the Microclimate of a Small Tropical Forest Remnant on the Atherton Tableland, Northeastern Australia. In Tropical Forest Remnants: Ecology, Management, and Conservation of Fragmented Communities; Laurance, W.F., Bierregaard, R.O., Jr., Eds.; University of Chicago Press: Chicago, IL, USA, 1997; pp. 45–54. [Google Scholar]
- Gámez-Virués, S.; Perovic, D.J.; Gossner, M.M.; Börschig, C.; Blüthgen, N.; de Jong, H.; Simons, N.K.; Klein, A.-M.; Krauss, J.; Maier, G.; et al. Landscape simplification filters species traits and drives biotic homogenization. Nat. Commun. 2015, 6, 8568. [Google Scholar] [CrossRef] [PubMed]
- Basham, E.W.; Baecher, J.A.; Klinges, D.H.; Scheffers, B.R. Vertical stratification patterns of tropical forest vertebrates: A meta-analysis. Biol. Rev. 2023, 98, 99–114. [Google Scholar] [CrossRef]
- Walther, B.A. Vertical stratification and use of vegetation and light habitats by Neotropical forest birds. J. Ornithol. 2002, 143, 64–81. [Google Scholar] [CrossRef]
- Vieira, E.M.; Monteiro-Filho, E.L.A. Vertical stratification of small mammals in the Atlantic rain forest of southeastern Brazil. J. Trop. Ecol. 2003, 19, 501–507. [Google Scholar] [CrossRef]
- Grimbacher, P.S.; Stork, N.E. Vertical stratification of feeding guilds and body size in beetle assemblages from an Australian tropical rainforest. Austral Ecol. 2007, 32, 77–85. [Google Scholar] [CrossRef]
- Santos, J.P.; Iserhard, C.A.; Carreira, J.Y.O.; Freitas, A.V.L. Monitoring fruit-feeding butterfly assemblages in two vertical strata in seasonal Atlantic Forest: Temporal species turnover is lower in the canopy. J. Trop. Ecol. 2017, 33, 345–355. [Google Scholar] [CrossRef]
- Fermon, H.; Waltert, M.; Vane-Wright, R.I.; Mühlenberg, M. Forest use and vertical stratification in fruit-feeding butterflies of Sulawesi, Indonesia: Impacts for conservation. Biodivers. Conserv. 2005, 14, 333–350. [Google Scholar] [CrossRef]
- Molleman, F.; Arjan, K.; Brakefield, P.M.; DeVries, P.J.; Zwaan, B.J. Vertical and temporal patterns of biodiversity of fruit-feeding butterflies in a tropical forest in Uganda. Biodivers. Conserv. 2006, 15, 107–121. [Google Scholar] [CrossRef]
- Fordyce, J.A.; DeVries, P.J. A tale of two communities: Neotropical butterfly assemblages show higher beta diversity in the canopy compared to the understory. Oecologia 2016, 181, 235–243. [Google Scholar] [CrossRef]
- DeVries, P.J. Stratification of fruit-feeding nymphalid butterflies in a Costa Rican Forest. J. Res. Lepid. 1988, 26, 98–108. [Google Scholar]
- Gueratto, P.E.; Carreira, J.Y.O.; Santos, J.P.; Tacioli, A.; Freitas, A.V.L. Effects of forest trails on the community structure of tropical butterflies. J. Insect Conserv. 2020, 24, 309–319. [Google Scholar] [CrossRef]
- Tabarelli, M.; Aguiar, A.V.; Ribeiro, M.C.; Metzger, J.P.; Peres, C.A. Prospects for biodiversity conservation in the Atlantic Forest: Lessons from aging human-modified landscapes. Biol. Conserv. 2010, 143, 2328–2340. [Google Scholar] [CrossRef]
- Freitas, S.R.; Hawbaker, T.J.; Metzger, J.P. Effects of roads, topography, and land use on forest cover dynamics in the Brazilian Atlantic Forest. For. Ecol. Manag. 2010, 259, 410–417. [Google Scholar] [CrossRef]
- Vancine, M.H.; Muylaert, R.L.; Niebuhr, B.B.; Oshima, J.E.F.; Tonetti, V.; Bernardo, R.; De Angelo, C.; Rosa, M.R.; Grohmann, C.H.; Ribeiro, M.C. The Atlantic Forest of South America: Spatiotemporal dynamics of the vegetation and implications for conservation. Biol. Conserv. 2024, 291, 110499. [Google Scholar] [CrossRef]
- Rosa, M.R.; Brancalion, P.H.S.; Crouzeilles, R.; Tambosi, L.R.; Piffer, P.R.; Lenti, F.E.B.; Hirota, M.; Santiami, E.; Metzger, J.P. Hidden destruction of older forests threatens Brazil’s Atlantic Forest and challenges restoration programs. Sci. Adv. 2021, 7, eabc4547. [Google Scholar] [CrossRef]
- Vasconcelos, T.S.; do Nascimento, B.T.M.; Prado, V.H.M. Expected impacts of climate change threaten the anuran diversity in Brazilian hotspots. Ecol. Evol. 2018, 8, 7894–7906. [Google Scholar] [CrossRef]
- Santos, J.P.; Sobral-Souza, T.; Brown, K.S.; Vancine, M.H.; Ribeiro, M.C.; Freitas, A.V.L. Effects of landscape modification on species richness patterns of fruit-feeding butterflies in Brazilian Atlantic Forest. Divers. Distrib. 2020, 26, 196–208. [Google Scholar] [CrossRef]
- Tambosi, L.R.; Martensen, A.C.; Ribeiro, M.C.; Metzger, J.P. A framework to optimize biodiversity restoration efforts based on habitat amount and landscape connectivity. Restor. Ecol. 2014, 22, 169–177. [Google Scholar] [CrossRef]
- Muylaert, R.L.; Vancine, M.H.; Bernardo, R.; Oshima, J.E.F.; Sobral-Souza, T.; Tonetti, V.R.; Niebuhr, B.B.; Ribeiro, M.C. Uma nota sobre os limites territoriais da Mata Atlântica. Oecol. Aust. 2018, 22, 302–311. [Google Scholar] [CrossRef]
- Rezende, A.A.; Ranga, N.T. Lianas da estação ecológica do Noroeste Paulista, São José do Rio Preto/Mirassol, SP, Brasil. Acta Bot. Bras. 2005, 9, 2. [Google Scholar] [CrossRef]
- Oksanen, J.; Blanchet, F.G.; Friendly, M.; Kindt, R.; Legendre, P.; Mcglinn, D.; Minchin, P.R.; O’hara, R.B.; Simpson, G.L.; Solymos, P.; et al. Package “vegan”: Community Ecology Package; v.2.6.6-1. CRAN, 2024; pp. 1–297. Available online: https://CRAN.R-project.org/package=vegan (accessed on 1 September 2024).
- R Core Team. R: A Language and Environment for Statistical Computing; R Foundation for Statistical Computing: Vienna, Austria, 2024. [Google Scholar]
- Bates, D.; Mächler, M.; Bolker, B.; Walker, S. Fitting linear mixed-effects models Using lme4. J. Stat. Softw. 2015, 67, 1–48. [Google Scholar] [CrossRef]
- Chao, A.; Gotelli, N.J.; Hsieh, T.C.; Sander, E.L.; Ma, K.H.; Colwell, R.K.; Ellison, A.M. Rarefaction and extrapolation with Hill numbers: A framework for sampling and estimation in species diversity studies. Ecol. Monogr. 2014, 84, 45–67. [Google Scholar] [CrossRef]
- Hsieh, T.C.; Ma, K.H.; Chao, A. iNEXT: An R package for rarefaction and extrapolation of species diversity (Hill numbers). Methods Ecol. Evol. 2016, 7, 1451–1456. [Google Scholar] [CrossRef]
- Chao, A.; Jost, L. Coverage-based rarefaction and extrapolation: Standardizing samples by completeness rather than size. Ecology 2012, 93, 2533–2547. [Google Scholar] [CrossRef]
- Jost, L. Entropy and diversity. Oikos 2006, 113, 363–375. [Google Scholar] [CrossRef]
- De Cáceres, M.; Legendre, P. Associations between species and groups of sites: Indices and statistical inference. Ecology 2009, 90, 3566–3574. [Google Scholar] [CrossRef]
- Podani, J.; Ricotta, C.; Schmera, D. A general framework for analyzing beta diversity, nestedness and related community-level phenomena based on abundance data. Ecol. Complex. 2013, 15, 52–61. [Google Scholar] [CrossRef]
- Ribeiro, D.B.; Freitas, A.V.L. The effect of reduced-impact logging on fruit-feeding butterflies in Central Amazon, Brazil. J. Insect Conserv. 2012, 16, 733–744. [Google Scholar] [CrossRef]
- Lourenço, G.M.; Soares, G.R.; Santos, T.P.; Dátillo, W.; Freitas, A.V.L.; Ribeiro, S.P. Equal but different: Natural ecotones are dissimilar to anthropic edges. PLoS ONE 2019, 14, e0213008. [Google Scholar] [CrossRef]
- Richter, A.; Mendonça, M.d.S.; Gawlinski, K.; Iserhard, C.A. Microclimatic fluctuation throughout the day influences subtropical fruit-feeding butterfly assemblages between the canopy and understory. Diversity 2023, 15, 560. [Google Scholar] [CrossRef]
- Ribeiro, M.C.; Martensen, A.C.; Metzger, J.P.; Tabarelli, M.; Scarano, F.R.; Fortin, M. The Brazilian Atlantic Forest: A Shrinking Biodiversity Hotspot. In Biodiversity Hotspots: Distribution and Protection of Conservation Priority Areas, 1st ed.; Zachos, F.E., Habel, J.C., Eds.; Springer: Berlin/Heidelberg, Germany, 2011; pp. 405–434. [Google Scholar]
- Martensen, A.C.; Pimentel, R.G.; Metzger, J.P. Relative effects of fragment size and connectivity on bird community in the Atlantic Rain Forest: Implications for conservation. Biol. Conserv. 2008, 141, 2184–2192. [Google Scholar] [CrossRef]
- Ribeiro, D.B.; Prado, P.I.; Brown, K.S., Jr.; Freitas, A.V.L. Temporal Diversity Patterns and Phenology in Fruit-feeding Butterflies in the Atlantic Forest. Biotropica 2010, 42, 710–716. [Google Scholar] [CrossRef]
- Brown, K.S. Borboletas da Serra do Japi: Diversidade, hábitats, recursos alimentares e variação temporal. In História Natural da Serra do Japi: Ecologia e Preservação de Uma Área Florestal No Sudeste do Brasil; Morellato, P., Ed.; Editora da UNICAMP: Campinas, Brazil, 1992; pp. 142–187. [Google Scholar]
- Beccaloni, G.W.; Hall, S.K.; Viloria, A.L.; Robinson, G.S. Catalogue of the hostplants of the Neotropical Butterflies/Catálogo de las plantas huésped de las mariposas Neotropicales. In RIBES-CYTED; Monografias, T.M., Zaragoza, S.E.A., Eds.; The Natural History Museum, Instituto Venezolano de Investigaciones Científicas: Zaragosa, Spain, 2008; Volume 8, 536p. [Google Scholar]
- McKinney, M.L.; Lockwood, J.L. Biotic homogenization: A few winners replacing many losers in the next mass extinction. Trends Ecol. Evol. 1999, 14, 450–453. [Google Scholar] [CrossRef]


| Predictors | Estimate | SE | Z | p Value |
|---|---|---|---|---|
| (Intercept) | 4.1742 | 0.1836 | 22.7 | <0.001 |
| Understory | −0.3483 | 0.1088 | −3.2 | 0.001 |
| Month—February | 0.2463 | 0.0934 | 2.6 | 0.008 |
| Month—March | −0.6931 | 0.1212 | −5.7 | <0.001 |
| Month—April | −1.4060 | 0.1577 | −8.91 | <0.001 |
| Month—May | −0.7963 | 0.1255 | −6.3 | <0.001 |
| Month—June | −0.8992 | 0.1301 | −6.9 | <0.001 |
| Month—July | −0.3074 | 0.1075 | −2.8 | 0.004 |
| Month—August | −2.2270 | 0.2243 | −9.9 | <0.001 |
| Month—September | 0.1583 | 0.0953 | 1.6 | 0.096 |
| Month—October | −0.2492 | 0.1057 | −2.3 | 0.018 |
| Month—November | 0.6088 | 0.0869 | 6.9 | <0.001 |
| Month—December | 0.8087 | 0.0841 | 9.6 | <0.001 |
| Understory: February | 0.8452 | 0.1341 | 6.2 | <0.001 |
| Understory: March | 0.8353 | 0.1663 | 5.0 | <0.001 |
| Understory: April | 0.8307 | 0.2101 | 3.9 | <0.001 |
| Understory: May | 0.6706 | 0.1748 | 3.8 | <0.001 |
| Understory: June | −0.7032 | 0.2415 | −2.9 | 0.003 |
| Understory: July | 0.0290 | 0.1663 | 0.1 | 0.861 |
| Understory: August | 1.0184 | 0.2837 | 3.5 | <0.001 |
| Understory: September | 1.0703 | 0.1343 | 7.9 | <0.001 |
| Understory: October | 0.4033 | 0.1551 | 2.5 | 0.009 |
| Understory: November | 0.9580 | 0.1263 | 7.5 | <0.001 |
| Understory: December | 0.6671 | 0.1249 | 5.3 | <0.001 |
| Species | Vertical Strata | Specificity | Fidelity | IndVal | p Value |
|---|---|---|---|---|---|
| Archaeoprepona demophon | Understory | 0.867 | 0.875 | 0.844 | 0.001 |
| Callicore sorana | Canopy | 0.400 | 1.000 | 0.632 | 0.026 |
| Catoblepia berecynthia | Understory | 0.533 | 0.933 | 0.706 | 0.008 |
| Eunica maja | Understory | 1.000 | 0.905 | 0.951 | 0.001 |
| Haematera pyrame | Canopy | 0.333 | 1.000 | 0.577 | 0.038 |
| Hamadryas chloe | Understory | 0.933 | 1.000 | 0.966 | 0.001 |
| Hamadryas februa | Understory | 0.666 | 1.000 | 0.816 | 0.002 |
| Pareuptychia ocirrhoe | Understory | 0.333 | 1.000 | 0.577 | 0.033 |
| Taygetis laches | Understory | 0.666 | 0.958 | 0.799 | 0.002 |
| Taygetis rufomarginata | Understory | 0.333 | 1.000 | 0.577 | 0.048 |
Disclaimer/Publisher’s Note: The statements, opinions and data contained in all publications are solely those of the individual author(s) and contributor(s) and not of MDPI and/or the editor(s). MDPI and/or the editor(s) disclaim responsibility for any injury to people or property resulting from any ideas, methods, instructions or products referred to in the content. |
© 2024 by the authors. Licensee MDPI, Basel, Switzerland. This article is an open access article distributed under the terms and conditions of the Creative Commons Attribution (CC BY) license (https://creativecommons.org/licenses/by/4.0/).
Share and Cite
Silva, D.B.; Freitas, A.V.L.; Junior, O.F.; Santos, J.P. Vertical Stratification of Butterfly Assemblages Persists in Highly Disturbed Forest Fragments of the Brazilian Atlantic Forest. Diversity 2024, 16, 608. https://doi.org/10.3390/d16100608
Silva DB, Freitas AVL, Junior OF, Santos JP. Vertical Stratification of Butterfly Assemblages Persists in Highly Disturbed Forest Fragments of the Brazilian Atlantic Forest. Diversity. 2024; 16(10):608. https://doi.org/10.3390/d16100608
Chicago/Turabian StyleSilva, Denise B., André V. L. Freitas, Oscar F. Junior, and Jessie P. Santos. 2024. "Vertical Stratification of Butterfly Assemblages Persists in Highly Disturbed Forest Fragments of the Brazilian Atlantic Forest" Diversity 16, no. 10: 608. https://doi.org/10.3390/d16100608