Article

Exploring the Diversity and Ancestry of Fine-Aroma Cacao from Tumaco, Colombia

by
Paola Delgadillo-Duran
1,
Jhon A. Berdugo-Cely
1,
Julián Mejía-Salazar
2,
José Ives Pérez-Zúñiga
3 and
Roxana Yockteng
1,4,*
1
Centro de Investigación Tibaitatá, Corporación Colombiana de Investigación Agropecuaria (AGROSAVIA), Km 14 vía Mosquera, Cundinamarca 250047, Colombia
2
Facultad Ciencias Agropecuarias, Universidad Nacional de Colombia, Sede Palmira 763532, Colombia
3
Centro de Investigación El Mira, Corporación Colombiana de Investigación Agropecuaria (AGROSAVIA), Km 38 vía Tumaco, Nariño 528517, Colombia
4
Institut de Systématique, Evolution, Biodiversité-UMR-CNRS 7205, National Museum of Natural History, 75005 Paris, France
*
Author to whom correspondence should be addressed.
Diversity 2024, 16(12), 754; https://doi.org/10.3390/d16120754
Submission received: 7 November 2024 / Revised: 3 December 2024 / Accepted: 5 December 2024 / Published: 12 December 2024
(This article belongs to the Section Plant Diversity)

Abstract

:
The cacao plant, Theobroma cacao, is economically significant, as its beans are essential for chocolate production. Cacao from Tumaco on Colombia’s Pacific coast is renowned for its distinct flavor and aroma, accessing specialty markets. However, production challenges include low yields, inconsistent post-harvest practices, and limited knowledge of local genotypes. To tackle these issues, a research project genetically characterized 25 Tumaco landraces, establishing their phylogenetic relationships using reduced representation libraries (RRL). The analysis yielded 359,950 single nucleotide polymorphisms (SNPs) for Tumaco and identified 38,812 SNPs in common with Colombian National Germplasm Bank genotypes and reference groups. Genetic structure analysis divided Tumaco samples into nine populations, revealing admixtures primarily from the Nacional, Iquitos, Amelonado, and Criollo groups. Some Tumaco samples showed predominant ancestry from the Iquitos group, while others leaned towards the Nacional type, with limited Criollo and Contamana ancestry. No Tumaco landrace exhibited complete ancestry from a single group, suggesting a hybrid origin. These insights into Tumaco’s genetic diversity and structure are essential for improving landraces in Colombia’s Pacific region, contributing to the genetic enhancement of cacao.

1. Introduction

Theobroma cacao L. is a perennial plant belonging to the Malvaceae family, originally found in the Amazon region near the Napo, Caquetá, and Putumayo rivers. It later spread to southern Mexico via trade routes established by Indigenous civilizations [1]. This tropical tree thrives in hot and humid climates with temperatures between 24–30 °C, limiting its cultivation to the humid tropical region between 18° north and 20° south of the equator [2]. This species is not only vital for the production of chocolate but also for creating cocoa liquor, cocoa butter, cocoa powder, and various cosmetic and pharmaceutical products. In Colombia, cacao cultivation holds significant socioeconomic importance, involving about 40,000 producing families and generating approximately 82,000 direct jobs, with an annual production of 47,000 tons of beans [3]. Cacao is grown in most departments of Colombia, including Nariño, where it is primarily cultivated along the Pacific coast in the municipality of Tumaco. Nariño cacao is renowned for its unique taste and aroma [3]. Premium cocoas from this region are sold at higher prices, accounting for 5% of the global supply, as they are highly sought after internationally for their superior characteristics, making them ideal for premium products. Unlike other regions in the country, cacao cultivated in Nariño is mostly derived from regional plant materials. Farmers in the area have developed their selection processes over recent years, allowing them to cultivate varieties with excellent organoleptic qualities and high production yields [4,5].
Nariño confronts challenges that hinder the development of this productive chain such as low productivity, deterioration of the organoleptic quality of the bean during the post-harvest process, and a lack of both phenotypic and genetic knowledge regarding regional materials [6,7]. Research related to these issues is rare, but some advances have been made in the morpho-agronomic characterization of regional cacao genotypes and the evaluation of agroforestry arrangements for tropical humid forest conditions [6,8]. However, these efforts are incomplete, and the results have not been methodologically validated.
The cacao from Tumaco (Nariño) has been recognized for its exceptional organoleptic characteristics [9]. However, the introduction of commercial cacao genotypes could negatively impact the quality of regional varieties. In Colombia, the use of recurrent selection is quite widespread, and CCN-51 is widely used; thus, hybridization with Tumaco genotypes is possible [10]. The erosion of cocoa quality due to hybridization with materials such as the CCN-51 clone is a complex issue that affects both cacao production and the reputation of traditional cacao-growing regions. This phenomenon is driven by several inherent characteristics of CCN-51, which, while popular for its high productivity and resistance to diseases, has significant drawbacks in terms of flavor profile, complexity, and market value when compared to fine cocoa varieties like Ecuadorian Nacional or Criollo. The widespread use of certain genotypes, such as CCN-51, in monocultures has resulted in a considerable loss of biodiversity in these growing regions. The introduction of this clone displaces other genetically diverse varieties that boast unique flavor profiles and a historical connection to traditional cultivation practices. This loss of genetic diversity not only limits the range of flavors and quality available in cocoa but also undermines genetic resistance to future pests and diseases, leading to the homogenization of the crop [11,12].
A previous study of Tumaco cacao trees demonstrated significant morphological variability, particularly in the number of beans per pod, bean dry weight, and leaf size. Additionally, some trees exhibited tolerance to diseases caused by Moniliophthora roreri and M. perniciosa [8]. This diversity can be leveraged in breeding programs to develop cacao varieties that are well-adapted to the region, while maintaining quality.
The research conducted so far focuses on unraveling the genetic diversity of materials in germplasm collections from various geographic origins. Molecular markers such as SSRs [13,14] and next-generation techniques such as GBS (genotyping by sequencing) or RRL (reduced representation libraries) [15,16,17] have been employed to achieve this. Two independent studies have delved into characterizing 95 and 165 genotypes from germplasm banks, including genotypes from Tumaco, using randomly amplified microsatellite markers (RAMs) and microsatellites (SSRs), revealing rich genetics in the analyzed populations [18,19]. These molecular evaluations aimed to identify genetic diversity, determine redundancy in collections, and develop molecular markers for selecting plants with outstanding agronomic characteristics [16].
Theobroma cacao is divided into distinct genetic groups that reflect its complex evolutionary history and domestication across tropical America [20]. The diversity within the species has led to the identification of various genetic groups, which are distributed throughout regions in tropical America [14,15,20,21,22,23]. Motamayor et al. [20] were the first to describe ten cacao genetic groups, primarily distributed along the Amazonian region, capturing the genetic richness of the species. These genetic groups contribute significantly to cacao’s genetic variability and are essential for breeding programs focused on enhancing traits such as flavor, disease resistance, and adaptability to different ecosystems [20]. The diversity within these groups provides a valuable foundation for selecting and developing cacao varieties that meet the needs of both farmers and consumers.
Agrosavia’s Cacao Germplasm Bank plays a crucial role in preserving Colombia’s cacao diversity. The bank conserved cacao genotypes from various Colombian regions and different genetic groups, including those with unique qualities, such as Tumaco. Conserved genotypes are genetically diverse and have varied flavor profiles, disease resistances, and adaptive traits. By maintaining cacao’s genetic diversity, the germplasm bank ensures that breeders and researchers have access to essential resources for developing improved cacao varieties which are better adapted to regional conditions, consumer preferences, and sustainable production [10,15,16].
The genetic characterization of regional landraces has been overlooked, limiting the selection of materials with desirable market characteristics. With the recent surge in next-generation genetic technologies, there is a growing demand for obtaining genomic characterization of superior quality at a lower cost. These high-throughput sequencing techniques accelerate the selection processes of individuals with agronomic traits of interest by allowing the identification of molecular markers associated with phenotypes of interest [24].
Reduced representation libraries (RRL) are widely used in plant genomics, as they allow researchers to capture a subset of the genome, making the sequencing process more efficient and cost-effective than whole-genome sequencing [25]. By focusing on specific genomic regions, RRLs capture significant genetic variation, particularly single nucleotide polymorphisms (SNPs), which are key to understanding genetic diversity. This approach is beneficial for plants with large genomes for which full sequencing would be prohibitively expensive and complex [26]. RRLs enable the precise identification of genetic markers linked to traits of interest, which aids in the assessment of genetic structure, phylogenetic relationships, and population diversity [27]. Additionally, RRLs are flexible, allowing researchers to tailor the regions sequenced according to project objectives, making this technique especially useful for genotyping diverse plant populations in a targeted and manageable way.
Therefore, our current work is dedicated to genetically characterizing 25 landraces from Tumaco in Nariño, Colombia, and establishing their phylogenetic relationship with accessions from characterized germplasm banks to assess their origin using high-throughput sequencing of RRL. The genetic insights gained from this study will play a crucial role in guiding the agronomic evaluation of the Tumaco genotypes.

2. Materials and Methods

2.1. Plant Material and DNA Extraction

Leaf samples from 29 genotypes of Theobroma cacao were collected from the two municipalities of Tumaco and Cumbitara of the department of Nariño in Colombia (Figure 1, Table S1) and sent to the molecular biology laboratory located at the research center CI Tibaitatá (4°41′45″ N–74°12′12″ W) of Agrosavia. A total of 25 genotypes comprised Tumaco landraces, and four well-known commercial genotypes (CCN-51, IMC-67, TCS-1, and ICS-95) were used as control genotypes.
Genomic DNA was isolated from 100 mg of young leaves collected from each genotype using a DNeasy Plant Mini Kit (QIAGEN, Hilden, Germany), according to the manufacturer’s instructions. The quality of the DNA was verified by electrophoresis on 1% agarose gel, and the concentration was estimated using Nanodrop 2000 (Thermo Scientific, Wilmington, NC, USA) and Qubit Fluorometer v2.0 (Invitrogen, Life Technologies, Carlsbad, CA, USA).

2.2. Reduced Representation Library (RRL) Preparation and Sequencing

A total of 500 ng of DNA of each genotype was used for constructing the libraries. The libraries were built following the protocol reported by Osorio-Guarín et al. [28]. In summary, the DNA was digested using the enzymes BsaXI ((N)9AC(N)5CTCC(N)10) (New England Biolabs, Ipswich, MA, USA) and CspCI ((N)10-11CAA(N)5GTGG(N)12-13) (New England Biolabs, Ipswich, MA, USA) at 37 °C overnight. Subsequently, contaminants, large undigested fragments (>400 bp), and small fragments (<100 bp) were removed using AMPure XP beads. The digested DNA was then utilized for library construction using the NEBNext Ultra DNA Library Prep Kit for Illumina NEB E7370S (New England Biolabs, Ipswich, MA, USA), and the fragments between 200–300 bp were size-selected. Finally, the libraries were quantified using an Agilent 4200 tape station to determine fragment length distribution. Pooled barcoded samples were paired-end sequenced on an Illumina HiSeq X ten (Macrogen Korea, Seoul, Republic of Korea). The raw data sequences were deposited in the Sequence Read Archive (SRA) in the National Center for Biotechnology Information (NCBI) database under the BioProject ID PRJNA1180628.

2.3. Data Processing and Sequencing Analysis

To discover single nucleotide polymorphisms (SNPs) identification among the Tumaco genotypes, we followed the pipeline outlined by Osorio-Guarín et al. [16]. In summary, we used FastQC software [29] for quality control and Trim Galore v0.5.0 software [30] to check the sequencing quality and clean the sequences, respectively. For trimming, the Illumina adapter primers, sequences with a quality of less than Q30 and sequences with a length of less than 50 bp were removed. The trimmed sequences were then aligned to the cacao Criollo reference genome v2 [31] using BWA v0.17.0 software [32]. Subsequently, the genome analysis toolkit (GATK) v3.8.1 [33] and Picard [34] software were used for local realignment, base quality recalibration, and removal of PCR duplicates. We then employed VCFtools software [35] and filtered the SNP variants as follows: SNP markers with a minimum allele frequency (MAF) of 5%, a minimum sequencing depth (SD) of 2X per position, biallelic, and without indels (insertions–deletions), and 10% of missing data were retained. The final SNPs dataset was stored as a variant contact format (vcf) file for the Tumaco population (TP). Two samples were removed due to low-quality sequences; thus, the TP has 27 genotypes.
To compare our genotypes, we used the vcf file generated previously by Osorio-Guarín et al. [16], from which we included 215 genotypes from the Colombian National Germplasm Bank (BGV), managed by Agrosavia. We also used a vcf of 53 genotypes (RP) from the study of Cornejo et al. [36], representing the ten recognized cacao genetic groups (Criollo, Curaray, Amelonado, Contamana, Maranon, Purus, Nacional, Guiana, Nanay, Iquitos), according to the work of Motamayor et al. [20]. Each vcf file was independently merged with the Tumaco population (TP) vcf file using the BCFtools software [37]. We obtained a second vcf file (A), merging TP with BGV and the reference population (RP). From the BGV, we selected a subset (BGVss) of 26 accessions collected from the Pacific region and 19 accessions with a high ancestry to a reference group, along with the RP and TP genotypes, to form Dataset B. Finally, the vcf C was obtained by merging the RP with TP (Table 1). These three files were used for downstream analysis.

2.4. Population Structure, Genetic Diversity, and Maximum Likelihood Phylogenetic Reconstruction Analyses

To infer the population structure of Tumaco landraces (TP), we utilized FastStructure V1.0 software. We conducted two analyses: in the first analysis, we included the Tumaco genotypes, along with the BGV and RP genotypes (Dataset A). In the second analysis, we filtered the BGV samples, retaining only those from the Colombian Pacific Region with a known origin, alongside some samples with a strong ancestry to reference genetic groups (Dataset B).
For both analyses, the number of subpopulations was determined using the choose.k option in FastStructure. Each sample was assigned to a specific population based on a threshold of 0.60; samples below this threshold were classified as admixtures. The results from FastStructure were visualized in a bar plot using the R-Pophelper package [38]. We also performed principal component analyses (PCA) for both datasets using PLINK software, version 1.9 [39]. The results from FastStructure were visualized in a bar plot using the R-Pophelper package, with the PCA plots visualized through the ggplot2 package in R software [40].
Additionally, we conducted a supervised ancestry analysis of the Tumaco samples (TP) using ADMIXTURE software, version 1.3.0 [41]. In this analysis, we ran the software in supervised mode, utilizing reference genotypes (RP) as reference populations (Dataset C). The assignment of genotypes to specific populations was carried out in a similar manner to the strategy used in FastStructure, with the results represented in bar plots visualized using the R-Pophelper package [38]. To compare the Tumaco landraces (TP) with the reference population (RP), we performed an analysis of molecular variance (AMOVA) using the R-poppr package [42]. In this analysis, we excluded the control genotypes (21_CCN51 22_IMC67 23_ICS95, 24_TCS-01).
To measure genetic differentiation between the TP and RP populations, we calculated pairwise Fst values using the R-dartR package [43]. To estimate genetic diversity, we assessed the observed heterozygosity (Ho) for each TP genotype. We also calculated the expected heterozygosity (He) and Ho for the TP and RP populations by employing the R-SNPready package [44].
For each dataset (A, B, and C), we carried out phylogenetic analyses using the maximum likelihood (ML) method in IQ-tree software [45]. Node support was evaluated through a bootstrap analysis with 1000 replicates.

3. Results

3.1. SNP Data

Reduced representation libraries (RRL) were produced for 29 Tumaco samples and sequenced in an Illumina system, producing a total of 5.9 GB raw reads (Table S1). We excluded from the analysis the 15-SO-1 samples from Cumbitara Municipality and 31-Rio Mira because they displayed a large amount of missing data and low-quality reads. After filtering, we obtained 359,590 SNPs in the Tumaco population (TP). The number of SNPs was significantly reduced when we mixed the BGV population and the Tumaco landraces (Dataset A); only 38,812 SNPs were recovered. Dataset B, with TP, RP, and BGVss, had 161,394 SNPs. In Dataset C (TP and RP), we recovered 1,359,540 SNPs (Table 1).

3.2. Analyses Using the Germplasm Data and Reference Populations (Dataset A)

FastSTRUCTURE software was used to analyze the genetic structure of the Tumaco landraces with germplasm accession and genotypes of the reference populations. The analysis categorized the data into nine populations. Only six cacao genetic groups were identified: Nanay, Contamana, Iquitos, Criollo, Nacional, and Amelonado (Figure S1). The populations of Marañon and Guianna were mixed into one population. In this analysis, we recovered the new population named Caqueta in the studies of Fouet et al. [46] and Argout et al. [47]. The Curaray genotypes did not form a population, but they appeared with a mix of ancestry belonging to the Caqueta and Nacional groups.
Based on this first analysis, the Tumaco materials are essentially hybrids, with no pure ancestry from any population (Figure S1). Tumaco landraces exhibit mixed ancestry related to the Nacional, Iquitos, Amelonado, Criollo, and Contamana reference groups.
In contrast to the structure analysis, the phylogenetic analysis recovered most of the reference groups; they formed clades with supported nodes (Figure S2). The only group that did not form a clade was Marañon, which forms a polytomy with the Guianna population. The Tumaco landraces did not conform to a clade; they displayed a distribution in different branches of the phylogenetic tree (Figure S2), with more genotypes related to the Nacional group.

3.3. Analysis Using Pacific Accessions from the Colombian Germplasm Bank (Dataset B)

Twenty-six accessions collected from the Colombian Pacific Region from the BGV were selected in Dataset B to specifically determine whether the Tumaco landraces cluster with other genotypes from the same area.
Using the FastStructure program, we conducted a new analysis to examine the genetic structure of Dataset B. This analysis identified only seven reference populations (Figure 2). Notably, the Nanay population did not form a distinct group; instead, it showed characteristics of admixture between the Iquitos and Amelonado groups. Furthermore, the Purus genetic group was not recovered, appearing instead as a hybrid of the Iquitos, Marañon, and Contamana groups, with a minor contribution from Criollo. Regarding the Tumaco genotypes, the analysis revealed the same genetic structure as that found in the previous admixture analysis, characterized primarily by admixtures of the Nacional, Iquitos, Amelonado, and Criollo groups. Only one genotype exhibited genetic contributions from the Marañon group. In terms of the BGV accessions sampled from the Colombian Pacific Region, most followed a similar genetic structure to that of the Tumaco genotypes. Two specific genotypes (830745 and 830752) showed some genetic influence from the Marañon group. Additionally, five genotypes displayed more than 70% Amelonado genetic load, in which genotype 840778 exhibited a 100% ancestry from this group. Genotypes 830740 and 830710 exhibited an over 70% ancestry from the Criollo group. This analysis indicates that genotypes from the Colombian Pacific Region do not form a distinct genetic group.
The PCA results align with the genetic structure analysis (Figure S3). Neither the Tumaco genotypes nor the bank accessions collected in the Pacific Region form a distinct cluster (Figure S3); instead, they are randomly distributed among the reference populations.
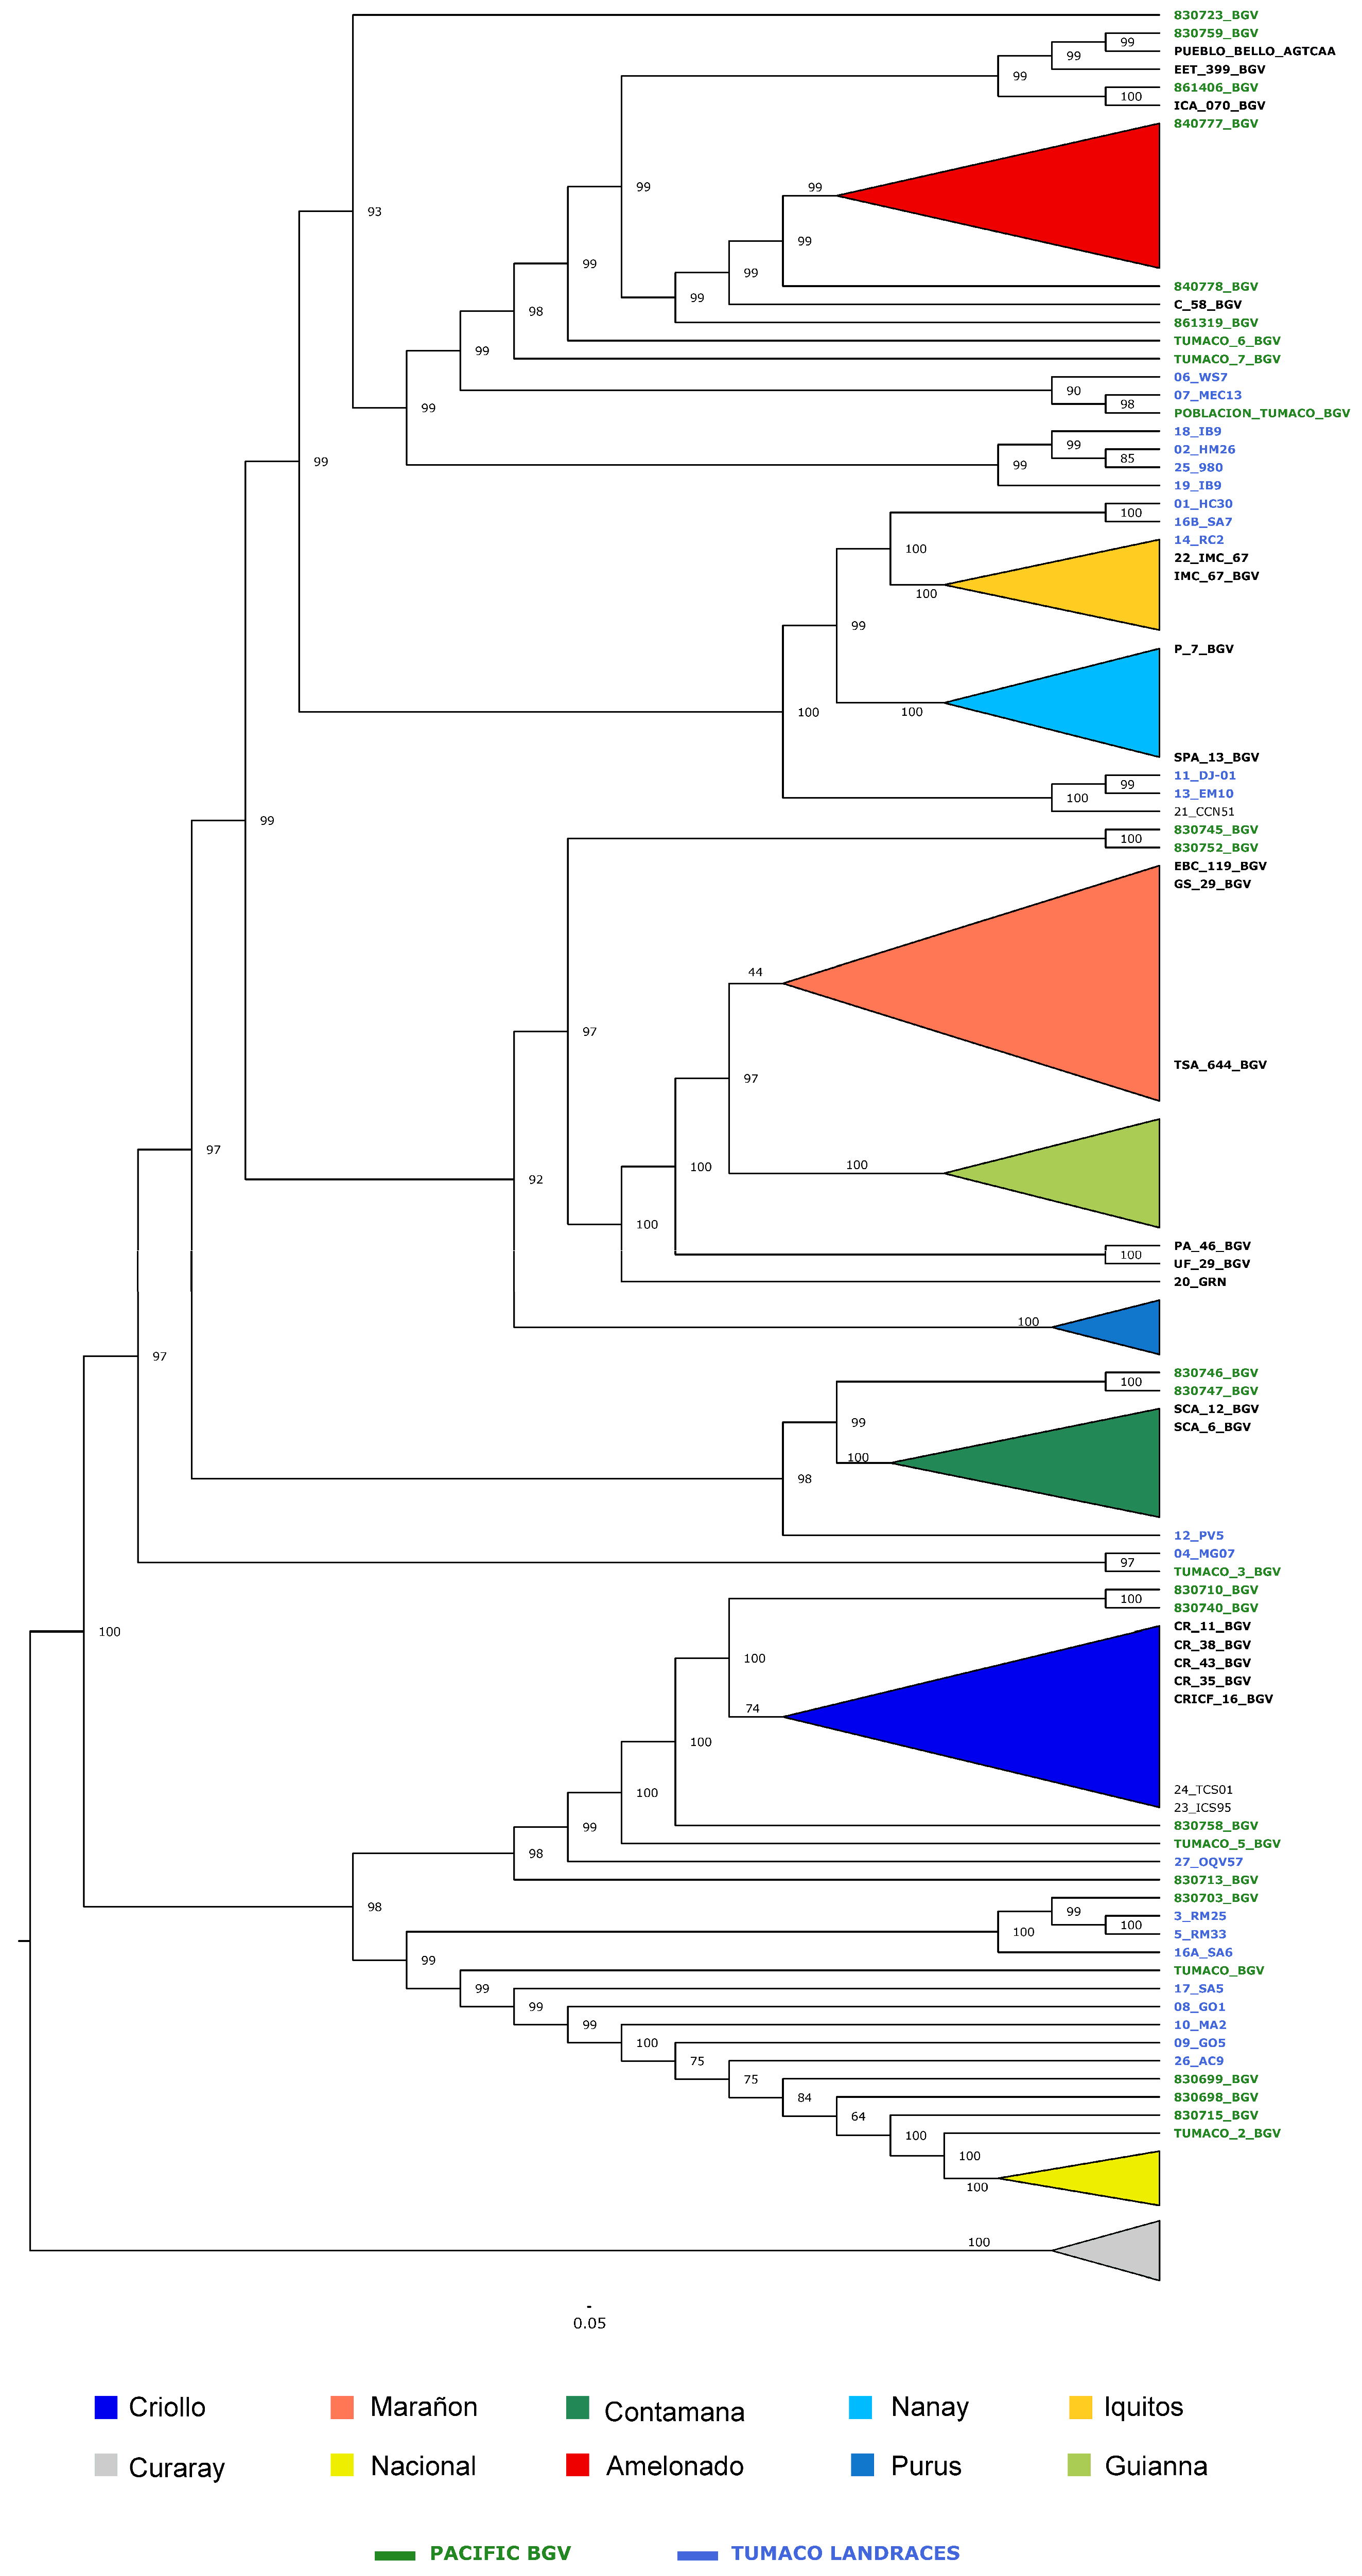
The topology of the phylogenetic tree showed ten clades corresponding to cacao reference populations supported by bootstrap values, except for the Marañon population, which had a low bootstrap support (44%) (Figure 3). In contrast to the genetic structure analysis, all ten genetic cacao populations were recovered in the phylogenetic tree. As for the Tumaco and Pacific BGV genotypes, they did not conform to a clade; instead, they were distributed throughout the phylogenetic tree in congruence with the genetic structure analysis. The different analyses are congruent, indicating that neither the Tumaco genotypes alone nor in conjunction with other genotypes from the Colombian Pacific Region constitute a unique genetic group. Rather, they appear to be admixture genotypes that exhibit characteristics from various cacao genetic groups.

3.4. Analysis with the Reference Cacao Genetic Groups (Dataset C)

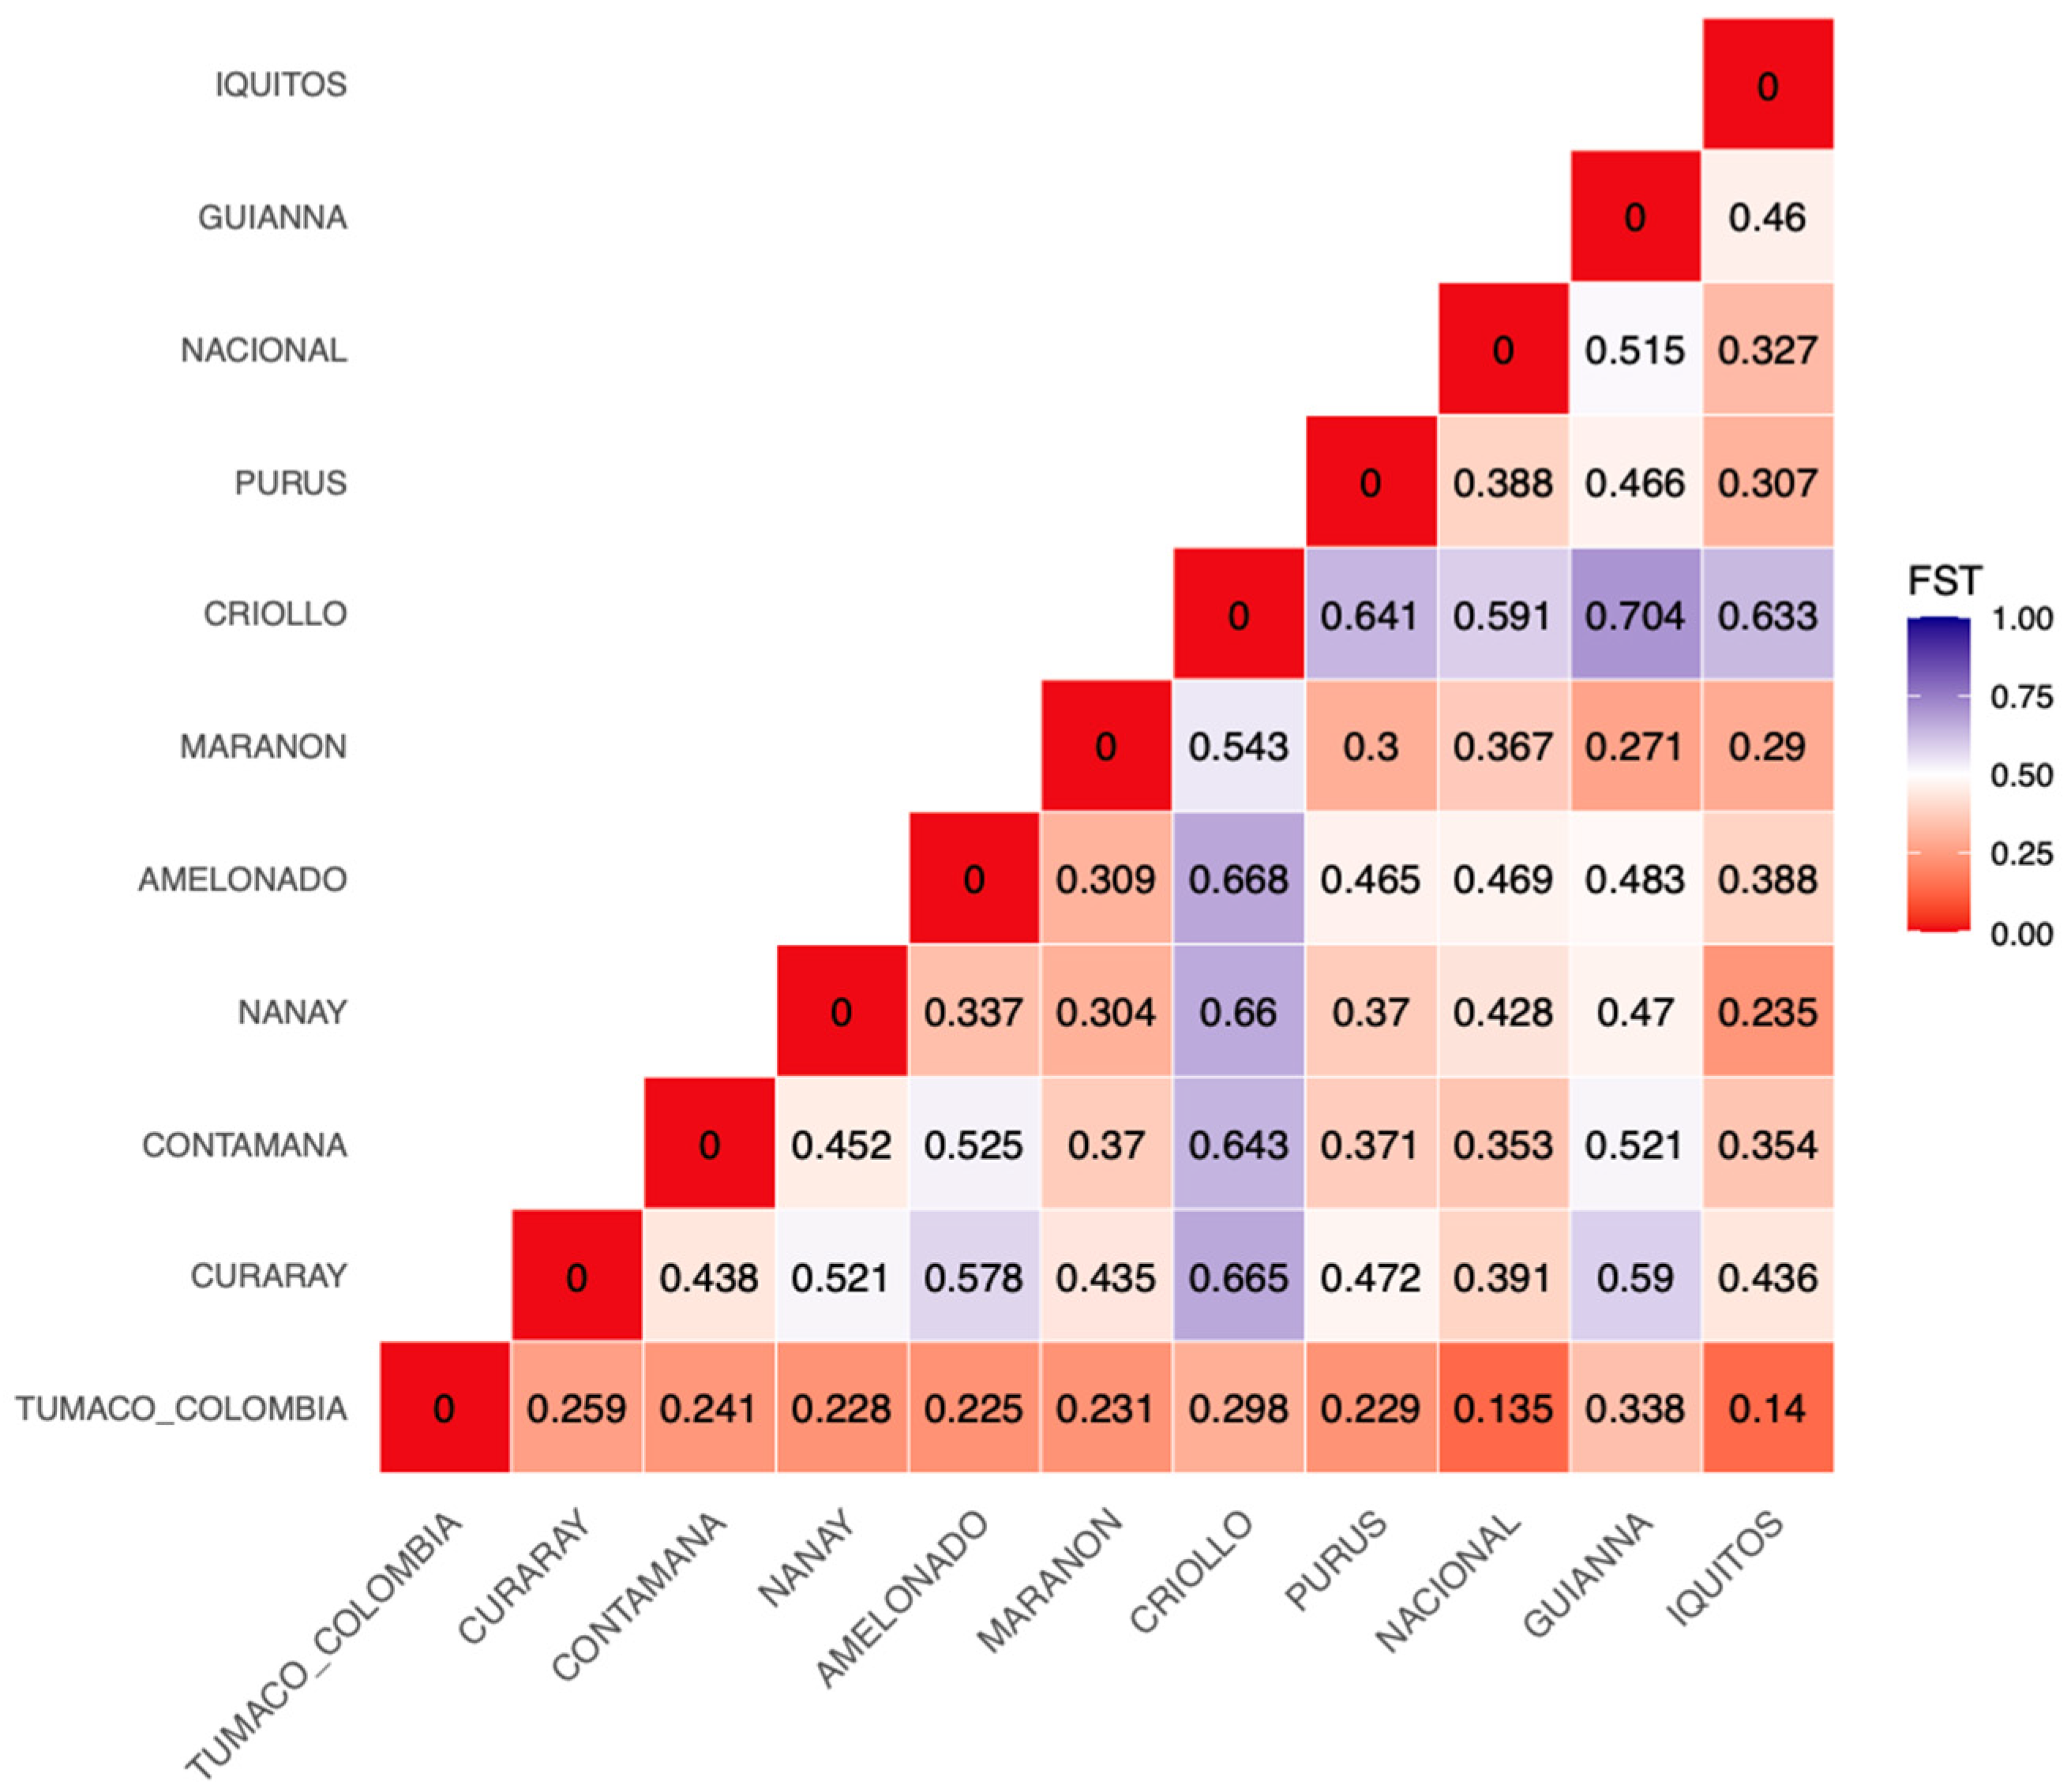
Genetic differentiation between the Tumaco landraces and the reference populations was significant (p = 0.001). The FST values ranged from 0.135 to 0.338 (Figure 4). The FST analysis indicated that the Tumaco landraces are most closely related to the Nacional genetic group (FST = 0.135), followed by the Iquitos group (FST = 0.14) (Figure 4). In contrast, the Tumaco landraces are more distantly related to the Guiana group. It is also evident that the various groups show differentiation among themselves, with the Criollo genetic group being the most distinct.
The observed (Ho) and expected (He) heterozygosities were calculated for each genetic group. The results indicate that the Criollo group is the most homozygous, with Ho = 0.02, consistent with the results of previous studies [15,20]. In contrast, the Iquitos group exhibits the highest Ho (0.31), which was also reported by Argout et al. [47] (Table 2). This is followed by the Marañon and Nacional groups. TP shows low observed heterozygosity (Ho = 0.15). The values for He were lower than the Ho values, indicating an excess of heterozygotes. In contrast, TP had a moderate He = 0.23, higher than that of Ho, indicating a deficit in heterozygotes.
The individual Ho for each Tumaco genotype reveals similarly low levels, ranging from 0.1 to 0.3 (Table 3). Notably, only genotype 14_RC2 displays moderate observed heterozygosity, due to the genetic contribution from the Iquitos group.

3.4.1. Genetic Structure and PCA with Reference Groups

To analyze the ancestry of the Tumaco landraces more profoundly, we conducted an Admixture analysis using a supervised mode in which the genetic group of each reference sample was indicated. The results supported the results of the previous analysis showing that Tumaco landraces are hybrids or admixtures with ancestry from the Iquitos, Nacional, Amelonado, Criollo, and Contamana genetic groups. The only genotype with complete origin to a particular group is 22_IMC67, one of the control samples considered as a reference genotype of the Iquitos genetic group (Figure 5).
The landraces 01_HC-30, 13_EM10, 16A_SA6, 14_RC2, and 11_DJ-01 have a higher ancestry match to the Iquitos genetic group, especially 01_HC-30, which exhibits a greater than 83% ancestry. These genotypes also have an ancestry match with the Criollo, Amelonado, and Contamana groups (Figure 5).
Genotypes 17_SA5, 10_MA2, 08_GO1, 15_SO1, 16B_SA7, and 09_GO5 had an ancestry match with more than 58% of the Nacional genetic group. They also showed an ascendence to the Criollo and Amelonado groups. Landraces 06_WS7, 27_OQV57, 26_AC9, 19_IB10, 25_980, 07_MEC13, 05_RM33, 03_RM25, 04_MG07 had an ancestry match of more than 40% to the Nacional genetic group, with a mix of Criollo and Amelonado. The genotype 26_AC9 has more than 52% of the ancestry of Criollo.
The genotype 06_WS7 showed a greater ancestry match to Amelonado, with 43%, and a 41% match with the Nacional genetic group. 12_PV5, 16A_SA6, 14_RC2, 09_GO5, 04_MG07 also displayed an ancestry match to the Contamana genetic group but with less than 24%.
The principal component analysis (PCA) regrouped the samples of the reference genetic groups. It also showed similar results to those of the admixture analyses, placing the Tumaco landraces in the middle of the Iquitos, Nacional, Criollo, and Contamana genetic groups (Figure S4). AMOVA results revealed that 54,8% of the variation was between populations, while the remaining 45,6% was within the populations (Table 4). We found that there is a significant difference between populations including the Tumaco population.

3.4.2. Phylogenetic Analysis

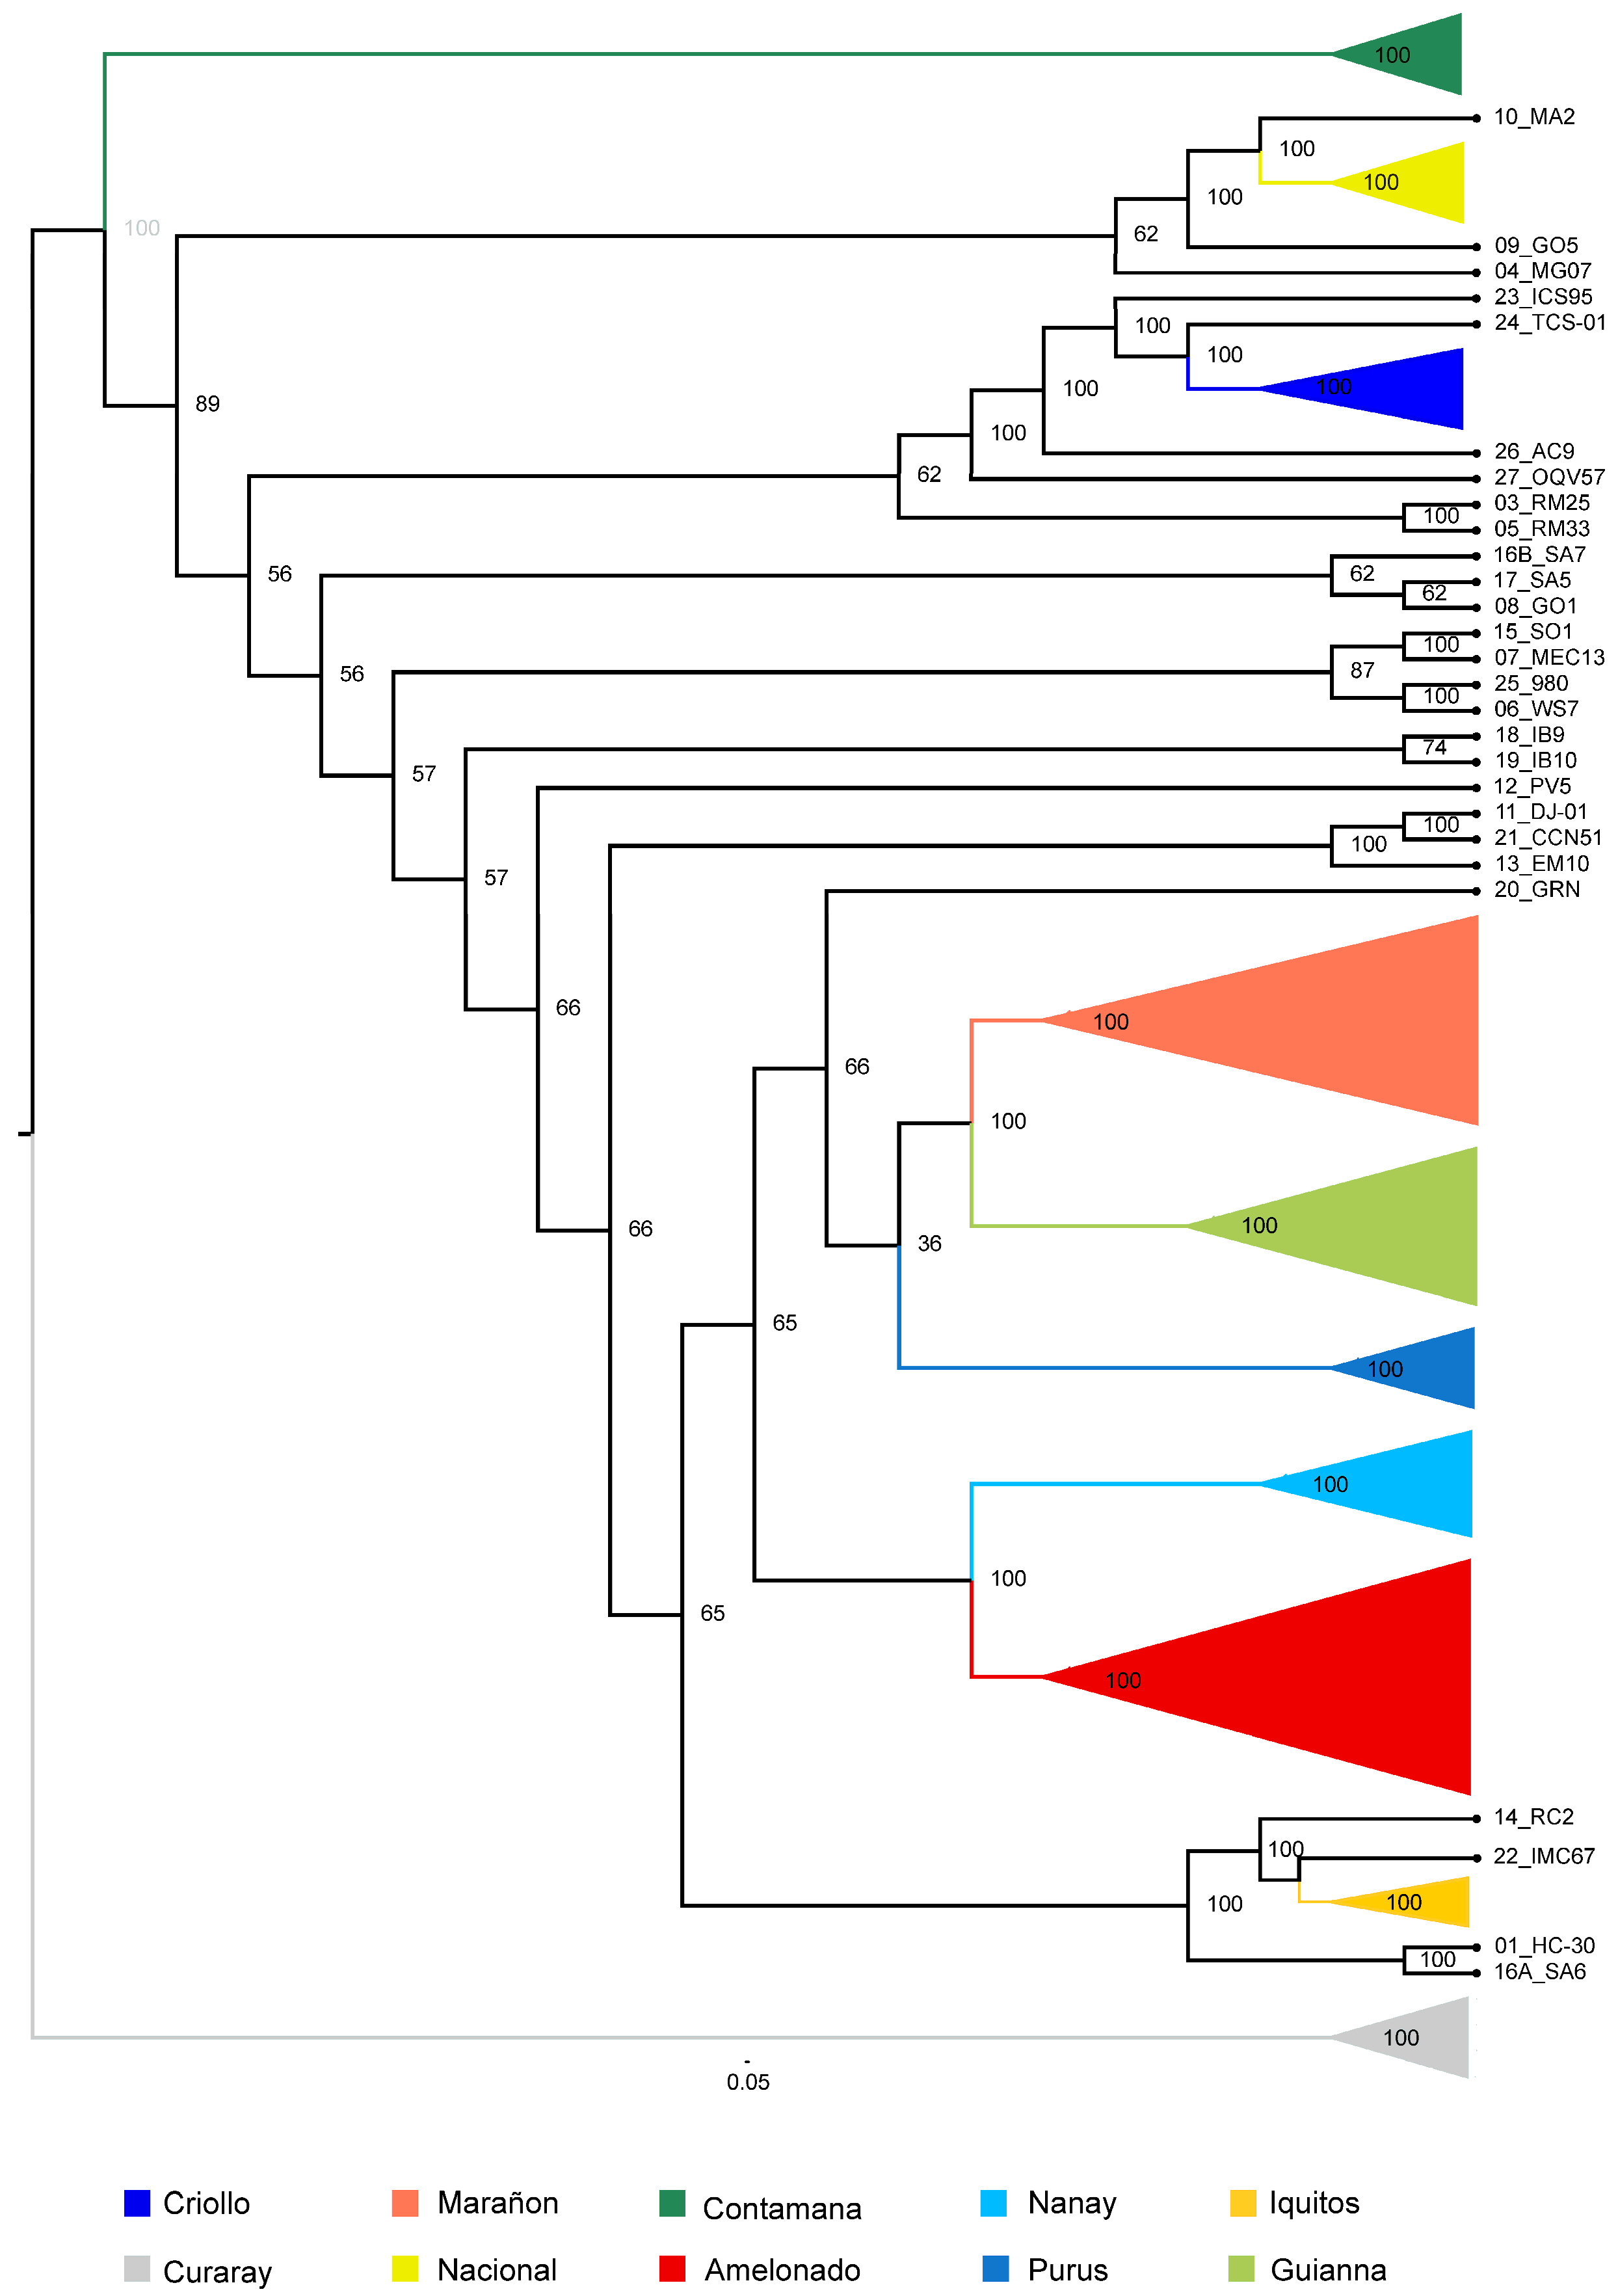
The phylogenetic analysis produced a maximum likelihood tree with high bootstrap support, with all nodes representing genetic reference groups receiving 100% support. The Tumaco landraces exhibited hybrid behavior, as most clustered between clades from the Iquitos, Contamana, Amelonado, Marañon, Purus, and Guiana groups, as well as the clades of Criollo and Nacional (Figure 6).
Genotypes 26_AC9 and 27_OQV57 formed a cluster with the commercial genotypes ICS-95 and TCS-01, which are closely related to the Criollo genetic group. In contrast, genotypes 10_MA2, 09_GO5, and 04_MG07 were more closely related to the Nacional genetic group. Meanwhile, genotypes 14_RC2, 01_HC-30, and 16A_SA6 showed a closer relationship with the Iquitos genetic group. As expected, the control commercial genotype 22_IMC67 was related to the Iquitos genetic group (Figure 6).

4. Discussion

Cocoa produced in Tumaco (Nariño) in the Colombian Pacific Region is regarded as distinct and unique due to its organoleptic attributes, which include fruity and floral tones, as well as a rich chocolate flavor [48]. In recent years, the global cocoa market has offered attractive prices for specialty cocoa. As a result, farmers have increased their use of regional cocoa genotypes, capitalizing on incentives to produce high-quality cocoa for export to specific markets. The Nariño region, particularly the Tumaco municipality, is home to cacao trees that are well-adapted to the tropical rainforest environment and have the aroma of the surrounding ecosystem, which is reflected in its fruits [49]. Furthermore, the high-quality characteristics of this cocoa make it commercially valuable in specialized markets [50].
Cacao trees from the Tumaco region in Southwestern Colombia were genotyped by sequencing RRL, producing a considerable number of SNPs to examine their genetic diversity and ancestry. These genotypes were selected from the work of Perez-Zuñiga et al. [51], who characterized trees on local farms and found outstanding cacao genotypes producing up to 199 healthy fruits per year and 50 beans per fruit. These genotypes showed a low disease incidence of less than 5%, indicating tolerance to Moniliophthora roreri, which causes frosty pod rot disease, and Phytophthora palmivora, which causes black pod disease. We aimed to characterize the genotypes best suited for local conditions, while also highlighting the distinctiveness of the Tumaco fine-aroma cacao industry. Understanding the genetic diversity and ancestry of cacao in this region is crucial for comprehending its population structure, which can inform decisions regarding conservation and cultivation.
Overall, the analysis indicated that the Tumaco landraces exhibited moderate genetic diversity, reflected in the Ho value of 0.15 and the He of 0.23. The He value is lower than those reported in a previous study of 93 trees from Tumaco (He = 0.28; Morillo et al. [19]). Moreover, our results also showed lower values than those obtained in studies conducted in Dominica (He = 0.320; Gopaulchan et al. [52]), Honduras and Nicaragua (He = 0.367; Lukman et al. [53], and in Chuncho cacao from the La Convención province in southern Peru (He = 0.230; Céspedes-Del Pozo et al. [54]), as well as North Peru (He = 0.323). The He value of TP was higher than that for Ho, indicating a deficit of heterozygotes. This population was analyzed as a whole and probably consists of genetically distinct subgroups, with limited interbreeding [55]. Some genotypes are more closely related to the Nacional group and others to the Iquitos group, supporting the idea that TP has a genetic structure. The Iquitos group exhibits the highest Ho (0.31) (Table 2). This genetic group is characterized by an exceptionally diverse gene content of a hybrid origin [47]. The genotypes of TP showed low observed heterozygosity, indicated by the estimates of individual Ho. This suggests the incidence of inbred individuals in the study and low cross-compatibility among the samples. As suggested by Bustamante et al. [22], samples with low heterozygosity should be evaluated for self-compatibility to obtain pure lines for breeding purposes. Meanwhile, the heterozygous samples should be assessed for vigor, disease resistance, and productivity.
The genetic structure analysis revealed an underlying pattern of mixed types among the Amelonado, Criollo, Nacional, and Iquitos groups, which was supported by phylogenetic and principal component analysis (PCA). However, the AMOVA and FST results indicated a significant distinction between the Tumaco landraces and the reference groups or between geographic locations. The observed range of Fst values (0.135 to 0.338) implies that the genetic structure between the Tumaco population and the reference populations varies, with some populations showing moderate differentiation from the Nacional and Iquitos groups and high differentiation from others, particularly regarding the Guianna group. Variations in Fst may reflect adaptive divergence. Environmental factors like climate and soil type can shape genetic diversity in the Tumaco region, leading to population-specific adaptations [56,57]. The moderate-to-high Fst values observed in TP suggest that it contains unique genetic diversity that may be beneficial for breeding programs, especially for traits like disease resistance and yield. According to Motamayor et al. [20], genetic differentiation in cacao is critical for preserving adaptive traits across different ecological regions. The genetic differentiation observed here is therefore valuable for the selection of parent plants in breeding programs aimed at increasing genetic resilience [56].
Studies such as those by Zhang et al. [58], Céspedes-Del Pozo et al. [54], Thomas et al. [59], and Osorio-Guarin et al. [15] have reported new cacao populations in Bolivia, Peru, and Colombia, respectively. Bustamante et al. [22] argued that these were not real populations. However, Fouet et al. [46], using an SSR approach, recognized the Caqueta population that corresponds to one of the populations identified by Osorio-Guarin et al. [15]. Argout et al. [47], using a pangenomic based on whole genome sequencing, reconstructed fifteen populations in the cacao species, again recovering the Caqueta population. In this pangenomic study, the authors recognized that few genes are unique to a specific genetic group. They highlighted the fact that the boundaries between genetic groups are porous, and multiple instances of hybridization among the genetic groups may have occurred during their natural process of differentiation along the Amazon Basin [47].
Our Tumaco population does not form a new genetic group, as it shares a genetic background with the established reference populations, particularly the Iquitos, Criollo, Nacional, Amelonado, and Contamana groups. The genotypes of the Iquitos, Marañon, Nanay, and Contamana genetic groups are commonly utilized in breeding programs as sources of disease resistance [60]. Genotypes of those genetic groups were collected by F.J. Pound between 1937 and 1942, primarily to obtain materials resistant to witches’ broom disease, which is caused by Moniliophthora perniciosa (formerly Crinipellis perniciosa) [61,62,63]. The ancestry matches of Tumaco landraces to the Criollo group is noteworthy because Criollo was the main type of cacao cultivated in Colombia until 1885 [10].
The Tumaco population presents more ancestry matches to the Nacional and Iquitos genetic groups. The unique flavor of Tumaco genotypes probably came from its ancestry from the Nacional population. The Nacional genetic group is often referred to as a “fine-flavor” cacao because of its distinctive fine-flavor profile, often described as floral or fruity, with complex aroma notes, making it highly valued in specialty chocolate markets [12,64,65]. This group has a long history of cultivation in Ecuador, where it has become culturally and economically significant. Moreover, Tumaco landraces can be inherited from Iquitos alleles valuable for breeding programs aimed at improving disease resistance and climate adaptability [54]. The Iquitos cacao genetic group, found in the western Amazon Basin, especially in Peru and parts of Brazil, represents an important reservoir of genetic diversity within the species Theobroma cacao [20]. Unlike the Nacional group, Iquitos is less recognized in international markets but holds significant potential for breeding programs due to its adaptation to tropical rainforests and its resilience to environmental stressors [14]. This group is thought to have contributed to the genetic base of several hybrid populations, and its genetic material has been used in developing more resilient and productive cacao cultivars [54].
The hybrid nature of Tumaco landraces is explained because they likely emerged during the early stages of agriculture. This period saw frequent interactions between the human populations of Amazonia and the Pacific coast, which contributed to the domestication of T. cacao [66]. Lanaud et al. [66] discovered that cacao populations located far from each other began to hybridize as early as the Middle Holocene period, driven by human activity. This hybridization favored the adaptation of T. cacao to new environments.
These results encourage additional studies on the ecological and geographical factors that may be driving the genetic structure in cacao from the Tumaco region. Identifying these factors can inform conservation and sustainable use strategies for cacao, as well as other plant species facing similar pressures [56].

5. Conclusions

A research initiative was conducted to genetically characterize 25 landraces of cacao cultivated in the Tumaco region and to establish their phylogenetic relationships. This study underscores that the unique genetic profile and flavor qualities of cacao from Tumaco, located in Southwestern Colombia, stem from the moderate genetic diversity observed in Tumaco cacao. This diversity reflects its hybrid ancestry, which includes several prominent cacao genetic groups, i.e., Nacional, Iquitos, Amelonado, Contamana, and Criollo. This hybrid nature is likely a result of historical interactions and hybridization events between human populations in the Amazon Basin and the Pacific coast, which have favored adaptation to local environments.
Tumaco cacao does not form a genetically distinct population; rather, it shares its genetic foundation with established reference groups. This genetic overlap with other populations used in breeding programs, particularly for disease resistance and quality characteristics, highlights the potential of Tumaco cacao as a valuable genetic resource for broader cacao improvement efforts. Further exploration and characterization of cacao in Tumaco are essential to leverage its genetic diversity and enhance sustainable cacao production in Colombia.
This study provides valuable information about Tumaco landraces, promoting the evaluation of the genetic resources of local cacao and guiding the selection of new planting materials for cacao plantations in Colombia, particularly in the Tumaco region. In the context of international ex situ conservation, the cacao from Tumaco offers potential new genetic variations that could benefit cacao improvement programs.

Supplementary Materials

The following supporting information can be downloaded at: https://www.mdpi.com/article/10.3390/d16120754/s1, Figure S1: Bar plot of the structure population analysis of the TP, RP, and BGV genotypes (Dataset A) conducted in FastStructure software resulted in nine populations; Figure S2: Maximum likelihood phylogenetic chart showing the relationship between TP, RP, and BGV genotypes (Dataset A). The number in nodes indicates the bootstrap value of 1000 replicates; Figure S3: Representation of the principal component analysis of the genotypes in Dataset B (TP, RP, and BGVss); Figure S4: Representation of the principal component analysis of the genotypes in dataset C (TP and RP); Table S1: Summary of the samples of the Theobroma cacao landraces from the Tumaco region. Reads per landrace obtained by Illumina sequencing.

Author Contributions

Conceptualization, R.Y., P.D.-D. and J.I.P.-Z.; methodology, P.D.-D. and J.A.B.-C.; formal analysis, P.D.-D., R.Y. and J.A.B.-C.; writing—original draft preparation, P.D.-D., R.Y. and J.M.-S.; writing—review and editing, P.D.-D., R.Y. and J.A.B.-C.; funding acquisition, J.I.P.-Z. All authors have read and agreed to the published version of the manuscript.

Funding

This work was funded by the Programa de Regalías del Ministerio de Ciencia y Tecnología e Innovación de Colombia under agreement 44, signed in November 2015, within the project “Estudio para el Mejoramiento de la Productividad y Calidad Sensorial (Aroma y Sabor) del Cacao (Theobroma cacao L.)”.

Institutional Review Board Statement

Not applicable.

Data Availability Statement

Raw sequences are available at the NCBI under the BioProject ID: PRJNA1180628.

Acknowledgments

The authors would like to acknowledge Diego Delgadillo for his help in the analysis and Jaime Osorio-Guarin for revising the manuscript. Additionally, they extend their gratitude to the Gobernación de Nariño and the communities from the municipalities of Tumaco and Los Andes.

Conflicts of Interest

The authors declare no conflicts of interest. The funding organizations that provided support for this work had no role in the design of the study; data collection, analyses, or interpretation of data; writing of the manuscript; or the decision to publish the results.

References

  1. Zhang, D.; Motilal, L. Origin, Dispersal, and Current Global Distribution of Cacao Genetic Diversity. In Cacao Diseases: A History of Old Enemies and New Encounters; Bailey, B.A., Meinhardt, L.W., Eds.; Springer International Publishing: Cham, Switzerland, 2016; pp. 3–31. ISBN 978-3-319-24789-2. [Google Scholar]
  2. Valles, R.R. Comissão Executiva do Plano da Lavoura Cacaueira (CEPLAC); Centro de Pesquisas do Cacau (CEPEC). In Ciência, Tecnologia e Manejo Do Cacaueiro; CEPLAC/CEPEC/SEFIS: Ilhéus, Brazil, 2012. [Google Scholar]
  3. Federación Nacional de Cacaoteros (FEDECACAO). Presentación: El Sector Cacaotero En Colombia En Reunión de Acercamiento FEDECACAO—Incentivo al Seguro Agropecuario ISA 2020; FEDECACAO-MADR-FASECOLDA-FINAGRO: Bogotá, Colombia, 2020. [Google Scholar]
  4. Montoya-Restrepo, I.A.; Montoya-Restrepo, L.A.; Lowy-Ceron, P.D. Oportunidades Para La Actividad Cacaotera En El Municipio de Tumaco, Nariño, Colombia. Entramado 2015, 11, 48–59. [Google Scholar] [CrossRef]
  5. Lafaux Castillo, M.P. Evaluación de Dos Sistemas de Producción Del Cultivo de Cacao (Theobroma cacao L.), En La Vereda San Luis Robles Tumaco y Sus Impactos Socioeconómicos y Ambientales. Master’s Thesis, Universidad de Manizales, Manizales, Colombia, 2022. [Google Scholar]
  6. Bacca, P.P.; Alarcon, K.A.; González, J.C.; Guzmán, F.A.; Coronado, R.A.; Romero Barrera, Y. Evaluación de Cuatro Genotipos de Cacao En Nariño, Colombia. Rev. Mex. Cienc. Agric. 2023, 14, e3331. [Google Scholar] [CrossRef]
  7. Unidad de Planificación Rural Agropecuaria (UPRA), Evaluaciones Agropecuarias Municipales. Agronet, 2021. Available online: https://www.agronet.gov.co/estadistica/paginas/home.aspx?cod=1 (accessed on 4 November 2024).
  8. Ballesteros, W. Caracterización Morfológica de Árboles Elite de Cacao (Theobroma cacao L.) en el municipio de Tumaco, Nariño, Colombia. Master’s Thesis, Universidad de Nariño, Pasto, Colombia, 2011. [Google Scholar]
  9. Agencia UNAL. Cacaoteros y Transformadores de Cacao de Tumaco Reciben Asistencia Técnica Especializada de La UNAL. Agencia UNAL, 2024. Available online: https://agenciadenoticias.unal.edu.co/detalle/cacaoteros-y-transformadores-de-cacao-de-tumaco-reciben-asistencia-tecnica-especializada-de-la-unal (accessed on 5 November 2024).
  10. Rodriguez-Medina, C.; Arana, A.C.; Sounigo, O.; Argout, X.; Alvarado, G.A.; Yockteng, R. Cacao Breeding in Colombia, Past, Present and Future. Breed. Sci. 2019, 69, 373–382. [Google Scholar] [CrossRef]
  11. Hyman, S. CCN-51: Are We Barking up the Wrong (Fruit) Tree? 2024. Available online: https://cocoarunners.com/blog/ccn-51-are-we-barking-up-the-wrong-fruit-tree (accessed on 5 November 2024).
  12. Boza, E.J.; Motamayor, J.C.; Amores, F.M.; Cedeño-Amador, S.; Tondo, C.L.; Livingstone, D.S.; Schnell, R.J.; Gutiérrez, O.A. Genetic Characterization of the Cacao Cultivar CCN 51: Its Impact and Significance on Global Cacao Improvement and Production. J. Am. Soc. Hortic. Sci. 2014, 139, 219–229. [Google Scholar] [CrossRef]
  13. Motamayor, J.C.; Mockaitis, K.; Schmutz, J.; Haiminen, N.; Livingstone, D., III; Cornejo, O.; Findley, S.D.; Zheng, P.; Utro, F.; Royaert, S.; et al. The Genome Sequence of the Most Widely Cultivated Cacao Type and Its Use to Identify Candidate Genes Regulating Pod Color. Genome Biol. 2013, 14, r53. [Google Scholar] [CrossRef]
  14. Thomas, E.; van Zonneveld, M.; Loo, J.; Hodgkin, T.; Galluzzi, G.; van Etten, J. Present Spatial Diversity Patterns of Theobroma cacao L. in the Neotropics Reflect Genetic Differentiation in Pleistocene Refugia Followed by Human-Influenced Dispersal. PLoS ONE 2012, 7, e47676. [Google Scholar] [CrossRef]
  15. Osorio-Guarín, J.A.; Berdugo-Cely, J.; Coronado, R.A.; Zapata, Y.P.; Quintero, C.; Gallego-Sánchez, G.; Yockteng, R. Colombia a Source of Cacao Genetic Diversity As Revealed by the Population Structure Analysis of Germplasm Bank of Theobroma cacao L. Front. Plant Sci. 2017, 8, 1994. [Google Scholar] [CrossRef]
  16. Osorio-Guarín, J.A.; Berdugo-Cely, J.A.; Coronado-Silva, R.A.; Baez, E.; Jaimes, Y.; Yockteng, R. Genome-Wide Association Study Reveals Novel Candidate Genes Associated with Productivity and Disease Resistance to Moniliophthora spp. in Cacao (Theobroma cacao L.). G3 Genes Genomes Genet. 2020, 10, 1713–1725. [Google Scholar] [CrossRef]
  17. González-Orozco, C.E.; Osorio-Guarín, J.A.; Yockteng, R. Phylogenetic Diversity of Cacao (Theobroma cacao L.) Genotypes in Colombia. Plant Genet. Resour. 2022, 20, 203–214. [Google Scholar] [CrossRef]
  18. Ruiz Erazo, X.A. Diversidad Genética de Cacao Theobroma cacao L. Con Marcadores Moleculares Microsatelites; Universidad Nacional de Colombia-Sede Palmira: Palmira, Colombia, 2015. [Google Scholar]
  19. Morillo, Y.; Morillo, A.C.; Muñoz, J.E.; Ballesteros, W.; Gonzalez, A. Caracterización Molecular Con Microsatélites Amplificados al Azar (RAMs) de 93 Genotipos de Cacao (Theobroma cacao L.). Agron. Colomb. 2014, 32, 315–325. [Google Scholar] [CrossRef]
  20. Motamayor, J.C.; Lachenaud, P.; da Silva e Mota, J.W.; Loor, R.; Kuhn, D.N.; Brown, J.S.; Schnell, R.J. Geographic and Genetic Population Differentiation of the Amazonian Chocolate Tree (Theobroma cacao L). PLoS ONE 2008, 3, e3311. [Google Scholar] [CrossRef]
  21. Zhang, D.; Boccara, M.; Motilal, L.; Butler, D.R.; Umaharan, P.; Mischke, S.; Meinhardt, L. Microsatellite Variation and Population Structure in the “Refractario” Cacao of Ecuador. Conserv. Genet. 2008, 9, 327–337. [Google Scholar] [CrossRef]
  22. Bustamante, D.E.; Motilal, L.A.; Calderon, M.S.; Mahabir, A.; Oliva, M. Genetic Diversity and Population Structure of Fine Aroma Cacao (Theobroma cacao L.) from North Peru Revealed by Single Nucleotide Polymorphism (SNP) Markers. Front. Ecol. Evol. 2022, 10, 895056. [Google Scholar] [CrossRef]
  23. Arevalo-Gardini, E.; Meinhardt, L.W.; Zuñiga, L.C.; Arévalo-Gardni, J.; Motilal, L.; Zhang, D. Genetic Identity and Origin of “Piura Porcelana” a Fine-Flavored Traditional Variety of Cacao (Theobroma cacao) from the Peruvian Amazon. Tree Genet. Genomes 2019, 15, 11. [Google Scholar] [CrossRef]
  24. Kilian, B.; Graner, A. NGS Technologies for Analyzing Germplasm Diversity in Genebanks. Brief. Funct. Genom. 2012, 11, 38–50. [Google Scholar] [CrossRef]
  25. Peterson, B.K.; Weber, J.N.; Kay, E.H.; Fisher, H.S.; Hoekstra, H.E. Double Digest RADseq: An Inexpensive Method for De Novo SNP Discovery and Genotyping in Model and Non-Model Species. PLoS ONE 2012, 7, e37135. [Google Scholar] [CrossRef]
  26. Davey, J.W.; Hohenlohe, P.A.; Etter, P.D.; Boone, J.Q.; Catchen, J.M.; Blaxter, M.L. Genome-Wide Genetic Marker Discovery and Genotyping Using Next-Generation Sequencing. Nat. Rev. Genet. 2011, 12, 499–510. [Google Scholar] [CrossRef]
  27. Baird, N.A.; Etter, P.D.; Atwood, T.S.; Currey, M.C.; Shiver, A.L.; Lewis, Z.A.; Selker, E.U.; Cresko, W.A.; Johnson, E.A. Rapid SNP Discovery and Genetic Mapping Using Sequenced RAD Markers. PLoS ONE 2008, 3, e3376. [Google Scholar] [CrossRef]
  28. Osorio-Guarín, J.A.; Quackenbush, C.R.; Cornejo, O.E. Ancestry Informative Alleles Captured with Reduced Representation Library Sequencing in Theobroma cacao. PLoS ONE 2018, 13, e0203973. [Google Scholar] [CrossRef]
  29. Andrews, S. FastQC: A Quality Control Tool for High Throughput Sequence Data. Available online: http://www.bioinformatics.babraham.ac.uk/projects/fastqc/ (accessed on 20 September 2023).
  30. Krueger, F. Trim Galore. Babraham Bioinformatics 2018. Available online: https://www.bioinformatics.babraham.ac.uk/projects/trim_galore/ (accessed on 20 September 2023).
  31. Argout, X.; Martin, G.; Droc, G.; Fouet, O.; Labadie, K.; Rivals, E.; Aury, J.M.; Lanaud, C. The Cacao Criollo Genome v2.0: An Improved Version of the Genome for Genetic and Functional Genomic Studies. BMC Genom. 2017, 18, 730. [Google Scholar] [CrossRef]
  32. Li, H.; Durbin, R. Fast and Accurate Short Read Alignment with Burrows-Wheeler Transform. Bioinformatics 2009, 25, 1754–1760. [Google Scholar] [CrossRef]
  33. McKenna, A.; Hanna, M.; Banks, E.; Sivachenko, A.; Cibulskis, K.; Kernytsky, A.; Garimella, K.; Altshuler, D.; Gabriel, S.; Daly, M.; et al. The Genome Analysis Toolkit: A MapReduce Framework for Analyzing Next-Generation DNA Sequencing Data. Genome Res. 2010, 20, 1297–1303. [Google Scholar] [CrossRef]
  34. Broad Institute. Picard Tool Toolkit. 2019. Available online: http://broadinstitute.github.io/picard/ (accessed on 31 October 2024).
  35. Danecek, P.; Auton, A.; Abecasis, G.; Albers, C.A.; Banks, E.; DePristo, M.A.; Handsaker, R.E.; Lunter, G.; Marth, G.T.; Sherry, S.T. The Variant Call Format and VCFtools. Bioinformatics 2011, 27, 2156–2158. [Google Scholar] [CrossRef]
  36. Cornejo, O.E.; Yee, M.-C.; Dominguez, V.; Andrews, M.; Sockell, A.; Strandberg, E.; Livingstone, D.; Stack, C.; Romero, A.; Umaharan, P.; et al. Population Genomic Analyses of the Chocolate Tree, Theobroma cacao L., Provide Insights into Its Domestication Process. Commun. Biol. 2018, 1, 167. [Google Scholar] [CrossRef]
  37. Danecek, P.; McCarthy, S.A. BCFtools/Csq: Haplotype-Aware Variant Consequences. Bioinformatics 2017, 33, 2037–2039. [Google Scholar] [CrossRef]
  38. Francis, R.M. Pophelper: An R Package and Web App to Analyse and Visualize Population Structure. Mol. Ecol. Resour. 2017, 17, 27–32. [Google Scholar] [CrossRef]
  39. Purcell, S.; Neale, B.; Todd-Brown, K.; Thomas, L.; Ferreira, M.A.R.; Bender, D.; Maller, J.; Sklar, P.; De Bakker, P.I.W.; Daly, M.J. PLINK: A Tool Set for Whole-Genome Association and Population-Based Linkage Analyses. Am. J. Hum. Genet. 2007, 81, 559–575. [Google Scholar] [CrossRef]
  40. Wickham, H. Ggplot2. Wiley Interdiscip Rev. Comput. Stat. 2011, 3, 180–185. [Google Scholar] [CrossRef]
  41. Alexander, D.H.; Lange, K. Enhancements to the ADMIXTURE Algorithm for Individual Ancestry Estimation. BMC Bioinform. 2011, 12, 246. [Google Scholar] [CrossRef]
  42. Kamvar, Z.N.; Tabima, J.F.; Grünwald, N.J. Poppr: An R Package for Genetic Analysis of Populations with Clonal, Partially Clonal, and/or Sexual Reproduction. PeerJ 2014, 2, e281. [Google Scholar] [CrossRef]
  43. Gruber, B.; Unmack, P.J.; Berry, O.F.; Georges, A. Dartr: An r Package to Facilitate Analysis of SNP Data Generated from Reduced Representation Genome Sequencing. Mol. Ecol. Resour. 2018, 18, 691–699. [Google Scholar] [CrossRef]
  44. Granato, I.S.C.; Galli, G.; de Oliveira Couto, E.G.; e Souza, M.B.; Mendonça, L.F.; Fritsche-Neto, R. SnpReady: A Tool to Assist Breeders in Genomic Analysis. Mol. Breed. 2018, 38, 102. [Google Scholar] [CrossRef]
  45. Minh, B.Q.; Schmidt, H.A.; Chernomor, O.; Schrempf, D.; Woodhams, M.D.; von Haeseler, A.; Lanfear, R. IQ-TREE 2: New Models and Efficient Methods for Phylogenetic Inference in the Genomic Era. Mol. Biol. Evol. 2020, 37, 1530–1534. [Google Scholar] [CrossRef]
  46. Fouet, O.; Loor Solorzano, R.G.; Rhoné, B.; Subía, C.; Calderón, D.; Fernández, F.; Sotomayor, I.; Rivallan, R.; Colonges, K.; Vignes, H.; et al. Collection of Native Theobroma cacao L. Accessions from the Ecuadorian Amazon Highlights a Hotspot of Cocoa Diversity. Plants People Planet 2022, 4, 605–617. [Google Scholar] [CrossRef]
  47. Argout, X.; Droc, G.; Fouet, O.; Rouard, M.; Labadie, K.; Rhoné, B.; Rey Loor, G.; Lanaud, C. Pangenomic Exploration of Theobroma cacao: New Insights into Gene Content Diversity and Selection During Domestication. BioRxiv 2023. [Google Scholar] [CrossRef]
  48. Viana, C. Colombian Cocoa and Its Influence on World Patisseries. Colombia One. 2024. Available online: https://colombiaone.com/2024/11/09/colombian-cocoa (accessed on 4 December 2024).
  49. Pérez, E.; Guzmán, R.; Álvarez, C.; Lares, M.; Martínez, K.; Suniaga, G.; Pavani, A. Cacao, Cultura y Patrimonio: Un Hábitat de Aroma Fino En Venezuela. RIVAR 2021, 8, 146–162. [Google Scholar] [CrossRef]
  50. Sánchez Arizo, V.H.; Zambrano Mendoza, J.L.; Iglesias, C. La Cadena de Valor Del Cacao En América Latina y El Caribe; INIAP, Estación Experimental Santa Catalina: Quito, Ecuador, 2019. [Google Scholar]
  51. Pérez-Zuñiga, J.I.; Moreno, B.A.; Segura, J.; Mejia, R.J.; Ortiz, C.C.; Alarcon, K.A. Selección de Árboles Promisorios de Cacao (Theobroma cacao L.) Por Su Alta Producción En Dos Zonas Cacaoteras Del Departamento de Nariño. 2024; in preparation. [Google Scholar]
  52. Gopaulchan, D.; Motilal, L.A.; Kalloo, R.K.; Mahabir, A.; Moses, M.; Joseph, F.; Umaharan, P. Genetic Diversity and Ancestry of Cacao (Theobroma cacao L.) in Dominica Revealed by Single Nucleotide Polymorphism Markers. Genome 2020, 63, 583–595. [Google Scholar] [CrossRef]
  53. Lukman; Zhang, D.; Susilo, A.W.; Dinarti, D.; Bailey, B.; Mischke, S.; Meinhardt, L.W. Genetic Identity, Ancestry and Parentage in Farmer Selections of Cacao from Aceh, Indonesia Revealed by Single Nucleotide Polymorphism (SNP) Markers. Trop Plant Biol. 2014, 7, 133–143. [Google Scholar] [CrossRef]
  54. Céspedes-Del Pozo, W.H.; Blas-Sevillano, R.; Zhang, D. Assessing Genetic Diversity of Cacao (Theobroma cacao L.) Nativo Chuncho in La Convención, Cusco-Perú. In Proceedings of the International Symposium on Cocoa Research (ISCR), Lima, Peru, 13–17 November 2017. [Google Scholar]
  55. Wahlund, S. Zusammensetzung von Populationen Und Korrelationserscheinungen Vom Standpunkt Der Vererbungslehre Aus Betrachtet. Hereditas 1928, 11, 65–106. [Google Scholar] [CrossRef]
  56. Schnell, R.J.; Olano, C.T.; Brown, J.S.; Meerow, A.W.; Cervantes-Martinez, C.; Nagai, C.; Motamayor, J.C. Retrospective Determination of the Parental Population of Superior Cacao (Theobroma cacao L.) Seedlings and Association of Microsatellite Alleles with Productivity. J. Am. Soc. Hortic. Sci. 2005, 130, 181–190. [Google Scholar] [CrossRef]
  57. Motamayor, J.C.; Risterucci, A.-M.; Lopez, P.A.; Ortiz, C.F.; Moreno, A.; Lanaud, C. Cacao Domestication I: The Origin of the Cacao Cultivated by the Mayas. Heredity 2002, 89, 380–386. [Google Scholar] [CrossRef] [PubMed]
  58. Zhang, D.; Martínez, W.J.; Johnson, E.S.; Somarriba, E.; Phillips-Mora, W.; Astorga, C.; Mischke, S.; Meinhardt, L.W. Genetic Diversity and Spatial Structure in a New Distinct Theobroma cacao L. Population in Bolivia. Genet. Resour. Crop Evol. 2012, 59, 239–252. [Google Scholar] [CrossRef]
  59. Thomas, E.; Imán Correa, S.A.; Atkinson, R.; Zavaleta, D.; Rodriguez, C.; Lastra, S.; Murrieta, E.; Farfán, A.; Castro, J.; Ramírez, J. Diversidad Genética de Cacao En El Perú. In Catalogue of Cocoas from Peru; Thomas, E., Lastra, S., Zavaleta, D., Eds.; Bioversity International: Rome, Italy, 2023. [Google Scholar]
  60. Bailey, B.A.; Meinhardt, L.W. Cacao Diseases; Bailey, B.A., Meinhardt, L.W., Eds.; Springer International Publishing: Cham, Switherland, 2016; ISBN 978-3-319-24787-8. [Google Scholar]
  61. Pound, F.J. Cacao and Witches’ Broom Disease (Marasmius Perniciosus) of South America with Notes on Other Species of Theobroma; Yuille’s Printery: Port of Spain, Trinidad and Tobago, 1938. [Google Scholar]
  62. Pound, F.J. A Note on the Cocoa Population of South America. In Report and Proceedings of the 1945 Cocoa Conference; The Colonial Office, His Majesty’s Stationary Office: London, UK, 1945; pp. 131–133. [Google Scholar]
  63. Allen, J.B. Geographical Variation and Population Biology in Wild Theobroma cacao. Ph.D. Thesis, The University of Edinburgh, Edinburgh, UK, 1988. [Google Scholar]
  64. Arévalo-Gardini, E.; Balbin-Coronado, V.; Zúñiga-Luna, H.; Chirinos, M. Genetic Diversity and Biochemical Characterization of Cacao (Theobroma cacao L.) Populations in the Peruvian Amazon. Genetic Resources and Crop Evolution. Genet. Resour. Crop Evol. 2019, 66, 1025–1037. [Google Scholar]
  65. Ceccarelli, V.; Lastra, S.; Loor Solórzano, R.G.; Chacón, W.W.; Nolasco, M.; Sotomayor Cantos, I.A.; Plaza Avellán, L.F.; López, D.A.; Fernández Anchundia, F.M.; Dessauw, D.; et al. Conservation and Use of Genetic Resources of Cacao (Theobroma cacao L.) by Gene Banks and Nurseries in Six Latin American Countries. Genet. Resour. Crop Evol. 2022, 69, 1283–1302. [Google Scholar] [CrossRef]
  66. Lanaud, C.; Vignes, H.; Utge, J.; Valette, G.; Rhoné, B.; Garcia Caputi, M.; Angarita Nieto, N.S.; Fouet, O.; Gaikwad, N.; Zarrillo, S.; et al. A Revisited History of Cacao Domestication in Pre-Columbian Times Revealed by Archaeogenomic Approaches. Sci. Rep. 2024, 14, 2972. [Google Scholar] [CrossRef]
Figure 1. Distribution of cacao genotypes from the department of Nariño, Southwestern Colombia. The national, provincial, and district boundaries were obtained from the geoportal of the Instituto Geográfico Agustín Codazzi in a shapefile format.
Diversity 16 00754 g001
Figure 2. Bar plot of the genetic structure of the Tumaco landraces, genotypes of cacao reference populations, and selected accessions from the BGV using FastStructure software.
Diversity 16 00754 g002
Figure 3. Maximum likelihood phylogenetic chart showing the relationship among Tumaco landraces (in blue), the genotypes of the cacao genetic reference groups, and a selected group of accessions from the BGV, in which those in green were collected from the Colombian Pacific Region. The number in nodes indicates the bootstrap value of 1000 replicates.
Diversity 16 00754 g003
Figure 4. Pairwise fixation indices (Fst) among 10 cacao genetic groups and the group containing the Tumaco cacao landraces.
Diversity 16 00754 g004
Figure 5. Bar plot showing the ancestry analysis of the Tumaco landraces using the supervised mode of Admixture software indicating the genotypes belonging to the cacao genetic reference groups.
Diversity 16 00754 g005
Figure 6. Maximum likelihood phylogenetic chart showing the relationship among Tumaco landraces and the genotypes of the ten cacao genetic reference groups. The number in nodes is the bootstrap value of 1000 replicates.
Diversity 16 00754 g006
Table 1. Datasets comprising the analyses with the Tumaco population (TP) with 27 genotypes, reference populations (RP) with 53 genotypes, Colombian Germplasm Bank Accessions (BGV) with 215 genotypes, and a subset of BGV (BGVss) with 45 genotypes.
DatasetPopulations IncludedNumber of SamplesNumber of SNPs
ATP, RP, BGV295359,950
BTP, RP, BGVss126161,394
CTP, RP801,359,540
Table 2. Values of the observed (Ho) and expected (He) heterozygosity for each cacao reference population and the Tumaco population.
PopulationNumber of Genotypes Observed Heterozygosity (Ho)Expected Heterozygosity (He)
AMELONADO100.150.12
CONTAMANA40.180.16
CRIOLLO40.020.02
CURARAY40.110.12
TUMACO230.150.23
GUIANNA70.160.12
IQUITOS30.310.19
MARANON90.260.20
NACIONAL40.270.19
NANAY50.20.15
PURUS40.170.15
Table 3. Individual heterozygosities for each Tumaco landrace.
GenotypeObserved Heterozygosity (Ho)
14_RC20.3
03_RM250.22
18_IB90.21
05_RM330.21
16A_SA60.16
06_WS70.16
09_GO50.16
12_PV50.15
15_SO10.15
17_SA50.15
11_DJ010.14
27_OQV570.14
07_MEC130.14
13_EM100.13
16B_SA70.13
20_GRN0.12
25_9800.12
10_MA20.11
08_GO10.11
01_HC300.1
04_MG070.1
26_AC90.09
19_IB100.08
Table 4. AMOVA within/between reference cacao genetic groups and TP. In this analysis, the control genotypes (21_CCN51 22_IMC67 23_ICS95, 24_TCS-01) were excluded from Dataset C. df: degrees of freedom; SS: sum of squares; MS: mean sums of squares; Var: estimated variation; %: percentage of the total variance; index Phi = 0.54836.
SourcedfSSMSVar%
Between Pops1022,002,9322,200,293.2297,746.254.8
Within Pops6616,184,655245,222.0245,222.045.6
Total7638,187,587502,468.3542,968.2100.0
Disclaimer/Publisher’s Note: The statements, opinions and data contained in all publications are solely those of the individual author(s) and contributor(s) and not of MDPI and/or the editor(s). MDPI and/or the editor(s) disclaim responsibility for any injury to people or property resulting from any ideas, methods, instructions or products referred to in the content.