Article

Dissimilarity among Species and Higher Taxa of Amphibians in a Hotspot of Biodiversity and Endemism in the Neotropics

by
Jaime Manuel Calderón-Patrón
1,*,
Karen Elizabeth Peña-Joya
2,
Jorge Téllez-López
2 and
Eréndira Patricia Canales-Gómez
2
1
Laboratorio de Biodiversidad, Escuela de Ciencias, Universidad Autónoma Benito Juárez de Oaxaca, Oaxaca de Juárez 68120, Mexico
2
Laboratorio de Ecología, Paisaje y Sociedad, Centro Universitario de la Costa, Universidad de Guadalajara, Puerto Vallarta 44100, Mexico
*
Author to whom correspondence should be addressed.
Diversity 2024, 16(4), 224; https://doi.org/10.3390/d16040224
Submission received: 19 February 2024 / Revised: 30 March 2024 / Accepted: 1 April 2024 / Published: 9 April 2024
(This article belongs to the Section Animal Diversity)

Abstract

:
The Mexican Republic ranks fifth in the world in terms of amphibian diversity, and within Mexico, the state of Oaxaca has the greatest amphibian richness and endemism. Unfortunately, various factors, such as land use change and global warming, have caused a global crisis that threatens the conservation of this class. In the face of these threats, an analysis of beta diversity provides information that can be applied to conservation strategies, since its study reveals the spatial scaling of diversity loss and clarifies the mechanisms of regional diversity maintenance. In this work, we analyzed the beta diversity at the species and higher taxa level (order, family, subfamily, genus and species) for the amphibians of Oaxaca and their replacement components and the differences in richness for anurans and caudates separately between physiographic subprovinces. Very high beta diversity was recorded, with higher diversity occurring among caudates (0.92) than among anurans (0.84). Species replacement was the component that most contributed to this result, and the subprovinces with substantial environmental differences had the most dissimilar amphibian communities. The results of this study show the need to implement conservation strategies in subprovinces with high amphibian richness and endemism levels, following the example of Sierra Madre de Oaxaca (SMO), where local communities have developed conservation actions in most of the territory.

1. Introduction

In Mexico, the class Amphibia has a high global richness level, ranking fifth in the world in terms of diversity, with 430 species, of which 70% (300 species) are endemic to the country [1]. Mexico has the second most plethodontid species globally, with 132 species, of which 81% are endemic to the country [1]. At the national level, the state of Oaxaca has the greatest diversity of Amphibia, registering 38 genera (32 anurans, 5 caudates and 1 Gymnophiona) and 158 species (109 anurans, 47 caudates and 2 caecilians) [2]. Oaxaca contains 36.7% of the species, 65% of the genera and 81% of the families of amphibians in Mexico. Of this total, 110 are endemic, 49 to Mexico (39 anurans, 9 caudates and 1 caecilian), and 61 are endemic to Oaxaca (38.6%: 26 anurans and 35 caudates) [2]). In the case of caudates, endemism is extraordinary since 74% are endemic to Oaxaca [2].
Unfortunately, globally, the amphibians are experiencing a new extinction crisis in their history [3,4]; for example, in Mexico, more than 41% of amphibian species are critically endangered, endangered or threatened according to the International Union for the Conservation of Nature (IUCN) [5], and 72% of salamander species (95 species) in Mexico are threatened with extinction [6] due to various factors, such as habitat transformation, which is caused by human activities, including agriculture, livestock, logging and urban development; introduction of exotic species; and the effects of global climate change and emerging infectious diseases [3,4,5,6]. In addition to this problem, amphibians have limited dispersal capacities, specialized habitats and habits and high rates of endemism [3,4,5], which contribute to the fact that, at the national scale, they present the highest beta diversity within terrestrial vertebrate species with a high conservation risk [7,8,9]. Given this background, we consider it important to analyze the diversity of amphibians in the state of Oaxaca with integrative methodological approaches. In this work, we analyze amphibian beta diversity and its replacement components and the differences in the richness of the amphibians in the physiographic subprovinces of the state of Oaxaca since this type of analysis offers quantitative information that can contribute to a better understanding of the diversity of this group at different scales and that can be reflected in conservation strategies for these species at the state level [10].

2. Materials and Methods

The units of study in this work were the 12 physiographic subprovinces present in the state of Oaxaca that were used for an analysis of the herpetofauna in Oaxaca by Mata-Silva et al. [2,11]: Balsas Depression (DB); Mountains and Valleys of the West (MVO); Tehuacán Trench (FT); Sierra Madre de Oaxaca (SMO); Gulf Coastal Plain (PCG); Central Valleys of Oaxaca (VCO); Mountains and Valleys of the Center (MVC); Isthmic Depression of Tehuantepec (DIT); Sierra Madre de Chiapas (SMC); Sierra Madre del Sur (SMS); Pacific Coastal Plain (PCP); and Tehuantepec Coastal Plain (PCT) (Figure 1). From the information on amphibians in this work [11], a database of presence and absence was constructed.
To determine if there is a relationship between the size of the area of the provinces and the richness of amphibians, anurans and caudates, a regression analysis was applied. Beta diversity or dissimilarity was separated into its two components of replacement and differences in richness [12,13,14,15]. According to this method, the total dissimilarity is 1 − βSOR (similarity coefficient of Sorensen). This total dissimilarity is divided into two components: dissimilarity due to turnover (βSIM) and dissimilarity due to differences in richness (βSNE) [14,15,16], represented as βSOR = βSIM + βSNE. This analysis was carried out in the R program 4.0.3, using the BAT package 2.0.0 [17,18].
This partition was performed both for the dissimilarity in the composition of species and for that in the taxonomic structure, considering the composition of taxa higher than the species level, using the method of Bacaro et al. [19], where the total taxonomic dissimilarity—here, βSORT—is equal to the dissimilarity of the Jaccard or Sorensen coefficient but taking into account higher taxa. The values of βSORT range from zero when the taxonomic structure of both communities is identical to 1 when the taxonomic structure is totally different [19]. Taxonomic dissimilarity measures the proportion represented by nonshared taxa to the total number of taxa in the two communities. Therefore, the partitioning of βSORT with the procedure of Carvalho et al. [14] provides a dissimilarity component due to the change in the taxon (βSIMT) and a dissimilarity component due to the difference in taxon richness (βSNET). To calculate the total taxonomic dissimilarity and its components, we used the categories of order, family, subfamily, genus and species. The analysis was carried out in the R program 4.0.3 [18].
To observe the patterns of beta diversity among species and the beta taxonomy between physiographic subprovinces, we performed a nonmetric dimensional scaling analysis (NMDS). A cluster analysis was performed to determine similarities between subprovinces according to beta diversity values. This cluster analyses were performed using the UPGMA (Unweighted Pair Group Method with Arithmetic Mean) linkage method. The clusters formed were superimposed in the NMDS and were described using cutoff levels at 0.60 of dissimilarity for the total beta diversity and 0.30 of dissimilarity for the replacement components and differences in richness. These analyses were performed in the PRIMER V7® program [20]. Simple linear regression analyses were also performed to explore the existence of a relationship between the beta diversity of species and the beta diversity of higher amphibian taxa for the total beta diversity, turnover and differences in richness of the 12 physiographic subprovinces present in Oaxaca. All the analyses were performed for all amphibians; however, the analyses were performed independently for anurans and caudates separately, as these orders present important differences in richness and environmental requirements, and their dissimilarity patterns can vary.

3. Results

3.1. Species Richness and Endemism

Nationally, the state of Oaxaca has the highest amphibian species richness, with 158 species; in addition, 54.3% of these amphibians have been recorded in only one subprovince, as well as 48 of the 61 species endemics to Oaxaca (80%, Table 1). In comparison to caudates, anurans were distributed more broadly, in as many as 10 subprovinces (X = 2.87 subprovinces), and the caudates were distributed in as many as three subprovinces (X = 1.3 subprovinces, Table 2). Notably, the SMO had 88 species (62 anurans and 26 caudates), with 70.45% endemism (62 species: 36 anurans and 26 caudates), while, nationally, there was 21.6% endemism (19 species) at the national level (17 anurans and 2 caudates) and 49% endemism (43) at the state level (19 anurans and 24 caudates), of which 86.7% (36) are endemic to this subprovince (16 anurans and 20 caudates). There is a relationship between the subprovince area and amphibians’ richness; this relationship is also observed in anurans and caudates separately (r2 = 0.461 p < 0.017; r2 = 0.407 p < 0.025; and r2 = 0.51 p < 0.0137, respectively).

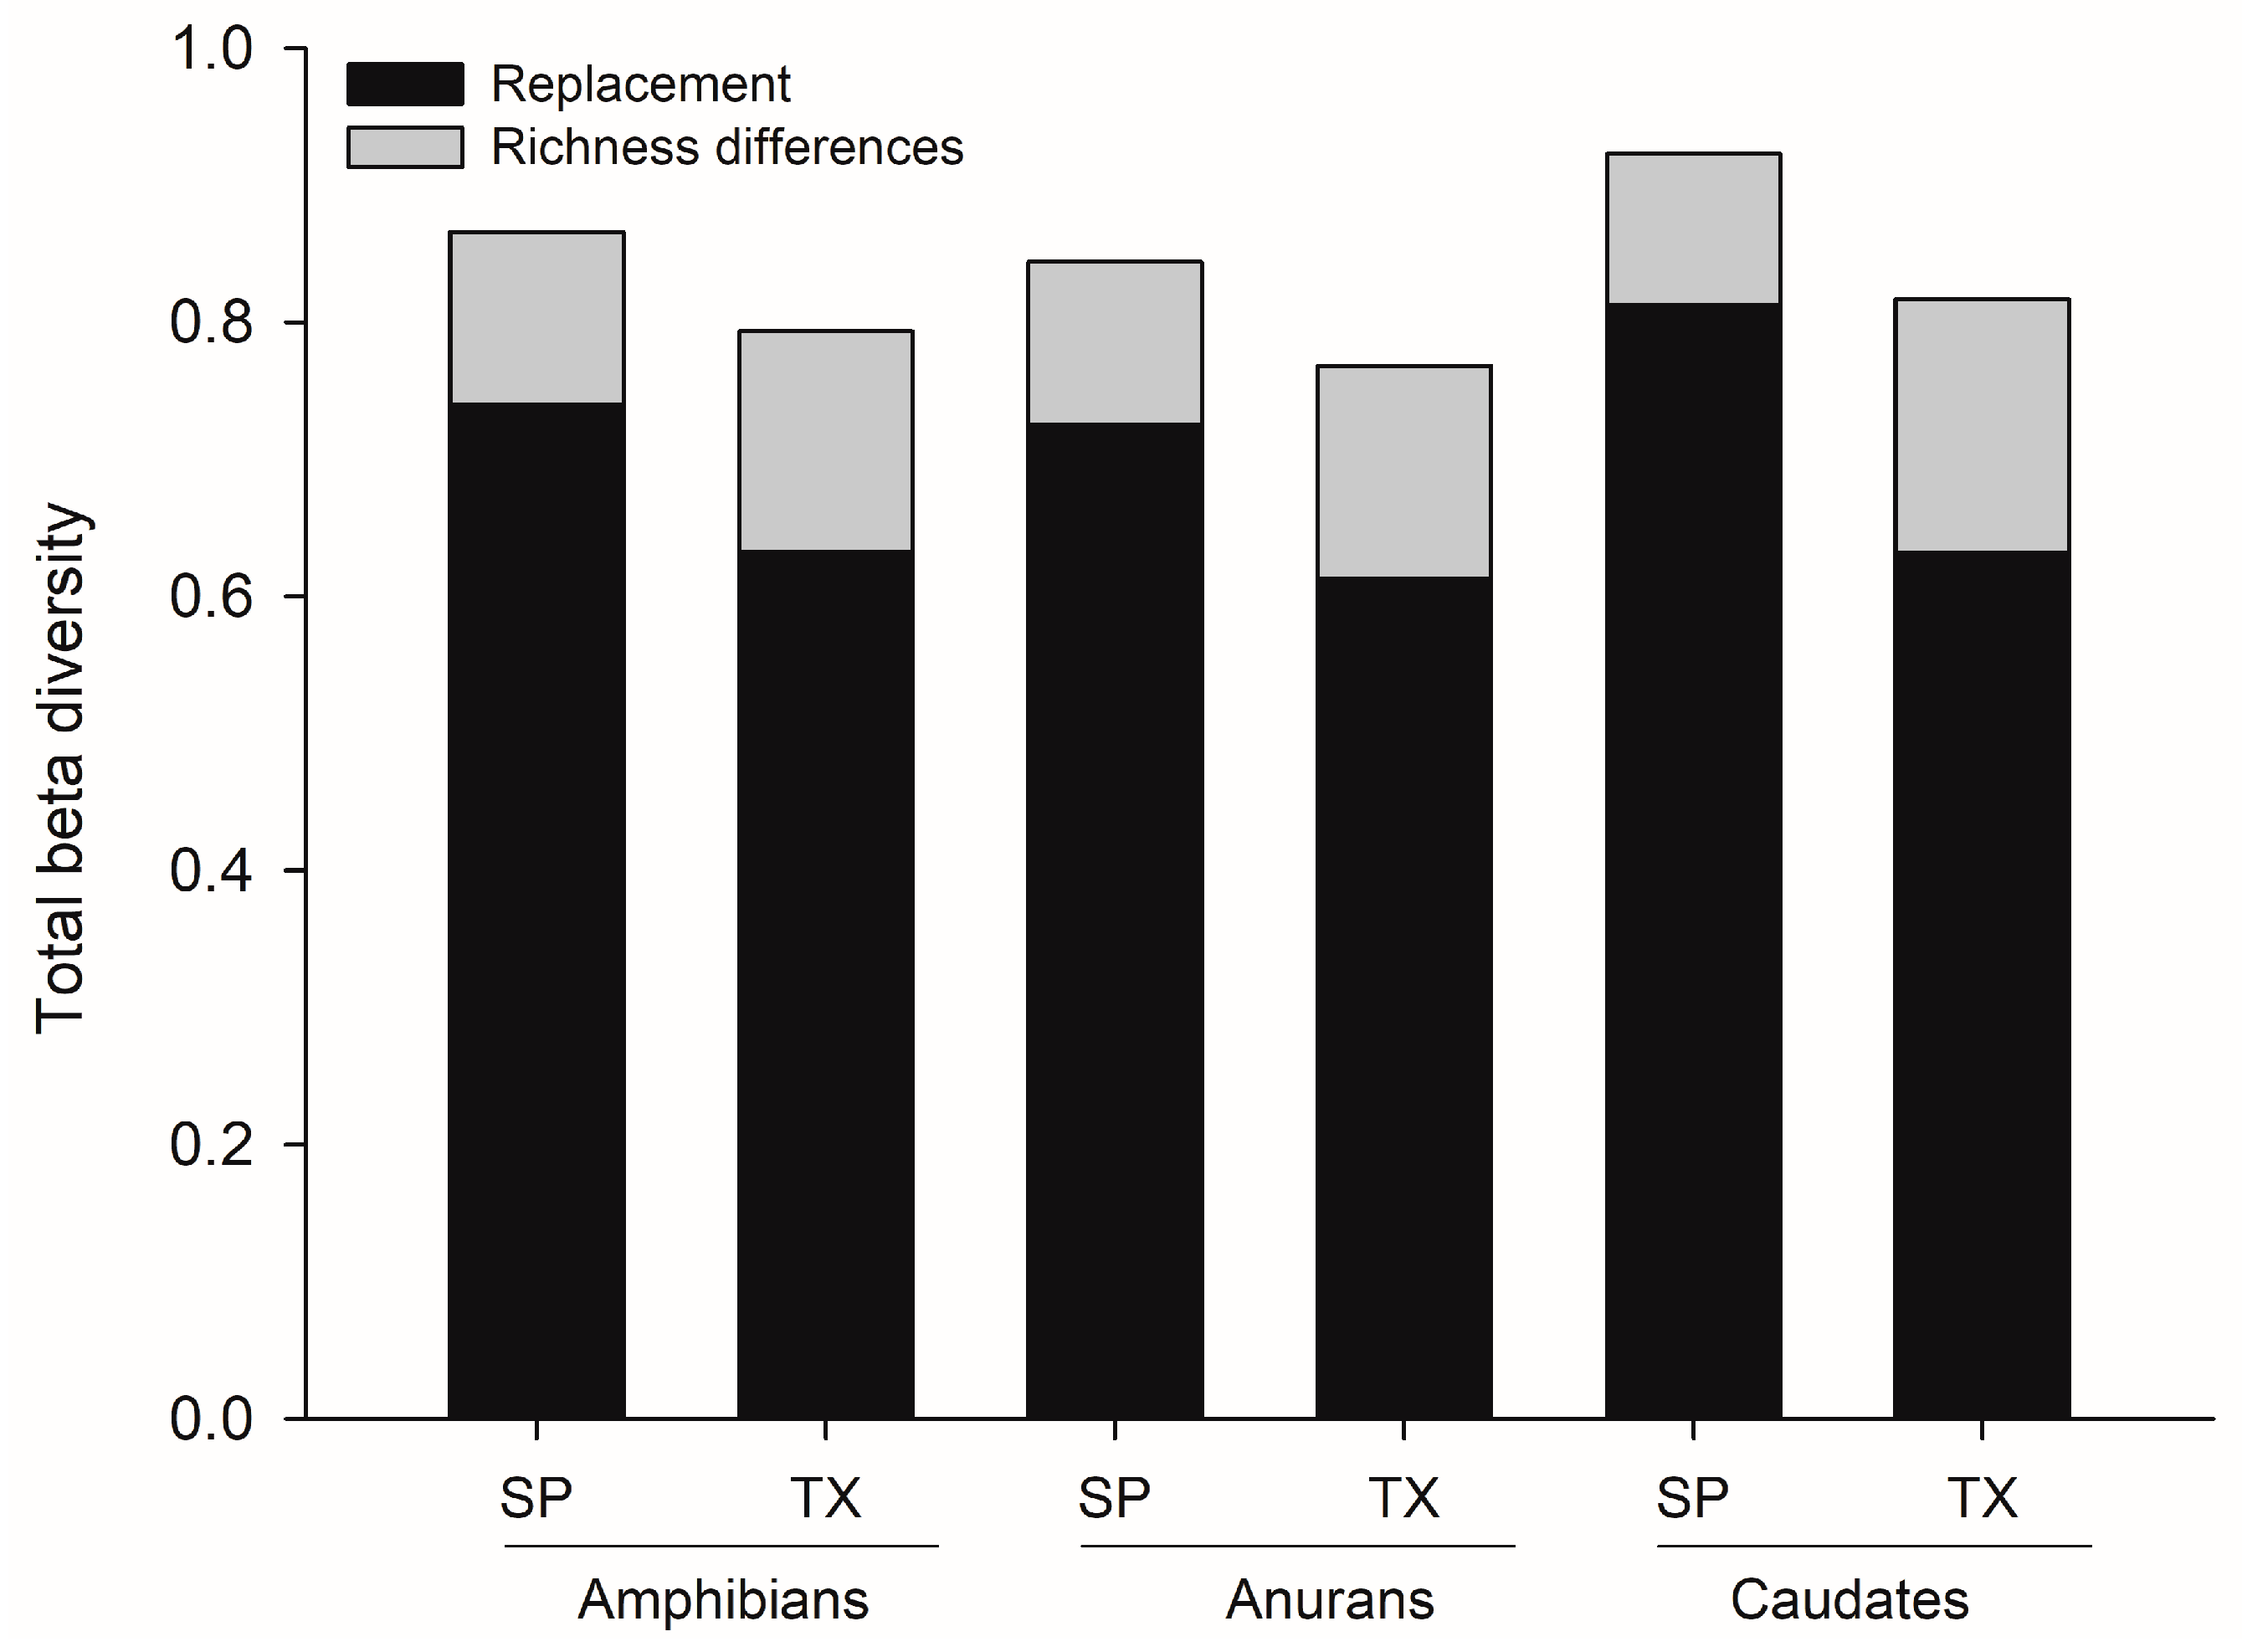
3.2. Total Beta Diversity of Amphibian Species at the State Level

The total beta diversity for Oaxacan amphibian species was 86% (βSOR = 0.86) and was higher than that of higher taxa (βSORT = 0.79). Turnover was more important than the differences in richness at the species level (βSIM = 0.74 and βSNE = 0.12) and higher taxa level (βSIMT = 0.63 and βSNET = 0.16). In comparison to the anurans, the caudates presented a higher total beta diversity of species and taxa (caudates, βSOR = 0.92 and βSORT = 0.81; and anurans, βSOR = 0.84 and βSORT = 0.76), and the turnover (caudates, βSIM = 0.81 and βSIMT = 0.63; and anurans, βSIM = 0.72 and βSIMT = 0.61) was more important than the differences in richness (anurans, βSNE = 0.12 and βSNET = 0.15; and caudates, βSNE = 0.11 and βSNET = 0.18; Figure 2). However, when all the subprovinces are analyzed, including where the caudates are not distributed, in comparison to the other factors, the differences in richness were more important (βSIM = 0.11 and βSNE = 0.69). There was no relationship between total beta diversity or turnover and the area of the physiographic provinces (r2 = 0.031, p <0.1526; r2 = 0.035, p < 0.1318, respectively). The area of the physiographic subprovinces showed a positive and significant relationship with the differences in richness (r2 = 0.1033, p < 0.0083).
Furthermore, we explored the relationship between richness and beta diversity with its components with the mean annual temperature and annual precipitation of each subprovince. The regression analysis between the mean annual average temperature and the total annual precipitation of each physiographic province and its amphibian species richness showed that only temperature was positively related to richness (r2 = 0.376, p < 0.035; r2 = 0.062, p < 0.42 respectively, Table 3).
In the case of the relationship between the mean annual temperature and the total beta diversity, turnover and differences in richness, only this last variable had a positive and significant relationship (r2 = 0.023, p < 0.223 and Mantel test r = 0.186, p < 0.097; r2 = 0.03, p < 0.156; Mantel test r = 0.18, p < 0.878; r2 = 0.083, p < 0.017; Mantel test r = 0.321, p < 0.056). A weak positive and significant relationship was evident between precipitation and total beta diversity and turnover (r2 = 0.069, p < 0.1561; r2 = 0.074, p < 0.024 respectively). The differences in richness were not related to precipitation (r2 = 0.004, p < 0.60, Table 3).

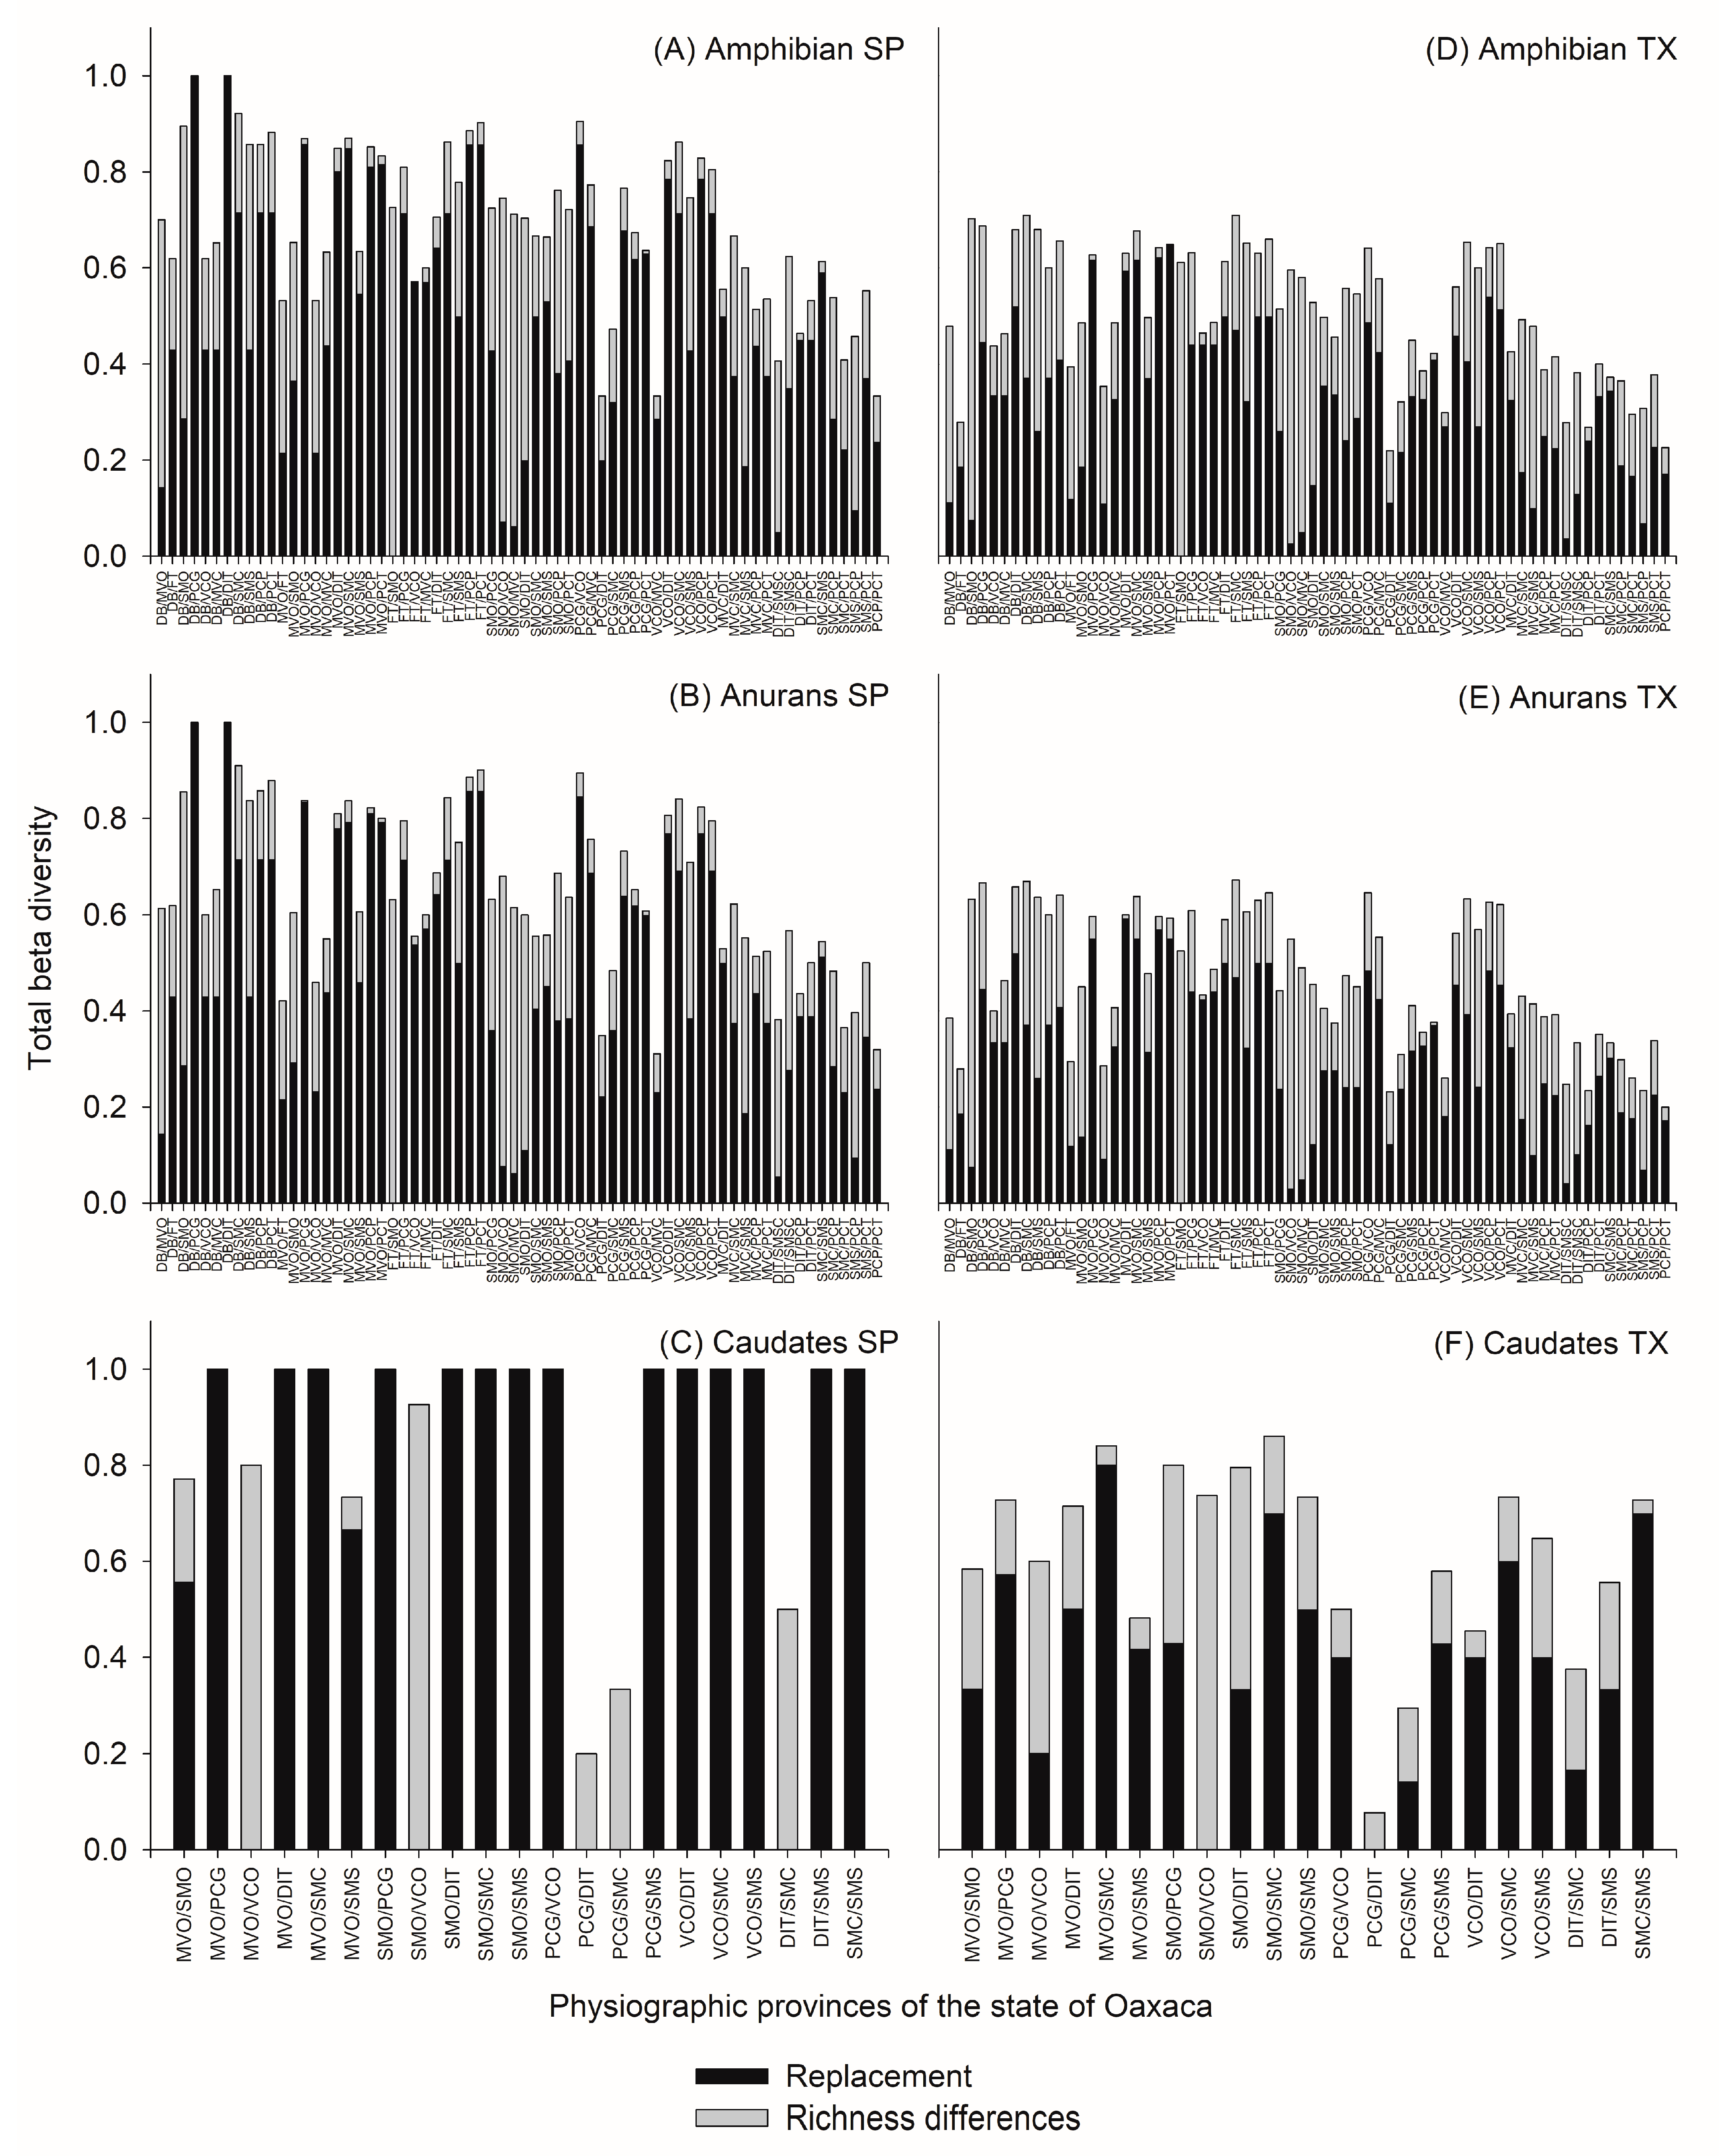
3.3. Beta Diversity of Amphibians between Pairwise of Physiographic Subprovinces

The total beta diversity of amphibians presented the highest values between DB/PCG and DB/DIT (βSOR = 1 for both pairs, the DB/SMC βSOR = 0.92), and between FT/PCT and PCG/VCO (βSOR = 0.90 for both pairs, Figure 3). The highest turnover occurred between DB/PCG and DB/DIT (βSIM = 1.0), and another 10 pairs showed values greater than 80% (βSIM = 0.80), with MVO being involved in five pairs. For the differences in richness, the highest dissimilarity value was obtained between FT and SMO (βSNE = 0.72).
For the anurans, 19 pairs showed values above 80%, with the highest being between DB/PCG and DB/DIT (βSOR = 1 for both pairs) and between DB/SMC and FT/PCT (βSOR = 0.90 for both pairs). With respect to turnover, the highest values were between DB/PCG and DB/DIT (βSIM = 1.0), followed by those between FT/PCP and FT/PCT (βSIM = 0.85 for both). The differences in richness had their highest value between FT and SMO (βSNE = 0.63). The caudates did not have records in five subprovinces, so 21 pairs of 66 possible pairs were analyzed because, when comparing subprovinces with and without caudates, the maximum possible beta diversity originated from the effect of the differences in richness; however, when they were eliminated from the analysis, 14 pairs showed the maximum beta diversity (βSOR = 1) caused by turnover (βSIM = 1 and βSNE = 0). The highest values of the differences in richness were found between SMO/VCO and MVO/VCO (βSNE = 0.92 and βSNE = 0.8; Figure 3, caudates SP).

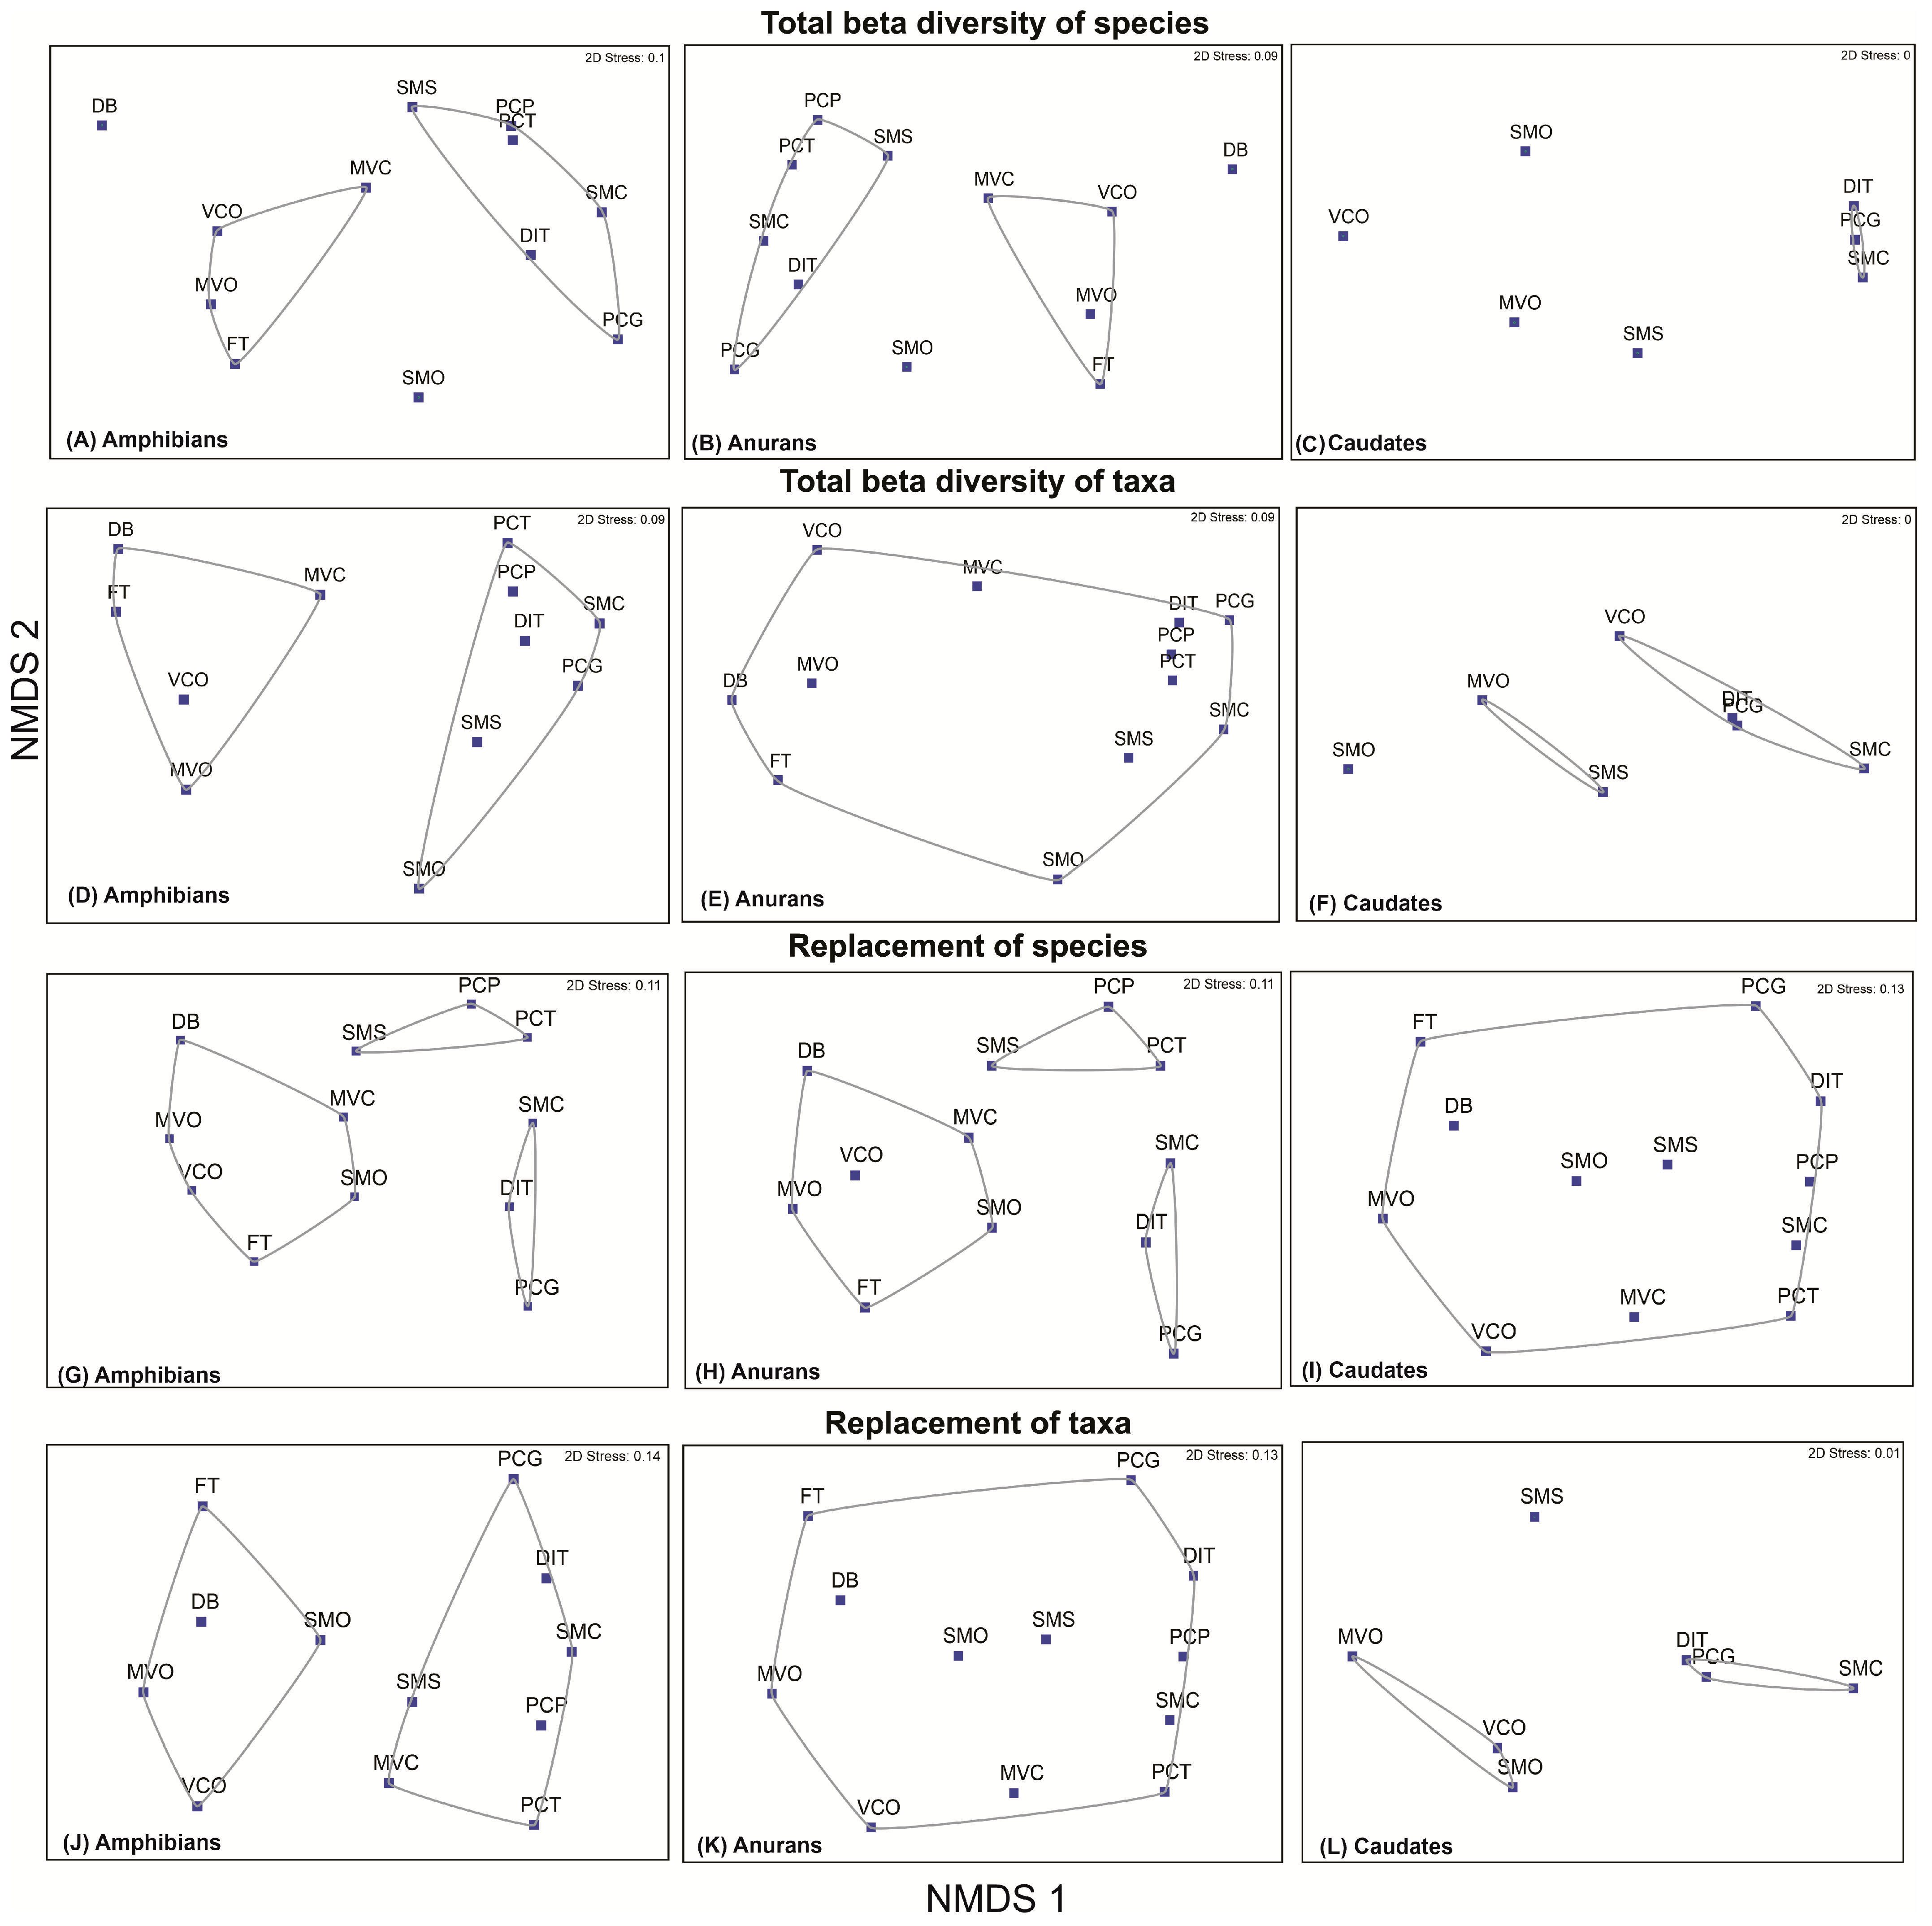
3.4. Determination of Beta Diversity of Species and Higher Taxa

For the total beta diversity of amphibian species, the cluster analysis shows that three groups were formed with a similarity of 0.40 (SMO, DB, VCO, MVC, MVO and FT; SMS, PCP and PCT; and SMC, PCG and DIT), and for the total beta taxonomic diversity, two groups were formed (Figure 4). In the case of anurans, at the species level, two groups were formed with a similarity of 40% (MVO, MVC, FT and VCO; and PCT, PCP, SMS, SMC, DIT and PCG). For the caudates, a group formed with a similarity of 60% (DIT, PCG, and SMC), and the remaining species were not grouped (Figure 4). For the total beta taxonomy, two groups were formed (Figure 4). Regarding the turnover of species and higher taxa of all amphibians, two groups were distinguished with a similarity of 0.60 (MVO, MVC, FT and VCO; and PCT, PCP, SMS, SMC, DIT and PCG). For the replacement of anurans, three groups formed with a similarity of 0.40 (PCP, PCT and SMS; DIT, PCG and SMC; and MVO, MVC, FT, VCO, DB and SMO). For the caudates, two groups formed (SMO, VCO and MVO; and DIT, SMC and PCG), as occurred for the replacement of higher taxa (Figure 4). For the differences in richness of amphibians, anurans and caudates at the level of species and higher taxa, a group with a similarity of 0.40 was formed.

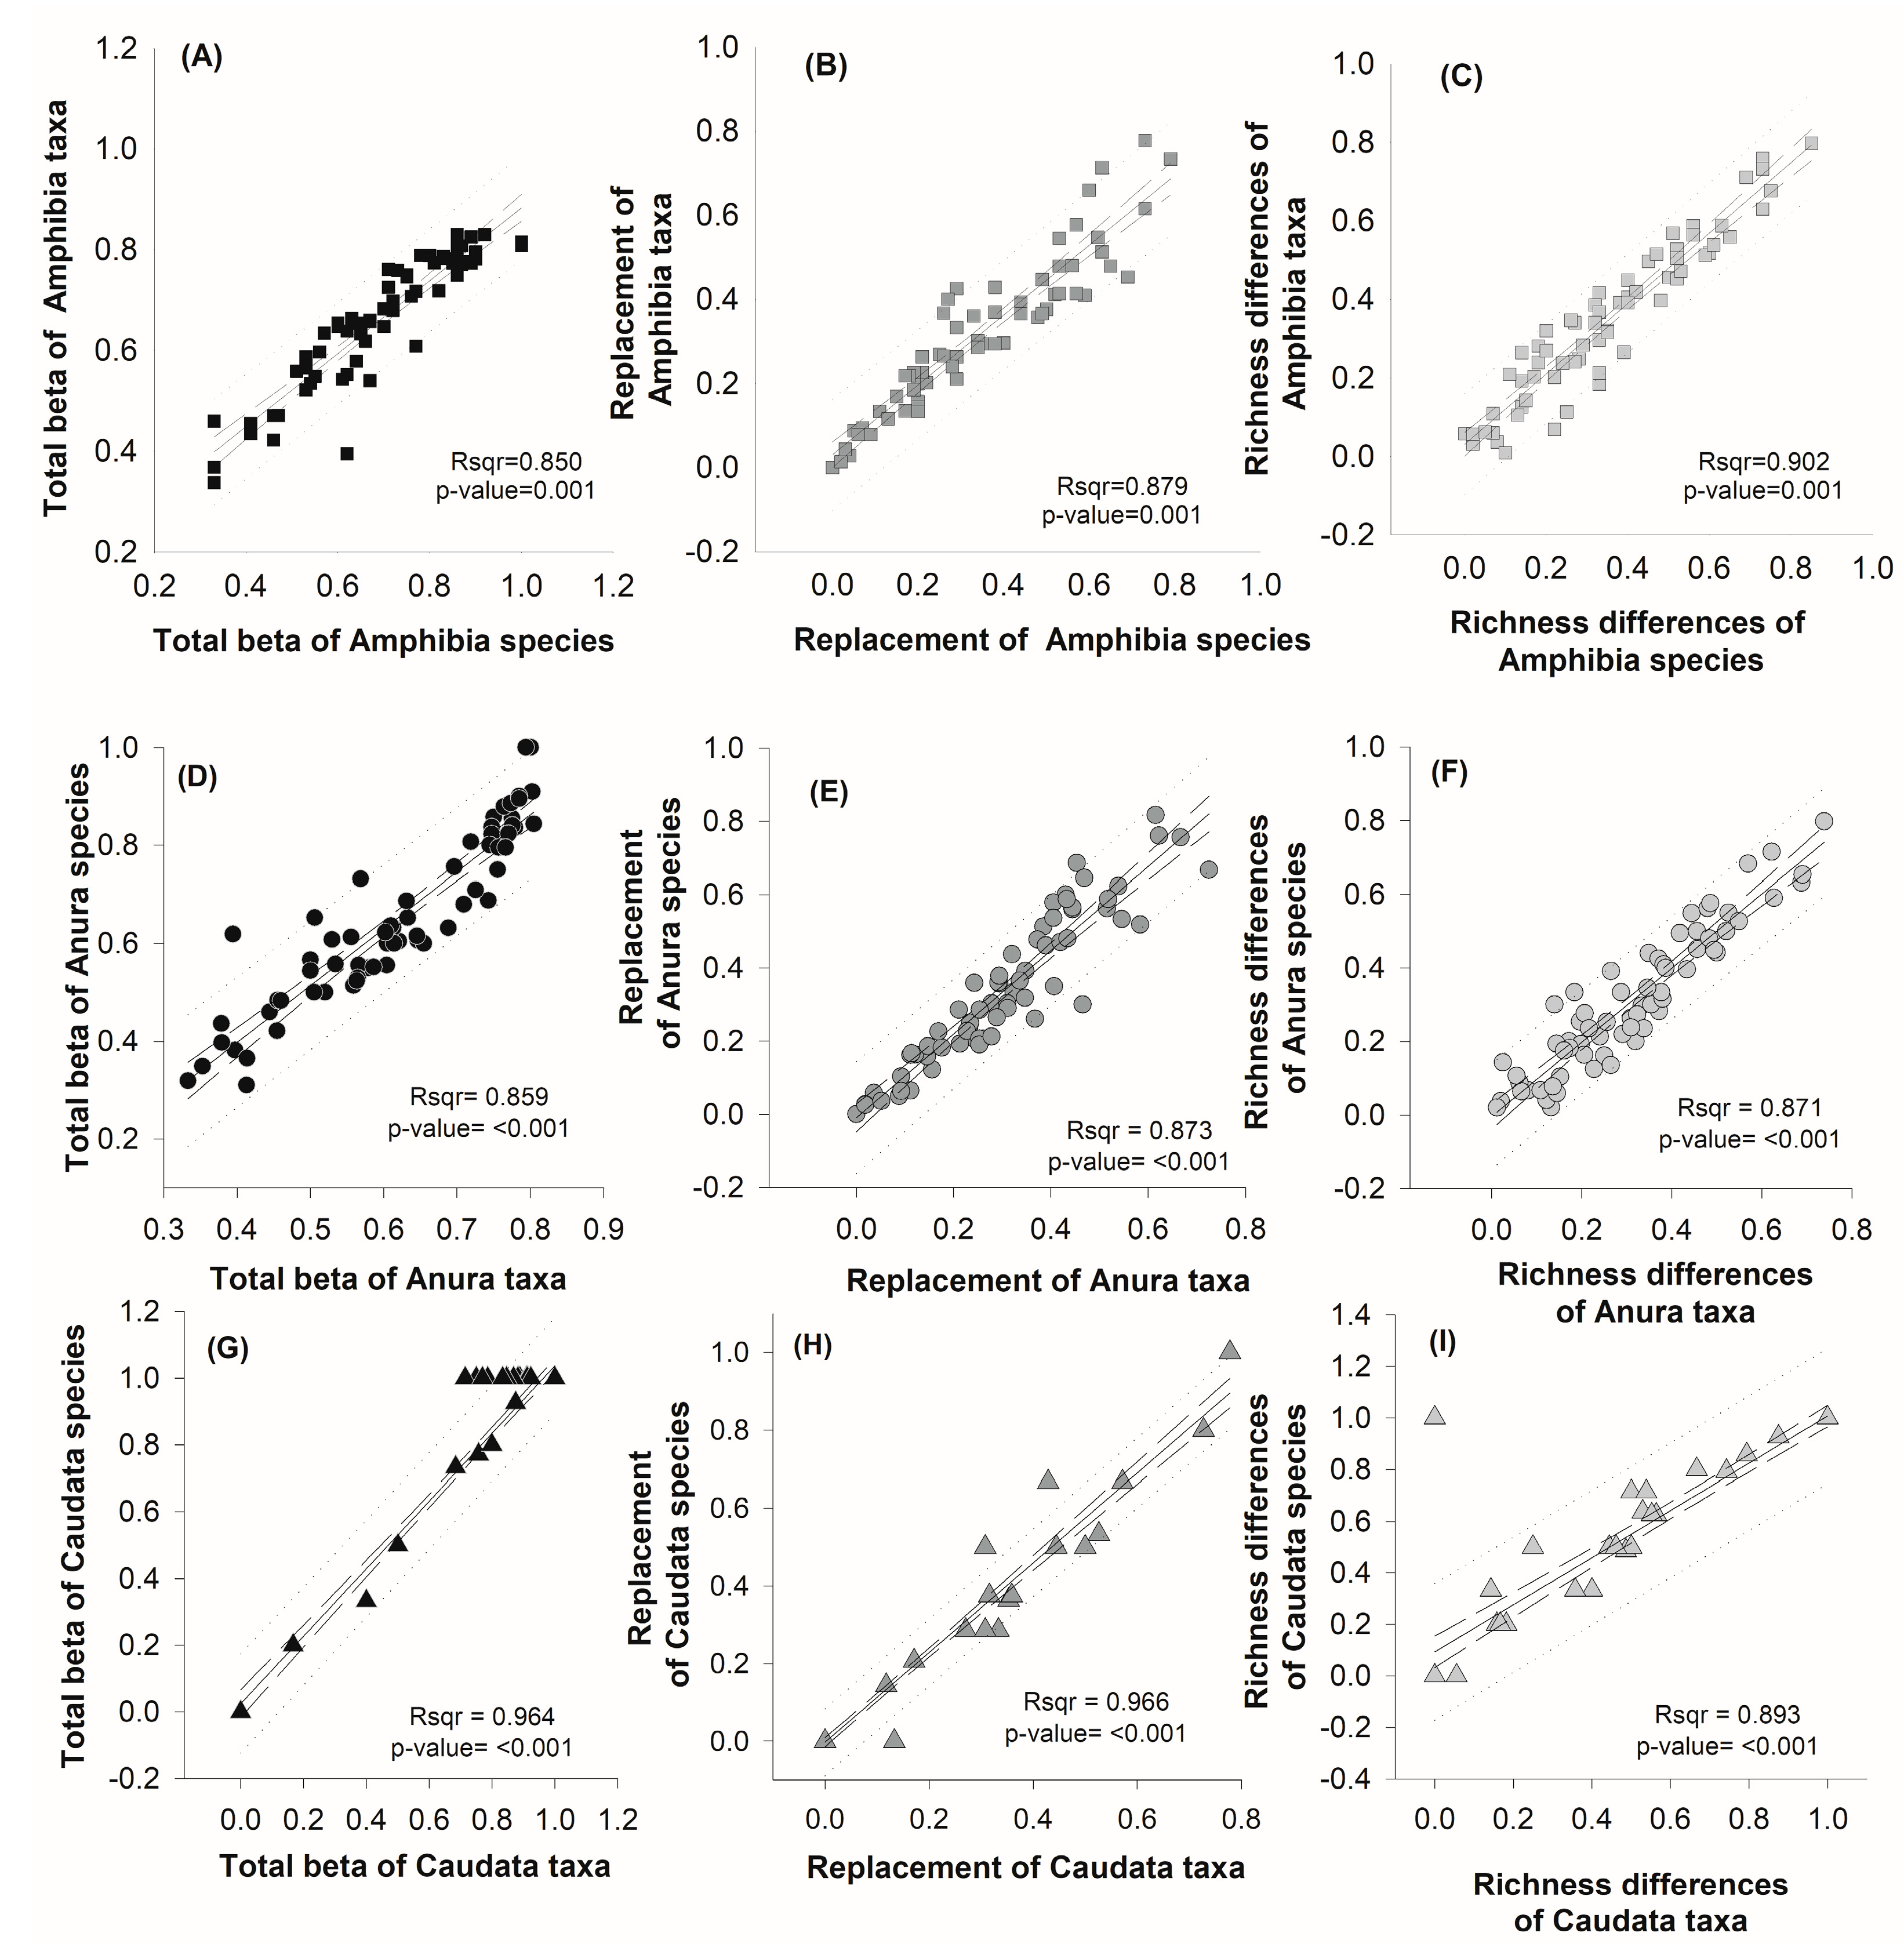
3.5. Relationship between Beta Diversity of Species and Higher Taxa of amphibians from Oaxaca

The total taxonomic beta diversity followed the same trend as that of the beta diversity of species since both were positively and significantly related for all amphibians (r2 = 0.85 p < 0.0001), as were turnover (r2 = 0.88, p < 0.0001) and differences in richness (r2 = 0.90, p < 0.0001), indicating that species diversity can be represented by the diversity of higher taxa in future analyses where information at the species level is not available. The same result was obtained for anurans (total beta: r2 = 0.86, p < 0.0001; turnover: r2 = 0.86, p < 0.0001; differences in richness: r2 = 0.87, p < 0.0001); however, in the caudates, this relationship was less robust (total beta: r2 = 0.70, p < 0.0002; turnover: r2 = 0.65, p < 0.0001; differences in richness: r2 = 0.40, p < 0.0065), probably due to the high species richness and the low richness of higher taxa in this order (Figure 5).

4. Discussion

Among the states in Mexico, Oaxaca has the highest amphibian richness and endemism, surpassing the endemism of amphibians recorded in 13 countries on the same continent [21]. According to our results, this amphibian richness in Oaxaca is related to the size of the physiographic subprovinces, given the species–area relationships initially proposed for island biogeography [22], which is recognized as one of the patterns of global diversity [23,24]. This same species–area relationship has been recorded for the herpetofauna of the Caribbean Islands [22] and the Marias Islands in the Mexican Pacific [25] and for the reptiles of the islands of Mexico [26], as well as for amphibians and reptiles in tropical forest fragments [27,28,29]. In addition to the size of the area, factors such as temperature, precipitation, humidity and environmental heterogeneity are factors that influence amphibian richness [9,10,28,29,30].
The total beta diversity was high for all amphibians, anurans and caudates, with dissimilarity values greater than 85% in all cases; however, dissimilarity values were higher for the caudates than for the anurans. This result is consistent with the higher beta diversity values of 80% recorded for amphibians at the continental [10] and national scales [7,8,9]. The same trend was found for taxonomic beta diversity, although with lower values, indicating that the amphibian faunas present in the 12 subprovinces in Oaxaca drastically change their composition both at the level of species and at the level of higher taxa. The total beta diversity of amphibian species between the pairs of subprovinces also showed generally high values (>80%), indicating a high rate of change between the composition of the amphibian communities between these units. Similar results were obtained by Mata-Silva et al. [11], who used the biogeographic similarity coefficient for the entire state for the herpetofauna in these same subprovinces, and they found that 48% of the possible combinations presented dissimilarities greater than 80%. The coincidence of some our results with those of Mata Silva et al. [11] reflects a general trend at the state level due to the complex physiography of Oaxaca, which causes the physiographic subprovinces to present well-differentiated faunas with high dissimilarity for amphibians, as shown in our study, and low similarity for amphibians and reptiles together, as shown by Mata Silva et al. [11], who calculated the similarity and obtained very low values in 48% of the pairs of subprovinces they analyzed (20% similarity on average), and we obtained very high dissimilarity values (an average of 80%). This shows that both studies present related results, since similarity and dissimilarity are inversely proportional. However, we decided to implement a different analysis that would provide more information in addition to the single measure of similarity between pairs of subprovinces, having the following differences: (1) The similarity coefficient used by Mata-Silva et al. [11] is little known, and it has not been statistically evaluated as the dissimilarity method of Baselga [12] has been. Thus, it has received criticism [14,15], which has caused improvements to the extent that, today, it is recognized as a novel and reliable method that is widely used in numerous beta diversity studies [16,31]. (2) In our study, we carried out a dissimilarity analysis based on the components of replacement and differences in richness between subprovinces; therefore, the method we used allowed us to recognize the underlying processes that determine the beta diversity of amphibians. (3) Furthermore, the analyzes were performed only for amphibians, and for anurans and caudates independently, as we consider that reptiles have different environmental requirements and should not be analyzed together with amphibians. (4) Here, we demonstrate, for the first time, that, at the level of subprovinces, in Oaxaca, there is greater beta diversity of salamanders than of frogs due to greater endemism and smaller distribution areas in the caudates. (5) In addition, we carried out the analyses both for all subprovinces together (βSOR) and for pairs of subprovinces (βSOR), so we have results at different scales (state and regional). (6) they also did not test whether beta diversity for taxa higher than the species level (genus, subfamily, family and order) follows the same trend as at the species level and whether higher taxa can be used as surrogates for the species. (7) Finally, they also did not group the subprovinces that presented dissimilarity values.
The highest dissimilarities for amphibians in this study were found between DB and other subprovinces, such as FT, PCT, PCG, SMO and VCO [11]. In addition, Calderón-Patrón et al. [32,33] obtained similar dissimilarity values for the beta diversity of species and higher taxa of amphibians between pairs of ecoregions in Hidalgo and between pairs of quadrants at three scales on the Isthmus de Tehuantepec, and Juárez-Ramírez et al. [34] obtained similar values at the local level among the amphibians of three natural protected areas (NPAs) in the state of Veracruz, recording total beta diversity in the three parks ranging from 60 to 100%.
In comparison to the differences in richness, turnover contributed more to the total beta diversity of species and taxonomic beta diversity for amphibians, anurans and caudates, with the dissimilarity being higher in caudates, indicating that species substitution between subprovinces is the mechanism that causes variation in the species composition of the analyzed regions. These results are consistent with those recorded for amphibians in some regions of America [10]; those recorded at the state level among ecoregions within the state of Hidalgo [33]; and those of Sonora, México, where the highest α and β-diversity values occur in the middle-humidity range, as well in the transitional-climate categories, and the greatest β-diversity was aggregated in patches in the western portion of the state in mountains with temperate climates [34]. Also, in this work, the authors found a strong association between beta diversity and the climate and soil moisture categories rather than physiographic categories [34]. The same results were obtained at the local level among the amphibians from three NPAs in the state of Veracruz, with a total beta diversity ranging from 60 and 100% [35,36]. In two pairs, turnover was more important than the differences in richness, and the opposite occurred in one pair [35]. Moreover, in the three private NPAs in Veracruz, amphibians presented a relatively low dissimilarity values in species composition (values of βcc between 0.27 and 0.48), mainly due to species replacement, with values between 18 and 28% [36]. However, on the Isthmus of Tehuantepec, at fine and medium scales, both components contributed similar amounts [32]. In the case of the differences in richness, their contribution to the total beta diversity did not exceed 13% in any group analyzed, which reflects that there is a very high substitution of species among the subprovinces. These results seem to be influenced by historical and spatial factors [10], such as the Pleistocene glaciations, which caused amphibians to use shelters to survive at high latitudes, where the temperature decreased; subsequently, as the planet warmed, the surviving species dispersed and repopulated this region, while, in the areas near the equator, this phenomenon was less common, which caused the beta diversity of amphibians to be dominated by turnover below the 37th parallel and by differences in richness about this parallel [10].
Regarding the turnover between subprovinces, MVO, DB and FT presented the highest values. These results may be due to several factors, such as differences in temperature, precipitation and environmental heterogeneity (altitudinal gradient and number of plant communities) between subprovinces [9,10,30,32,33]. In addition, the geographical distance that exists between the subprovinces is also important, since it can cause the phenomenon of distance decay in similarity, indicating that the further apart in geographical distance two communities are, the greater the difference in species composition between them [22,23,24,26,33,37]. Another important factor is the size of the area of the subprovinces, because, as established by the theory of island biogeography, and as we verified in this work with the correlations between the size of the subprovince and its richness, the larger the size of the area, the greater number of species it will have [22,23,24,25,26]. Finally, the number of records and collections in each subprovince could be important, like in the case of DB subprovince, which presents a minor area and very few records and collections, indicating low richness (seven species) and important differences in composition and richness in respect to other subprovinces, like SMO (88 species) [32,33].
The dissimilarity of salamanders between subprovinces was greater than anurans and was explained mainly by replacement. We consider these results to be mainly caused by a high degree of endemism, specialized microhabitats and restricted distributions, which are associated with differences in precipitation, temperature and environmental heterogeneity (altitude, vegetation types, level of conservation, etc.) between subprovinces [9,30,32,33,34]. However, in addition to this, salamanders are generally more difficult to find than anurans since they have smaller distribution areas and very particular microhabitats, so many are endemic to small localities and so finding them requires the experience of researchers. For these reasons, they may be undersampled, and it is possible that, as sampling increases, their records in the state will increase, changing their distributions at the subprovince level and modifying beta diversity values [32,33]. In Mexico, the beta diversity of amphibians is associated with the heterogeneity of precipitation [9], which is related to their reproduction water requirements since adults need environmental humidity and colder temperatures to survive [30]. Thus, a greater spatial variation in precipitation within a region indicates a greater variation in local conditions and, therefore, the possibility that numerous species of amphibians inhabit a restricted subset of the region [9]. Results related were obtained by Dalmolin et al. [38], who evaluated the beta diversity of amphibians in different pools in Brazil and determined that total beta diversity and turnover were related to the depth and vegetation of the pools.
Amphibians are the most threatened class of terrestrial vertebrates in terms of conservation [1,3], and according to Alroy [39], at the global level, the extinction of amphibians has accelerated since the 1980s and 1990s, with between 28 and 201 species going extinct and a current extinction probability for frogs of 66.1% [40]. Unfortunately, globally, Mesoamerica has the second highest probability of frogs going extinct, at 17.74%, with the main causes being deforestation, the introduction and expansion of the distribution of exotic species and the presence of the fungus Batrachochytrium dendrobatidis [3,39,40]. Previous authors estimated the environmental vulnerability score for the amphibians of Mexico and determined that salamanders are the most threatened order, with 87% of them having a high environmental vulnerability; at the same time, 42.6% of anurans have a high environmental vulnerability. Within the Plethodontidae family, some genera in Mexico face critical conservation problems, as indicated by the high proportion of threatened species: Thorius (96%), Chiropterotriton (83%) and Pseudoeurycea (78%) [5].
At a local scale, in the particular case of the conservation of amphibians in the state of Oaxaca, we consider that it is necessary that greater government efforts be made to protect the species since, of the 158 amphibian species recorded in Oaxaca, only 58 are considered in NOM-059 by the Secretariat of Environment and Natural Resources SEMARNAT [41], and 91 species have not been evaluated. In addition, 56.5% of the amphibians endemic to the area are not under any conservation category [11]. Despite the complex scenario for amphibians, it is noted that, in Oaxaca, the SMO subprovince implements successful conservation actions in most of its territory based on the efforts of local communities [42]. This information is important because it is the most important subprovince for the conservation of amphibians at the state level, as it has the greatest richness (88 species) and endemism (43 species) levels in Mexico; this subprovince contains 95% of the caudates endemic to Mexico and 80.5% of those endemics to Oaxaca. The same observation was found by Mata-Silva et al. [11] for all herpetofauna since the SMO contains the greatest total number of species at 216, of which 88 are amphibians. High richness levels of vascular plants, gymnosperms, oaks, birds and mammals have also been found in this subprovince [7,42,43,44,45]. Although the SMO is the best-preserved region of Oaxaca, 10 species of anurans are experiencing declines in their populations, and 11 anurans in MVC and SMS are also experiencing declining populations [46]; in addition, salamanders of the genus Thorius have been evaluated as critically endangered, endangered and threatened according to the IUCN [4,47], and the high-mountain Pseudoeurycea species of Cerro San Felipe have not been observed recently despite search efforts [48]. Given the great relevance of these regions, it is necessary to conduct studies that determine conservation areas and evaluate the population status of endemic or threatened species. Conducting biodiversity studies considering other dimensions, such as functional and phylogenetic diversity, is also necessary to design better management and conservation strategies in this territory.

Supplementary Materials

The following supporting information can be downloaded at: https://www.mdpi.com/article/10.3390/d16040224/s1. Table S1: Partitions of beta diversity of Amphibia between pairs of physiographic provinces of the state of Oaxaca; Table S2: Partitions of beta diversity of Anura between pairs of physiographic subprovinces of the state of Oaxaca; Table S3: Partitions of beta diversity of Caudata between pairs of physiographic subprovinces of the state of Oaxaca; Table S4: Partitions of taxonomic beta diversity of Amphibia between pairs of physiographic subprovinces of the state of Oaxaca; Table S5: Partitions of taxonomic beta diversity of Anura between pairs of physiographic provinces of the state of Oaxaca; Table S6: Partitions of taxonomic beta diversity of Caudata between pairs of physiographic subprovinces of the state of Oaxaca.

Author Contributions

J.M.C.-P. and K.E.P.-J. designed the work, performed the statistical analyses and wrote the manuscript; J.T.-L. and E.P.C.-G. contributed to the design and wrote the document. All authors have read and agreed to the published version of the manuscript.

Funding

This research was supported by project 249713 of the Programa de Fortalecimiento de la Investigación y el Posgrado [Research and Postgraduate Strengthening Program] of the Universidad de Guadalajara awarded to the Laboratorio de Ecología, Paisaje y Sociedad [Ecology, Landscape and Society Laboratory], CUCOSTA UdeG.

Institutional Review Board Statement

Not applicable.

Data Availability Statement

Data are contained within the article and Supplementary Materials.

Acknowledgments

The authors are grateful to all reviewers for their comments and suggestions to improve this manuscript.

Conflicts of Interest

The authors declare no conflict of interest.

References

  1. Ramírez-Bautista, A.; Torres-Hernández, L.A.; Cruz-Elizalde, R.; Berriozabal-Islas, C.; Hernández-Salinas, U.; Wilson, L.D.; Johson, J.D.; Porras, L.W.; Balderas-Valdivia, C.J.; Gonzalez-Hernández, A.J.X.; et al. An updated list of the Mexican herpetofauna: With a summary of historical and contemporary studies. ZooKeys 2023, 1166, 287–306. [Google Scholar] [CrossRef]
  2. Mata-Silva, V.; García-Padilla, E.; Rocha, A.; Desantis, D.L.; Johnson, J.D.; Ramírez-Bautista, A.; Wilson, L.D. A reexamination of the herpetofauna of Oaxaca, Mexico: Composition update, physiographic distribution, and conservation commentary. Zootaxa 2021, 4996, 201–252. [Google Scholar] [CrossRef]
  3. Parra-Olea, G.; Flores-Villela, O.; Mendoza-Almeralla, C. Biodiversity of amphibians in Mexico. Rev. Mex. Biodivers. 2014, 85, 460–466. [Google Scholar] [CrossRef]
  4. Wake, D.; Vredenburg, V.T. Are we in the midst of the sixth mass extinction? A view from the world of amphibians. Proc. Natl. Acad. Sci. USA 2008, 115, 11466–11473. [Google Scholar] [CrossRef] [PubMed]
  5. García-Bañuelos, P.; Rovito, S.M.; Pineda, E. Representation of Threatened Biodiversity in Protected Areas and Identification of Complementary Areas for Their Conservation: Plethodontid Salamanders in Mexico. Trop. Conserv. Sci. 2019, 12, 1940082919834156. [Google Scholar] [CrossRef]
  6. Lips, K.R.; Burrowes, P.A.; Mendelson, J.R.; Parra Olea, G. Amphibian population declines in latin America: A synthesis. Biotropica 2005, 37, 222–226. [Google Scholar] [CrossRef]
  7. Koleff, P.; Soberón, J.; Arita, H.; Dávila, P.; Flores-Villela, O.; Halffter, G.; Lira-Noriega, A.; Moreno, C.E.; Moreno, E.; Munguía, M.; et al. Patrones de diversidad espacial en grupos selectos de especies. In Capital Natural de México, Vol. I: Conocimiento Actual de la Biodiversidad; Ciudad de México: México, Spain, 2008; pp. 323–364. [Google Scholar]
  8. Ochoa-Ochoa, L.M.; Munguía, M.; Lira-Noriega, A.; Sánchez-Cordero, V.; Flores-Villela, O.; Navarro-Sigüenza, A.; Rodríguez, P. Spatial scale and β-diversity of terrestrial vertebrates in Mexico. Rev. Mex. Biodivers. 2014, 85, 918–930. [Google Scholar] [CrossRef]
  9. Rodríguez, P.; Ochoa-Ochoa, L.M.; Munguía, M.; Sánchez-Cordero, V.; Navarro-Sigüenza, A.; Flores-Villela, O.; Nakamura, M. Environmental heterogeneity explains coarse-scale β-diversity of terrestrial vertebrates in Mexico. PLoS ONE 2019, 14, e0210890. [Google Scholar] [CrossRef]
  10. Baselga, A.; Gómez-Rodríguez, C.; Lobo, J.M. Historical legacies in world amphibian diversity revealed by the turnover and nestedness components of beta diversity. PLoS ONE 2012, 7, e32341. [Google Scholar] [CrossRef] [PubMed]
  11. Mata-Silva, V.; Johnson, J.D.; Wilson, D.; García-Padilla, E. The herpetofauna of Oaxaca, Mexico: Composition, physiographic distribution, and conservation status. Mesoamerican Herpetol. 2015, 2, 6–62. [Google Scholar]
  12. Baselga, A. Partitioning the turnover and nestedness components of beta diversity. Glob. Ecol. Biogeogr. 2010, 19, 134–143. [Google Scholar] [CrossRef]
  13. Baselga, A. The relationship between species replacement, dissimilarity derived from nestedness, and nestedness. Glob. Ecol. Biogeogr. 2012, 21, 1223–1232. [Google Scholar] [CrossRef]
  14. Carvalho, J.C.; Cardoso, P.; Gomes, P. Determining the relative roles of species replacement and species richness differences in generating beta-diversity patterns. Glob. Ecol. Biogeogr. 2012, 21, 760–771. [Google Scholar] [CrossRef]
  15. Carvalho, J.C.; Cardoso, P.; Borges, P.A.V.; Schmera, D.; Podani, J. Measuring fractions of beta diversity and their relationships to nestedness: A theoretical and empirical comparison of novel approaches. Oikos 2013, 122, 825–834. [Google Scholar] [CrossRef]
  16. Baselga, A.; Leprieur, F. Comparing methods to separate components of beta diversity. Methods Ecol. Evol. 2015, 6, 1069–1079. [Google Scholar] [CrossRef]
  17. Cardoso, P.; Rigal, F.; Carvalho, J.C. BAT—Biodiversity Assessment Tools, an R package for the measurement and estimation of alpha and beta taxon, phylogenetic and functional diversity. Methods Ecol. Evol. 2015, 6, 232–236. [Google Scholar] [CrossRef]
  18. R Core Team. R: A Language and Environment for Statistical Computing. Computer Software v4.03. ISBN 3-900051-07-0. 2018. Available online: https://www.r-project.org/ (accessed on 27 March 2021).
  19. Bacaro, G.; Ricotta, C.; Mazzoleni, S. Measuring beta-diversity from taxonomic similarity. J. Veg. Sci. 2007, 18, 793–798. [Google Scholar] [CrossRef]
  20. Clarke, K.R.; Gorley, R.N. Primer: User Manual/Tutoriall; Primer-E Ltd.: Plymouth, UK, 2015. [Google Scholar]
  21. IUCN. The IUCN Red List of Threatened Species. 2019. Available online: https://www.iucnredlist.org/resources/summary-statistics.2019 (accessed on 20 January 2021).
  22. MacArthur, R.H.; Wilson, E.O. The Theory of Island Biogeography; Princeton University Press: Princeton, NJ, USA, 1967. [Google Scholar]
  23. Rosenzweig, M.L. Species Diversity in Space and Time; Cambridge University Press: Cambridge, UK, 1995. [Google Scholar]
  24. Gaston, K.J. Global Patterns in Biodiversity. Nature 2000, 405, 220–227. [Google Scholar] [CrossRef] [PubMed]
  25. Casas-Andreu, G. Amphibians and reptiles of the Marías Islands and other adjacent islands off the coast of Nayarit, Mexico. Aspects about its biogeography and conservation. An. Del Inst. De Biol. Ser. Zool. 1992, 63, 95–112, (Spanish version). [Google Scholar]
  26. Calderón-Patrón, J.M. Island Biogeography: The Case of the Mexican Herpetofauna. Master’s Thesis, Universidad Autónoma del Estado de Hidalgo, México, Spain, 2007. (Spanish version). [Google Scholar]
  27. Bell, K.E.; Donnelly, M.A. Influence of forest fragmentation on community structure of frogs and lizards in northeastern Costa Rica. Conserv. Biol. 2006, 20, 1750–1760. [Google Scholar] [CrossRef] [PubMed]
  28. Cabrera-Guzmán, E.; Reynoso, V.H. Amphibian and reptile communities of rainforest fragments: Minimum patch size to support high richness and abundance. Biodivers. Conserv. 2012, 21, 3243–3265. [Google Scholar] [CrossRef]
  29. Russildi, G.; Arroyo-Rodríguez, V.; Hernández-Ordóñez, O.; Pineda, E.; Reynoso, V.H. Species- and community-level responses to habitat spatial changes in fragmented rainforests: Assessing compensatory dynamics in amphibians and reptiles. Biodivers. Conserv. 2016, 25, 375–392. [Google Scholar] [CrossRef]
  30. Vitt, L.J.; Caldwell, J.P. Herpetology: An Introductory Biology of Amphibians and Reptiles, 4th ed.; Elsevier Inc.: Norman, OK, USA, 2014. [Google Scholar]
  31. Shi, X.; Zhao, Y.; Chen, C.H.; Ren, P.; Zeng, D.; Wu, L.; Ding, P. Beta-diversity partitioning: Methods, applications and perspectives. Biodivers. Sci. 2017, 25, 464–480. [Google Scholar]
  32. Calderón-Patrón, J.M.; Moreno, C.E.; Pineda-López, R.; Sánchez-Rojas, G.; Zuria, I. Vertebrate dissimilarity due to turnover and richness differences in a highly beta-diverse region: The role of spatial grain size, dispersal ability and distance. PLoS ONE 2014, 8, e82905. [Google Scholar] [CrossRef]
  33. Calderón-Patrón, J.M.; Goyenechea, I.; Ortiz-Pulido, R.; Castillo-Cerón, J.; Manríquez, N.; Ramírez-Bautista, A.; Rojas-Martínez, A.E.; Sánchez-Rojas, G.; Zuria, I.; Moreno, C.E. Beta diversity in a highly heterogeneous area: Disentangling species and taxonomic dissimilarity for terrestrial vertebrates. PLoS ONE 2016, 11, e0160438. [Google Scholar] [CrossRef]
  34. Serrano, J.M.; Berlanga-Robles, C.A.; Ruíz Luna, A. High amphibian diversity related to unexpected environmental values in a biogeographic transitional area in north western Mexico. Contrib. Zool. 2014, 83, 151–166. [Google Scholar] [CrossRef]
  35. Juárez-Ramírez, C.M.; Aguilar-López, J.L.; Pineda, E. Protected natural areas and the conservation of amphibians in a highly transformed mountainous region in Mexico. Herpetol. Conserv. Biol. 2016, 11, 19–28. [Google Scholar]
  36. Aguilar-López, J.L.; Ortiz Lozada, L.; Pelayo-Martínez, J.; Mota-Vargas, C.; Alarcón-Villegas, L.E.; Demeneghi-Calatayud, A.P. Diversity and conservation of amphibians and reptiles in a private protected area of a highly transformed region in southern Veracruz, Mexico. Acta Zool. Mex. 2020, 36, 1–14, (Spanish version). [Google Scholar] [CrossRef]
  37. Calderón-Patrón, J.M.; Moreno, C.E.; Zuria, I. Diversidad beta: Medio siglo de avances. Rev. Mex. Biodivers. 2012, 83, 879–891. [Google Scholar] [CrossRef]
  38. Dalmolin, D.A.; Tozetti, A.M.; Pereira, M.J.R. Taxonomic and functional anuran beta diversity of a subtropical metacommunity respond differentially to environmental and spatial predictors. PLoS ONE 2019, 14, e0214902. [Google Scholar] [CrossRef] [PubMed]
  39. Alroy, J. Current extinction rates of reptiles and amphibians. Proc. Natl. Acad. Sci. USA 2015, 112, 13003–13008. [Google Scholar] [CrossRef] [PubMed]
  40. McCallum, M.L. Amphibian decline or extinction? Current declines dwarf background extinction rate. J. Herpetol. 2007, 41, 483–491. [Google Scholar] [CrossRef]
  41. SEMARNAT. Secretaria de Medio Ambiente y Recursos Naturales. In Mexican Official Standard NOM-059-SEMARNAT-2010, Environmental Protection–Mexican Native Species of Wild Flora and Fauna–Risk Categories and Specifications for Inclusion, Exclusion or Change–List of Species at Risk; Diario Oficial de la Federación 14 Noviembre: México, Spain, 2019; (Spanish version). [Google Scholar]
  42. Monroy-Gamboa, A.G.; Sánchez-Cordero, V.; Briones-Salas, M.; Lira-Sadee, R.; Maass-Moreno, J.M. Representativeness of vegetation types in different conservation initiatives in Oaxaca, Mexico. Bosque 2015, 36, 199–210, (Spanish version). [Google Scholar] [CrossRef]
  43. Ramírez-Toro, W.; Torres-Miranda, A.; González-Rodríguez, A.; Ruíz-Sánchez, E.; Luna-Vega, I.; Oyama, K. A multicriteria analysis for prioritizing areas for conservation of oaks (Fagaceae: Quercus) in Oaxaca, Southern Mexico. Trop. Conserv. Sci. 2017, 10, 1940082917714227. [Google Scholar] [CrossRef]
  44. García-Mendoza, A. Integration of floristic knowledge of the State. In Biodiversity of Oaxaca; García-Mendoza, A., Ordoñez, M., Briones-Salas, M., Eds.; Instituto de Biología, UNAM-Fondo Oaxaqueño para la Conservación: México, Spain, 2004; pp. 305–325, (Spanish version). [Google Scholar]
  45. Contreras-Medina, R.; Luna-Vega, I. Species richness, endemism and conservation of Mexican gymnosperms. Biodivers. Conserv. 2007, 16, 1803–1821. [Google Scholar] [CrossRef]
  46. Lips, K.R.; Mendelson, J.R.; Muñoz-Alonso, A.; Canseco-Márquez, L.; Mulcahy, D.G. Amphibian population declines in montane southern Mexico: Resurveys of historical localities. Biol. Conserv. 2004, 119, 555–564. [Google Scholar] [CrossRef]
  47. Wake, D.B.; Papenfuss, T.J.; Lynch, J.F. Distribution of salamanders along elevational transects in Mexico and Guatemala. Tulane Publ. Zool. Bot. Suppl. Publ. 1991, 1, 303–319. [Google Scholar]
  48. Rovito, S.M.; Parra-Olea, G.; Vásquez-Almazán, C.R.; Papenfuss, T.J.; Wake, D.B. Dramatic declines in neotropical salamander populations are an important part of the global amphibian crisis. Proc. Natl. Acad. Sci. USA 2009, 106, 3231–3236. [Google Scholar] [CrossRef] [PubMed]
Figure 1. Map of subprovinces of Oaxaca: Balsas Depression (DB); Mountains and Valleys of the West (MVO); Tehuacán Trench (TT); Sierra Madre de Oaxaca (SMO); Gulf Coastal Plain (PCG); Central Valleys of Oaxaca (VCO); Mountains and Valleys of the Center (MVC); Isthmic Depression of Tehuantepec (DIT); Sierra Madre de Chiapas (SMC); Sierra Madre del Sur (SMS); Pacific Coastal Plain (PCP); and Tehuantepec Coastal Plain (PCT) [2,11].
Diversity 16 00224 g001
Figure 2. Total species and taxonomic beta diversity of amphibians, anurans and caudates among the 12 physiographic subprovinces of the state of Oaxaca. The replacement component contributes more to the total beta diversity of amphibians, both at the species and higher taxa levels. SP = species level; TX = higher taxa level.
Diversity 16 00224 g002
Figure 3. Total beta diversity of species and higher taxa of amphibians, anurans and caudates calculated by pairs of the 12 physiographic subprovinces of the state of Oaxaca. Total beta diversity of species: (A) amphibians, (B) anurans and (C) caudates. Total beta diversity of higher taxa: (D) amphibians, (E) anurans and (F) caudates. SP = species level; TX = higher taxa level.
Diversity 16 00224 g003
Figure 4. NMDS ordination analysis for the total species and taxonomic beta diversity, turnover and differences in richness for amphibians, anurans and caudates (that of caudates is new). (A) Total beta diversity of anuran species, (B) anuran species replacement, (C) differences in anuran species richness, (D) amphibian total taxonomic beta diversity, (E) anuran total taxonomic beta diversity, (F) caudates total taxonomic beta diversity, (G) amphibian replacement of species, (H) anuran replacement of species, (I) caudates replacement of species, (J) amphibian taxonomic replacement, (K) anurans taxonomic replacement and (L) caudate taxonomic replacement.
Diversity 16 00224 g004
Figure 5. Correlations between total beta diversity, turnover and differences in richness for species and higher taxa of all amphibians (AC), anurans (DF) and caudates (GI) from physiographic subprovinces in Oaxaca.
Diversity 16 00224 g005
Table 1. Area (km2), species richness (S) and number of endemics to Mexico and Oaxaca of amphibians, anurans and caudates for the 12 physiographic subprovinces of Oaxaca. Mx = México; Oax = Oaxaca.
AreaSpecies RichnessEndemic Species to Mexico and Oaxaca
Subprovinceskm2S AmphibiaS AnuraS CaudataS CaeciliansAmphibia Mx/OaxAnura Mx/OaxCaudata Mx/Oax
DB1788.1777005/05/00/0
MVO21,262.7333249027/1318/59/8
FT1134.211414007/07/00/0
SMO17,519.96886226062/4336/1926/24
PCG7975.922825304/12/12/0
VCO2267.4214131011/210/11/1
MVC6662.621616008/18/10/0
DIT2114.122018203/01/02/0
SMC5816.0844376111/017/04/1
SMS12,350.1549426132/1225/67/6
PCP9262.062121007/07/00/0
PCT4298.772726016/16/10/0
Table 2. Number of subprovinces occupied by endemic and nonendemic amphibian species for Mexico and Oaxaca.
No. SubprovincesNo EndemicsMexico EndemicsOaxaca EndemicsTotal
110234881
21211023
358215
44105
54307
63205
74307
81102
91001
103003
Total474260149
Table 3. Monthly and annual average of temperature and precipitation of subprovinces present in the state of Oaxaca. Temperature (in °C)/precipitation (in mm). Data taken from Mata-Silva et al. [11].
SUBPROVJANFEBMARAPRMAYJUNEJULYAUGSEPOCTNOVDECANNUAL
DB19.3/420.9/323.4/624.9/2825.4/7524.4/15623.3/13223.2/14522.8/16122.0/4520.5/619.4/122.5/762
MVO17.2/618.7/420.9/822.4/2023.2/7622.3/15521.4/11321.5/10321.1/14920.0/5218.4/1317.3/320.4/702
FT21.3/322.6/325.5/527.9/1228.5/3327.8/10426.1/11326.3/8426.1/10124.9/3022.9/821.7/425.1/500
SMO13.5/1414.9/1016.8/1317.3/3317.9/5416.7/17115.9/17116.0/15215.8/17814.9/8813.9/4514.1/2215.6/951
PCG21.4/3722.3/4124.4/3827.2/3628.4/9128.0/40226.6/51627.2/37726.7/44821.2/22523.2/8121.9/5624.9/2348
VCO17.5/219.0/521.1/1022.7/3222.9/7122.1/16121.1/10921.2/10720.9/12619.9/4118.5/917.6/320.4/676
MVC20.0/221.2/323.1/624.9/2125.6/5424.7/11324.0/8324.1/8123.6/10122.8/3221.5/720.4/223.0/505
DIT22.3/2523.1/2024.7/2326.5/2127.5/5626.5/21225.6/29225.9/28725.2/29524.4/14223.4/4722.6/3025.0/1450
SMC21.8/10722.9/5624.7/3426.4/3927.3/8026.3/27325.6/30225.9/35125.5/46224.4/28423.1/15422.2/11625.0/2258
SMS13.2/513.8/2114.5/1814.9/3914.9/12414.2/25813.9/20413.9/23213.6/23813.8/9313.5/1913.4/814.0/1259
PCP26.1/326.5/727.2/227.8/828.6/6528.1/16328.0/13828.2/24927.9/21727.2/8326.4/826.0/327.3/946
PCT24.8/425.6/427.1/329.0/629.6/5528.6/20128.3/13228.7/16027.7/23727.1/5826.1/1425.2/527.3/879
Disclaimer/Publisher’s Note: The statements, opinions and data contained in all publications are solely those of the individual author(s) and contributor(s) and not of MDPI and/or the editor(s). MDPI and/or the editor(s) disclaim responsibility for any injury to people or property resulting from any ideas, methods, instructions or products referred to in the content.

