Article

Disentangling the Effects of Climate and Land Uses on Small Mammals in Agroecosystems of NE Spain

1
BiBio Research Group Small Mammal Area, Natural Sciences Museum of Granollers, Francesc Macià 51, 08402 Granollers, Spain
2
Independent Researcher, Santiago 5, 5-C, 09400 Aranda de Duero, Spain
3
Independent Researcher, Barceloneta 24, 08552 Taradell, Spain
*
Author to whom correspondence should be addressed.
Diversity 2024, 16(6), 343; https://doi.org/10.3390/d16060343
Submission received: 23 May 2024 / Revised: 11 June 2024 / Accepted: 12 June 2024 / Published: 13 June 2024
(This article belongs to the Special Issue 2024 Feature Papers by Diversity’s Editorial Board Members)

Abstract

:
We analyzed the two main drivers (climate and land uses) shaping the composition of small mammal communities at 16 localities situated in the confluence of the Mediterranean and Eurosiberian regions (Barcelona, Spain). The study area represents a land use and land cover gradient showing urbanization and crop intensification in the lowlands and forest encroachment in mountain areas. We identified 2458 small mammal individuals of 12 different species from barn owl (Tyto alba) pellets. Three open-land species (Microtus duodecimcostatus, Crocidura russula, and Mus spretus) and one forest/generalist species (Apodemus sylvaticus) were dominant in the diet, accounting for 93% of prey. In order to disentangle the effects of both main drivers on the small mammal community, we used partial constrained ordination techniques, which allowed us to determine the pure effects (and shared effects) of the environmental factors. Land use predictors explained 33.4% of the variance (mostly crops), followed by 23.4% of the variance explained by the geo-climatic variables (mostly rainfall), and an additional 24.8% of the variance was shared by both groups of predictors, totaling 81.6% of environmental variance. The remaining 18.4% of variance was unexplained by environmental matrices. This pattern was consistent with expected associations of species and biotic influences at small spatial scales and highlighted that the number of species increased from the crops in the lowlands towards the highlands covered by deciduous and coniferous forests.

1. Introduction

The number of species and diversity of mammalian communities can be mostly determined by the characteristics of the sites where the different species appear, such as climate and habitat features [1,2], but also by other physical characteristics such as topography and landscape heterogeneity [3,4]. In the Iberian Peninsula, mammal species richness is concentrated in the north [5], and since this area is colder and wetter than the southern areas, climatic influences can be supposed to explain the biodiversity patterns [6], but other historical factors can be shaping the distribution range of the species [7]. The geographic range of a species reflects the suitability of the environmental conditions matching the species’ requirements [8], and abiotic factors (e.g., climate) are closely related to the distribution of species and normally used to predict their presence and forecast patterns of community change [9,10]. But abiotic gradients can limit distribution ranges directly, by delimiting in space the range of abiotic conditions in which the physiological requirements of the involved species can be met, or indirectly, by influencing biotic factors affecting habitat requirements such as food and shelter [8]. However, the relevance of both kinds of factors (abiotic vs. biotic) to the distribution of the species depends on the spatial scale considered. Indeed, on the global scale, climatic variables have more predictive power for species diversity than habitat cover features [11]. In contrast, on regional and local scales, land use and biotic interactions are more important than climate for predicting species richness [12].
Obtaining precise data on current small mammal distribution and increasing knowledge on vegetation-species associations is required for establishing conservation priorities and restoration efforts [13]. This information can be critical to understanding what will happen with species ranges in the face of different threats such as climate change and land use change. In this vein, future projections of species ranges under different climate change scenarios highlighted a retreat of several mammals and species richness in Spain [10,14]. Indeed, there is increasing evidence that the range limits of small mammals are experiencing significant shifts tracking changes in temperature, at least along altitudinal gradients [15,16]. However, unraveling the effects of climate and land cover on the structure of communities can be difficult due to their patterns of spatial covariation [11]. In the Mediterranean Region, this can be particularly evident in transitional areas and along elevation gradients, where changes in climate will affect the vegetation composition and land uses, and hence the distribution of species and the composition of small mammal communities [17,18,19]. The Mediterranean basin is considered a hotspot for small mammal diversity [20], and it will face bigger changes in climate in the near future [10]. Nonetheless, recent studies have highlighted the more influential role of landscape change on Mediterranean species and communities [21], so it is important to disentangle the effects of the two main drivers. Actually, solid evidence highlighted the importance of human land use changes and associated pressures as a cause of species declines and extinctions, reducing local terrestrial biodiversity [22].
In this investigation, we used barn owl (Tyto alba) pellets as an alternative to live trapping since it is considered a non-invasive sampling technique for detecting changes in small mammal abundance and community composition [23]. The study area represents a land use and land cover gradient in a transitional area between the Mediterranean and Eurosiberian regions, showing urbanization and crop intensification in the lowlands and forest encroachment in mountain areas [24]. Using a multivariate statistical approach (canonical ordination [25]), we modeled the response of a matrix of species to the matrices of both main drivers previously described. Owing to the small spatial scale of the study, we expected that land use would affect communities in a more relevant way than either geography or climate.

2. Materials and Methods

2.1. Study Area

The study was performed in Osona (1265 km2, Barcelona province, Catalonia, NE Spain), one of the 42 Catalan districts. This area is very heterogeneous, in the confluence of the Mediterranean and Eurosiberian regions (Figure 1), and mostly covered by forests (54%), scrubland, and natural grasslands (15%), with a quarter of the area devoted to cropland (26%), and only 4% of urban areas [26]. To study the composition of the small mammal communities, we selected 24 localities in which barn owl roosts were previously known, all of them located between 400 and 900 m above sea level and outside protected areas (Figure 1). These locations were visited and prospected from May to August 2011, but the collection of owl pellets was partially achieved in 16 of them (67%, Supplementary Material Table S1). The absence of pellets in eight of these localities confirmed the well-known decline that the barn owl has experienced in the last decades in Catalonia due to habitat loss and competition for nesting places with the Tawny owl (Strix aluco) [21,27]. Indeed, we observed the replacement of barn owls by tawny owls in a territory that had been occupied for decades in a farmhouse, possibly caused by land use changes [27]. Nevertheless, we considered that they were evenly distributed and acceptably represented the regional environmental gradient. The sample of localities represented the changes that can be observed throughout the region regarding geography, climate, and land use [24]. There is a strong climatic gradient from SW to NE, partially caused by changes in elevation (from 471 to 883 masl), with increasing rainfall (from 700 to 1000 mm) and decreasing temperatures (from 12.7 °C to 10.7 °C, Figure 2). Regarding land-uses, the area surrounding the sampled localities was mostly covered by croplands ( x - = 54.5% ± 22.6, range 2.5–84%), followed by forests ( x - = 23.2% ± 21.5, range 4.3–79%), scrubland ( x - = 13.1% ± 11.9, range 1–39.5%), and urban areas ( x - = 5.4% ± 4.2, range 0–14.2%).

2.2. Species Determination

First, the 699 pellets corresponding to the 16 locations distributed throughout the Osona district have been analyzed. The mean number of small mammals identified per locality (153.6 ± 31.1 SD,) was considered adequate to represent the small mammal communities (i.e., 150 individuals, [28,29]). The method used was “dry”, gradually breaking up each pellet and separating its contents with the help of tweezers, a lancet, and a brush to clean the cranial remains to facilitate their later identification [30]. The identification of prey from the small mammal group was carried out with the help of determination keys [30,31], and with our own collection held at the Natural Sciences Museum of Granollers. For the sibling Apodemus flavicollis/sylvaticus determination, we used the molar tubercle number 9 (t9) criterion (with a secondary support of the t4–t7 criterion) following [32]. A binocular magnifying glass connected to a monitor has been used to make identification easier. Species requirements were taken from [30,33].

2.3. Environmental Variables and Statistical Analyses

The home range of barn owls is generally assumed to be 2.5–3 km in radius and about 20–28 km2 [28,34,35]. This area corresponds to the hunting territory of the raptor, where the bulk of activity takes place [35]. For each locality, we included all the small mammal species found in the diet, and a set of representative environmental variables related to geography (latitude, longitude, elevation), climate (temperature, rainfall), and land uses (cover of urban, scrubland, crops, and the three main woodlands [32]). Mean climatic variables for each locality were obtained from the Servei Meteorològic de Catalunya (www.meteo.cat), and land use information to characterize every locality was taken from the “Land use classification of Catalonia 2002” (Generalitat de Catalunya, Departament de Territori i Sostenibilitat: http://www20.gencat.cat/portal/site/territori, accessed on 15 January 2024), and these values were averaged from 5 × 5 km square UTM units centered in that locality (see [27,32,36] for a similar approach).
A multivariate statistical approach was applied to have an overall estimate of the associations between small mammal communities and several environmental predictors by using direct-gradient analyses [37]. First, we performed a Detrended Correspondence Analysis (DCA) with the 12 species abundance matrix (without predictors) to test whether the small mammal communities were heterogeneous or not. Owing to the short gradient lengths obtained (lower than 3.0), we concluded that there was a low degree of species turnover in community composition; therefore, in the following steps, linear ordination techniques were applied [38]. We used redundancy analysis (RDA) to assess whether changes in the composition of the species among barn owl roosts were explained by environmental variables. Two RDAs were performed, the first in which the small mammal matrix was constrained by the five geo-climatic predictors and the second with the small mammal matrix constrained by the six land use predictors [32]. Since both groups of predictors shared variance (e.g., deciduous woodlands were associated with cold and humid localities), we performed two partial constrained ordinations by including covariates in the two RDAs [38,39]. With these analyses, we obtained the four components of variance: the one explained by geo-climatic factors, the one explained by land uses, the one shared by both factors, and the unexplained variance [11,25]. The statistical significance of the axes extracted was tested with the Monte Carlo permutation test (default option of 499 permutations). Particular associations of the species and the environmental axes (linear or quadratic) were tested by means of General Linear Models (GLM) with Gaussian distribution, and the best-fit model (first- or second-order polynomial model) was selected with the Akaike criterion (AIC) [37].
The number of species, or species richness, can be considered the most used and understood measure of species diversity [22]. However, changes in species richness between localities can arise after collecting different numbers of individuals [40]. To avoid sampling biases, we collected a relatively similar number of individuals per locality, and species richness and sample size were indeed uncorrelated (r = 0.37, p = 0.15, n = 16). A species accumulation curve was used to estimate the actual species richness of the small mammal species detected by barn owls [40]. The expected richness function was calculated with EstimateS v 9.0.1. [41], accessed on 15 February 2024] after producing 50 randomizations of the number of species as far as samples were accumulated. To determine the completeness of the inventory, we fitted the data provided by EstimateS to the Clench equation using the non-linear estimation module of Statistica v 7.0 (Stat Soft Inc., Tulsa, OK, USA). Detailed steps for the procedure were outlined by [42]. DCA, RDA and GLMs were performed with Canoco 4.5 for Windows [38]. Interpolation of climate and land use variables was performed with the function kriging from the Spatial Analyst module of ArcMap (v 10.1). Landscape heterogeneity [4], small mammal diversity, and evenness were calculated with Ecosim software [43].

3. Results

We determined 2458 small mammal individuals of 12 species (Figure 3). The mean number of individuals per sample was 153.62 ± 31.14 (SD, range 111–199), and the mean number of species per sample was 6.68 ± 0.87 (SD, range 6–9). The four dominant species in the barn owl diet accounted for 93% of all small mammalian prey (Figure 3). The three main preys had a relatively similar contribution to the diet, with about 25% each. Most species were Mediterranean (four species and 70% of prey), followed by the generalist group (one species and 24% of prey), Eurosiberian (four species and 4%), and synanthropic (three species and 2%). The species accumulation curve indicated that the quality of the inventory was high (96.7% of the species present). Indeed, the coefficient of determination associating the number of species and the number of samples obtained was high, indicating that the Clench function fitted well to the data (R2 = 0.957). The expected asymptotic species richness was 12.41 because of the quotient between the parameters of the fitted curve: a = 11.35/b = 0.91. So, our results highlighted that the number of species sampled by the owls was rather similar to the number of species potentially present in the study area.
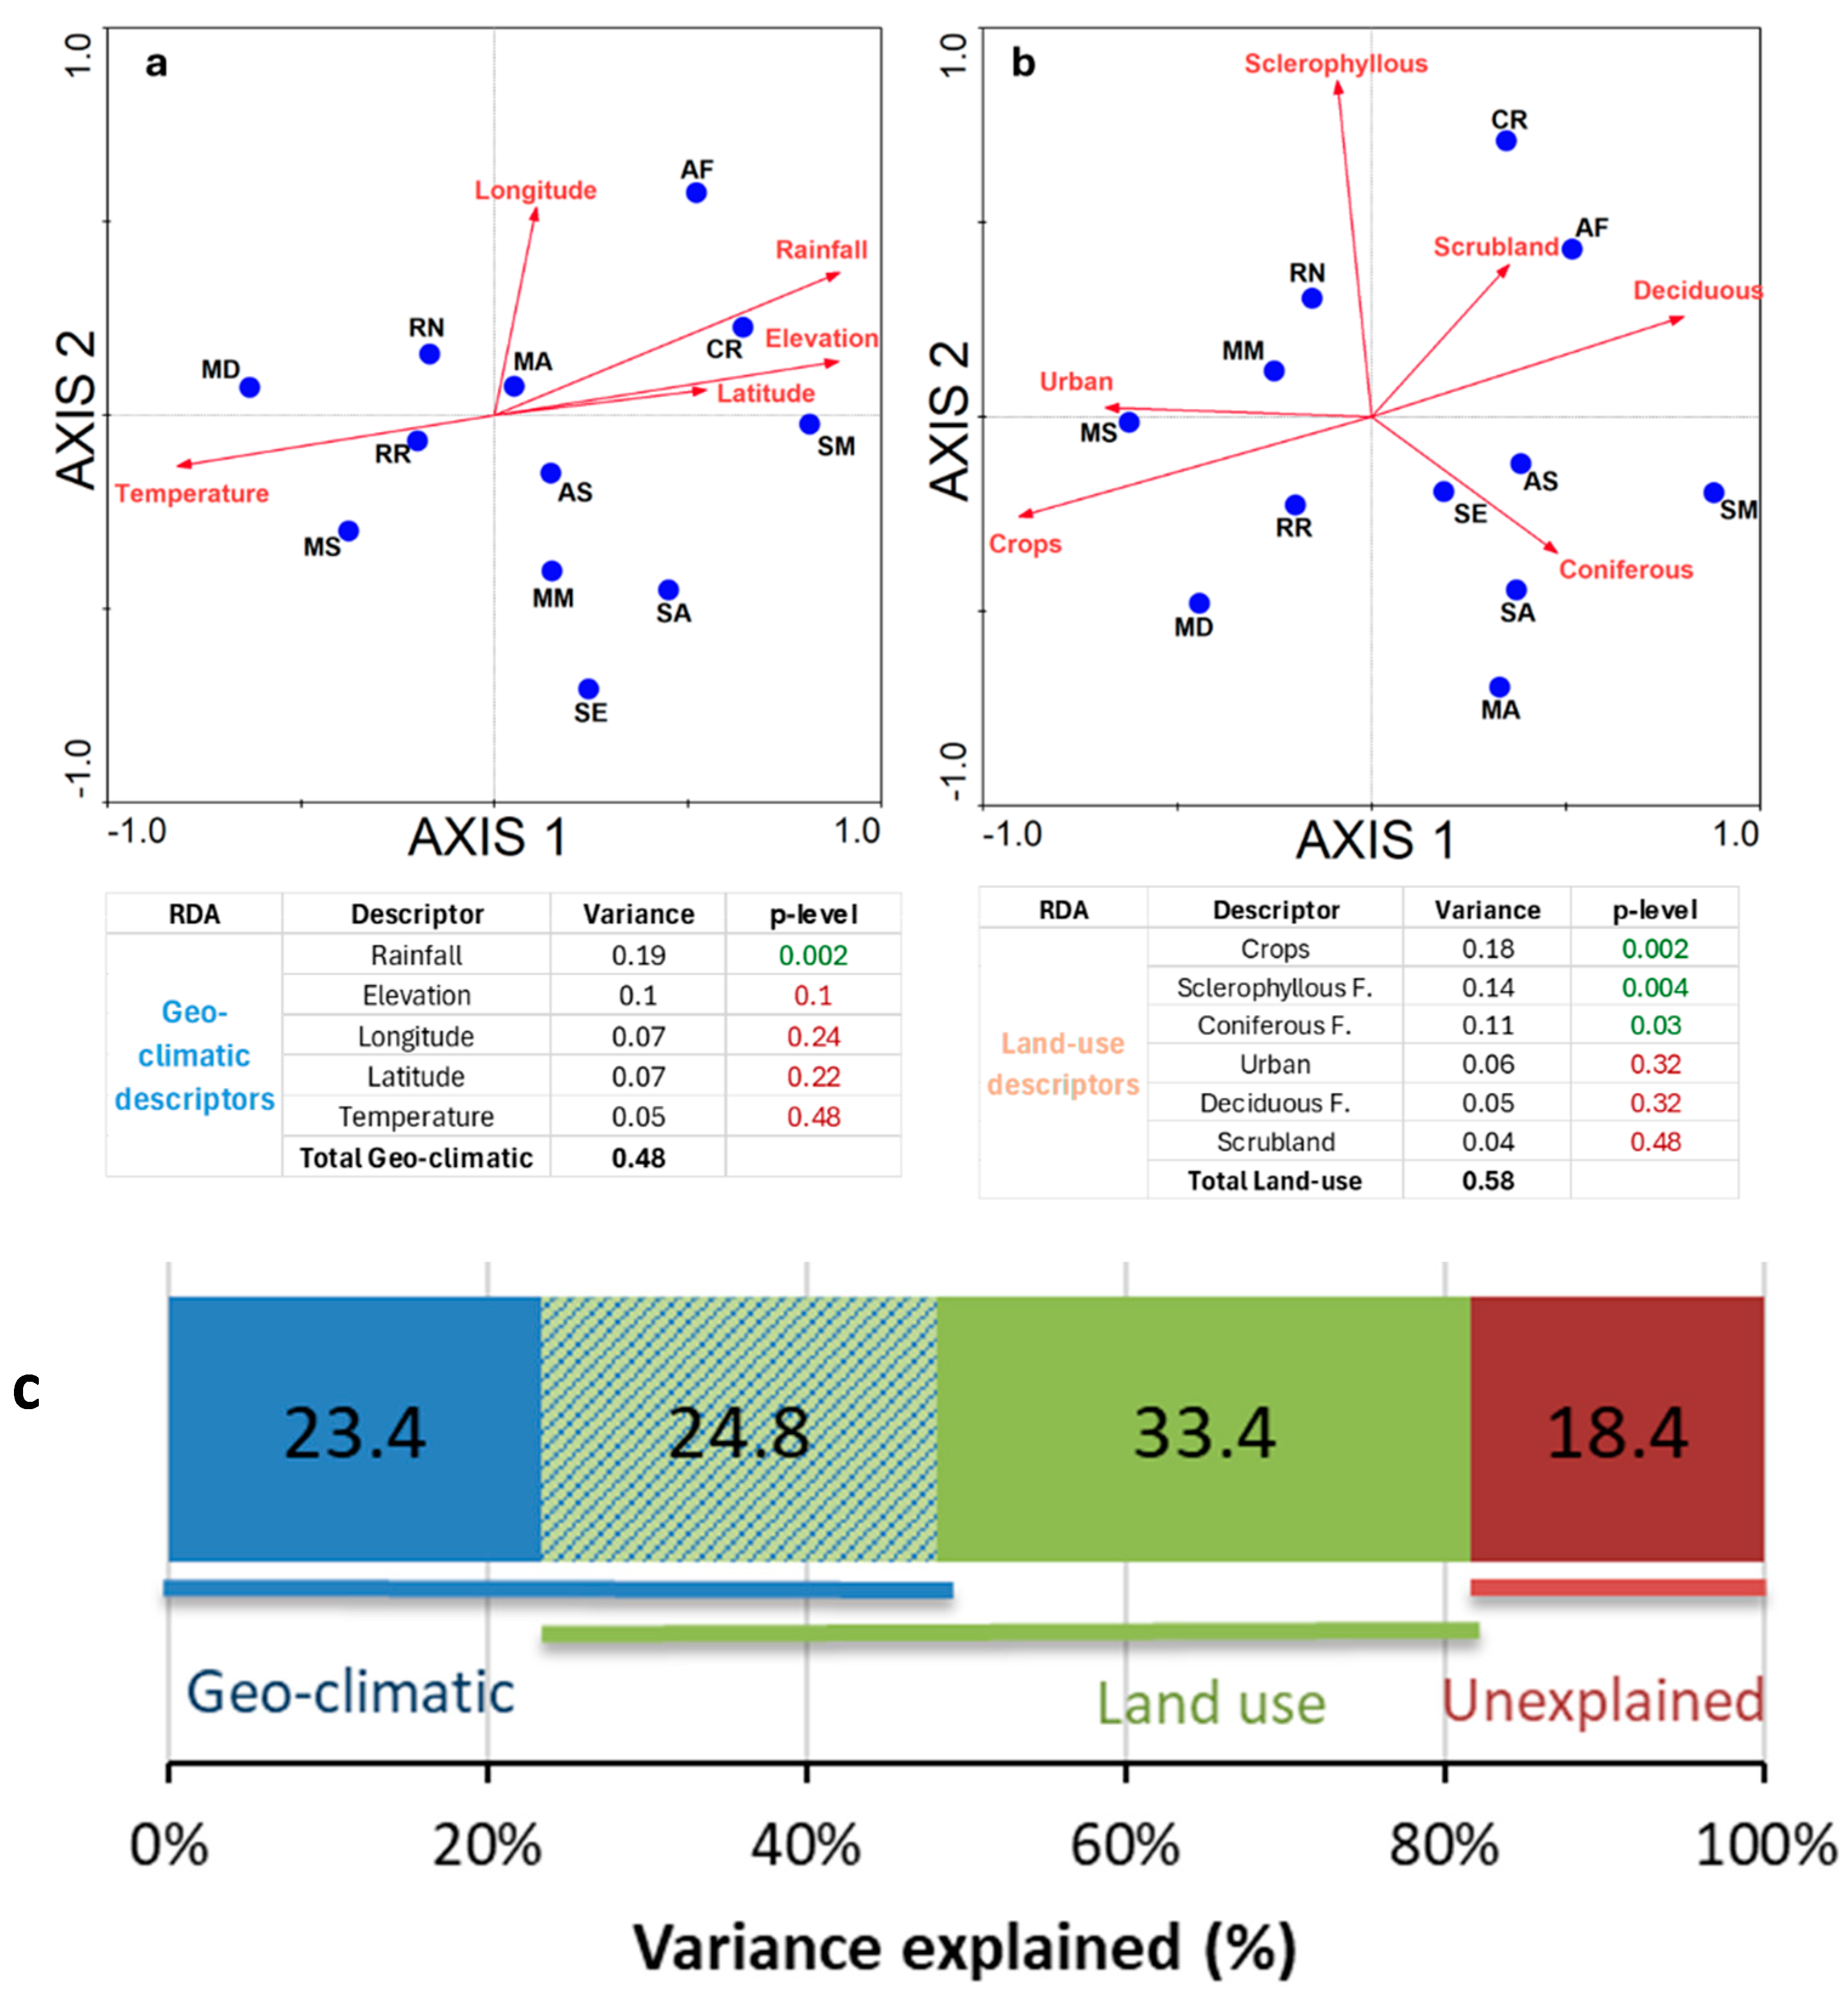
The first RDA with the small mammal species constrained by the five geo-climatic variables indicated significant associations between the species and the environmental axes (first axis: pseudo-F = 2.51, p = 0.012; all axes: pseudo-F = 1.86, p = 0.018). The first axis represented a gradient from lowland temperate localities to cold and rainy localities at high elevation. The second axis represented a gradient for longitude. These variables explained 48% of the variance in the small mammal communities (Figure 4a). However, the only variable showing significant associations and a higher explained variance was rainfall (19%). The second RDA with the small mammal species constrained by the five six land-use variables indicated significant associations between the species and the environmental axes (first axis: pseudo-F = 2.24, p = 0.010; all axes: pseudo-F = 2.08, p = 0.001). The first axis represented a gradient from croplands and urban localities to wooded localities (mostly covered by deciduous and coniferous forests). The second axis represented a gradient for sclerophyllous forests. These variables explained 58% of the variance in the small mammal matrix (Figure 4b). Three variables showed significant associations with the small mammal communities: crops (18%), sclerophyllous forests (14%), and coniferous forests (11%). The first partial constrained ordination extracted the pure variance of the geo-climatic variables from the shared variance of both environmental matrices, and the second partial constrained ordination extracted the pure variance of the land use variables from the shared variance between both environmental matrices (Figure 4c).
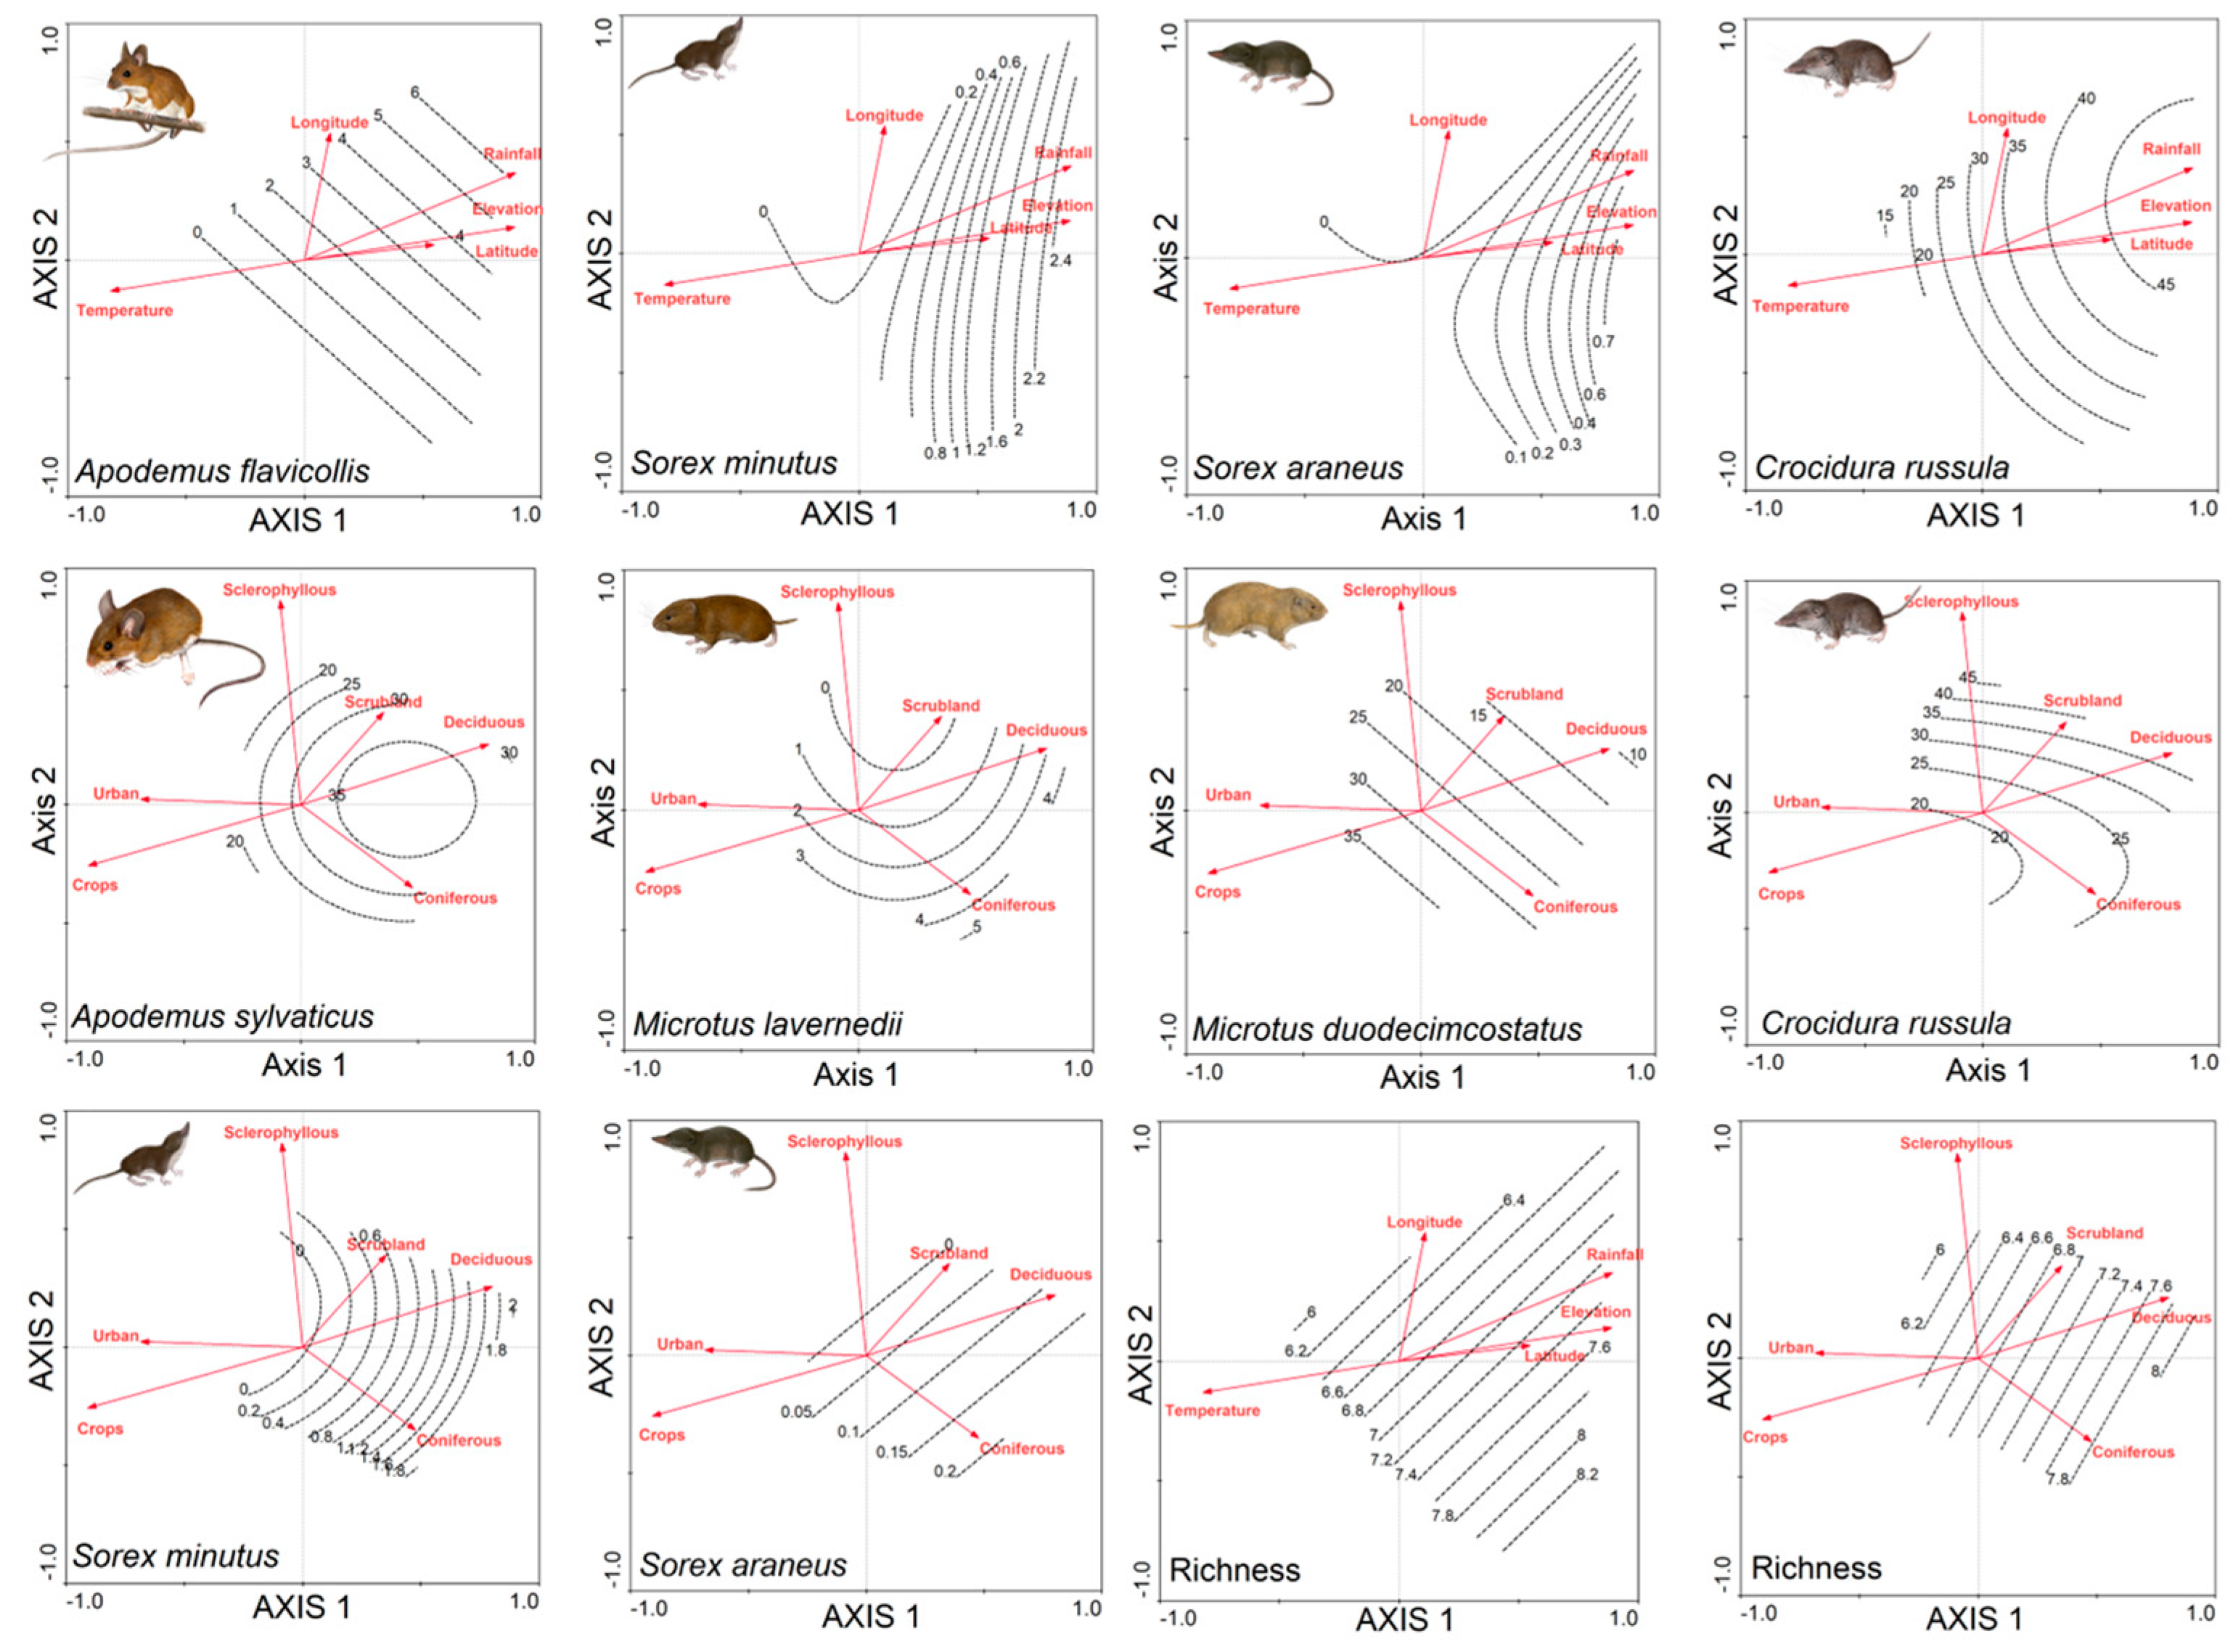
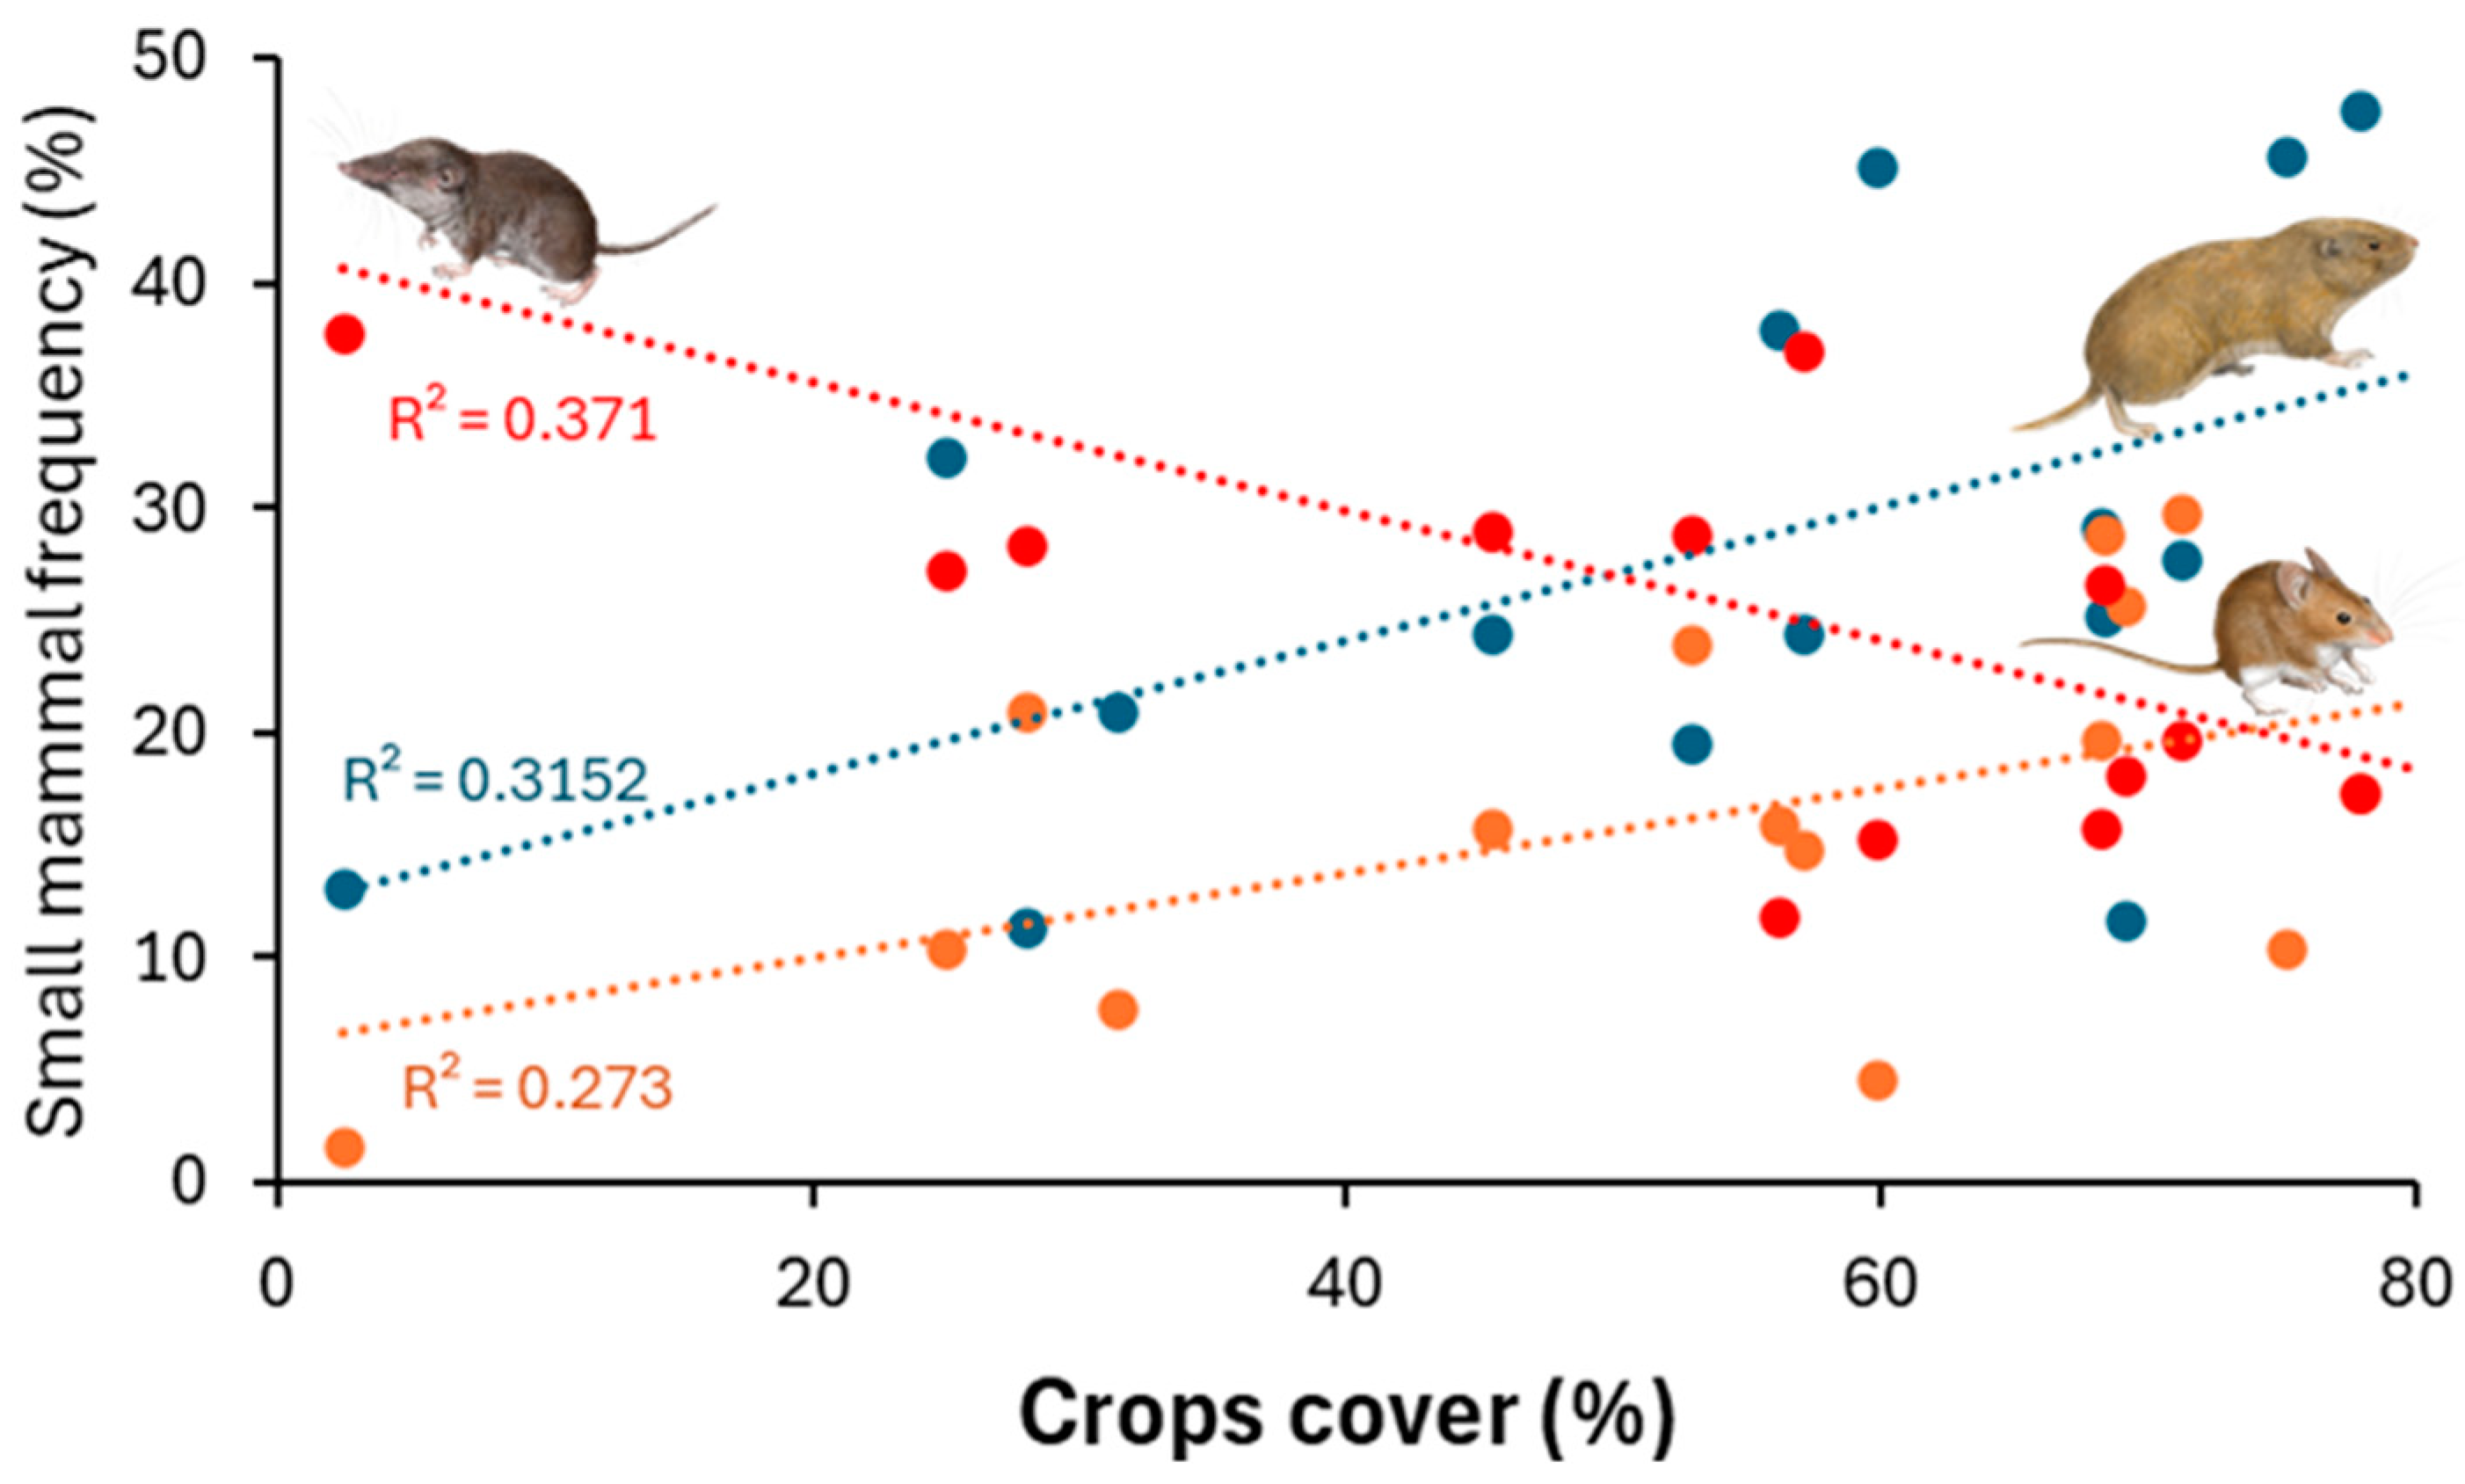
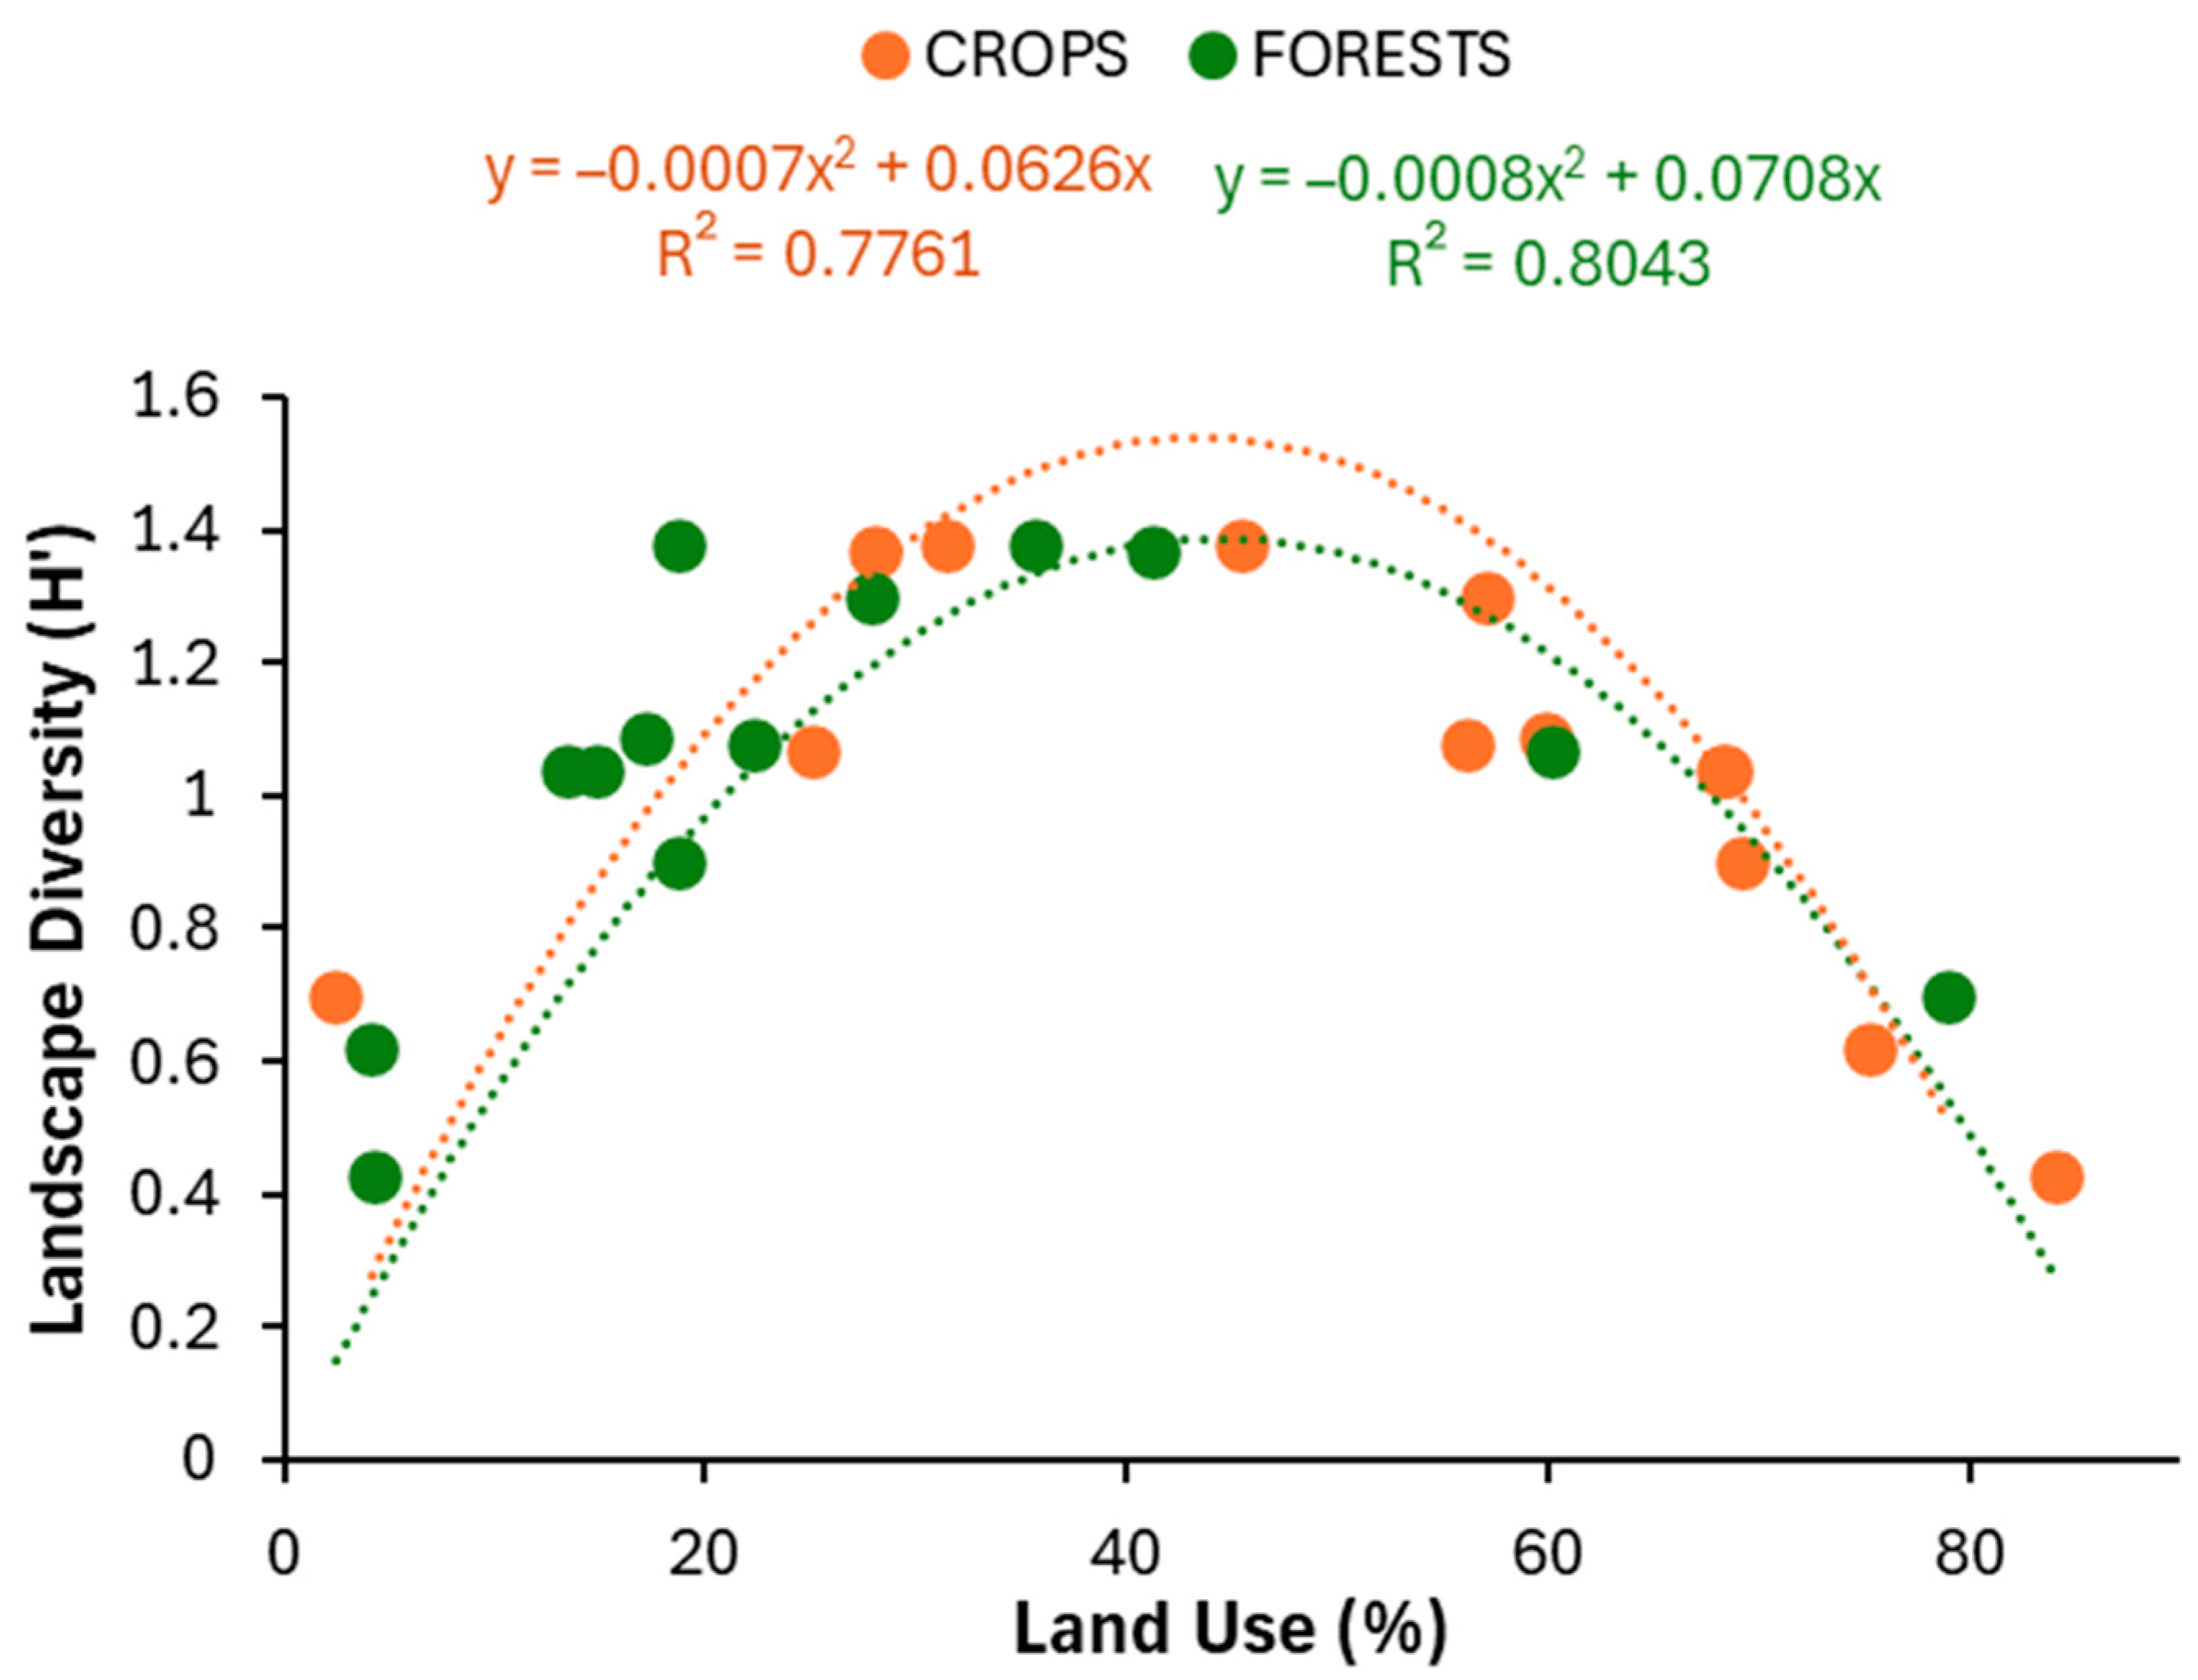
Despite the narrow range of species per locality (6 to 9), species richness was affected by both environmental matrices, but it was more affected by climate, increasing along axis 1 and decreasing along axis 2 (Table 1, Figure 5). This means that the number of species increased toward the cold and rainy highlands of the west. For land uses, species richness was positively associated with axis 1 and negatively associated with axis 2, indicating that the number of species increased from the sclerophyllous forests towards the more humid deciduous and coniferous forests. Nonetheless, species diversity, evenness, and dominance were unrelated to the environmental gradients. Regarding the six species showing association with the geo-climatic predictors, four showed linear and quadratic responses to both axes, and one showed a linear response (Table 1, Figure 5). Regarding the eight species showing associations with land use, five species showed linear and quadratic responses to both axes, two species showed quadratic associations, and one showed a linear association (Table 1, Figure 5). The relevance of crops can be depicted in Figure 6, showing three out of four of the more frequent species displaying positive (M. duodecimcostatus and M. spretus) and negative (C. russula) associations with croplands. Landscape heterogeneity (e.g., H’ Shannon Diversity) showed a hump-shaped pattern and was higher in localities with an intermediate proportion of area covered by the two main land uses (crops and forests) and was minimum in localities covered by extreme values of forest and crop cover (Figure 7). A stepwise multiple polynomial regression showed that species richness was linearly associated with the forest cover (adj. R2 = 0.43, F1,14 = 12.74, p = 0.003) and, in particular, coniferous forests (adj. R2 = 0.75, F1,14 = 45.27, p < 0.0001, Figure 5). This was mainly caused by the response of three northern species (S. araneus, S. minutus, and M. lavernedii) to the cover of coniferous forests (Figure 5). However, species diversity was unrelated to landscape composition (adj. R2 = 0.14, F1,14 = 1.59, p = 0.24).

4. Discussion

In this study, we analyzed the influence of environmental factors (climate and land uses) on the structure of the small mammal communities (i.e., species composition and relative abundance) in an agroecosystem of a transitional area between two biogeographic regions in NE Spain. In this area, two different small mammal chorotypes were previously described, one with Eurosiberian preferences and the other with Mediterranean preferences, but also including generalist and synanthropic taxa [33]. Regarding the small mammal communities and owing to the reduced spatial scale of the analysis, our results agreed with an expected higher influence of land uses, rather than climate or geography, in the structuring of small mammal assemblages. However, a part of the variance was shared by both environmental matrices, which highlights their patterns of spatial covariance [11].
We gathered information on 12 out of the 20 species potentially present in the area, so the composition of the communities studied by us could be partially biased by the absence of eight species. Nonetheless, the species accumulation curve returned a good inventory—detecting 96.7% of the species present—so we were confident that the community composition was well described, at least considering the extent of the area sampled and the effort performed [42,44]. However, this relatively small number of species detected could also be related to the recent rarity of some small mammal species in highly modified ecosystems regulated by human activities [21]. However, we cannot rule out that the sampling method used to be spatially biased due to species detectability and habitat issues, owing to the fact that the diet of barn owls overrepresents the open-land species and underrepresents the forest species [29,45]. Despite limitations, the diet of barn owls has had a widespread application for detecting changes in the small mammal communities in European agricultural ecosystems [28,37,46,47,48,49,50,51]. Furthermore, this method has also been applied to depict the patterns of spatial distribution along strong environmental gradients caused by geographic and climatic factors [18,19,32,35]. However, the absence of some species in our samples could be well explained by a mismatch between foraging habitats of either predator and preys (e.g., in the case of forest dwelling species such as Clethrionomys glareolus, Glis glis, Sciurus vulgaris), but also because of the rarity of some preys in the field and in the diet (e.g., Talpa aquitania, Eliomys quercinus, Arvicola sp., Neomys sp.), where extremely large samples are needed to record their presence (e.g., >15,000 small mammals: [19,50]). Even with these limitations, the barn owl diet can yield more information than conventional sampling methods (e.g., live trapping [23,45,52]), and regarding the distribution of forest species, it offers equivalent information to that provided by forest generalist predators (e.g., G. genetta, [32,36]).
The study area showed a strong environmental gradient, as expected, in transitional areas between biogeographic regions in mountain ranges. This gradient was caused by abiotic factors (i.e., temperature and rainfall) influenced by the topography, affecting the composition of the landscape and the small mammal communities. This area represented a traditional Mediterranean land use and land cover gradient, showing urbanization and crop intensification in the lowlands and forest encroachment in mountain areas [24], with landscape changes affecting mostly flat lowland areas with more productive soils, as shown elsewhere [53]. Despite the patterns of spatial covariation between abiotic and biotic factors, our analysis was able to disentangle the effects of both factors. The results stressed the higher relevance of land uses—compared to climate—for structuring the small mammal communities of the study area. This is consistent with the remarkable effects of land uses at small spatial scales [12,54], which contrasts with the relevant roles of climate for mammal diversity at higher spatial scales [6]. Nonetheless, the small mammal communities displayed low turnover rates along the gradient, which contrasted with other areas with stronger gradients or richer communities [55].
Some authors observed that small mammal diversity increased in agroecosystems with high landscape complexity [56], but our results showed a lack of relationship between these variables. Indeed, positive, negative, and neutral responses to landscape complexity and heterogeneity were described in small mammals [4]. However, species richness was minimal in the anthropic lowlands—covered by crops and urban areas—and increased in the more natural highlands covered by forests [55]. In particular, the cover of deciduous and coniferous forests increased the number of species, which matches the distribution of some northern species with Eurosiberian requirements [33]. This was also in agreement with other studies showing that the proportion of farmland and urban habitats negatively affected overall mammalian species richness [12,53,56,57], bearing in mind that habitat disturbance by degradation and simplification of the original vegetation showed harmful effects on small mammal communities [13]. Indeed, urbanization is accompanied by many activities that significantly affect the abundance and diversity of species [58], increasing the prevalence of synanthropic species without any conservation value (i.e., Rattus sp., Mus musculus [21]). Nevertheless, other factors that were not considered, such as agricultural intensification practices [28,48], can affect habitat quality due to increased uses of pesticides and fertilizers [46], thus decreasing suitability for small mammals. Other diversity indices used to describe the small mammal communities (e.g., Shannon H’, evenness) did not show association with the environmental gradients analyzed here, which contrasts with the results obtained with the species richness. Since those indices are a combination of variables (e.g., diversity combines richness and evenness), using the number of species can be advised as the most simple and straightforward measure of species diversity [22,40] to easily uncover environmental patterns.
Concerning the particular species requirements, one northern species with southern limits of distribution in the area showed land use associations (M. lavernedii), and three other species showed both responses (either climate and land uses, such as A. flavicollis, S. Araneus, and S. minutus). In the same way, two southern species with Mediterranean requirements showed associations with both climate and land uses (S. etruscus and M. duodecimcostatus). Regarding widely distributed species without distribution limits in the area, C. russula was influenced by both climate and land uses, and A. sylvaticus was mainly influenced by land uses. Synanthropic species (i.e., R. rattus, R. norvegicus, and M. musculus) did not show any environmental influence. Despite the fact that Crocidurinae shrews are considered thermophilic species (e.g., C. russula and S. etruscus, [18,21]), their abundance decreased towards warm lowlands covered by crops and urban areas [57]. Owing to the preference for open habitats such as grassland and scrubland [28,59,60], C. russula could be related to the distribution of those habitats in the study area (i.e., associated with higher elevations, [26]). Indeed, this species is mostly linked to vegetation structure rather than to climate along elevation gradients [61], showing a positive but indirect association with elevation, as described in nearby transitional areas of the Spanish Pyrenees [18]. Nonetheless, it cannot be ruled out that intensively cultivated lowlands have a negatve influence on shrews’ abundance through adverse effects on prey availability [46]. Suncus etruscus was affected by both gradients, suggesting that the species was constrained not only by elevation and related abiotic factors but also by habitat features [17,18,19]. Only two small mammal species (M. spretus and M. duodecimcostatus) were positively associated with the proportion of agricultural land, and both are thermophilic open-land rodent species whose abundance also decreases along the elevation gradient. Mus spretus is associated with agroecosystems [28,62], but it is also present in natural habitats such as scrubland [63]. However, the species could also be affected by altitude and related variables (e.g., temperature), which is probably associated with its thermoregulatory capacity and North-African origin [62,64]. This also agrees with the negative association of that species with elevation gradients described in other mountain ranges [18,19]. Microtus duodecimcostatus is an Iberian endemic fossorial vole that was dominant in the barn owl diet in the studied area. This species depends on soil quality [30,65], as many other fossorial species of the genus Microtus [37], but also on competition with other fossorial voles [65,66]. In the study area, this species is the only fossorial species with the highest abundance in the owls’ diet. Despite being a rare species in the diet of barn owls, the frequency of occurrence of A. flavicollis changed along the environmental gradient as expected, matching the pattern observed in a nearby mountain range [32]. The species showed positive associations with both climatic and land use variables, which agreed with its Eurosiberian preferences (i.e., deciduous forests in cold, wet areas). These results highlighted that the frequencies of occurrence of rare forest-dwelling species can be interpreted on an ecological basis using the barn owl diet. A similar pattern was observed in S. minutus and S. araneus, displaying associations with either climatic or land use variables, as shown elsewhere [18,19]. Microtus lavernedii only showed association with land use, in particular with areas covered by crops and pinewoods, in contrast with areas covered by sclerophyllous forests. Some authors highlighted the influence of geo-climatic variables on this species (e.g., altitude, temperature [18,19]), but the lack of association in this study agrees with its widespread elevation range, since it can be found even at sea level [30]. Apodemus sylvaticus only showed significant influences of eland uses, being associated with areas covered by humid forests and scrubland and decreasing towards dry forests, crops, and urban areas. This species can be considered the most common small mammal in the area [52] and did not show clear habitat preferences [67]. However, A. sylvaticus was previously thought to be associated with elevation in other mountain ranges [18,19], but this could well be an artifact caused by considering the combined abundance of both Apodemus spp. Finally, synanthropic species (i.e., R. rattus, R. norvegicus, and M. musculus) did not show any environmental influence, which can be expected according to their particular associations with human habitats [18], but also to the low representativeness of the barn owl diet.
Obtaining accurate data on the present distribution of small mammals is needed for establishing present and future conservation policies owing to the retreat of species ranges under future climate change scenarios [10,14]. Despite none of the small mammal species identified in this study having any conservation concern, they are considered key elements of the ecosystems [68], playing a paramount role in the demography of generalist and specialist predators in the area [69,70]. Indeed, this investigation was based on the information provided by the analysis of the diet of a generalist predator, the barn owl, which showed the relevance of small mammals as a food resource. Barn owls are efficient small mammals’ predators worldwide, and their predation rates provided natural control of rodent pests in agricultural land [71,72]. At the same time, being a generalist, the frequency of occurrence of the different species in the diet can be interpreted as reflecting relative abundances in the field, which helped to delineate the spatial distribution of species in transitional areas such as the one studied. Furthermore, the information offered by owls at the landscape scale cannot be easily obtained from other, more traditional sampling methods such as live trapping [45]. Summarizing, favoring barn owls’ populations (e.g., by providing nes-boxes) in agricultural land is a “win-win”, 1/offering natural protection of crop yields and avoiding the use of rodenticides, and 2/providing indirect information valuable for mammalogists.

Supplementary Materials

The following supporting information can be downloaded at: https://www.mdpi.com/article/10.3390/d16060343/s1.

Author Contributions

Conceptualization, I.T., A.A., J.B., and A.R.; investigation, I.T., A.A., J.B., and A.R.; methodology, I.T. and A.R.; software, I.T.; formal analysis, I.T. and A.R.; data curation, A.A.; writing—original draft preparation, I.T.; writing—review and editing, I.T., A.A., J.B., and A.R. All authors have read and agreed to the published version of the manuscript.

Funding

This research received no external funding.

Institutional Review Board Statement

Not applicable.

Informed Consent Statement

Not applicable.

Data Availability Statement

The data presented in this study are available on request from the corresponding author.

Acknowledgments

Helena Pujadas, Toni García, and Robert Vidal helped with laboratory tasks, and Jordina Baucells and Pere Vila with field tasks. Alfons Raspall provided the pictures of small mammals. This article was partially inspired by the master’s thesis of Andrés Requejo, directed by Ignasi Torre, which was presented at the University of Barcelona in September 2011.

Conflicts of Interest

The authors declares no conflict of interest.

References

  1. Hortal, J.; Rodríguez, J.; Nieto-Díaz, M.; Lobo, J.M. Regional and environmental effects on the species richness of mammal assemblages. J. Biogeogr. 2008, 35, 1202–1214. [Google Scholar] [CrossRef]
  2. Svenning, J.-C.; Flojgaard, C.; Baselga, A. Climate, history and neutrality as drivers of mammal beta diversity in Europe: Insights from multiscale deconstruction. J. Anim. Ecol. 2011, 80, 393–402. [Google Scholar] [CrossRef] [PubMed]
  3. Wu, Y.; Yang, Q.; Wen, Z.; Xia, L.; Zhang, Q.; Zhou, H. What drives the species richness patterns of non-volant small mammals along a subtropical elevational gradient? Ecography 2013, 36, 185–196. [Google Scholar] [CrossRef]
  4. Tews, J.; Brose, U.; Grimm, V.; Tielborger, K.; Wichmann, M.C.; Schwager, M.; Jeltsch, F. Animal species diversity driven by habitat heterogeneity/diversity: The importance of keystone structures. J. Biogeogr. 2004, 31, 79–92. [Google Scholar] [CrossRef]
  5. Pascual, L.-L.; Maiorano, L.; Alessandra, F.; Emilio, B.; Luigi, B. Hotspots of species richness, threat and endemism for terrestrial vertebrates in SW Europe. Acta Oecologica 2011, 37, 399–412. [Google Scholar] [CrossRef]
  6. Hawkins, B.A.; Pausas, J.G. Does plant richness influence animal richness? the mammals of Catalonia (NE Spain). Divers. Distrib. 2004, 10, 247–252. [Google Scholar] [CrossRef]
  7. Baquero, R.A.; Telleria, J.L. Species richness, rarity and endemicity of European mammals: A biogeographical approach. Biodivers. Conserv. 2001, 10, 29–44. [Google Scholar] [CrossRef]
  8. Brown, J.H.; Lomolino, M.V. Biogeography, 2nd ed.; Sinauer Associates, Inc.: Sunderland, MA, USA, 1998. [Google Scholar]
  9. Araújo, M.B.; Peterson, A.T. Uses and misuses of bioclimatic envelope modeling. Ecology 2012, 93, 1527–1539. [Google Scholar] [CrossRef] [PubMed]
  10. Maiorano, L.; Falcucci, A.; Zimmermann, N.E.; Psomas, A.; Pottier, J.; Baisero, D.; Rondinini, C.; Guisan, A.; Boitani, L. The future of terrestrial mammals in the Mediterranean basin under climate change. Philos. Trans. R. Soc. B Biol. Sci. 2011, 366, 2681–2692. [Google Scholar] [CrossRef]
  11. Flojgaard, C.; Normand, S.; Skov, F.; Svenning, J.-C. Deconstructing the mammal species richness pattern in Europe—Towards an understanding of the relative importance of climate, biogeographic history, habitat heterogeneity and humans. Glob. Ecol. Biogeogr. 2011, 20, 218–230. [Google Scholar] [CrossRef]
  12. Mehr, M.; Brandl, R.; Hothorn, T.; Dziock, F.; Foerster, B.; Mueller, J. Land use is more important than climate for species richness and composition of bat assemblages on a regional scale. Mamm. Biol. 2011, 76, 451–460. [Google Scholar] [CrossRef]
  13. Holland, G.J.; Bennett, A.F. Occurrence of small mammals in a fragmented landscape: The role of vegetation heterogeneity. Wildl. Res. 2007, 34, 387–397. [Google Scholar] [CrossRef]
  14. Araújo, M.B.; Guilhaumon, F.; Rodrigues Neto, D.; Pozo Ortego, I.; Calmaestra, R.G. Impactos, Vulnerabilidad y Adaptación al Cambio Climático de la Biodiversidad Española 2. Fauna de Vertebrados; Dirección General de Medio Natural y Política Forestal, Ministerio de Medio Ambiente, y Medio Rural y Marino: Madrid, Spain, 2011. [Google Scholar]
  15. Rowe, R.J.; Finarelli, J.A.; Rickart, E.A. Range dynamics of small mammals along an elevational gradient over an 80-year interval. Glob. Chang. Biol. 2010, 16, 2930–2943. [Google Scholar] [CrossRef]
  16. Moritz, C.; Patton, J.L.; Conroy, C.J.; Parra, J.L.; White, G.C.; Beissinger, S.R. Impact of a century of climate change on small-mammal communities in Yosemite National Park, USA. Science 2008, 322, 261–264. [Google Scholar] [CrossRef] [PubMed]
  17. Krystufek, B.; Donev, N.R.; Skok, J. Species richness and distribution of non-volant small mammals along an elevational gradient on a Mediterranean mountain. Mammalia 2011, 75, 3–11. [Google Scholar] [CrossRef]
  18. Moreno, E.; Barbosa, A. Distribution patterns of small mammal fauna along gradients of latitude and altitude in Northern Spain. Zeischrift für Säugetierkd. 1992, 57, 169–175. [Google Scholar]
  19. Torre, I.; Tella, J.; Arrizabalaga, A. Environmental and geographic factors affecting the distribution of small mammals in an isolated Mediterranean mountain. Z. Fur Saugetierkd. 1996, 61, 365–375. [Google Scholar]
  20. Krystufek, B.; Griffiths, H.I. Species richness and rarity in European rodents. Ecography 2002, 25, 120–128. [Google Scholar] [CrossRef]
  21. Torre, I.; Gracia-Quintas, L.; Arrizabalaga, A.; Baucells, J.; Díaz, M. Are recent changes in the terrestrial small mammal communities related to land use change? A test using pellet analyses. Ecol. Res. 2015, 30, 813–819. [Google Scholar] [CrossRef]
  22. Newbold, T.; Hudson, L.N.; Hill, S.L.L.; Contu, S.; Lysenko, I.; Senior, R.A.; Börger, L.; Bennett, D.J.; Choimes, A.; Collen, B.; et al. Global effects of land use on local terrestrial biodiversity. Nature 2015, 520, 45–50. [Google Scholar] [CrossRef]
  23. Heisler, L.M.; Somers, C.M.; Poulin, R.G. Owl pellets: A more effective alternative to conventional trapping for broad-scale studies of small mammal communities. Methods Ecol. Evol. 2016, 7, 96–103. [Google Scholar] [CrossRef]
  24. Baśnou, C.; Álvarez, E.; Bagaria, G.; Guardiola, M.; Isern, R.; Vicente, P.; Pino, J. Spatial patterns of land use changes across a mediterranean metropolitan landscape: Implications for biodiversity management. Environ. Manage. 2013, 52, 971–980. [Google Scholar] [CrossRef] [PubMed]
  25. Peres-Neto, P.R.; Legendre, P.; Dray, S.; Borcard, D. Variation partitioning of species data matrices: Estimation and comparison of fractions. Ecology 2006, 87, 2614–2625. [Google Scholar] [CrossRef] [PubMed]
  26. Baucells, J.; Camprodon, J.; Ordeix, M. La Fauna Vertebrada d’Osona; Lynx Edicions: Barcelona, Spain, 1998. [Google Scholar]
  27. Vigués, J.; Grajera, J.; Arrizabalaga, A.; Torre, I. Long-term human-induced landscape changes and small mammal communities in a Mediterranean place. Galemys 2018, 30, 37–47. [Google Scholar] [CrossRef]
  28. Rodriguez, C.; Peris, S.J. Habitat associations of small mammals in farmed landscapes: Implications for agri-environmental schemes. Anim. Biol. 2007, 57, 301–314. [Google Scholar] [CrossRef]
  29. van Strien, A.J.; Bekker, D.L.; La Haye, M.J.J.; van der Meij, T. Trends in small mammals derived from owl pellet data using occupancy modelling. Mamm. Biol. 2015, 80, 340–346. [Google Scholar] [CrossRef]
  30. Gosálbez, J. Insectívors i Rosegadors de Catalunya. Metodologia D’estudi i Catàleg Faunístic; Ketres Editora, S.A.: Barcelona, Spain, 1987. [Google Scholar]
  31. Culí, J.; Riera, S.; Solà, E. Les Egagròpiles. Concepte, Tractament i Utilitat.Treballs de Camp i de Laboratori. Aplicacions Escolars; EUMO Editorial: Cataluna, Spain, 1989. [Google Scholar]
  32. Torre, I.; Fernández, L.; Arrizabalaga, A. Using barn owl Tyto alba pellet analyses to monitor the distribution patterns of the yellow-necked mouse (Apodemus flavicollis Melchior 1834) in a transitional Mediterranean mountain. Mammal Study 2015, 40, 133–142. [Google Scholar] [CrossRef]
  33. Sans-Fuentes, M.A.; Ventura, J. Distribution patterns of the small mammals (Insectivora and Rodentia) in a transitional zone between the Eurosiberian and the Mediterranean regions. J. Biogeogr. 2000, 27, 755–764. [Google Scholar] [CrossRef]
  34. Martínez, J.A.; Zuberogoitia, Í. Habitat preferences and causes of population decline for Barn Owls Tyto alba: A multi-scale approach. Ardeola 2004, 51, 303–317. [Google Scholar]
  35. Szpunar, G.; Aloise, G.; Mazzotti, S.; Nieder, L.; Cristaldi, M. Effects of global climate change on terrestrial small mammal communities in Italy. Fresenius Environ. Bull. 2008, 17, 1526–1533. [Google Scholar]
  36. Torre, I.; Arrizabalaga, A.; Freixas, L.; Ribas, A.; Flaquer, C.; Diaz, M. Using scats of a generalist carnivore as a tool to monitor small mammal communities in Mediterranean habitats. Basic Appl. Ecol. 2013, 14, 155–164. [Google Scholar] [CrossRef]
  37. Bontzorlos, V.; Vlachopoulos, K.; Xenos, A. Distribution of Four Vole Species through the Barn Owl Tyto alba Diet Spectrum: Pattern Responses to Environmental Gradients in Intensive Agroecosystems of Central Greece. Life 2023, 13, 105. [Google Scholar] [CrossRef] [PubMed]
  38. Leps, J.; Smilauer, P. Multivariate Analysis of Ecological Data using CANOCO; Cambridge University Press: Cambridge, UK, 2003. [Google Scholar]
  39. Borcard, D.; Legendre, P.; Drapeau, P. Partialling out the spatial component of ecological variation. Ecology 1992, 73, 1045–1055. [Google Scholar] [CrossRef]
  40. Gotelli, N.J.; Colwell, R.K. Quantifying biodiversity: Procedures and pitfalls in the measurement and comparison of species richness. Ecol. Lett. 2001, 4, 379–391. [Google Scholar] [CrossRef]
  41. Colwell, R.K. EstimateS: Statistical estimation of species richness and shared species from samples. In Software and User’s Guide. 2012. Available online: https://www.robertkcolwell.org/pages/1407 (accessed on 5 June 2024).
  42. Jiménez-Valverde, A.; Hortal, J. Las curvas de acumulación de especies y la necesidad de evaluar la calidad de los inventarios biológicos. Rev. Ibérica Aracnol. 2003, 8, 151–161, 1576–9518. [Google Scholar]
  43. Gotelli, N.J.; Entsminger, G. ECOSIM: Null Models Software for Ecology; Acquired Intelligence Inc., Kesey-Bear: Vancouver, WA, Canada, 2005; Available online: http://www.garyentsminger.com (accessed on 5 June 2024).
  44. Moreno, C.E.; Halffter, G. Assessing the completeness of bat biodiversity inventories using species accumulation curves. J. Appl. Ecol. 2000, 37, 149–158. [Google Scholar] [CrossRef]
  45. Torre, I.; Arrizabalaga, A.; Flaquer, C. Three methods for assessing richness and composition of small mammal communities. J. Mammal. 2004, 85, 524–530. [Google Scholar] [CrossRef]
  46. Balestrieri, A.; Gazzola, A.; Formenton, G.; Canova, L. Long-term impact of agricultural practices on the diversity of small mammal communities: A case study based on owl pellets. Environ. Monit. Assess. 2019, 191, 725. [Google Scholar] [CrossRef] [PubMed]
  47. Cooke, D.; Nagle, A.; Smiddy, P.; Mria, J.F.; Muircheartaigh, I.Ó. The diet of the barn owl Tyto alba in county Cork in relation to land use. Proc. R. Ir. Acad. 1996, 96, 97–111. [Google Scholar]
  48. Millán de la Peña, N.; Butet, A.; Delettre, Y.; Paillat, G.; Morant, P.; Le Du, L.; Burel, F. Response of the small mammal community to changes in western French agricultural landscapes. Landsc. Ecol. 2003, 18, 265–278. [Google Scholar] [CrossRef]
  49. Love, R.A.; Webbon, C.; Glue, D.E.; Harris, S. Changes in the food of British Barn Owls (Tyto alba) between 1974 and 1997. Mamm. Rev. 2000, 30, 107–129. [Google Scholar] [CrossRef]
  50. Meek, W.; Burman, P.; Sparks, T.; Nowakowski, M.; Burman, N. The use of Barn Owl Tyto alba pellets to assess population change in small mammals. Bird Study 2012, 59, 166–174. [Google Scholar] [CrossRef]
  51. Torre, I.; Tella, J.L.; Ballesteros, T. Predation trends of the barn owl (Tyto alba) in the Ebro Valley (NE Spain). Hist. Anim. 1997, 3, 35–44. [Google Scholar]
  52. Torre, I.; Raspall, A.; Arrizabalaga, A.; Díaz, M. SEMICE: An unbiased and powerful monitoring protocol for small mammals in the Mediterranean Region. Mamm. Biol. 2018, 88, 161–167. [Google Scholar] [CrossRef]
  53. Munguía, M.; Trejo, I.; González-Salazar, C.; Pérez-Maqueo, O. Human impact gradient on mammalian biodiversity. Glob. Ecol. Conserv. 2016, 6, 79–92. [Google Scholar] [CrossRef]
  54. Serafini, V.N.; Priotto, J.W.; Gomez, M.D. Effects of agroecosystem landscape complexity on small mammals: A multi-species approach at different spatial scales. Landsc. Ecol. 2019, 34, 1117–1129. [Google Scholar] [CrossRef]
  55. Benedek, A.M.; Sîrbu, I. Responses of small mammal communities to environment and agriculture in a rural mosaic landscape. Mamm. Biol. 2018, 90, 55–65. [Google Scholar] [CrossRef]
  56. Fischer, C.; Thies, C.; Tscharntke, T. Small mammals in agricultural landscapes: Opposing responses to farming practices and landscape complexity. Biol. Conserv. 2011, 144, 1130–1136. [Google Scholar] [CrossRef]
  57. Gomes, V.; Ribeiro, R.; Carretero, M.A. Effects of urban habitat fragmentation on common small mammals: Species versus communities. Biodivers. Conserv. 2011, 20, 3577–3590. [Google Scholar] [CrossRef]
  58. Chace, J.F.; Walsh, J.J. Urban effects on native avifauna: A review. Landsc. Urban Plan. 2006, 74, 46–69. [Google Scholar] [CrossRef]
  59. Torre, I.; Bastardas-Llabot, J.; Arrizabalaga, A.; Díaz, M. Population dynamics of small endotherms under global change: Greater white-toothed shrews Crocidura russula in Mediterranean habitats. Sci. Total Environ. 2020, 705, 135799. [Google Scholar] [CrossRef] [PubMed]
  60. Torre, I.; Jaime-González, C.; Díaz, M. Habitat Suitability for Small Mammals in Mediterranean Landscapes: How and Why Shrubs Matter. Sustainability 2022, 14, 1562. [Google Scholar] [CrossRef]
  61. Torre, I.; Díaz, M.; Arrizabalaga, A. Additive effects of climate and vegetation structure on the altitudinal distribution of greater white-toothed shrews Crocidura russula in a Mediterranean mountain range. Acta Theriol. 2014, 59, 139–147. [Google Scholar] [CrossRef]
  62. Palomo, L.J.; Justo, E.R.; Vargas, J.M. Mus spretus (Rodentia: Muridae). Mamm. Species 2009, 840, 1–10. [Google Scholar] [CrossRef]
  63. Torre, I.; Puig-Montserrat, X.; Díaz, M. Global Change Effects on Mediterranean Small Mammal Population Dynamics: Demography of Algerian Mice (Mus spretus) Along Land Use and Climate Gradients. Sci. Total Environ. 2023, 863, 160875. [Google Scholar] [CrossRef] [PubMed]
  64. Górecki, A.; Meczeva, R.; Pis, T.; Gerasimov, S.; Walkowa, W. Geographical variation of thermoregulation in wild populations of Mus musculus and Mus spretus. Acta Theriol. 1990, 35, 209–214. [Google Scholar] [CrossRef]
  65. Borghi, C.E.; Giannoni, S.M.; Martinez-Rica, J.P. Habitat segregation of three sympatric fossorial rodents in the Spanish Pyrenees. Zeitschrift fuer Saeugetierkd. 1994, 59, 52–57. [Google Scholar]
  66. Santos, S.M.; da Luz Mathias, M.; Mira, A.P. Local coexistence and niche differences between the Lusitanian and Mediterranean pine voles (Microtus lusitanicus and M. duodecimcostatus). Ecol. Res. 2010, 25, 1019–1031. [Google Scholar] [CrossRef]
  67. Oro, D.; Sanz-Aguilar, A.; Carbonell, F.; Grajera, J.; Torre, I. Multi-species prey dynamics influences local survival in resident and wintering generalist predators. Oecologia 2021, 197, 437–446. [Google Scholar] [CrossRef] [PubMed]
  68. Paniccia, C.; Laura Carranza, M.; Frate, L.; Di Febbraro, M.; Rocchini, D.; Loy, A. Distribution and functional traits of small mammals across the Mediterranean area: Landscape composition and structure definitively matter. Ecol. Indic. 2022, 135, 108550. [Google Scholar] [CrossRef]
  69. Torre, I.; Raspall, A.; Arrizabalaga, A.; Díaz, M. Weasel (Mustela nivalis) decline in NE Spain: Prey or land use change? Mammal Res. 2018, 63, 501–505. [Google Scholar] [CrossRef]
  70. Torre, I.; Grajera, J.; Amat, F.; Oro, D.; Mañosa, S. Prey dynamics and breeding performance in a generalist predator: The differential role of prey density, biomass, and effective consumption rates. Acta Oecologica 2024, 123, 103999. [Google Scholar] [CrossRef]
  71. Johnson, M.; Matthew, D.; George, S. Estimating the Number of Rodents Removed by Barn Owls Nesting in Boxes on Winegrape Vineyards UC Agriculture & Natural Resources Proceedings of the Vertebrate Pest Conference Authors University of California. Proc. Vertebr. Pest Conf. 2020, 29, 29. [Google Scholar]
  72. Jareño, D.; Luna, A.P.; Viñuela, J. Local Effects of Nest-Boxes for Avian Predators over Common Vole Abundance during a Mid-Density Outbreak. Life 2023, 13, 1963. [Google Scholar] [CrossRef] [PubMed]
Figure 1. (a) Name and situation of the 16 barn owl roosts sampled in Osona County (Barcelona, NE Spain) and situation of the county in Catalunya Region (b) and Spain (c). The green colors indicate protected areas and the Mediterranean (yellow), Eurosiberian (pink), and Alpine (blue) regions.
Diversity 16 00343 g001
Figure 2. Interpolated maps showing mean annual temperature (red), annual total rainfall (blue), forest cover (green), and crop cover (orange), together with the situation of the localities (black dots) sampled in Osona County (Barcelona, NE Spain). The intensity of color isoclines indicates increased values. Numbers and names of localities in Table S1.
Diversity 16 00343 g002
Figure 3. Frequency of occurrence (%) of the 12 small mammal preys in the diet of barn owls in Osona County (Barcelona, NE Spain). The small figure depicts the species accumulation curve fitting the observed number of species to the number of samples (blue line) and the Chao 1 richness estimator (orange line).
Diversity 16 00343 g003
Figure 4. Results of the Redundancy Analysis (RDA) showing the situation of the 12 small mammal species on the plane defined by the first and second axes, constrained by (a) the five geo-climatic predictors and (b) the six land use predictors. Red arrows are predictors, and blue dots are species. The table below each figure indicates the amount of variance explained by each predictor (and the significant p-level in green) and by all predictors in that group. The figure below the tables (c) shows the percentage of variance explained and shared by both main predictors. Species acronyms as in Figure 3.
Diversity 16 00343 g004
Figure 5. Small mammal responses to environmental gradients generated by the geoclimatic (upper row) and land use (second and third rows) matrices. The lower row also shows the response of species richness to both matrices.
Diversity 16 00343 g005
Figure 6. Association between the frequency of occurrence of C. russula (red dots and line), M. spretus (orange dots and line), and M. duodecimcostatus (blue dots and line) in the diet of the barn owl and crop cover (%) in 16 localities of Osona County (Barcelona, NE Spain). The lines were fitted with linear regression, and their R2 values are shown by the lines (all p < 0.05).
Diversity 16 00343 g006
Figure 7. The relationship between landscape diversity/heterogeneity (Shannon H’) and land cover of the two main land uses (crops: orange dots; forests: green dots) shows a unimodal pattern revealed by the association to a polynomial function (p < 0.0001 in both).
Diversity 16 00343 g007
Table 1. Simultaneous responses of small mammal species to the environmental axes extracted by the Redundancy Analyses performed with the two predictor matrices. The model selection (linear versus quadratic) was carried out according to the Akaike criterion (AIC) through general linear model analysis (GLMs), and the asterisk indicates the best model when both were significant. Species and indices that did not fit any model were not included in the table.
Environmental GradientsModel SelectionGLM Results
Geography-Climate (Axis 1 + Axis 2)LinearQuadraticFp
Sorex araneus√ *27.41<0.0001
Sorex minutus√ *37.7<0.0001
Crocidura russula√ *8.080.002
Suncus etruscus 14.160.0002
Apodemus flavicollis 12.490.0009
Microtus duodecimcostatus√ *20.3<0.0001
Species Richness 14.560.0004
Land uses (Axis 1 + Axis 2)
Sorex araneus√ *11.930.0005
Sorex minutus√ *40.55<0.0001
Crocidura russula√ *17.030.0001
Suncus etruscus 4.780.017
Apodemus flavicollis√ *11.050.0007
Apodemus sylvaticus 5.410.01
Microtus duodecimcostatus 6.730.009
Microtus lavernedii√ *7.330.003
Species Richness√*9.490.001
Disclaimer/Publisher’s Note: The statements, opinions and data contained in all publications are solely those of the individual author(s) and contributor(s) and not of MDPI and/or the editor(s). MDPI and/or the editor(s) disclaim responsibility for any injury to people or property resulting from any ideas, methods, instructions or products referred to in the content.