Article

Floristic Diversity and Natural Regeneration of Miombo Woodlands in the Rural Area of Lubumbashi, D.R. Congo

by
Dieu-donné N’tambwe Nghonda
1,2,*,
Héritier Khoji Muteya
1,2,
Waselin Salomon
3,
Fidèle Cuma Mushagalusa
1,
François Malaisse
2,
Quentin Ponette
4,
Yannick Useni Sikuzani
1,
Wilfried Masengo Kalenga
1 and
Jan Bogaert
2,*
1
Ecology, Ecological Restoration and Landscape Unit, Faculty of Agronomic Sciences, University of Lubumbashi, Lubumbashi 1825, Democratic Republic of the Congo
2
Biodiversity, Ecosystem and Landscape Unit, University of Liège—Gembloux Agro-Bio. Tech., 5030 Gembloux, Belgium
3
Henri Christophe Campus of Limonade, State University of Haiti, 1130, National Route # 6 Limonade, Limonade HT 1130, Haiti
4
Earth and Life Institute, Catholic University of Louvain, 1348 Louvain-la-Neuve, Belgium
*
Authors to whom correspondence should be addressed.
Diversity 2024, 16(7), 405; https://doi.org/10.3390/d16070405
Submission received: 9 June 2024 / Revised: 11 July 2024 / Accepted: 12 July 2024 / Published: 13 July 2024

Abstract

:
Increased anthropogenic pressure on forest resources leads to deforestation and forest degradation, significantly limiting the regeneration capacity of native woody species and consequently the restoration of miombo woodlands in anthropized habitats within the rural area of Lubumbashi. This study assessed miombo species’ diversity and natural regeneration capacity through floristic inventories in three different habitats (unexploited forests, degraded forests, and post-cultivation fallows). The results reveal that for the adult stratum, unexploited and degraded forests exhibit higher dendrometric (density, mean square diameter, basal area) and floristic parameter (taxa, genera, families) values compared to post-cultivation fallows. Furthermore, the regeneration of miombo woody species is higher in degraded forests (21 taxa; 105 juveniles/plot). However, regarding the sapling’s stratum (1 cm ≤ dbh < 10 cm), the three habitats display similar situations. Additionally, the floristic composition and diversity of unexploited and degraded forests show a significantly higher similarity (76.50%) among them compared to these habitats and the post-cultivation fallows (56.00%). These findings indicate that miombo woodlands have the potential to regenerate and maintain floristic diversity even in anthropized habitats, particularly in degraded forests. To sustain this natural regeneration capacity of miombo woody species and promote the restoration of forest cover and its floristic diversity, it is imperative to determine the rotation period after habitat exploitation and regulate anthropogenic activities and late bush fires, particularly in anthropized habitats at the village level.

1. Introduction

Forests constitute one of the most crucial terrestrial biomes on the planet, harboring 80% of terrestrial biodiversity [1,2] across approximately 4.06 billion hectares [3]. In Africa, forests cover 23% of the continent, totaling 675 million hectares [4], with nearly 10% of this area dominated by miombo woodlands [5,6]. Miombo woodlands are predominantly composed of woody species from the genera Brachystegia, Julbernardia, and Isoberlinia [7]. These woodlands span about 2.8 million km2 in the Zambezi region [8], supporting the livelihoods of over 100 million rural and urban residents through the ecosystem services they provide [6,9]. Moreover, miombo woodlands boast significant biodiversity with high endemism rates, making them a conservation priority [10,11].
However, miombo woodlands are experiencing a reduction in area due to natural and particularly anthropogenic factors [12]. The combination of population growth and a deleterious socio-economic and political context, which forces local populations to heavily rely on forest resources for survival [13], leads to deforestation and degradation [14,15]. Furthermore, inadequate and poorly enforced forestry legislation [16] results in unsustainable exploitation of forest resources, exacerbating deforestation and degradation [17].
The direct anthropogenic drivers of this change are primarily agriculture and charcoal production [15,18], both of which are itinerant [19]. Additional factors include the extraction of timber and craft wood, fuelwood, and late and repeated bushfires, all of which contribute to forest loss [20,21]. Consequently, the annual conversion rate of miombo woodlands ranges from 2% to 22% within the miombo ecoregion [21], with significantly higher rates in countries with intense anthropogenic pressure due to population poverty, such as the Democratic Republic of Congo (D.R. Congo). Despite its high forest potential, the D.R. Congo has the highest annual deforestation rate in the Congo Basin: approximately −0.4% between 2001 and 2019 [22]. Furthermore, in the southeastern D.R. Congo, where miombo woodlands are the dominant vegetation unit [23], its coverage dropped from nearly 70% to 43% between 2000 and 2010 [24]. In this region, the miombo deforestation rate is even higher in rural areas adjacent to major cities, such as the rural area of Lubumbashi, which has a deforestation rate of 1.51% [15]. This situation contributes to environmental degradation and threatens the livelihoods of rural and urban populations dependent on miombo woodlands [2,9].
To address this deforestation and forest degradation, forest cover restoration is one of the recommended solutions [5,25,26,27]. Restoration involves adaptive processes that implement practices to restore ecological functionality and enhance human survival in deforested or degraded habitats [27]. This can be achieved through reforestation using fast-growing exotic woody species, which allows for the short-term reconstitution of vegetation cover and the availability of ecosystem services [19]. However, these exotic species pose a threat to native biodiversity and alter the original forest functions [28,29]. Therefore, using native woody species remains a viable alternative, ensuring the continuity of ecosystem service production by maintaining floristic composition, structure, and function [1]. This restoration typically involves nursery seedling production or facilitating natural regeneration in habitats. However, combined with logistical complexity management, nursery and the final establishment of seedlings in human-disturbed habitats can be costly, reducing its applicability [5]. In this perspective, promoting natural regeneration is a sustainable and optimal alternative to current forest loss [25]. Natural regeneration allows adult individuals in a plant community to replace themselves by establishing juveniles in the undergrowth (dbh < 10 cm) [30]. This regeneration, which ensures the persistence of woody species [31], is dependent on the disturbance gradient of habitats and the resilience of woody species to these disturbances [14].
Furthermore, several studies on the natural regeneration of forests in anthropized habitats have already been conducted in the Miombo ecoregion [2,6,14,21,32,33,34,35]. However, these studies have predominantly focused on Southern Africa, while no research on natural regeneration has been initiated in the miombo woodlands of Central Africa, whose ecological and floristic characteristics increasingly differ from those of Southern African miombo [23]. Additionally, no study has been conducted to analyze the natural regeneration of miombo woodlands through forest inventory. This inventory technique remains reliable for assessing the capacity of woody species to regenerate and consequently restore forest cover [31,36]. Moreover, results on the natural regeneration capacity of woody species are valuable for forest management, sustainable biodiversity management [20], and implementing responses to human disturbances to ensure miombo woodlands’ resilience [14].
In this context, the present study was initiated to evaluate the natural regeneration capacity of miombo woody species in the rural area of Lubumbashi. It tests the hypothesis that (i) the density, average diameter, basal area, and floristic diversity differ among habitats due to anthropogenic disturbances. Higher values are expected in unexploited forests and lower values in post-cultivation fallows, with degraded forests in between. (ii) The regeneration capacity of miombo species is higher in degraded forests than in unexploited forests and post-cultivation fallows, due to the availability of resources (water, light, space) and lower intra/inter-specific competition and disturbances. (iii) The floristic diversity of strata and habitats shows similarities. Higher similarities in floristic composition are expected between strata of unexploited and degraded forests compared to post-cultivation fallows, due to lower disturbances in these habitats.

2. Materials and Methods
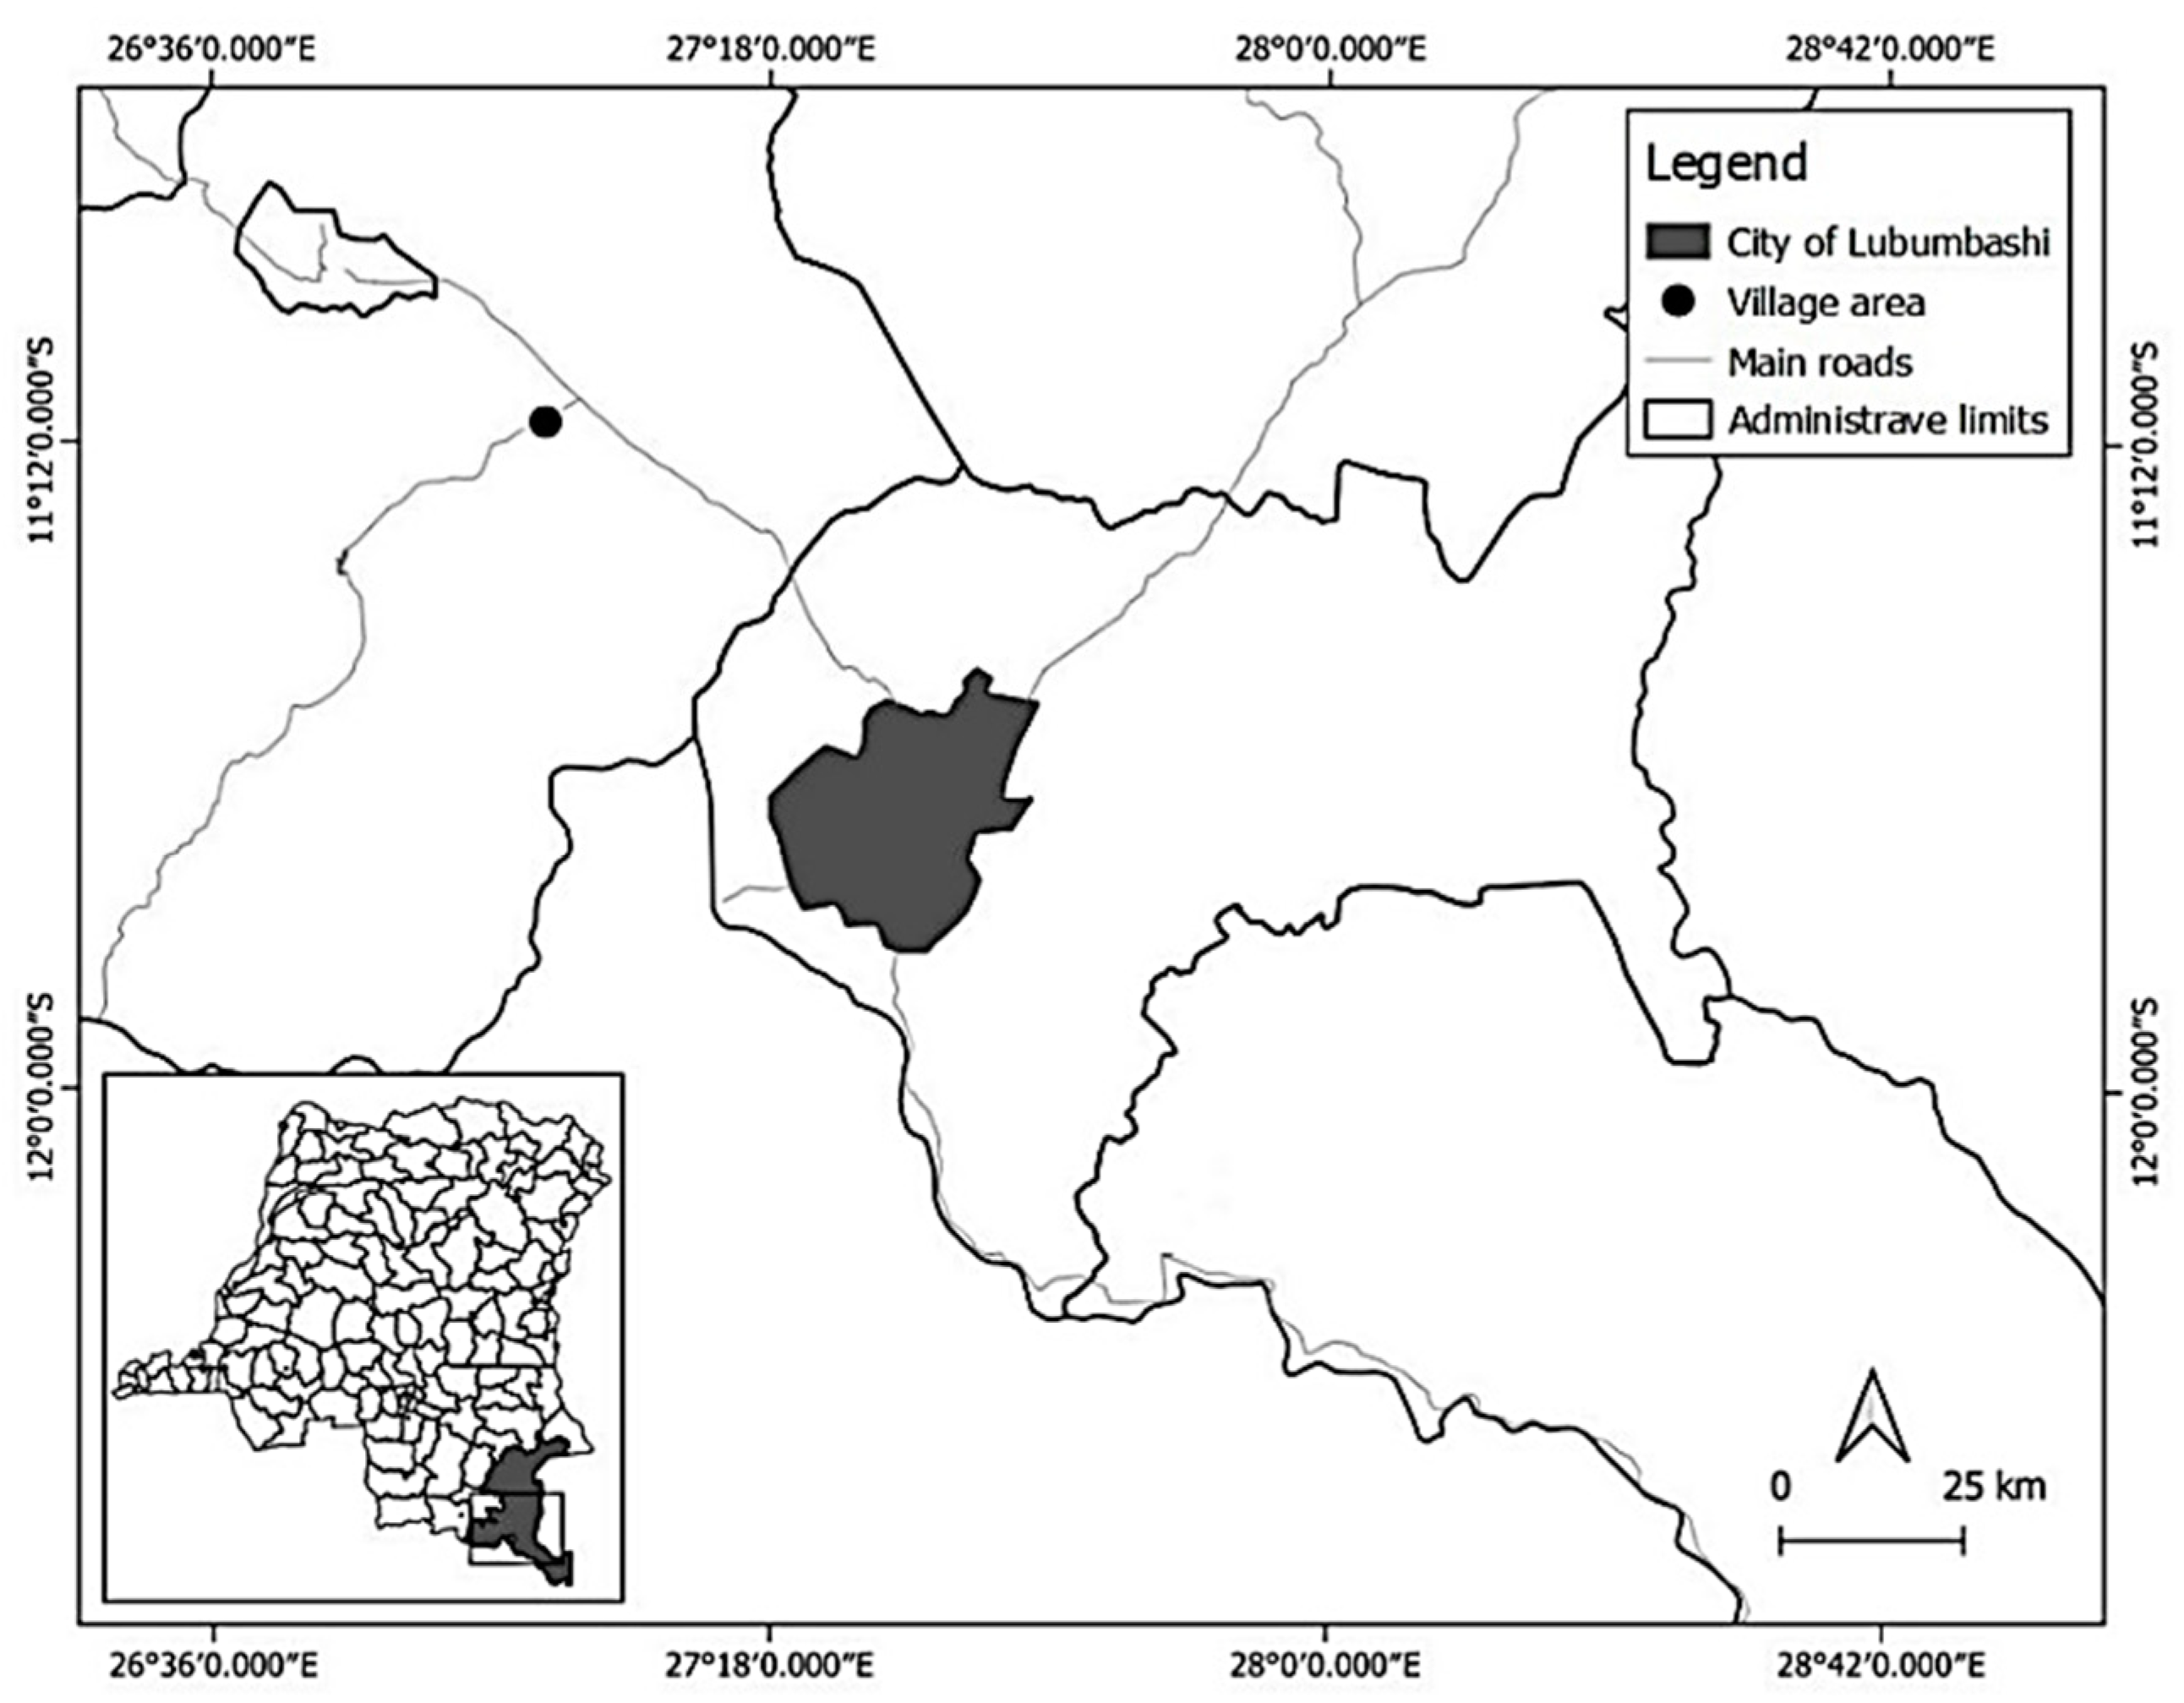
2.1. Study Area

The present study was conducted in the rural area of Lubumbashi, located in southeastern D.R. Congo (Figure 1).
Situated at an altitude ranging from 1200 to 1300 m, Lubumbashi and its rural surroundings have a Cw-type climate, characterized by a rainy season (November–March) and a dry season (May–September), separated by two transitional months (April and October) [37]. While the average annual temperatures in the latter half of the 20th century ranged between 17 and 26 °C [7], recent observations indicate a warming trend [38]. Annual total precipitation varies between 1200 and 1300 mm [23]. Typically established on ferralitic soils [39], the miombo woodland is the dominant vegetation unit, although its cover is constantly declining primarily due to shifting agriculture, charcoal production, and increasing urbanization [12,15,18]. The population in the Lubumbashi region remains heavily dependent on natural resources, which are increasingly depleted by shifting agriculture and charcoal production (97.9% of the population), art wood carving (1.5%), artisanal timber exploitation (0.4%), and non-timber forest product collection (0.2%) [40]. Moreover, this population predominantly lives on less than USD 1.25 per day, indicating a high level of poverty and food insecurity [41].
Additionally, the village area of Lwisha, located approximately 80 km northwest of Lubumbashi, was selected as the study site. This village area was chosen due to its identification as a site with high anthropogenic activities, particularly agriculture, charcoal production, and mining [40,42]. Furthermore, the selection was guided by the availability of both unexploited and anthropized forest habitats, specifically those affected by charcoal production (degraded forests) and agriculture (post-cultivation fallows). Moreover, the village demonstrates weak implementation of the existing simple forest management plan, contributing to deforestation and forest degradation.

2.2. Methods

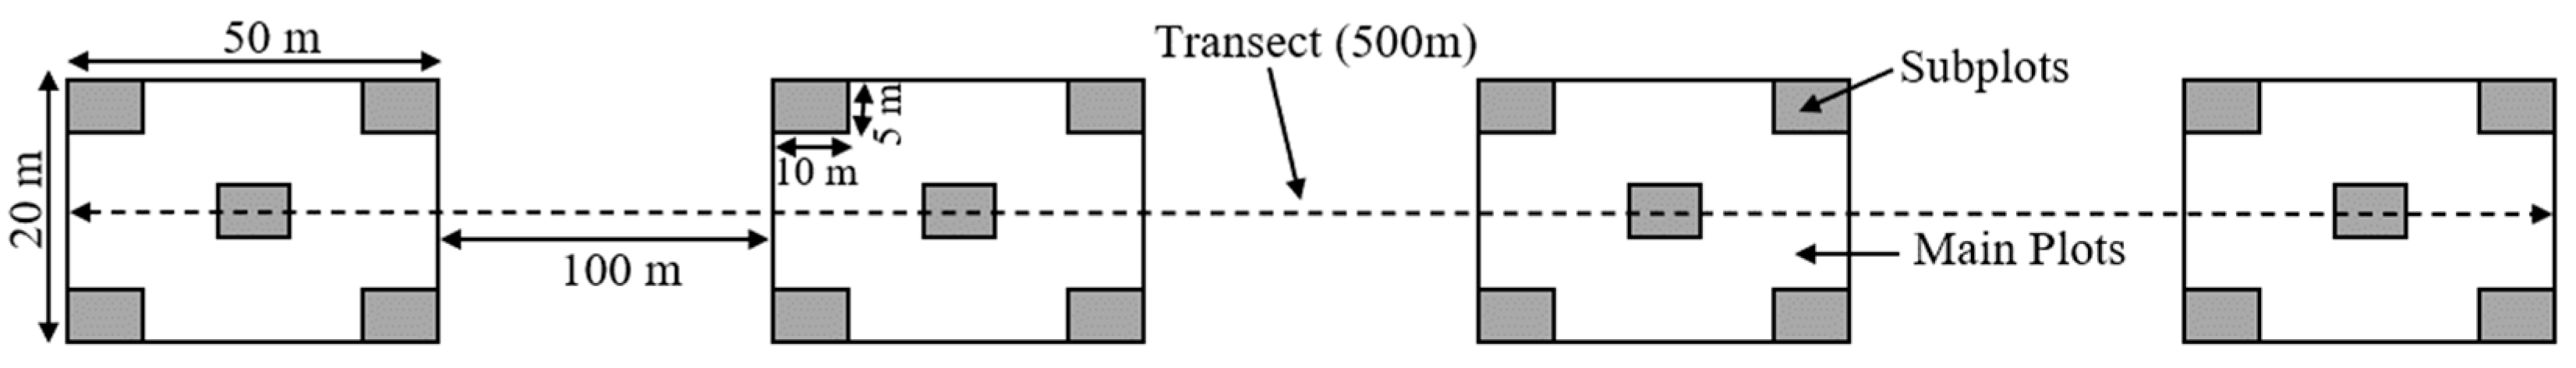
2.2.1. Sampling and Data Collection

To study the composition and floral diversity, three habitat types were chosen: unexploited forests (UFO), degraded forests (DFO), and post-cultivation fallows (PCF). These habitats are illustrated and described in the table below (Table 1).
For comparison purposes, the degraded forests and post-cultivation fallows were 4 to 5 years post-exploitation, corresponding to the optimal fallow period in the Lubumbashi region [45]. These anthropized habitats were selected based on a visual analysis of high-resolution Quick Bird images available for free on Google Earth [46]. In each habitat, four transects, each 500 m long, were established along the four cardinal points (north, south, east, and west) of the village. On each transect, four floristic inventory plots measuring 50 m × 20 m, spaced 100 m apart, were set up [6]. This method significantly reduces alignment, angle, and width measurement errors that often occur during the setup of continuous plots. Additionally, it saves time and enhances data reliability, result consistency, and reproducibility [47]. Furthermore, to assess the regeneration of miombo woody species and thus the restoration of this forest ecosystem in anthropized habitats, 80 subplots of 10 m × 5 m each were installed in each habitat [14]. This represents 20 subplots per transect and 5 subplots per inventory plot (Figure 2). The dimensions of the plots and subplots were determined based on previous studies ([6,14] indicating that 50 m × 20 m and 10 m × 5 m are adequate dimensions for floristic and forest regeneration studies in the miombo woodlands, respectively).
Furthermore, in each plot, all woody individuals with a diameter at breast height (dbh) ≥ 10 cm were inventoried. The diameter of these individuals was measured using forestry tape [31]. Additionally, in these subplots, juvenile individuals (dbh < 10 cm) were inventoried, and their diameters were measured. The inventory considered three groups: seedlings (dbh < 1 cm), saplings (1 cm ≤ dbh < 10 cm), and adults (dbh ≥ 10 cm) [48]. The first two strata consist of juvenile individuals (regeneration individuals) while the last stratum represents the adult population. It should be noted that seedlings were only counted. Moreover, juveniles from coppicing were not included in the inventory. The floristic inventories for this study were conducted from 25 March to 29 June 2023. During the inventories, the identification of unknown woody species was facilitated by comparing the collected herbarium specimens with existing floras (Flora of Zambia, Flora of Zimbabwe, and World Flora), specialized books, and various identification guides [7,49,50].

2.2.2. Data Analysis

The detailed analyses in this section focused on individuals inventoried in the three strata. However, the mean square diameter and basal area were not calculated for seedlings, as their diameters were not measured during the floristic inventory. Additionally, relative frequency and density, the natural regeneration index, and alpha diversity were only applied to the regeneration strata. To ensure homogeneity among plots of different ages within each habitat, the variability in terms of density and floristic diversity was tested at a 5% significance level [51]. Thus, data collected on regeneration (dbh < 10 cm) in the subplots were extrapolated to the plot level, considering the ratio between the plot area (50 m × 20 m) and the cumulative area of the subplots within each plot (5 × (10 m × 5 m)).
Furthermore, to characterize the three habitats, the density of individuals (N; Equation (1)), quadratic mean diameter (DBHm; Equation (2)), and basal area of individuals (GBA; Equation (3)) of the inventoried adult individuals were calculated [6,31,52]. Density expresses the number of individuals inventoried per unit area (ha), while the basal area is a common measure in forest management (expressed in m2/ha), representing the cross-sectional area of tree trunks at breast height (1.3 m) [31]. The quadratic mean diameter is the calculated diameter (expressed in cm) for trees with multiple trunks or branches at 1.3 m above the ground [31]. In this study, this parameter (DBHm) was used to calculate the average diameter of woody individuals inventoried in each habitat. Additionally, the averages of woody plant species, genera, and families were calculated for these habitats [51].
N = n i a
where ni is the number of individuals of a species in a plot, and a is the area of the plot expressed in hectares.
D B H m = 1 n i = 1 n d i 2
where di is the diameter at breast height (DBH) of each tree trunk or branch, measured at 1.3 m above the ground, and n is the total number of these trunks or branches measured.
G B A = F E i = 1 m g i
with gi, the basal area of each measured individual (expressed in m2/plot area), calculated using the equation below (Equation (4)), m is the number of woody individuals inventoried in the plot, and FE is the extension factor related to the plot area (m2), used to extrapolate gi values to per hectare [31].
g i = π D 2 4
with D, the diameter at breast height (DBH) of an individual, measured at 1.30 m above the ground.
In addition, to assess the regeneration potential (dbh < 10cm) of the habitats, the frequency (f; Equation (5)), relative frequency (RF; Equation (6)), and relative density (RD; Equation (7)) were calculated [6]. Frequency expresses the probability of a woody species being inventoried in each of the floristic inventory plots, while relative frequency is the proportion that a given species represents compared to all inventoried species. Relative density, on the other hand, expresses the proportion that individuals of a given species represent compared to the entire population of individuals in a forest stand [14].
f = n   N p
with n being the total number of plots in which the species has been inventoried and Np the total count of plots.
R F = f   F × 100
with f being the frequency of a woody species and F the sum of all frequencies.
R D = n i   N × 100
where ni is the number of individuals of a species and N is the total count of all inventoried individuals.
Additionally, the natural regeneration index (NRI), defined as the ratio between the number of juvenile individuals (dbh < 10 cm) and the number of adult individuals (dbh > 10 cm) of a species, was calculated [53]. When NRI < 1, the regeneration of the species in question is low, while when NRI ≥ 1, the regeneration is high [54]. Furthermore, to compare the abundance and specific diversity of habitat regeneration, the Fisher alpha index (α; Equation (8)) [2,55] was calculated. Additionally, the sampling effort of woody species in the regeneration was assessed by calculating the proportion between the inventoried species in the understory (Taxa_S) and the number of species according to the floristic richness estimator (Chao 1) [50].
α = i = 1 S N i N i 1 ( i = 1 S n i ) ( i = 1 S N i ) i = 1 S N i 2
with S being the total number of species; Ni the total abundance of species i, and ni the number of sites or plots where species i is present.
Furthermore, to identify statistical differences at the 5% significance level among the parameters characterizing the three habitats—unexploited forests, degraded forests, and post-cultivation fallows—the non-parametric Kruskal–Wallis test was applied. This test, which compares group medians, is suitable for datasets that do not meet the normality assumptions required by parametric tests, thus providing robust comparisons across multiple groups. Specifically, dendrometric parameters, including the density of individuals per hectare, quadratic mean diameter, and basal area, as well as floristic parameters such as the number of individuals, taxa, genera, families, Chao-1 estimator, and Fisher alpha index, were analyzed. The non-normal distribution of the data, confirmed by the Shapiro test [56], motivated our choice of the Kruskal–Wallis test. When significant differences were found, the Dunn–Bonferroni post hoc test was employed for pairwise comparisons among strata or habitats [57,58]. Finally, The Jaccard index (J; Equation (9)) [59] was used to compare floristic lists of habitat strata, highlighting the impact of anthropogenic disturbance on species composition.
J = a a + b + c
where a is the total number of woody species inventoried in two habitats for comparison; b and c, respectively, represent the number of woody species inventoried in one of the two habitats but absent in the other habitat.
All these analyses were conducted using R software version 4.3.2. Pairwise comparisons of floristic diversity between strata and habitats were performed using Past 4.05 software, while the alpha diversity index was calculated using EstimateS version 9.1 software.

3. Results

3.1. Floristic Characterization of the Three Habitats along an Anthropization Gradient

A total of 1099 adult individuals were inventoried in the three habitats, belonging to 60 species, 40 genera, and 25 families. Additionally, many of these individuals were inventoried in unexploited and degraded forests compared to post-cultivation fallows. Furthermore, the families Fabaceae and Phyllanthaceae are the most represented, particularly in the unexploited forests (Table 2).
However, the mean values of dendrometric parameters are higher in the unexploited and degraded forests compared to the post-cultivation fallows. Moreover, floristic diversity is higher in the unexploited forests in particular (Table 3). These results highlight the importance of preserving untouched forests to maintain both forest structure and biodiversity. They underscore the potential impacts of logging and degradation on these critical parameters and advocate for sustainable management and conservation strategies to protect these valuable ecosystems.

3.2. Natural Regeneration of Miombo Woody Species in the Three Habitats

The study inventoried 23,052 regenerating individuals across varied forest types: 7576 juveniles in unexploited forests, 9044 in degraded forests, and 6432 in post-cultivation fallows. These juveniles represented 82 species (unexploited: 59, degraded: 69, fallows: 70), 59 genera (unexploited: 43, degraded: 48, fallows: 53), and 30 families (unexploited: 25, degraded: 25, fallows: 27). However, in unexploited forests, seedlings (dbh < 1 cm) spanned 54 species, 40 genera, and 25 families; saplings (1 cm ≤ dbh < 10 cm) were found in 43 species, 32 genera, and 19 families. In degraded forests, seedlings were in 63 species, 43 genera, and 25 families, and saplings in 44 species, 32 genera, and 19 families. Post-cultivation fallows had seedlings in 58 species, 44 genera, and 25 families, and saplings in 53 species, 41 genera, and 21 families. Seedlings predominated: 87.49% in unexploited forests, and 73.64% in degraded forests and 72.70% in fallows, while saplings comprised 12.51%, 26.36%, and 27.30% respectively. In addition, Fabaceae and Phyllanthaceae were predominant, comprising 42.37% to 44.93% of the inventoried species and 70.15% to 70.80% of juvenile individuals across all habitats. Most seedlings were in unexploited and degraded forests; fewer saplings were noted in unexploited forests compared to anthropized habitats. Brachystegia and Albizia species were prominent across regeneration strata (Table 4). Further details on the relative frequency, and relative density of species, can be found in the Supplementary Materials (Table S1).
However, the results indicating similar dendrometric and floristic parameters across habitats highlight surprising uniformity despite environmental differences. Additionally, the low density per hectare, as well as the number of individuals, species, and genera in the seedling stratum of post-cultivation fallows (Table 5), raise questions about these habitats’ ability to restore forest cover in optimal time. These observations suggest that fallows require careful management to promote woody species regeneration, diversity, and forest restoration.
The regeneration potential of species remains high in unexploited forests within the seedling stratum, while it is high in anthropized habitats within the sapling stratum. These results show the capacity of miombo species to regenerate, and subsequently to reconstitute forest cover in anthropized habitats, particularly in degraded forests, which experience lower anthropogenic disturbances compared to fallows. The table below (Table 6) lists the top five species with the highest natural regeneration index. The complete table is provided in the Supplementary Materials (Table S2).

3.3. Comparison of the Specific Richness of Woody Species Inventoried in Regeneration and Adult Stands

However, the Jaccard similarity of floristic lists among different strata in the three habitats is depicted in the table below (Table 7). It is evident from this table that the lowest similarity is between the floristic list of seedlings in degraded forests and that of adults in post-cultivation fallows (42.00%), while the highest similarity is between the floristic lists of installed juveniles in unexploited forests and those in degraded forests (92.00%). Nonetheless, a pairwise comparison of floristic lists of habitats (all strata combined) reveals that the floristic lists of unexploited and degraded forests exhibit a similarity of 76.50%, whereas that of post-cultivation fallows is 56.00% similar to unexploited and degraded forests, respectively. These results indicate that the floristic lists of habitats are influenced by natural factors (intra- and interspecific competition) and, particularly, by the extent of disturbances experienced by the habitats.

4. Discussion

4.1. Structure and Floristic Composition of Forest Strata and Stands along the Anthropization Gradient

Dendrometric, particularly the density, and floristic parameters decrease according to the increase in the level of habitat disturbance (Table 2 and Table 3). This situation is attributed particularly to anthropogenic disturbances experienced by the anthropized habitats, primarily agriculture and charcoal production. Indeed, cutting trees for dendro-energy (typically targeting larger-diameter trees during selective logging) and agriculture reduces tree density and biomass, thereby affecting both the diversity and distribution of woody species [60]. Thus, the conversion of forested lands into agroecosystems and dendro-energies leads to deforestation and fragmentation of the miombo woodlands, particularly in the Lubumbashi region [15]. According to Refs. [18,61], anthropogenic activities disrupt the ecological balance of ecosystems, subsequently affecting the structure and composition of the miombo woodlands. However, natural factors such as climate change and natural disasters can also negatively impact the dendrometric and floristic parameters of habitats [62]. These results, found in the present study, corroborate those of other research conducted in the miombo ecoregion [2,14,21,35,51,63], showing that the values of dendrometric (number of individuals inventoried, mean quadratic diameter, basal area) and floristic parameters (number of species, genera, and families) of habitats decrease as anthropogenic disturbances increase.

4.2. Regeneration of Miombo Woody Species along the Anthropization Gradient

The regeneration potential (individual number and diversity) of habitats within the two regeneration strata remains higher in degraded forests than in unexploited forests and post-cultivation fallows (Table 4, Table 5 and Table 6). These results demonstrate that the regeneration of woody species and subsequently the reconstitution of the miombo woodlands would be possible in anthropized habitats provided that human activities, especially agriculture, dendro-energy production, wood cutting, and bushfires, are prohibited. Additionally, these measures must be increasingly enforced in heavily disturbed habitats, such as post-cultivation fallows. The similarity in floristic richness between degraded and unexploited forests could be explained by the fact that the anthropogenic disturbances experienced by degraded forests, particularly related to the decrease in individual density through selective harvesting, make resources available in these habitats, such as space, water, and insolation [64]. This resource availability, coupled with low inter- and intraspecific competition, allows woody species, particularly pioneer species and those resilient to anthropogenic disturbances (present in the herbaceous stratum and the soil seed bank), to establish themselves [57]. In contrast to degraded forests, anthropogenic disturbances in agroecosystems are not only related to the loss of woody species density (tree cutting and stump removal) but also to the disruption of soil physicochemical and biological properties [19]. The combination of these disturbances negatively affects the regeneration potential and resilience capacity of woody species, potentially leading to savannization [65]. Furthermore, the regeneration potential in unexploited forests would depend on strong inter-and intraspecific competition for the aforementioned resources, primary factors in the establishment of plant species in habitats [66,67]. These results corroborate previous research [14,51,68,69] indicating that anthropized habitats exhibit high species richness in regeneration strata. These anthropized habitats are characterized by high environmental heterogeneity during early succession stages and high regeneration potential of miombo woody species [6]. However, these results do not support the findings of studies conducted, notably in Zimbabwe by [35], indicating that species richness is high in unexploited forests due to the absence of anthropogenic disturbances on a human scale. Nevertheless, the regeneration potential in unexploited forests depends on several factors, including inter/intra-specific competition for resources and minimal anthropogenic disturbances. Additionally, the vigor of adult trees (producing quality and sufficient seeds), the presence of animal species (facilitating seed dispersal), symbiotic interactions, good soil structure, and high nutrient availability also play crucial roles. These factors interact in complex ways, influencing the regeneration process in unexploited forests [66,70].
However, these disturbances could create new environmental conditions that sometimes favor increased plant diversity if these anthropogenic disturbances are of low intensity, limited duration, and characterized by minimal removal [71]. This situation has already been highlighted in previous studies conducted in the miombo ecoregion [34,72], demonstrating that floristic characteristics such as stand structure and species richness of habitat with medium anthropization level can reach values higher than those of unexploited mature forests after anthropogenic disturbances cease. Indeed, habitats with intermediate disturbance regimes, such as degraded forests in this study, may exhibit high species diversity through the creation of diverse ecological niches, thereby confirming the widely evoked intermediate disturbance hypothesis in various fields of natural resources management and conservation [73].
Conversely, maintaining human pressure on natural resources even in heavily anthropized habitats compromises the regeneration of woody species and subsequently the reconstitution of the miombo woodlands. Indeed, the distance from intact forests over an increasingly extensive radius [12] has led local communities to harvest woody species, furthermore through less sustainable practices [74], in anthropized areas near settlements for various needs [6]. In addition to this, late and repetitive bushfires [75] characterizing the miombo ecoregion [44,76,77,78] and particularly the Lubumbashi region [79], affect the natural regeneration of woody species in habitats. Moreover, the scarcity of species with high calorific value and the increase in charcoal production distance induce the return of local communities to regenerating forest stands. This situation contributes to maintaining a high level of forest degradation [80] and decreases the potential for forest regeneration. Similarly, population growth and increased land pressure resulting from it have led local communities to shorten fallow periods to meet increased demand for necessities [45]. This further disrupts the process of woody species regeneration and ongoing miombo woodlands reconstitution in post-cultivation fallows [81]. These results are similar to those of studies conducted in Mozambique [6], showing that ongoing human activities in already anthropized habitats compromise the reconstitution of the miombo woodlands in these habitats.

4.3. Similarity between Floristic Lists along the Anthropization Gradient

The floristic lists of strata in unexploited forests and degraded forests exhibit higher similarities compared to post-cultivation fallows (Table 7). This similarity between unexploited forests and degraded forests is also observed among habitats when all strata are merged. This situation is attributed to the fact that during exploitation, agrosystems transitioning into post-cultivation fallows undergo anthropogenic disturbances that negatively impact dendrometric and floristic parameters, particularly. These findings corroborate studies conducted in the dense humid forest region [51,82], and specifically in the miombo ecoregion [6,35], demonstrating that anthropogenic activities in agrosystems negatively influence floristic diversity in post-cultivation fallows.

4.4. Implications for Sustainable Miombo Woodlands Restoration in Anthropized Landscapes

Anthropogenic disturbances affect the high potential for natural regeneration and resilience of different miombo woody species. To address this, Assisted Natural Regeneration (ANR) could be one solution. ANR involves the deliberate protection of disturbed habitats against anthropogenic pressures and invasive plant species to accelerate natural forest succession processes leading to the reconstitution of a resilient and productive ecosystem [5,26]. It requires legislative reform and rules governing interactions between natural and social dynamics [83]. However, in the D.R. Congo, this reform would focus on access to natural resources, establishing reasonable rotation periods, regulating bushfires, and anthropogenic incursions into habitats at the end of their exploitation. ANR could be effective and less costly than reforestation and other revegetation strategies, provided there are seed sources in the restoration area [5]. This restoration technique has been successfully used in Ethiopia to restore forests over significant areas previously impacted by anthropogenic activities and has been proposed in Mozambique to restore miombo woodlands in anthropized habitats [5,73]. However, in regions with rapid population growth like the Lubumbashi region, implementing ANR can be challenging due to increased anthropogenic pressures on land and natural resources. To address this, zoning and defined collaborative restoration options involving local communities actively would be one solution to this situation [27,40].
Furthermore, reforestation and forest enrichment—practice aimed at restoring and enhancing selectively logged forests by introducing valuable woody species (cultural, economic)—would be palliative solutions for anthropized habitats with low miombo resilience capacity after exploitation, such as post-cultivation fallows. Utilizing miombo woody species for reforestation and habitat enrichment would result in forest ecosystems with a structure, specific composition, and function similar to those of the previously exploited forest. In this regard, these restored habitats would continue to support the survival of both rural and urban populations by providing the usual ecosystem services [84]. However, selecting fast-growing native species like Pterocarpus tinctorius Welw. and Combretum collinum Fresen. is necessary for short-term miombo woodlands reconstitution [85]. Nevertheless, similar to ANR habitats, reforested or enriched habitats should be protected from anthropogenic intrusions [6,35] and late, repetitive bushfires [79,86].
Furthermore, this study shows the current state of anthropized habitats regarding regeneration potential and subsequent forest reconstitution. However, it does not depict the successional dynamics of woody species in these habitats over the years following exploitation [21,35,52]. Additionally, the study does not show the distribution of these woody species based on their functional traits within different strata and habitats [50]. These missing ecological aspects would provide complementary information to the present results and remain important for the establishment of sustainable miombo woodlands management strategies.

5. Conclusions

The present study assessed the natural regeneration capacity of miombo woody species along a gradient of anthropization through floristic inventories in three different habitats, including one that was unexploited and two with varying levels of anthropization. The results confirm that density, mean diameter, basal area, taxa, genera, and families have high values in both unexploited and degraded forests. Indeed, significant differences were observed among the three habitats, with low values observed in fallows. Furthermore, these results confirm that the regeneration potential of miombo species and individuals’ numbers are high in degraded forests. However, low regeneration was observed in unexploited forests and post-cultivation fallows, except in the sapling’s stratum where regeneration in different habitats is almost equivalent. Additionally, our results indicate that there are similarities and dissimilarities in terms of floristic richness between habitats, as the floristic lists of unexploited forests and degraded forests show higher similarities than post-cultivation fallows. While our study did not characterize variations in dendrometric and floristic parameters according to the age of anthropized habitats, as well as the distribution of species in strata and habitats in terms of functional traits of woody species, our results show that the regeneration potential of miombo species depends on the intensity of anthropogenic disturbances experienced by habitats. To contribute to the regeneration of woody species and the reconstitution of miombo in anthropized habitats, appropriate legislation determining rotation periods and regulating repetitive bushfires and anthropogenic activities should be established. Additionally, inclusive reforestation and agroforestry activities using miombo woody species should be considered.

Supplementary Materials

The following supporting information can be downloaded at https://www.mdpi.com/article/10.3390/d16070405/s1.

Author Contributions

Conceptualization, Y.U.S. and J.B.; methodology, Y.U.S. and J.B.; software, D.-d.N.N., H.K.M. and F.C.M.; validation, Q.P., Y.U.S., W.M.K. and J.B.; formal analysis, D.-d.N.N. and H.K.M.; investigation, D.-d.N.N.; resources, F.C.M., F.M., Q.P. and W.S.; data curation, H.K.M.; writing—original draft prep-aration, D.-d.N.N.; writing—review and editing, F.C.M., F.M., Q.P., Y.U.S., W.M.K., J.B. and W.S.; visu-alization, Y.U.S.; supervision, W.M.K. and J.B.; project administration, Y.U.S. and J.B.; funding ac-quisition, Y.U.S. and J.B. All authors have read and agreed to the published version of the manuscript.

Funding

The research was funded by the project CHARLU (ARES-CCD, Belgium).

Data Availability Statement

The data related to the present study will be available upon request from the interested party.

Acknowledgments

The authors acknowledge the Academy of Research and Higher Education (ARES) and the Research Project for Development: “Strengthening the capacity for sustainable management of miombo woodlands by assessing the environmental impact of charcoal production and improving practices towards forest resources (PRD CHARLU)” for financial support for this study through the doctoral scholarship awarded to Dieu-donné notambwe Nghonda and Héritier Khoji Muteya.

Conflicts of Interest

The authors declare no conflict of interest.

References

  1. Aerts, R.; Honnay, O. Forest restoration, biodiversity and ecosystem functioning. BMC Ecol. 2011, 11, 29. [Google Scholar] [CrossRef] [PubMed]
  2. Kalaba, F.K.; Quinn, C.H.; Dougill, A.J.; Vinya, R. Floristic composition, species diversity and carbon storage in charcoal and agriculture fallows and management implications in Miombo woodlands of Zambia. For. Ecol. Manag. 2013, 304, 99–109. [Google Scholar] [CrossRef]
  3. FAO. La Situation des forêts du monde 2022. In Des Solutions Forestières Pour une Relance verte et des Économies Inclusives, Résilientes et Durables; FAO: Rome, Italy, 2022; 180p. [Google Scholar] [CrossRef]
  4. Gonçalves, F.M.P.; Chisingui, A.V.; Luís, J.C.; Rafael, M.F.F.; Tchamba, J.J.; Cachissapa, M.J.; Caluvino, I.M.C.; Bambi, B.R.; Alexandre, J.L.M.; Chissingui, M.D.G.; et al. First vegetation-plot database of woody species from Huíla province, SW Angola. VCS 2021, 2, 109–116. [Google Scholar] [CrossRef]
  5. Berrahmouni, N.; Regato, P.; Parfondry, M. Global Guidelines for the Restoration of Degraded Forests and Landscapes in Drylands: Building Resilience and Benefiting Livelihoods; FAO: Rome, Italy, 2015; 173p. [Google Scholar]
  6. Ameja, L.G.; Ribeiro, N.S.; Sitoe, A.; Guillot, B. Regeneration and Restoration Status of Miombo Woodland Following Land Use Land Cover Changes at the Buffer Zone of Gile National Park’s Central Mozambique. Trees For. People 2022, 9, 100290. [Google Scholar] [CrossRef]
  7. Malaisse, F. How to Live and Survive in Zambezian Open Forest (Miombo ecoregion); Les Presses Agronomiques de Gembloux: Gembloux, Belgium, 2010; 424p. [Google Scholar]
  8. Chidumayo, E.N. Management implications of tree growth patterns in miombo woodlands of Zambia. For. Ecol. Manag. 2019, 436, 105–116. [Google Scholar] [CrossRef]
  9. Chirwa, P.W.; Larwanou, M.; Syampungani, S.; Babalola, F.D. Management and restoration practices in degraded landscapes of Eastern Africa and requirements for up-scaling. Int. For. Rev. 2015, 17, 20–30. [Google Scholar] [CrossRef]
  10. Mittermeier, R.A.; Mittermeier, C.G.; Brooks, T.M.; Pilgrim, J.D.; Konstant, W.R.; Da Fonseca, G.A.B.; Kormos, C. Wilderness and biodiversity conservation. Proc. Natl. Acad. Sci. USA 2003, 100, 10309–10313. [Google Scholar] [CrossRef] [PubMed]
  11. Godlee, J.L.; Gonçalves, F.M.; Tchamba, J.J.; Chisingui, A.V.; Muledi, J.I.; Shutcha, M.N.; Ryan, C.M.; Brade, T.K.; Dexter, K.G. Diversity and Structure of an Arid Woodland in Southwest Angola, with Comparison to the Wider Miombo Ecoregion. Diversity 2020, 12, 140. [Google Scholar] [CrossRef]
  12. Useni, S.Y.; Malaisse, F.; Cabala, K.S.; Munyemba, K.F.; Bogaert, J. Le rayon de déforestation autour de la ville de Lubumbashi (Haut-Katanga, RD Congo): Synthèse. Tropicultura 2017, 35, 215–221. [Google Scholar]
  13. Schneibel, A.; Stellmes, M.; Röder, A.; Finckh, M.; Revermann, R.; Frantz, D.; Hill, J. Evaluating the trade-off between food and timber resulting from the conversion of Miombo forests to agricultural land in Angola using multi-temporal Landsat data. Sci. Total Environ. 2016, 548–549, 390–401. [Google Scholar] [CrossRef]
  14. Gonçalves, F.M.P.; Revermann, R.; Cachissapa, M.J.; Gomes, A.L.; Aidar, M.P.M. Species diversity, population structure and regeneration of woody species in fallows and mature stands of tropical woodlands of southeast Angola. J. For. Res. 2018, 29, 1569–1579. [Google Scholar] [CrossRef]
  15. Khoji, M.H.; N’tambwe, N.D.; Mwamba, K.F.; Harold, S.; Munyemba, K.F.; Malaisse, F.; Bastin, J.-F.; Useni, S.Y.; Bogaert, J. Mapping and Quantification of Miombo Deforestation in the Lubumbashi Charcoal Production Basin (DR Congo): Spatial Extent and Changes between 1990 and 2022. Land 2023, 12, 1852. [Google Scholar] [CrossRef]
  16. Nansikombi, H.; Fischer, R.; Ferrer Velasco, R.; Lippe, M.; Kalaba, F.K.; Kabwe, G.; Günter, S. Can de facto governance influence deforestation drivers in the Zambian Miombo? For. Policy Econ. 2020, 120, 102309. [Google Scholar] [CrossRef]
  17. Kyale, K.J.; Wardell, D.A.; Mikwa, J.-F.; Kabuanga, J.M.; Monga Ngonga, A.M.; Oszwald, J.; Doumenge, C. Dynamique de la déforestation dans la Réserve de biosphère de Yangambi (République démocratique du Congo): Variabilité spatiale et temporelle au cours des 30 dernières années. Bois For. Trop. 2019, 341, 15–28. [Google Scholar] [CrossRef]
  18. Cabala, K.S.; Useni, S.Y.; Amisi, M.Y.A.; Munyemba, K.F.; Bogaert, J. Activités anthropiques et dynamique des écosystèmes forestiers dans les zones territoriales de l’Arc Cuprifère Katangais (RD Congo). Tropicultura 2022, 40, 2100. [Google Scholar] [CrossRef]
  19. Reyniers, C. Agroforesterie et déforestation en République démocratique du Congo. Miracle ou mirage environnemental? Mondes Dév. 2019, 187, 113–132. [Google Scholar] [CrossRef]
  20. Abdourhamane, H.; Morou, B.; Rabiou, H.; Amhamane, A. Caractéristiques floristiques, diversité et structure de la végétation ligneuse dans le Centre-Sud du Niger: Cas du complexe des forêts classées de Dan kada Dodo-Dan Gado. Int. J. Biol. Chem. Sci. 2013, 7, 1048. [Google Scholar] [CrossRef]
  21. Syampungani, S.; Geldenhuys, C.J.; Chirwa, P.W. Regeneration dynamics of miombo woodland in response to different anthropogenic disturbances: Forest characterisation for sustainable management. Agrofor. Syst. 2016, 90, 563–576. [Google Scholar] [CrossRef]
  22. Eba’a Atyi, R.; Hiol Hiol, F.; Lescuyer, G.; Mayaux, P.; Defourny, P.; Bayol, N.; Saracco, F.; Pokem, D.; Sufo Kankeu, R.; Nasi, R. Les Forêts du Bassin du Congo: État des Forêts 2021; CIFOR: Bogor, Indonesia, 2022; 474p. [Google Scholar] [CrossRef]
  23. Malaisse, F.; Bogaert, J.; Boisson, S.; Sikuzani, Y.U. La végétation naturelle d’Élisabethville (actuellement Lubumbashi) au début et au milieu du XXième siècle. Géo-Eco-Trop 2021, 45, 41–51. [Google Scholar]
  24. Potapov, P.V.; Turubanova, S.A.; Hansen, M.C.; Adusei, B.; Broich, M.; Altstatt, A.; Mane, L.; Justice, C.O. Quantifying forest cover loss in Democratic Republic of the Congo, 2000–2010, with Landsat ETM+ data. Remote Sens. Environ. 2012, 122, 106–116. [Google Scholar] [CrossRef]
  25. Holl, K.D.; Aide, T.M. When and where to actively restore ecosystems? For. Ecol. Manag. 2011, 261, 1558–1563. [Google Scholar] [CrossRef]
  26. Rinaudo, T.; Muller, A.; Morris, M. Manuel La Régénération Naturelle Assistée (RNA). Une Ressource pour les Gestionnaires de Projets, les Utilisateurs et Tous Ceux qui ont un Intérêt à Mieux Comprendre et Soutenir le Mouvement Pour la RNA; FMNR Hub, World Vision Australia: Melbourne, Australia, 2020; 241p. [Google Scholar]
  27. Awono, A.; Assembe-Mvondo, S.; Tsanga, R.; Guizol, P.; Peroches, A. Restauration des Paysages Forestiers et Régimes Fonciers au Cameroun: Acquis et Handicaps; Document Occasionnel 10; Centre de Recherche Forestière Internationale (CIFOR) : Bogor, Indonesia; Centre International de Recherche en Agroforesterie (ICRAF): Nairobi, Kenya, 2023; 43p. [Google Scholar] [CrossRef]
  28. Ramade, F. Eléments d’écologie. In Ecologie Appliquée: Action de L’homme sur la Biosphère, 7th ed.; Dunod: Paris, France, 2012; 791p. [Google Scholar]
  29. Useni, S.Y.; Mpibwe, K.A.; Yona, M.J.; N’tambwe, N.D.; Malaisse, F.; Bogaert, J. Assessment of Street Tree Diversity, Structure and Protection in Planned and Unplanned Neighborhoods of Lubumbashi City (DR Congo). Sustainability 2022, 14, 3830. [Google Scholar] [CrossRef]
  30. Larson, J.E.; Funk, J.L. Regeneration: An overlooked aspect of trait-based plant community assembly models. J. Ecol. 2016, 104, 1284–1298. [Google Scholar] [CrossRef]
  31. Rondeux, J. La Mesure des Arbres et des Peuplements Forestiers, 3rd ed.; Les Presses Universitaires de Liège–Agronomie–Gembloux: Gembloux, Belgium, 2021; 738p, Available online: http://hdl.handle.net/2268/262622 (accessed on 6 February 2024).
  32. Syampungani, S.; Tigabu, M.; Matakala, N.; Handavu, F.; Oden, P.C. Coppicing ability of dry miombo woodland species harvested for traditional charcoal production in Zambia: A win–win strategy for sustaining rural livelihoods and recovering a woodland ecosystem. J. For. Res. 2017, 28, 549–556. [Google Scholar] [CrossRef]
  33. Sangeda, A.Z.; Maleko, D.D. Regeneration Effectiveness Post Tree Harvesting in Natural Miombo Woodlands, Tanzania. J. Plant Sci. Agric. Res. 2018, 2, 10. [Google Scholar]
  34. Muvengwi, J.; Chisango, T.; Mpakairi, K.; Mbiba, M.; Witkowski, E.T.F. Structure, composition and regeneration of miombo woodlands within harvested and unharvested areas. For. Ecol. Manag. 2020, 458, 117792. [Google Scholar] [CrossRef]
  35. Montfort, F.; Nourtier, M.; Grinand, C.; Maneau, S.; Mercier, C.; Roelens, J.-B.; Blanc, L. Regeneration capacities of woody species biodiversity and soil properties in Miombo woodland after slash-and-burn agriculture in Mozambique. For. Ecol. Manag. 2021, 488, 119039. [Google Scholar] [CrossRef]
  36. Picard, N.; Gourlet-Fleury, S. Manuel de Référence pour L’installation de Dispositifs Permanents en Forêt de Production dans le Bassin du Congo; COMIFAC: Yaoundé, Cameroon, 2008; 265p, Available online: http://hal.cirad.fr/cirad-00339816 (accessed on 7 February 2024).
  37. Mutondo, G.T.; Kamutanda, D.K.; Numbi, A.M. Evaluation du bilan hydrique dans les milieux anthropisés de la forêt claire (région de Lubumbashi, Province du Haut-Katanga, R.D. Congo). Méthodologie adoptée pour l’estimation de l’évapotranspiration potentielle. Geo-Eco-Trop 2018, 42, 159–172. [Google Scholar]
  38. Kalombo, K.D. Évolution des Éléments du Climat en RDC: Stratégies D’adaptation des Communautés de Base, Face aux Événements Climatiques de Plus en Plus Fréquents; Éditions Universitaires Européennes: Sarrebruck, Germany, 2016; 220p. [Google Scholar]
  39. Ngongo, M.L.; Van Ranst, E.; Baert, G.; Kasongo, E.L.; Verdoodt, A.; Mujinya, B.B.; Mukalay, J.M. Guide des sols en République Démocratique du Congo, tome I: Étude et gestion; Ed. Salama: Lubumbashi, Democratic Republic of the Congo, 2009; 260p. [Google Scholar]
  40. N’tambwe, D.N.; Khoji, M.H.; Kasongo, K.B.; Kouagou, S.R.; Malaisse, F.; Useni, S.Y.; Masengo, K.W.; Bogaert, J. Towards an Inclusive Approach to Forest Management: Highlight of the Perception and Participation of Local Communities in the Management of miombo Woodlands around Lubumbashi (Haut-Katanga, D.R. Congo). Forests 2023, 14, 687. [Google Scholar] [CrossRef]
  41. Cadre Intégré de Classification de la sécurité Alimentaire (IPC). Aperçu de l’Insécurité Alimentaire Aiguë de l’IPC; IPC: Kinshasa, Democratic Republic of the Congo, 2023. [Google Scholar]
  42. Khoji, M.H.; N’tambwe, N.D.; Malaisse, F.; Waselin, S.; Kouagou, R.S.; Cabala, K.S.; Munyemba, F.M.; Bastin, J.-F.; Bogaert, J.; Useni, S.Y. Quantification and Simulation of Landscape Anthropization around the Mining Agglomerations of Southeastern Katanga (DR Congo) between 1979 and 2090. Land 2022, 11, 850. [Google Scholar] [CrossRef]
  43. Ribeiro, N.S.; Katerere, Y.; Chirwa, P.W.; Grundy, I.M. Miombo Woodlands in a Changing Environment: Securing the Resilience and Sustainability of People and Woodlands; Springer International Publishing: Cham, Switzerland, 2020; 269p. [Google Scholar] [CrossRef]
  44. Buramuge, V.A.; Ribeiro, N.S.; Olsson, L.; Bandeira, R.R. Exploring Spatial Distributions of Land Use and Land Cover Change in Fire-Affected Areas of Miombo Woodlands of the Beira Corridor, Central Mozambique. Fire 2023, 6, 77. [Google Scholar] [CrossRef]
  45. Bolakonga, I.A.B.; Nkulu, M.F.J.; Mushakulwa, W. Filières en République Démocratique du Congo: Maïs, riz, bananes plantains et pêche; Konrad Adenauer Stiftung: Kinshasa, Democratic Republic of the Congo, 2017; 321p. [Google Scholar]
  46. Kalawu, S.M.; Ngoy, M.K.; Ombeni, I.; Mane, L.; Claude, P. Mapping the stratification of vegetation classes in the Miombo forests and assessing the accuracy of their classification in Katanga province in the Democratic Republic of the Congo. Int. J. Sci. Eng. Res. 2022, 13, 770–785. [Google Scholar]
  47. Thiombiano, A.; Glele kakaï, R.; Bayen, P.; Boussim, J.I.; Mahamane, A. Méthodes et Dispositifs d’inventaires Forestiers en Afrique de l’Ouest: État des Lieux et Propositions Pour une Harmonisation. Ann. Sci. Agron. 2016, 20, 15–31. [Google Scholar]
  48. Ding, Y.; Zang, R.; Lu, X.; Huang, J. The impacts of selective logging and clear-cutting on woody plant diversity after 40 years of natural recovery in a tropical montane rain forest, south China. Sci. Total Environ. 2017, 579, 1683–1691. [Google Scholar] [CrossRef] [PubMed]
  49. Meerts, P.J.; Hasson, M. Arbres et Arbustes du Haut-Katanga; Editions Jardin Botanique de Meise: Brussels, Belgium, 2016; 386p. [Google Scholar]
  50. Vollesen, K.; Merrett, L. A Photo Rich Field Guide to the (Wetter) Zambian Miombo Woodland: Based on Plants from the Mutinondo Wilderness Area, Northern Zambia; Ed. Oxford: Lusaka, Zambia, 2020; 1200p. [Google Scholar]
  51. Zébazé, D.; Gorel, A.; Gillet, J.-F.; Houngbégnon, F.; Barbier, N.; Ligot, G.; Lhoest, S.; Kamdem, G.; Libalah, M.; Droissart, V.; et al. Natural regeneration in tropical forests along a disturbance gradient in South-East Cameroon. For. Ecol. Manag. 2023, 547, 121402. [Google Scholar] [CrossRef]
  52. Gonçalves, F.M.P.; Revermann, R.; Gomes, A.L.; Aidar, M.P.M.; Finckh, M.; Juergens, N. Tree Species Diversity and Composition of Miombo Woodlands in South-Central Angola: A Chronosequence of Forest Recovery after Shifting Cultivation. Int. J. For. Res. 2017, 2017, 1–13. [Google Scholar] [CrossRef]
  53. Hakizimana, P.; Bangirinama, F.; Havyarimana, F.; Habonimana, B.; Bogaert, J. Analyse de l’effet de la structure spatiale des arbres sur la régénération naturelle de la forêt claire de Rumonge au Burundi. Bull. Sci. Inst. Natl. Environ. Conserv. Nat. 2011, 9, 46–52. [Google Scholar]
  54. Melingui, J.B.N.; Angoni, H.; Claude, P.A.; Kono, L. Potentiel De Régénération Naturelle De Quelques Produits Forestiers Non Ligneux Prioritaires Dans Le Bassin De Production D’akom II (Sud Cameroun). World Wide J. Multidiscip. Res. Dev. 2017, 4, 214–224. [Google Scholar]
  55. Colwell, R.K.; Elsensohn, J.E. EstimateS turns 20: Statistical estimation of species richness and shared species from samples, with non-parametric extrapolation. Ecography 2014, 37, 609–613. [Google Scholar] [CrossRef]
  56. Razali, N.M.; Wah, Y.B. Power comparisons of Shapiro-Wilk, Kolmogorov-Smirnov, Lilliefors and Anderson-Darling tests. J. Stat. Model. Anal. 2011, 2, 21–33. [Google Scholar]
  57. Gupta, B.; Mishra, T.K. Analysis of tree diversity and factors affecting natural regeneration in fragmented dry deciduous forests of lateritic West Bengal. Trop. Ecol. 2019, 60, 405–414. [Google Scholar] [CrossRef]
  58. Heinken, T.; Diekmann, M.; Liira, J.; Orczewska, A.; Schmidt, M.; Brunet, J.; Chytrý, M.; Chabrerie, O.; Decocq, G.; De Frenne, P.; et al. The European Forest Plant Species List (EuForPlant): Concept and applications. J. Veg. Sci. 2022, 33, e13132. [Google Scholar] [CrossRef]
  59. Albatineh, A.N.; Niewiadomska-Bugaj, M. Correcting Jaccard and other similarity indices for chance agreement in cluster analysis. Adv. Data Anal. Classi. 2011, 5, 179–200. [Google Scholar] [CrossRef]
  60. Kiruki, H.M.; Van Der Zanden, E.H.; Gikuma-Njuru, P.; Verburg, P.H. The effect of charcoal production and other land uses on diversity, structure and regeneration of woodlands in a semi-arid area in Kenya. For. Ecol. Manag. 2017, 391, 282–295. [Google Scholar] [CrossRef]
  61. Useni, S.Y.; Boisson, S.; Cabala, K.S.; Khonde, C.N.; Malaisse, F.; Halleux, J.-M.; Bogaert, J.; Kankumbi, F.M. Dynamique de l’occupation du sol autour des sites miniers le long du gradient urbain-rural de la ville de Lubumbashi, RD Congo. Biotechnol. Agron. Soc. Environ. 2020, 24, 1–14. [Google Scholar]
  62. Peñuelas, J.; Sardans, J. Global Change and Forest Disturbances in the Mediterranean Basin: Breakthroughs, Knowledge Gaps, and Recommendations. Forests 2021, 12, 603. [Google Scholar] [CrossRef]
  63. Kissanga, R.; Catarino, L.; Máguas, C.; Cabral, A.I.R.; Chozas, S. Assessing the Impact of Charcoal Production on Southern Angolan Miombo and Mopane Woodlands. Forests 2023, 15, 78. [Google Scholar] [CrossRef]
  64. Chinder, G.B.; Hattas, D.; Massad, T.J. Growth and functional traits of Julbernardia globiflora (Benth) resprouts and seedlings in response to fire frequency and herbivory in miombo woodlands. S. Afr. J. Bot. 2020, 135, 476–483. [Google Scholar] [CrossRef]
  65. Useni, S.Y.; Khoji, M.H.; Langunu, S.; Gerardy, A.; Bogaert, J. Amplification of Anthropogenic Pressure Heavily Hampers Natural Ecosystems Regeneration within the Savanization Halo Around Lubumbashi City (Democratic Republic of Congo). Int. J. Environ. Sci. Nat. Resour. 2019, 17, 555958. [Google Scholar] [CrossRef]
  66. Finger, C.A.G.; Costa, E.A.; Hess, A.F.; Liesenberg, V.; Bispo, P.D.C. Simulating Sustainable Forest Management Practices Using Crown Attributes: Insights for Araucaria angustifolia Trees in Southern Brazil. Forests 2023, 14, 1285. [Google Scholar] [CrossRef]
  67. Pretzsch, H.; Del Río, M.; Arcangeli, C.; Bielak, K.; Dudzinska, M.; Ian Forrester, D.; Kohnle, U.; Ledermann, T.; Matthews, R.; Nagel, R.; et al. Competition-based mortality and tree losses. An essential component of net primary productivity. For. Ecol. Manag. 2023, 544, 121204. [Google Scholar] [CrossRef]
  68. Chidumayo, E.N. Forest degradation and recovery in a miombo woodland landscape in Zambia: 22 years of observations on permanent sample plots. For. Ecol. Manag. 2013, 291, 154–161. [Google Scholar] [CrossRef]
  69. Lu, H.; Mohren, G.; Del Río, M.; Schelhaas, M.-J.; Bouwman, M.; Sterck, F. Species Mixing Effects on Forest Productivity: A Case Study at Stand-, Species- and Tree-Level in the Netherlands. Forests 2018, 9, 713. [Google Scholar] [CrossRef]
  70. Chirwa, P.W.; Larwanou, M.; Syampungani, S.; Babalola, F.D. Management and restoration practices in degraded landscapes of Southern Africa and requirements for up-scaling. Int. For. Rev. 2015, 17, 31–42. [Google Scholar] [CrossRef]
  71. Puig, H. Diversité spécifique et déforestation: L’exemple des forêts tropicales humides du Mexique. Bois For. Trop. 2001, 268, 41–55. [Google Scholar]
  72. Montfort, F. Dynamiques des Paysages Forestiers au Mozambique: Étude de L’écologie du Miombo pour Contribuer aux Stratégies de Restauration des Terres Dégradées. Thèse de Doctorat, AgroParisTech, Paris, France, 2021; 189p. Available online: https://hal.science/tel-03524870 (accessed on 12 March 2024).
  73. Morel, L.; Chollet, S. Naturalité et biodiversité: Des relations à préciser pour penser la valeur de conservation des écosystèmes en libre évolution. Rev. For. Fr. 2022, 73, 293–311. [Google Scholar] [CrossRef]
  74. N’tambwe, N.D.; Biloso, M.A.; Malaisse, F.; Useni, S.Y.; Masengo, K.W.; Bogaert, J. Socio-Economic Value and Availability of Plant-Based Non-Timber Forest Products (NTFPs) within the Charcoal Production Basin of the City of Lubumbashi (DR Congo). Sustainability 2023, 15, 14943. [Google Scholar] [CrossRef]
  75. Ryan, C.M.; Williams, M. How does fire intensity and frequency affect miombo woodland tree populations and biomass? Ecol. Appl. 2011, 21, 48–60. [Google Scholar] [CrossRef]
  76. Tarimo, B.; Dick, Ø.B.; Gobakken, T.; Totland, Ø. Spatial distribution of temporal dynamics in anthropogenic fires in miombo savanna woodlands of Tanzania. Carbon Balance Manag. 2015, 10, 18. [Google Scholar] [CrossRef]
  77. Van Wilgen, B.W.; De Klerk, H.M.; Stellmes, M.; Archibald, S. An analysis of the recent fire regimes in the Angolan catchment of the Okavango Delta, Central Africa. Fire Ecol. 2022, 18, 13. [Google Scholar] [CrossRef]
  78. Buramuge, V.A.; Ribeiro, N.S.; Olsson, L.; Bandeira, R.R.; Lisboa, S.N. Tree Species Composition and Diversity in Fire-Affected Areas of Miombo Woodlands, Central Mozambique. Fire 2023, 6, 26. [Google Scholar] [CrossRef]
  79. Useni, S.Y.; Mpanda, M.M.; Khoji, M.H.; Cirezi, C.N.; Malaisse, F.; Bogaert, J. Vegetation Fires in the Lubumbashi Charcoal Production Basin (The Democratic Republic of the Congo): Drivers, Extent and Spatiotemporal Dynamics. Land 2023, 12, 2171. [Google Scholar] [CrossRef]
  80. Sola, P.; Schure, J.; Eba’a Atyi, R.; Gumbo, D.; Okeyo, I. Politiques et pratiques en matière de bois-énergie dans certains pays d’Afrique subsaharienne–un examen critique. Bois For. Trop. 2019, 340, 27–41. [Google Scholar] [CrossRef]
  81. Mama, A.; Bamba, I.; Sinsin, B.; Bogaert, J.; De Cannière, C. Déforestation, savanisation et développement agricole des paysages de savanes-forêts dans la zone soudano-guinéenne du Bénin. Bois For. Trop. 2014, 322, 65–76. [Google Scholar] [CrossRef]
  82. Meniko, T.H.J.-P.P.; Tshibamba, M.J.; Sabongo, Y.P.; Nshimba, S.W.M.H.; Dudu, A.B.; Mate, M.J.-P.; Bogaert, J. Caractérisation floristique de quatre habitats forestiers d’un gradient d’anthropisation à Masako. In Les Forêts de la Tshopo: Écologie, Histoire et Composition; Bogaert, J., Beeckman, H., De cannière, C., Defourny, P., et Ponette, Q., Eds.; Les Presses Universitaires de Liège: Liège, Belgique, 2020; pp. 75–90. [Google Scholar]
  83. Guizol, P.; Guizol, P.; Diakhite, M.; Seka, J.; Mbonayem, L.; Awono, A.; Oyono, P.R.; Ndikumagenge, C.; Sonwa, D.; Ndabirorere, S.; et al. La restauration des paysages forestiers (RPF) en Afrique centrale. In Les forêts du bassin du Congo: État des Forêts 2021; Eba’a Atyi, R., Hiol Hiol, F., Lescuyer, G., Mayaux, P., Defourny, P., Bayol, N., Saracco, F., Pokem, D., Sufo Kankeu, R., Nasi, R., Eds.; CIFOR: Bogor, Indonesia, 2022; pp. 338–359. [Google Scholar]
  84. Talukdar, N.R.; Choudhury, P.; Barbhuiya, R.A.; Singh, B. Importance of Non-Timber Forest Products (NTFPs) in rural livelihood: A study in Patharia Hills Reserve Forest, northeast India. Trees For. People 2021, 3, 100042. [Google Scholar] [CrossRef]
  85. Kaumbu, J.M.K.; Mpundu, M.M.M.; Kasongo, E.L.M.; Ngoy Shutcha, M.; Tekeu, H.; Kalambulwa, A.N.; Khasa, D. Early Selection of Tree Species for Regeneration in Degraded Woodland of Southeastern Congo Basin. Forests 2021, 12, 117. [Google Scholar] [CrossRef]
  86. Giliba, R.A.; Mafuru, C.S.; Paul, M.; Kayombo, C.J.; Kashindye, A.M.; Chirenje, L.I.; Musamba, E.B. Human Activities Influencing Deforestation on Meru Catchment Forest Reserve, Tanzania. J. Hum. Ecol. 2011, 33, 17–20. [Google Scholar] [CrossRef]
Figure 1. City of Lubumbashi (gray polygon) and its rural area (white space surrounding Lubumbashi). The black dot indicates the village area of Lwisha, located approximately 80 km northwest of Lubumbashi. The geographical coordinates used for this mapping were obtained using a GPS device within the premises of the Lwisha village chief’s office. The administrative boundaries on this map mark the borders between the DRC and Zambia, as well as between Kipushi Territory and other territories in Upper-Katanga Province.
Diversity 16 00405 g001
Figure 2. Graphical representation of the floristic inventory plan showing main plots and subplots along a 500 m transect [6].
Diversity 16 00405 g002
Table 1. Presentation and description of the three surveyed habitats in Lwisha area.
HabitatDescription
Unexploited forests
Diversity 16 00405 i001These forests are not exploited for charcoal production or cultivated at a human scale [6]. These refer to the land characterized by vegetation dominated by a sparse herbaceous layer under a 10–20 m forest stratum. The canopy covers 0.05 and covers at least 10–30% of the area, spanning between 0.05 and 1 hectare [15].
Degraded forests
Diversity 16 00405 i002These forests have been exploited for charcoal production [43] and correspond to forests where the capacity to provide ecosystem services has been significantly reduced due to decreased woody plant density and biodiversity.
Post-cultivation follows
Diversity 16 00405 i003Fallows are habitats that are abandoned after subsistence farming. This refers to habitats that have been severely damaged by excessive land use, degrading soil and vegetation, and delaying woody plant diversity recovery. Vegetation is primarily dominated by grasses [44].
Table 2. Families, genera, and species of inventoried adult individuals in different habitats. UFO: unexploited forests, DFO: degraded forests, PCF: post-cultivation fallows. Values are expressed in percentage (frequencies). -: the family was not represented during floristic inventories, n: number of genera, species, or individuals inventoried.
FamiliesUFO (%)DFO (%)PCF (%)
Genera n = 27Species n = 36Individuals n = 500Genera n = 33Species n = 48Individuals n = 456Genera n = 25Species n = 32Individuals n = 143
Anacardiaceae3.702.780.803.032.082.63---
Anisophylleaceae3.702.781.003.032.080.884.003.131.40
Annonaceae------4.003.131.40
Apocynaceae3.702.782.003.032.086.584.003.134.20
Bignoniaceae3.702.780.603.032.080.22---
Celastraceae3.702.780.203.032.080.22---
Chrysobalanaceae3.702.781.203.032.083.514.003.132.80
Clusiaceae3.702.780.209.096.251.104.003.130.70
Combretaceae3.705.560.603.036.252.414.006.252.10
Dipterocarpaceae7.418.337.206.064.175.04---
Fabaceae33.3333.3376.0027.2733.3359.8728.0034.3867.83
Ixonanthaceae3.702.781.003.032.080.884.003.130.70
Lamiaceae3.702.780.203.036.252.854.003.132.10
Loganiaceae3.708.331.603.034.170.444.006.251.40
Malvaceae------8.006.253.50
Meliaceae3.702.780.203.032.080.22---
Moraceae---3.034.170.66---
Myrtaceae---3.032.080.664.003.133.50
Ochnaceae3.702.781.203.032.080.224.003.131.40
Olacaceae3.702.780.20------
Oleaceae---3.032.080.224.003.130.70
Phyllanthaceae7.4111.115.809.0910.4210.9612.0012.505.59
Proteaceae---3.032.080.44---
Rubiaceae------4.003.130.70
Total of frequencies100.00100.00100.00100.00100.00100.00100.00100.00100.00
Table 3. Dendrometric and floristic parameters of inventoried adult individuals in different habitats. Means ± standard deviations. For a given parameter, habitats without common letters differ significantly at p < 0.05. UFO: unexploited forests, DFO: degraded forests, PCF: post-cultivation fallows. Taxa_S: number of species.
ParametersUFODFOPCF
Dendrometric parameters
Density (individuals/ha)312.50 ± 126.36 a285.00 ± 126.97 a89.38 ± 96.02 b
Quadratic mean diameter (cm)40.75 ± 15.83 a32.57 ± 6.78 b28.84 ± 11.18 b
Basal area (m2/ha)16.78 ± 7.25 a9.98 ± 7.14 a1.92 ± 2.07 b
Floristic parameters
Taxa_S/plot10.25 ± 2.86 a12.44 ± 4.46 a4.81 ± 4.28 b
Genera/plot8.44 ± 2.16 a9.88 ± 3.36 a3.94 ± 3.17 b
Families/plot4.67 ± 1.96 a5.88 ± 1.86 a2.69 ± 2.06 b
Table 4. Floristic list of the top five regenerative plant species, showing high relative frequency/density (values in bold). The species list is presented in alphabetical order, and in case of tied values, the species concerned are counted as one. UFO: unexploited forests, DFO: Degraded forests, PCF: post-cultivation fallows. dbh < 1 cm: seedlings, 1 cm ≤ dbh < 10 cm: saplings, -: species not inventoried, n = number of individuals inventoried. RF (relative frequency) and RD (relative density) values are expressed in percentage. The entire set of species studied is presented in the Supplementary Materials (Table S1).
SpeciesFamilydbh < 1 cm1 cm ≤ dbh < 10 cm
UFO
(n = 6628)
DFO
(n = 6660)
PCF
(n = 4676)
UFO
(n = 948)
DFO
(n = 2384)
PCF
(n = 1756)
RFRDRFRDRFRDRFRDRFRDRFRD
Albizia adianthifolia (Schumach.) W. WightFabaceae4.176.764.629.015.505.394.863.385.176.715.545.47
Albizia antunesiana HarmsFabaceae4.174.163.082.525.113.252.781.694.131.854.546.15
Anisophyllea boehmii Engl.Anisophylleaceae3.131.392.772.881.971.713.472.952.070.677.063.19
Baphia bequaertii De Wild.Fabaceae5.567.914.315.295.116.503.473.385.685.703.537.06
Brachystegia spiciformis Benth.Fabaceae5.5612.614.9313.336.2910.6110.4215.196.715.546.057.97
Brachystegia wangermeeana De Wild.Fabaceae4.5110.804.9320.485.9027.896.9417.306.2029.537.5623.46
Diplorhynchus condylocarpon (Müll. Arg.) PichonApocynaceae2.782.964.312.461.180.863.475.915.688.392.021.82
Garcinia huillensis Oliv.Clusiaceae3.131.152.160.481.570.34----0.500.23
Hymenocardia acida Tul.Phyllanthaceae--1.231.261.185.990.690.421.551.341.010.46
Isoberlinia angolensis (Benth.) Hoyle & BrenanFabaceae3.8211.044.625.233.544.534.862.952.074.533.536.61
Isoberlinia tomentosa (Harms) Craib & StapfFabaceae0.350.18------4.134.532.022.28
Ochna schweinfurthiana F. Hoffm.Ochnaceae4.173.023.693.783.932.654.172.533.102.181.510.91
Parinari curatellifolia Planch. ex Benth.Chrysobalanaceae1.740.481.850.841.570.862.081.274.133.693.532.96
Pseudolachnostylis maprouneifolia PaxPhyllanthaceae2.782.353.391.803.141.802.082.532.071.015.043.19
Psorospermum febrifugum SpachClusiaceae4.514.472.772.044.321.88--1.030.343.021.37
Pterocarpus angolensis DC.Fabaceae0.350.06--0.390.175.565.493.101.173.021.59
Rothmannia engleriana (K. Schum.) KeayRubiaceae3.822.532.161.504.723.251.390.84--1.010.46
Uapaca kirkiana Müll. Arg.Phyllanthaceae4.513.142.462.700.790.344.173.803.622.352.021.37
Table 5. Comparison of dendrometric parameters and species richness between the two classes of juvenile individuals inventoried in the three habitats. Means ± standard deviations. For a given parameter, habitats without common letters differ significantly at p < 0.05. UFO: unexploited forests, DFO: degraded forests, PCF: post-cultivation fallows, dbh < 1 cm: seedlings, 1 cm ≤ dbh < 10 cm: Saplings, -: values were not calculated due to lack of relevant data.
dbh < 1 cm1 cm ≤ dbh < 10 cm
UFODFOPCFUFODFOPCF
Dendrometric parameters
Density (individuals/ha)4142.50 ± 2176.33 ab4185.00 ± 1544.84 a2935.00 ± 1567.39 b592.50 ± 341.36 a1490.00 ± 1133.21 a1110.00 ± 954.82 a
Quadratic mean diameter (cm)---7.52 ± 0.66 a7.16 ± 0.48 a7.06 ± 0.49 a
Basal area (m2/ha)---2.49 ± 1.26 a5.76 ± 4.36 a4.25 ± 3.71 a
Floristic parameters
Individuals103.56 ± 54.41 ab104.63 ± 38.62 a73.38 ± 39.18 b14.81 ± 8.53 a37.25 ± 28.33 a27.75 ± 23.87 a
Taxa_S18.00 ± 3.97 ab20.50 ± 3.41 a16.06 ± 3.99 b16.88 ± 6.91 a19.13 ± 10.83 a19.19 ± 14.62 a
Genera15.25 ± 4.09 ab17.75 ± 3.49 a13.44 ± 3.76 b7.81 ± 3.62 a10.63 ± 5.15 a10.13 ± 6.39 a
Families9.56 ± 2.78 a10.88 ± 2.83 a9.31 ± 2.89 a5.19 ± 2.83 a6.50 ± 3.18 a6.63 ± 3.91 a
Chao-121.14 ± 5.85 a25.57 ± 4.78 a21.30 ± 8.29 a18.87 ± 11.80 a20.80 ± 11.22 a23.16 ± 17.04 a
Taxa_S/Chao-10.850.800.750.900.920.83
Fisher_alpha6.78 ± 1.66 a8.57 ± 3.13 a6.99 ± 2.11 a10.74 ± 6.17 a9.96 ± 11.91 a8.71 ± 5.79 a
Table 6. Floristic list of the top five regenerative plant species, showing the natural regeneration index for each habitat (values in bold). The species list is presented in alphabetical order, and in case of tied values, the species concerned are counted as one. UFO: unexploited forests, DFO: degraded forests, PCF: post-cultivation fallows. NRI: natural regeneration index (ratio between juveniles and adults), dbh < 1 cm: seedlings, 1 cm ≤ dbh < 10 cm: saplings, 0: species not inventoried in the regeneration stratum but inventoried in the adult individual’s stratum of the habitat, -: species inventoried in the regeneration stratum but not in the adult individual’s stratum of the habitat. The entire set of species studied is presented in the Supplementary Materials (Table S2).
Speciesdbh < 1 cm1 cm ≤ dbh < 10 cm
UFODFOPCFUFODFOPCF
Albizia antunesiana Harms23.0012.9250.671.333.3836.00
Anisophyllea boehmii Engl.18.4048.0040.005.604.0028.00
Baphia bequaertii De Wild.23.8216.7650.671.456.4820.67
Combretum molle R.Br ex G. Don40.009.3372.004.004.0012.00
Combretum zeyheri Sond.0.006.000.00 34.0016.00
Diplorhynchus condylocarpon (Müll. Arg.) Pichon19.605.476.675.606.675.33
Ekebergia benguelensis Welw. ex C.DC.36.0024.00 0.0012.00
Harungana madagascariensis Lam. ex Poir. 136.00 0.000.00
Hymenocardia acida Tul.0.0042.00 16.00
Isoberlinia angolensis (Benth.) Hoyle & Brenan45.7538.6742.401.7512.0023.20
Isoberlinia tomentosa (Harms) Craib & Stapf 0.000.000.0021.608.00
Julbernardia paniculata (Benth.) Troupin1.6024.000.001.604.0020.00
Markhamia obtusifolia (Boulanger) Sprague2.6744.00 2.6724.00
Mystroxylon aethiopicum (Thunb.) Lœs.16.0060.00 0.0012.000.00
Ochna schweinfurthiana F. Hoffm.33.33252.0062.004.0052.008.00
Olax obtusifolia De Wild.16.00 0.0024.000.000.00
Phyllocosmus lemaireanus (De Wild. & T. Durand) T. Durand & H. Durand32.0043.0092.004.806.004.00
Pseudolachnostylis maprouneifolia Pax78.0017.1442.0012.003.4328.00
Psorospermum febrifugum Spach296.0068.00 0.004.00
Rothmannia engleriana (K. Schum.) Keay 152.00 0.008.00
Schrebera trichoclada Welw. 0.0028.000.000.0028.00
Strychnos cocculoides Boulanger1.3328.0064.004.0016.0012.00
Strychnos spinosa Lam.0.000.00 4.00
Vitex doniana Sweet4.002.405.334.001.606.67
Vitex mombassae Vatke 8.00 0.0016.000.00
Table 7. Jaccard similarity between floristic lists of different strata in the three habitats. UFO: unexploited forests, DFO: degraded forests, PCF: post-cultivation fallows, <1: seedlings; ≥1: saplings; ≥10: adults. Relative values are presented in decimal form.
UFO < 1DFO < 1PCF < 1UFO ≥ 1DFO ≥ 1PCF ≥ 1UFO ≥ 10DFO ≥ 10
DFO < 10.65
PCF < 10.680.65
UFO ≥ 10.650.550.50
DFO ≥ 10.710.590.550.92
PCF ≥ 10.670.640.740.630.68
UFO ≥ 100.650.480.570.710.790.63
DFO ≥ 100.670.570.590.730.800.740.86
PCF ≥ 100.560.420.500.710.670.630.600.63
Disclaimer/Publisher’s Note: The statements, opinions and data contained in all publications are solely those of the individual author(s) and contributor(s) and not of MDPI and/or the editor(s). MDPI and/or the editor(s) disclaim responsibility for any injury to people or property resulting from any ideas, methods, instructions or products referred to in the content.

