Article

Biodiversity Assessment of a Mississippi River Backwater Complex Using eDNA Metabarcoding

1
Department of Biological Sciences, Missouri University of Science and Technology, Rolla, MO 65409, USA
2
Missouri Department of Conservation, Science Branch, Columbia, MO 65201, USA
3
Department of Biological and Clinical Sciences, University of Central Missouri, Warrensburg, MO 64093, USA
*
Author to whom correspondence should be addressed.
Diversity 2024, 16(8), 495; https://doi.org/10.3390/d16080495
Submission received: 19 July 2024 / Revised: 5 August 2024 / Accepted: 12 August 2024 / Published: 14 August 2024
(This article belongs to the Special Issue Applications on Environmental DNA in Aquatic Ecology and Biodiversity)

Abstract

:
The backwater lowland habitats of large rivers, like the Mississippi River in North America, present complex and often inaccessible environments for traditional capture-based fish biodiversity sampling. Our knowledge of the assemblages of the fishes that occupy such habitats is often incomplete, and this can compromise management efforts. We employed environmental DNA (eDNA) metabarcoding methods to sample a Mississippi River bottom wetland system to assess the ichthyofaunal diversity and the assemblage structure across habitat types, and we compared our results with capture-based survey records for the same habitats. We collected water samples in the spring and fall of 2022 from slough, ditch, shallow lake, and bayou habitats that varied in depth, vegetation, seasonal variability, and connectivity to the Mississippi River channel. We detected a diverse array of fish species that included 51 taxa. Nearly all the species previously documented in the habitats were detected using eDNA metabarcoding, and we increased the number of documented species by more than a third. Most of the species were ubiquitous across the range of habitats, but there was also a substantial assemblage structure, with some species exhibiting clear habitat specificity. Fall sampling was limited to the deeper bayou habitats where seasonal variation between the spring and fall was minimal. eDNA metabarcode sampling was demonstrated to be effective at detecting invasive species as well as uncommon species, which included several species of conservation concern.

1. Introduction

The biodiversity assessment of complex integrated freshwater ecosystems provides essential data for assessing and quantifying spatiotemporal patterns and long-term changes in freshwater ecosystems [1]. However, freshwater ecosystems present a range of challenges to effective sampling and monitoring [2,3]. The Mississippi River, as with many big river systems, has been severely impacted by anthropogenic changes that threaten its biological diversity and ecosystem function [4,5]. In the present study, we employed environmental DNA (eDNA) metabarcoding [6,7,8] to assess the biodiversity in one network of Mississippi lowland habitats.
The northern extent of the Gulf Coastal Plain of North America begins at the confluence of the Mississippi and Ohio Rivers [9]. The Mississippi River below this confluence is the center of an expansive alluvial plain ecosystem that historically was dominated by bald cypress and tupelo bottomland forests and wetlands, and was connected to the river by the seasonal inundation of floodwaters [10]. Beginning in the early 1900s, efforts were underway to clear and drain these wetlands for agricultural purposes [11]. Contemporary major levee systems effectively separate the alluvial plain ecosystem from its major rivers (e.g., the Commerce MO—St. Francis River Levee System, constructed in 1950) [4,12], and 96% of the bottomland habitats in the region have been drained. The wetland habitats have become fragmented, and few remain connected to the river floodplains [13,14].
The Gulf Coastal Plain is an ichthyofaunal diversity hotspot, with an assortment of lowland endemic and large river species [15,16,17,18]. The endemic fishes of the region include species that may have once been common but have been negatively impacted by the alteration and destruction of their habitats [19,20]. Annual flooding in rivers makes bottomlands biologically productive, as water, nutrients, and organisms are exchanged between the main river channels and backwater habitats [21]. Additionally, vast river floodplains provide a critical habitat to a diverse array of large-bodied river fishes, which exhibit behaviors and life-history attributes that take advantage of seasonally available floodplain habitats for spawning and juvenile growth [22,23,24]. Efforts to convert floodplains to agricultural land, and channelize rivers for commerce have largely eliminated the seasonal floods that many large river species depend on for reproduction and early life stages [25,26].
Floodplain habitats often support a greater diversity of species than can be reliably observed in main river channels; however, standard field-sampling methods may be inadequate to effectively capture such diversity [22,27]. Specifically, fish assemblage surveys are limited by the challenges of sampling these heavily vegetated, complex, fragmented, and often inaccessible lowland habitats [3]. Despite traditional sampling difficulties, efforts to assess the composition of the species present in these remnant habitats are critical for effective management.
Although lowland habitats present substantial challenges for traditional sampling efforts, the use of eDNA-based survey methods may reduce such challenges. eDNA is a genetically based, non-invasive biomonitoring tool that can be used to assess the species assemblage in an area of interest [28]. The method relies on eDNA that has been released into the environment via shed skin, saliva, blood, excrement, or gametes of living or decomposing organisms [29]. The detection zone—the size of the area surrounding an eDNA source where it can be detected, is dependent on the water flow, mixing characteristics, and rate of eDNA degradation. Due to the lentic conditions that often characterize river bottom wetlands, the detection zone may be on the order of 100 m or less [30]. Studies have shown that eDNA bound to fine silt and clay particles persists longer than suspended eDNA, and can accumulate and persist in an environment [31]. The accumulation and persistence of eDNA in sediments may be a consideration for the interpretation of the data, particularly for high-biomass species that generate high concentrations of eDNA [32].
The deployment of eDNA-based survey methods has become common practice in aquatic systems, and can be used in addition to or as an alternative to traditional sampling techniques [33]. eDNA can be filtered and extracted from a water sample, amplified, sequenced, and aligned to a reference database to infer the species that are present. While the efficacy of eDNA surveys has been well documented in riverine and marine systems [34,35], few studies have implemented this technique in freshwater wetlands [36].
In this study we employed eDNA metabarcoding methods to sample ichthyofauna in a Mississippi River bottom wetland system and assess the distribution of species among multiple habitats with varying vegetation levels, seasonal flow dynamics, and connections to the Mississippi River. We aimed to assess the alpha- and beta-diversity of fish assemblages in a relatively intact remnant natural Mississippi River floodplain ecosystem. Our objectives were to quantify and compare species richness among the different habitats, and test for the fish assemblage structure across habitats and seasons (i.e., spring and fall). We compared the species detected using eDNA metabarcoding methods with a database of historical records of fish species collected in the studied area from 1940 to the present. These comparisons provide an assessment of the efficacy of eDNA metabarcoding in this system and a standardized evaluation of the ichthyofaunal assemblages across seasons and habitats, which is rarely accomplished in these imperiled habitats due to the limits of traditional sampling.

2. Materials and Methods
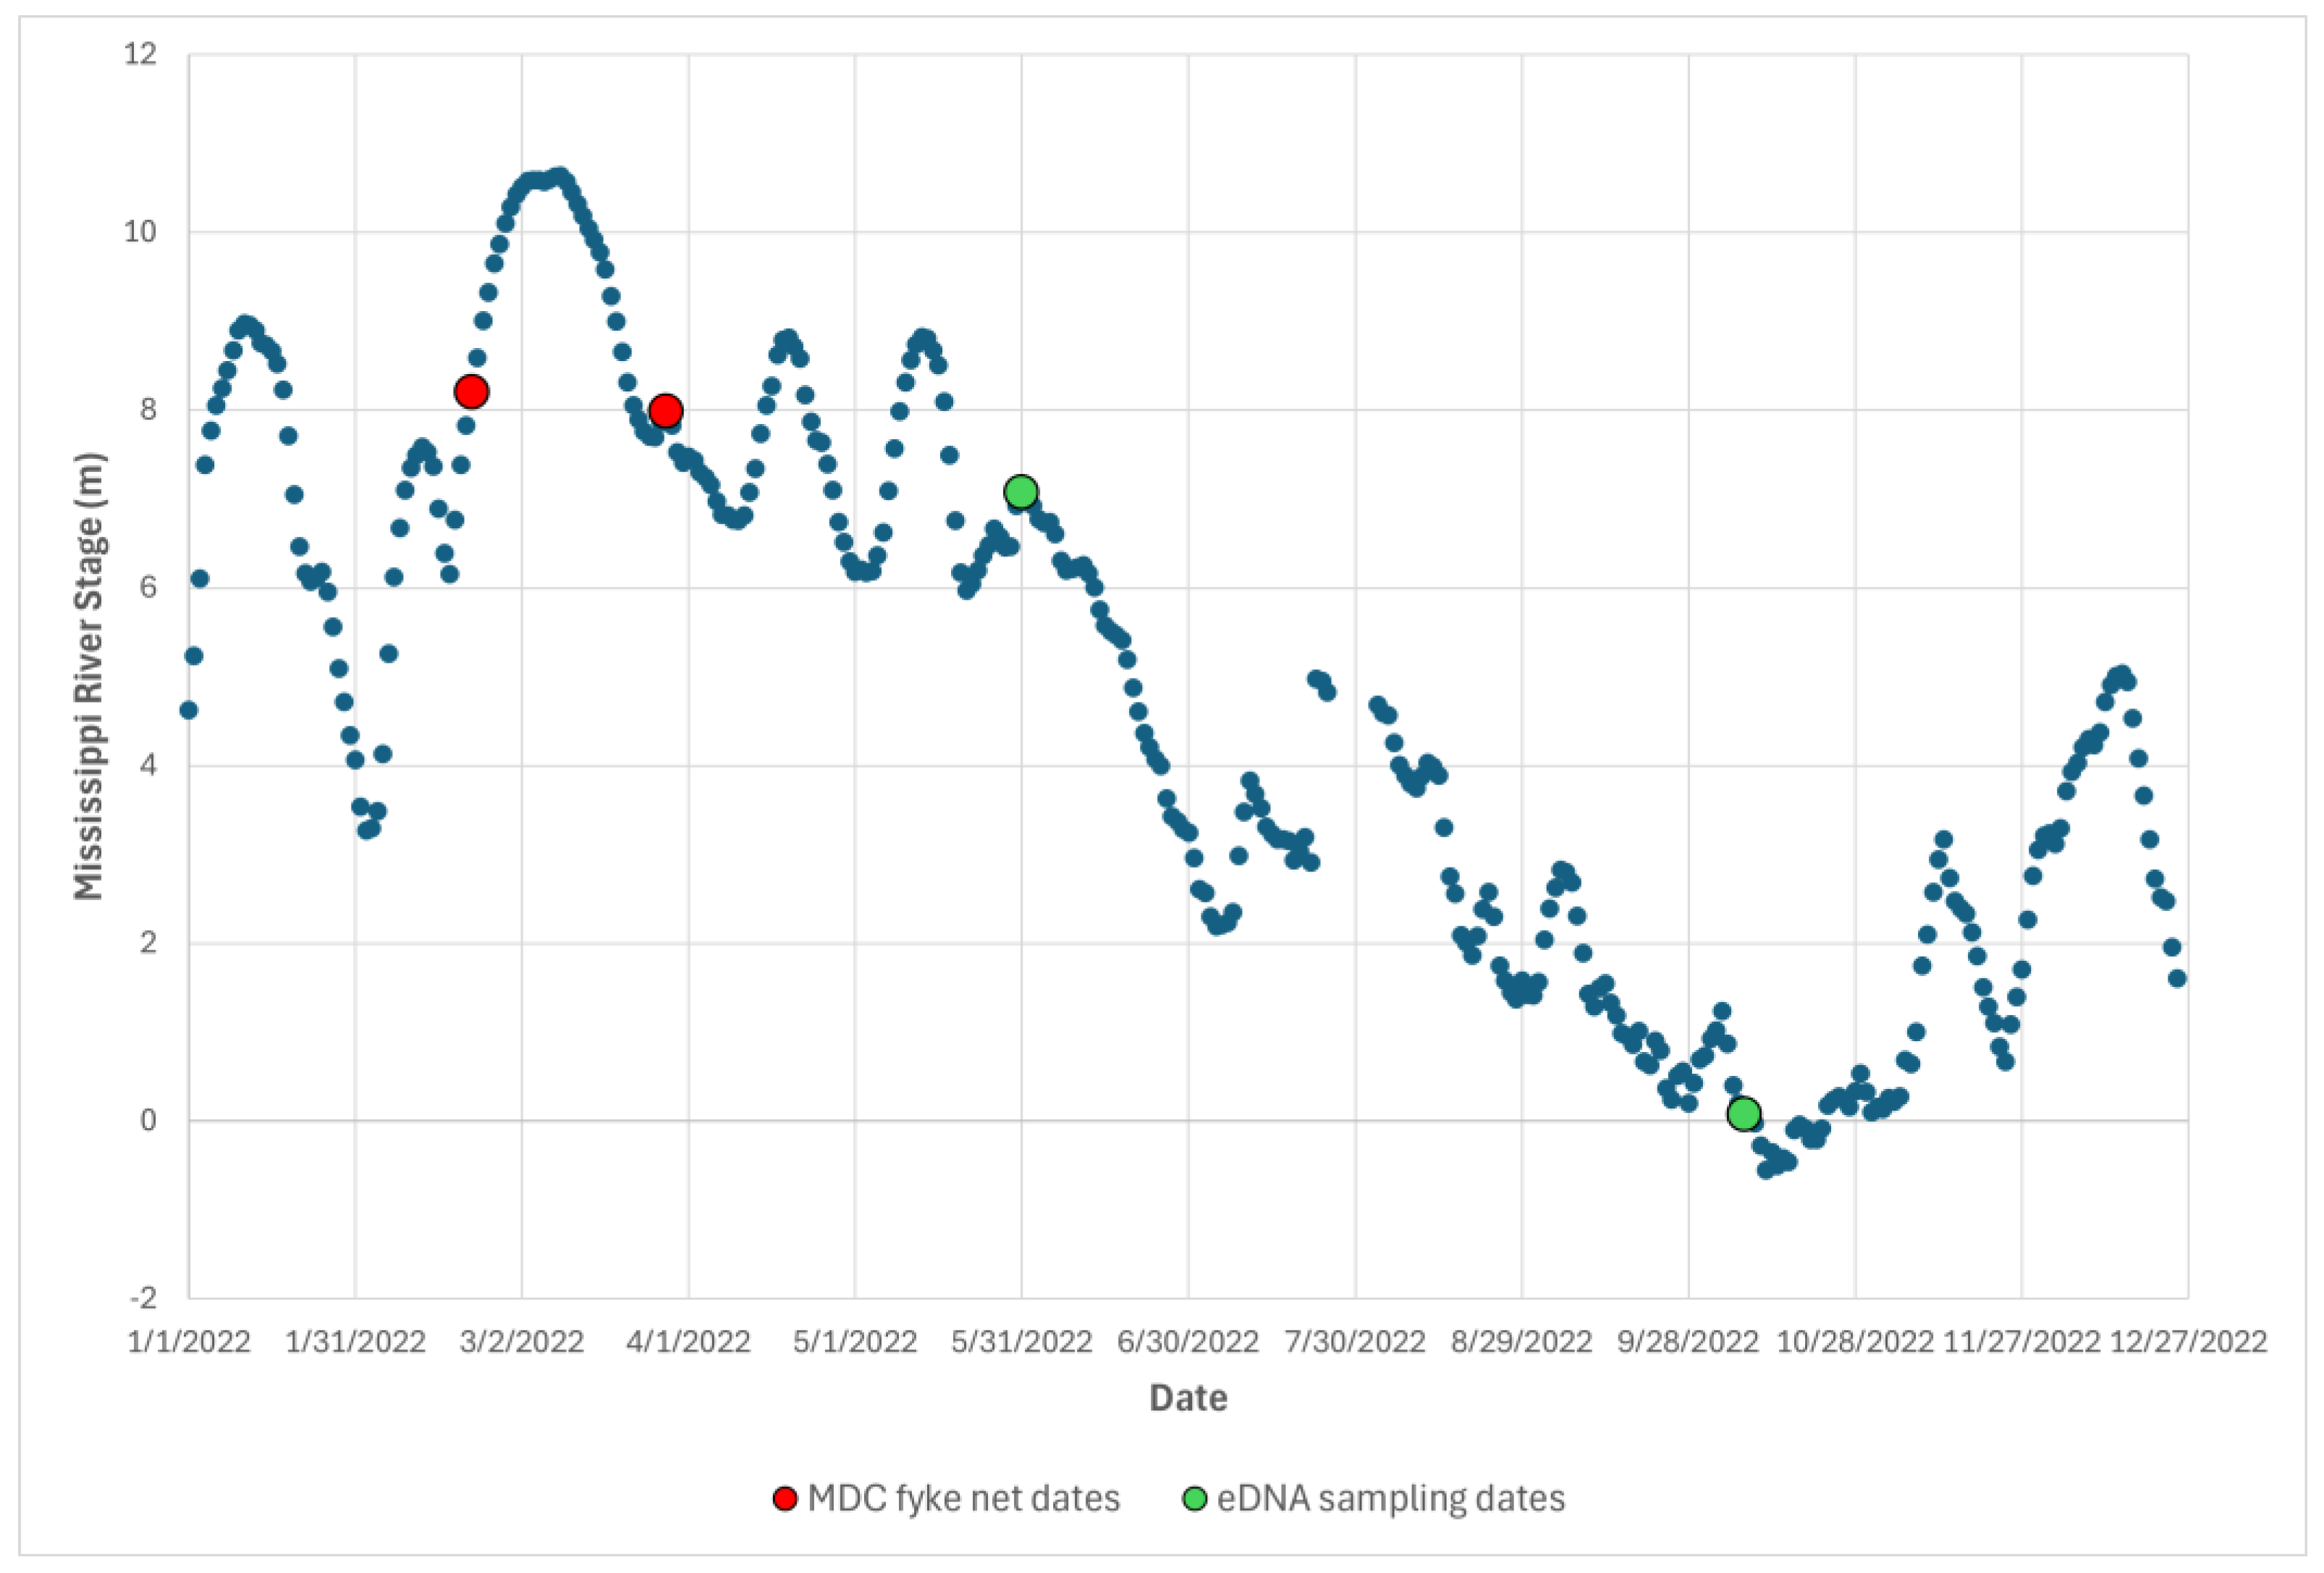
2.1. Study System

The Black Island Conservation Area is a 2602 hectare wetland reserve located within the Black Island river bend in southeastern Missouri, and it is managed by the Missouri Department of Conservation. The complex of bottomland habitats within Black Island is bounded to the east by the Mississippi River channel, and to the west by the Commerce MO—St. Francis River Levee System (Figure 1). The Black Island wetland habitats include an oxbow lake bayou complex, an expanse of low-relief seasonally flooded lowlands, and a slough complex that is directly connected to the Mississippi River. The change in elevational relief across the entire Black Island complex ranges as high as ~10 m above the base flow of the Mississippi River, with the majority of seasonally flooded lowland areas elevated about 3 to 4 m above the base flow [37].
We sampled the Black Island complex on two dates, May 30 and October 7, 2022. During the spring sampling event, the Mississippi River stage was 7.1 m at the nearby Caruthersville monitoring station (Figure 2). During the fall sampling event, the Mississippi River stage was 0.08 m. This was 9 days before the monitoring station recorded the second lowest all-time record of −0.55 m.
The Wolf Bayou complex is comprised of three deeply incised oxbow lake bayous (Samples, Hosner, and Wolf) connected by narrow channels (Table 1, Figure 1b). Except where there are stream inlets, most of the shoreline of all three bayous is relatively steep, resulting in minimal seasonal variation in shoreline characteristics and the overall total surface area.
Robinson Lake (Table 1, Figure 1c) is a shallow impoundment formed by a low retention dam. In the spring, the shoreline was inundated into the heavily vegetated border, composed of shrubs and small trees, to a penetration of tens to hundreds of meters around the entire perimeter. During the fall sampling period, the lake surface dimension was reduced to less than 300 m long and 50 m wide. There was no vegetation in the fall as the shoreline had receded substantially relative to the spring.
We sampled a slough along the margin of Black Island that was connected to the Mississippi River (Table 1, Figure 1d). The slough was cut off from the river in the fall and reduced to isolated pools. We also sampled a steep-sided ditch that was originally constructed to facilitate the drainage of agricultural lands before the wetland reserve was established. The ditch was connected to the slough via a large culvert under an access road. The water depth in the ditch matched the depth of the slough, and water was flowing from the ditch into the slough when we sampled in the spring.

2.2. eDNA Field Sampling

We utilized eDNA metabarcoding to assess the fish diversity in the Black Island complex. Water samples from the bayous, lake, and ditch were collected by launching a small jon boat equipped with an electric trolling motor. The slough was sampled with the use of waders. At each sample site, three 500 mL water samples were collected in separate sterile bottles. A 2 m extension pole was used to collect the water samples to avoid water contamination from the boat or waders, and water was collected in an arcing motion by submerging each bottle approximately 10 cm below the water surface. We did not sample the substrate, which would have been beyond the scope of this study. Water samples were immediately pressure-filtered through enclosed 0.45 µm polyvinylidene fluoride (Millipore Sigma) filters using 50 mL luer-lock syringes until the volume reached 500 mL or the filter clogged. Field negatives consisted of 500 mL of deionized (DI) water, which were filtered in the field to monitor potential field contamination. Following filtration, the filter housing was flooded with 95% molecular grade ethanol, sealed with parafilm, and stored on ice for transport to the laboratory [38]. Disposable gloves were worn during the water collection and filtration and changed between sites. Water quality parameters, including standard conductivity (µS/cm), dissolved oxygen (mg/L), and temperature (°C), were logged at each sample location using a YSI probe. A Secchi disk was used to measure the water clarity (i.e., Secchi depth), and the water column depth at each sample site was recorded.

2.3. DNA Extraction, PCR Amplification, and Sequencing

Sealed filters were stored at 4 °C until they were extracted. The extraction was conducted within 7 days of sample collection using a modified protocol of the Qiagen Blood and Tissue Kit (Qiagen, Hilden, Germany) for enclosed filters outlined in Ref. [39]. To minimize cross-contamination, extractions were carried out in a dedicated clean laboratory with separate dedicated equipment from all the post-PCR steps, and all work surfaces and equipment were decontaminated using bleach between extractions [40]. In wetland habitats, high concentrations of suspended organic and inorganic matter can interfere with the water filtration, speed up the degradation of suspended eDNA in the water column, and inhibit the subsequent PCR amplification [41]. To address the latter challenge, PCR inhibitors were removed using a OneStep PCR Inhibitor Removal Kit (Zymo, Irvine, CA, USA) after DNA extraction.
The extracted eDNA was PCR-amplified in separate sets of reactions using two universal fish mitogenome primer sets: Mifish 12s primers [42] and the 16s rRNA primers Chord 16s F TagA and Chord 16s R short primers [43]. Both primer sets were 5′ tagged with sequences to provide binding sites for the Illumina sequencing primers. The eDNA samples were amplified using AmpliTaq Gold 360 DNA polymerase (Thermo Fisher Scientific, Waltham, MA, USA) in 50 µL total volume reactions. The reactions were separated into six separate tubes for thermal cycling, and then the PCR products were recombined [8]. Potential sources of laboratory contamination were monitored by the inclusion of lab-negative water controls. The PCR reactions were set up in a UV-sterilized AirClean 600 PCR Workstation (ISC BioExpress, Kaysville, UT, USA). The cycling conditions for Mifish were denaturation at 95 °C for 5 min, then 33 cycles of 95 °C for 20 s, 65 °C for 20 s, 72 °C for 1 min, then a final extension step of 72 °C for 5 min, and a final hold of 4 °C. The cycling conditions for Chord 16s were denaturation at 95 °C for 5 min, then 45 cycles of 95 °C for 25 s, 55 °C for 30 s, 72 °C for 1 min, then a final extension step of 72 °C for 6 min, and a final hold of 4 °C.
Aliquots of all the PCR products and negative controls were electrophoresed on 2% agarose gels to visually confirm the successful amplification of all samples and confirm the negative outcomes for all negative controls. Cleanup of the PCR products and concentration normalization were carried out using the SequalPrep Normalization Plate Kit (Thermo Fisher Scientific, Waltham, Massechusetts, USA). Sets of 95 amplicons were sequenced at the University of Missouri Genomics Technology Core (https://dnacore.missouri.edu/, accessed on 12 August 2024) using the Illumina MiSeq v2 platform with 150 bp paired-end reads. Field negative controls were included along with field samples for the Illumina DNA sequencing to establish baseline expectations for contamination levels in the sample data, as well as to establish the minimum detection criteria for the validation of species detection in field-collected water samples [44,45]. An exotic species sample positive control (community tank, PetSmart, Rolla, MO, USA) was included on each 96-well plate of samples [44,46] to monitor for cross-contamination among samples.

2.4. Bioinformatics

Raw sequencing reads were processed using the Barque (v1.7.3) metabarcoding analysis pipeline (https://github.com/enormandeau/barque, accessed on 12 August 2024), which included steps to remove the primer sequences, merge the forward and reverse reads, and filter the chimeric sequences [47]. Taxonomic identification was performed using a reference database consisting of published sequences in GenBank. This database was curated to include only species known to occur in the lower-Mississippi drainage basin to control for erroneous identifications [3]. Sequences were identified using a 97% sequence similarity between the merged sequences and the reference database sequences as a threshold for species assignment and a 95% sequence similarity to assign the sequences to a genus level [6]. The collection of sequences that were not identified by alignment to our database was searched against GenBank using BLASTN to potentially identify any species that were not included in our curated database.
We corrected the read counts by subtracting the number of reads detected in the negative controls from the sample read counts, and we applied a five-read-minimum threshold (range 0.003–0.5% of reads per sample) using MIN_HITS_SAMPLE in Barque for the identification of taxon-presence in each sample, similar to the thresholds considered for other studies focused on ecological diversity [48,49].

2.5. Estimating Species Diversity and Assemblage Structure

Our estimates of species richness were based on the detection (presence/absence) of each species at each sample site. To determine the presence/absence, we combined 12s and 16s reads for each water sample, and combined three water samples at each sample site (hereafter the combined samples). The number of combined samples ranged from three to seven in each habitat (Figure 1). We treated each habitat as a separate assemblage and calculated the coverage, a measure of how completely the assemblage has been sampled, [50] as a function of the number of combined samples. We compared Hill diversity (q = 0–2) estimates standardized to 95% coverage by extrapolation [51] to account for differences in the sampling efficiency [52] and produced 95% confidence intervals for the estimates of richness with 500 bootstrap replicates. Hill numbers included the raw number of species observed or “richness” (q = 0), an estimate of the Shannon diversity (q = 1), and an estimate of the Simpson diversity (q = 2), which increasingly down-weighed the impact of rare species. Calculations of richness were conducted using iNEXT [53].
Assemblage relationships among the habitats and seasons were visualized and tested to determine whether a significant structure among combined samples was present. Spring assemblage relationships were first examined alone due to our inability to resample sites outside of the bayous in the fall (i.e., water levels were too low). A Sorensen similarity matrix was generated for the spring-only incidence data, and non-metric multi-dimensional scaling (nMDS) was used to visualize community relationships in two dimensions. PERMANOVA was then run using the same Sorensen matrix, to test for a significant effect of ‘habitat’ among all the spring combined samples. The model included ‘habitat’ as a fixed effect, was based on the Type III sum of squares, and used unrestricted permutation of the raw data (9999 permutations). We followed this model with a pairwise PERMANOVA to determine which ‘habitats’ differed significantly in their assemblage composition (assuming ‘habitat’ was found to be a significant effect in the global model). A pairwise PERMANOVA was run using the same parameters as the global model; however, the output included P(perm) as well as Monte Carlo P(MC) significance values. The latter was included to provide better clarity of significance when comparing the ‘habitats’ containing small sample sizes.
To examine the potential effects of habitat and season on assemblage relationships, we limited our dataset to only include the three bayou habitats that were sampled during both spring and fall. We again used Sorensen similarity to quantify the relationships among combined samples, and non-metric multi-dimensional scaling (nMDS) to visualize the assemblage relationships. PERMANOVA was used to test for a significant effect of ‘habitat’ and or ‘season’ among samples. The model included ‘habitat’ and ‘season’ as fixed effects, and the potential ‘habitat’ x ‘season’ interaction. All the other model parameters were the same as the previous global PERMANOVA model. In the case of a significant main effect in the global model, a pairwise PERMANOVA was then used to determine which specific groups differed (following the same parameters of the previous pairwise PERMANOVA).
The similarity percentage (SIMPER) was used to identify the species driving differences between habitat groups in the spring-only dataset, and between habitat and season groups in the bayou spring and fall datasets. SIMPER analyses were run using the Sorensen similarity matrices that were previously generated for each dataset. To identify the species and environmental factors most correlated with the full Sorensen matrices (i.e., variables correlated with the full matrix rather than subset group comparisons), we used the BIOENV matching procedure based on the spearman rank correlation. This procedure identifies the individual variables that best match the overall assemblage structure pattern via matrix comparisons. Sorensen similarity matrix comparisons were used to identify the best correlated species, and Sorensen similarity was compared with Euclidean distances among the environmental variables to identify the best correlated environmental factors. The environmental variables were normalized to make all the variable units comparable prior to generating Euclidean matrices. The BIOENV procedure was run for each of our two datasets. All the assemblage analyses (e.g., nMDS, SIMPER, BIOENV) were conducted using PRIMER version 7.0.23, and all the PERMANOVA models were run using PERMANOVA+ in PRIMER version 7 [54].

3. Results

In spring 2022, we collected 84 water samples from 28 locations across bayou, shallow lake, slough, and ditch habitats (Figure 1). The volume of water we were able to filter before the filters were clogged was dictated by the presence of algal growth and suspended sediment load. In the spring, the mean filtered volume per sample was 298 mL (range: 150–500 mL). In our fall collection, we were able to resample 18 of the locations visited in the spring (with the remaining sites being dry). The volume of water filtered per sample from the bayou habitats in the fall was similar to the spring, with a mean of 277 mL. However, the fall samples collected in Robinson Lake and the slough were highly turbid in the rapidly receding remnant habitats. We were only able to filter 15–20 mL of water volume per sample before the filters were clogged. The third combined sample from Wolf Bayou (Figure 1, Wolf Bayou site 3) was in a small tributary creek far from the bayou. This sample location was determined post hoc to be a separate habitat from the rest of the samples in Wolf Bayou and was excluded from all the richness and assemblage structure analyses.
The average Illumina sequence read count per water sample was 77,429 for the 12s marker, and 79,175 for the 16s marker. All the field and lab negative controls were visually determined to be negative using gel electrophoresis. Species presence/absence was determined based on an average of 400,184 reads (range: 134,947–687,843) per combined sample. A total of 51 taxa (47 resolved species, three unresolved species-pairs, and one unresolved species-trio at the genus level) were detected, representing 34 genera and 19 families, summarized in Table 2. Four species clusters remained unresolved due to highly similar reference sequences. In total, 45 out of 51 species were detected by both 12s and 16s markers, with three species each being detected by only the 12s or 16s marker. On average across all the combined samples, 66% (range: 48–79%) of species detections were confirmed by both markers with the remaining detections based on only one or the other marker. A combined sample-level record of the presence/absence of all taxa detected in the study is provided in Table S1.

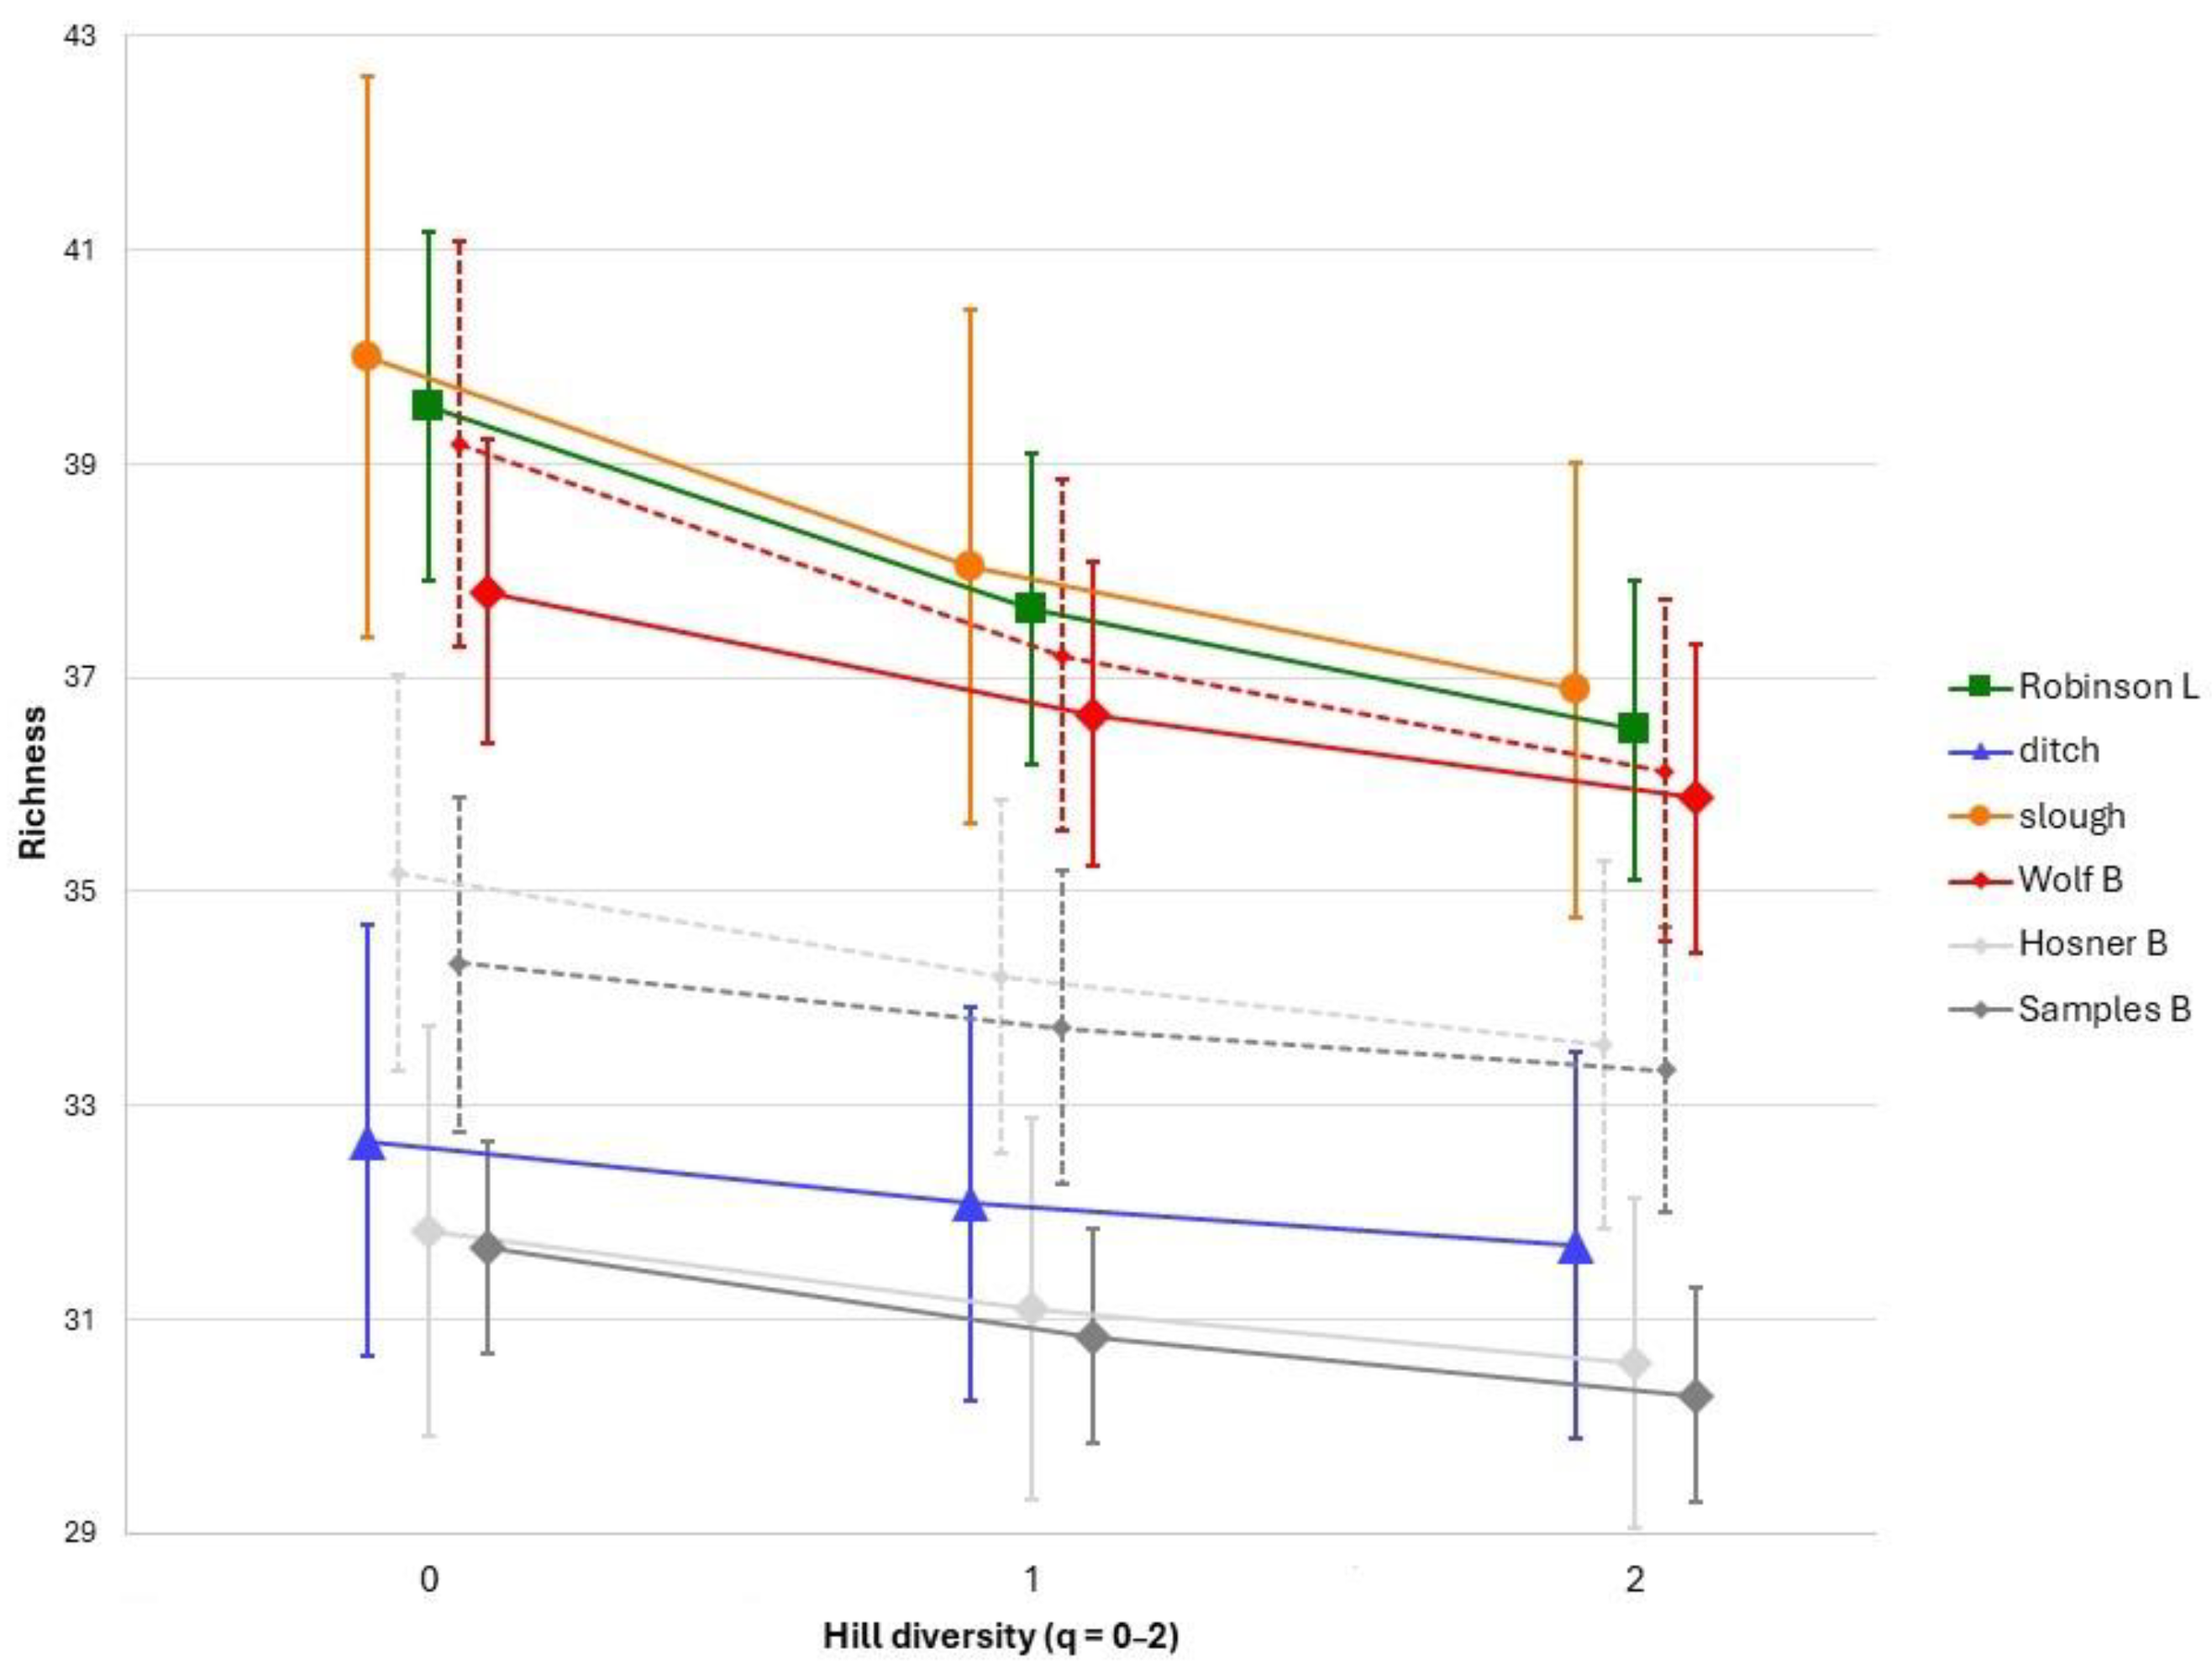
3.1. Species Richness

The number of species detected per habitat ranged from 34 (ditch) to 42 (both Wolf Bayou and Robinson Lake). However, the habitats varied substantially in size and complexity, and the number of combined samples ranged from three to seven among the habitats. Sample species coverage was very good in each of the habitats with estimates ranging between 95% and 99%. For the purposes of drawing direct comparisons among habitats and between sampling dates, all species richness estimates were standardized to 95% coverage using rarefaction. After standardization, we found that the slough, Robinson Lake, and Wolf Bayou all exhibited a similar richness on the spring sampling date, with the other two bayous and the ditch forming a second group with a lower richness (Figure 3). In the bayous, fish assemblages were slightly more diverse on the fall sampling date than in the spring, and the seasonal difference was greater in the Samples and Hosner Bayous, than in Wolf Bayou (Figure 3).
We did not quantify the fall richness in the lake, slough, or ditch habitats, or include the fall samples from these habitats in comparisons of the richness between seasons due to high turbidity, low water volume filtration, and the smaller number of sites that could be sampled. Fewer species were detected in the fall samples from Robinson Lake and the slough, but notably, there were no new species detected in fall samples of these habitats that were not also detected in the more robust spring samples.
Centrarchidae was the most represented family, with 13 species (25% of all taxa) (Table 1). Percidae was represented by five darter species, and several other families were represented by four species (e.g., Ictaluridae, Leuciscidae, Lepisosteidae). Catostomidae would likely have been comparable in taxonomic diversity to the other families if species-level resolution had been achieved for the carpsuckers (Carpiodes) and the buffaloes (Ictiobus), all of which are present in the region [3,10] and previously detected on Black Island (C. Rice pers. comm.). Nine families were represented by a single species. Over half of the species (28 out of 51) were ubiquitous, which we defined as being detected in at least 75% of the combined samples, and present in all the habitats. These included six of the sunfish species (Lepomis spp.), the largemouth bass (Micropterus nigricans), both the crappies (Pomoxis spp.), the buffalo species (Ictiobus spp.), the topminnow species (Fundulus spp.), two catfish species (Ictalurus punctatus and Pylodictis olivaris), three of the gar species (Lepisosteus spp.), the eyetail bowfin (Amia ocellicauda), one darter species (Etheostoma asprigene), and the freshwater drum (Aplodinotus grunniens). All five invasive carp species in the families Cyprinidae and Xenocyprididae were also ubiquitous, and although drawing inference of the relative abundance or overall biomass based on proportions of Illumina read counts is complicated by technical and biological factors [55,56], it is notable that nearly 40% of all the assigned sequence reads were attributable to just these five invasive carp species, with more than 29% of all reads in the study attributable to the bighead and the silver carp (Hypophthalmichthys spp.) alone. The only two native species that rivaled the invasive species with the highest total read counts were the bluegill (L. macrochirus—12.28%) and the combined buffalo species (Ictiobus spp.—10.36%).

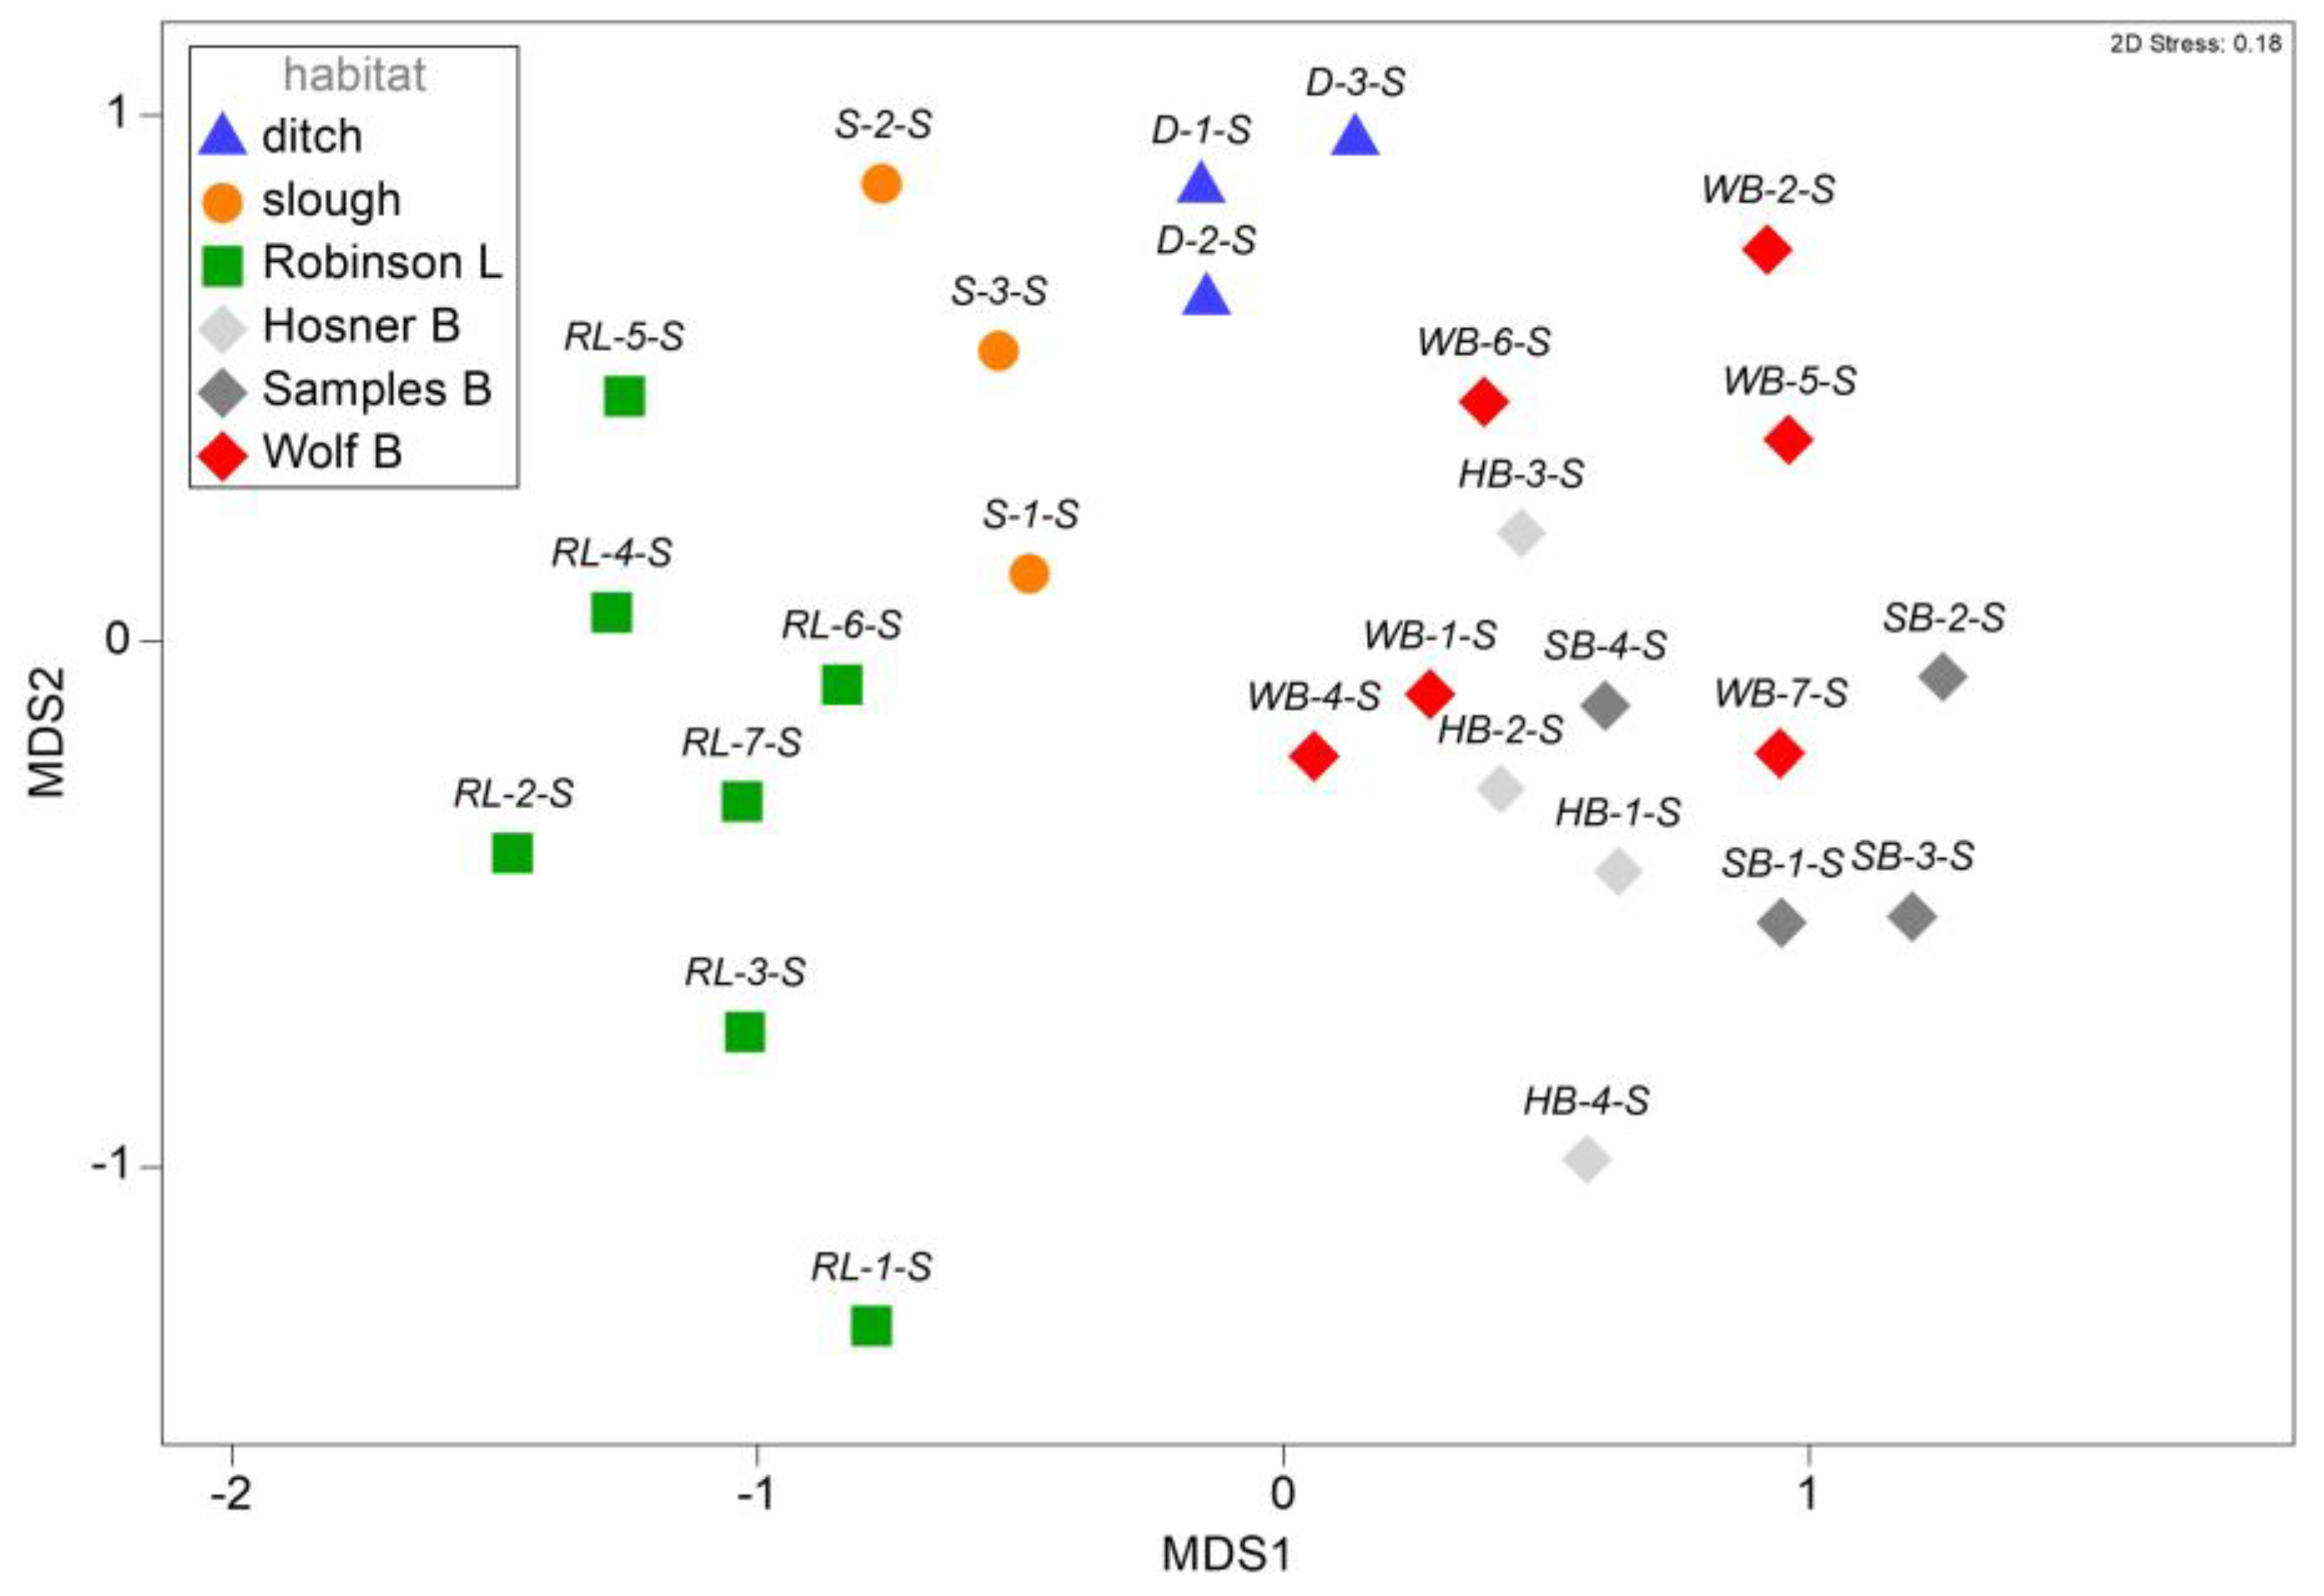
3.2. Assemblage Structure among Spring Samples

A substantial assemblage structure among spring samples was visualized in two dimensions using an nMDS of Sorensen similarities among all the habitats (Figure 4). A PERMANOVA confirmed significant differences in assemblages across habitats (df = 5, Pseudo-F = 6.89, p < 0.001, Table 3), and a post hoc pairwise PERMANOVA confirmed that all the habitats differed significantly except for the Hosner and Samples Bayous, which were largely overlapping in the nMDS space (t = 0.81, P(perm) = 0.86, P(MC) = 0.61) (Table S2).
The species that were most correlated with the overall assemblage structure (resultant of BIOENV) included six species with correlation coefficient values between 0.402 and 0.629 (Table S3). The species that were almost exclusively detected in the bayou habitats included the brook silverside (Labidesthes sicculus r = 0.629, Figure 5a) and the spotted bass (Micropterus punctulatus r = 0.603, Figure 5b). The species that were largely or completely undetected in the bayous, but detected in most of the lake, slough, and ditch samples were the pirate perch (Aphredoderus gibbosus r = 0.441, Figure 5c) and the inland silverside (Menidia beryllina r = 0.402, Figure 5d). A species that was ubiquitous among all habitats but absent from the expansive shallow reach of the flooded Robinson Lake was the flathead catfish (Pylodictus olivaris r = 0.450, Figure 5e). The white bass (Morone chrysops) was detected in all the slough and ditch habitats but detected in only the deepest portions of Robinson Lake and the bayous (r = 0.409, Figure 5f). Moreover, SIMPER identified the species most responsible for pairwise habitat distinctions; however, the output of the analysis generally mirrored the overall trends determined through the BIOENV procedure. The BIOENV of the environmental variables (Table 4) identified conductivity (r = 0.586) and water clarity (Secchi depth r = 0.384) as the two variables that were most correlated with the assemblage similarity matrix (Figure 6). Conductivity was highest in the ditch, slough, and lake habitats, and uniformly low in the bayou habitats, while conversely, water clarity was greatest in the bayou habitats (Table 4).

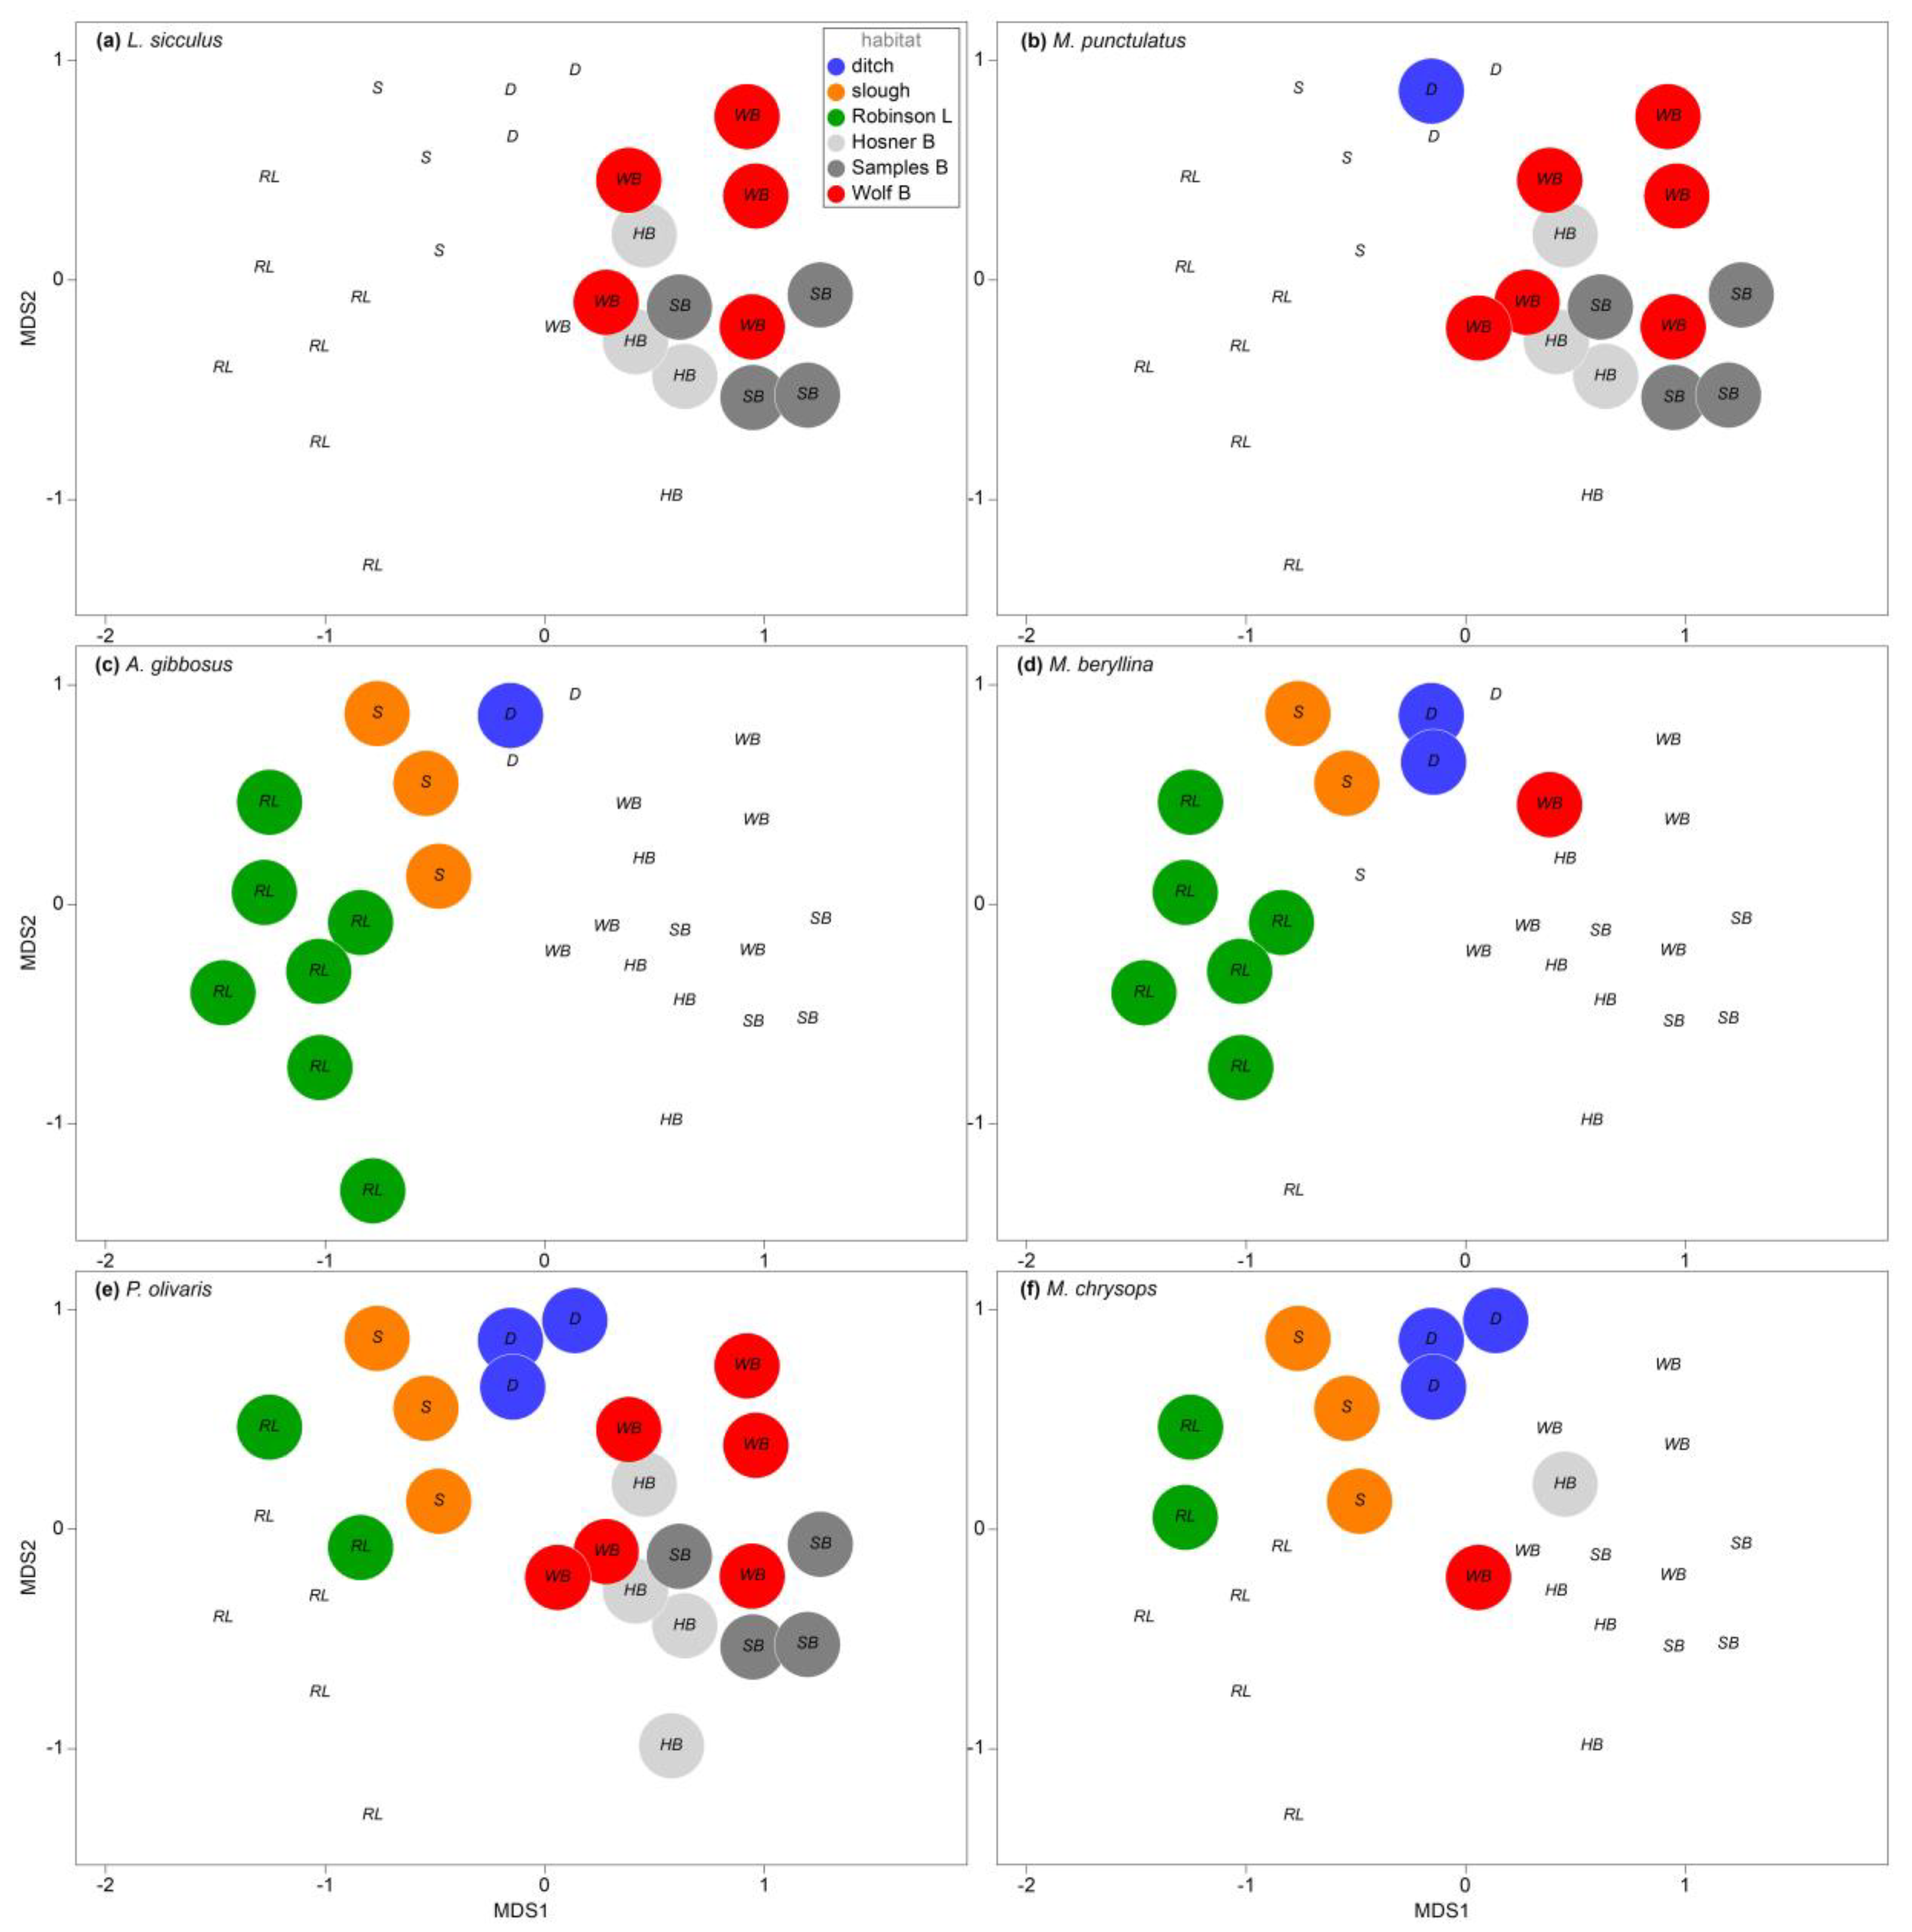
3.3. Seasonal and Spatial Variation in Bayou Habitats

A PERMANOVA including the three bayou habitats and both seasons indicated significant assemblage differences among bayou habitats (df = 2, Pseudo-F = 2.81, p = 0.0025), but not between seasons (df = 1, Pseudo-F = 2.24, p = 0.055; Table 5). Additionally, the interaction was not a significant effect, and since dropping the interaction from the model did not change any outcomes, the interaction is included in the final model presented. A pairwise PERMANOVA confirmed that differences between Samples and Hosner Bayous versus Wolf Bayou held when both the spring and fall data were included (Table 6), the same outcome was found when only the spring samples were considered. A SIMPER analysis identified the paddlefish (Polyodon spathula) and the threadfin shad (Dorosoma petenense) as the two main species driving assemblage differences between Wolf Bayou and the other bayous. Both species were more frequently detected in Wolf Bayou (P. spathula average frequency per site; SB = 0.13, HB = 0.0, WB = 0.75. D. petenense average frequency per site: SB = 0.25, HB = 0.5, WB = 0.83).
Though differences in assemblage composition between spring and fall were not significant, the fall samples did exhibit a marginally higher species richness. One species that was responsible for the increase in fall versus spring richness in Hosner Bayou was the threadfin shad (D. petenense). This species was frequently detected in Wolf Bayou but not in the other two bayous in the spring, and then frequently detected in both the Wolf and Hosner Bayous, but not in Samples Bayou in the fall. Another species that was slightly more abundant in the fall than in the spring was the western mosquito fish (Gambusia affinis), though this was only the case in Samples Bayou and not in the other two bayous.

3.4. Comparison with Historical and Recent Capture-Based Records of Species Presence

We obtained a compilation of the MDC historical fish capture-based survey records for backwater habitats on Black Island with sampling dates from 1940, 1966, 1979, and 1994 (C. Rice pers. comm.), as well as a fyke net survey of Black Island habitats from the early spring of 2022 that included bayou and lake habitats (D. Ostendorf pers. comm.) (Table 2). The combined capture-based record included 40 species, seven of which were taxonomically unresolved using eDNA metabarcoding (Carpiodes (2), Ictiobus (3), and Fundulus (2)). There were four species in the MDC survey records that were not detected in the eDNA survey. Two were represented by single specimens in the full historical record (Hybognathus hayi and Moxostoma macrolepidotum), and two were absent from our reference database for eDNA detection (H. hayi and Paranotropis shumardi). The only remaining species from the historical record of the Black Island complex that was not detected in our eDNA metabarcoding survey was the flier (Centrarchus macropterus), a species of conservation concern listed by the state as ‘vulnerable’ [57] and not recorded on Black Island after 1940. The spring 2022 fyke net survey was conducted on two dates, with a total of 25 sets, and identified 17 species in total (D. Ostendorf pers. comm.), all of which were detected in our eDNA metabarcoding survey (Table 2).
Our eDNA metabarcoding survey detected eight native species that were not reported in the MDC survey records for Black Island. These included three sunfishes (L. microlophus, L. miniatus, L. symmetricus), the logperch (Percina caprodes), the American eel (Anguilla rostrata), and two gar species, the spotted gar (Lepisosteus oculatus) and the alligator gar (Atractosteus spatula). All were relatively rare among the eDNA samples except for the spotted gar. All four invasive carp species in the Xenocyprididae were unreported in the MDC survey records between 1940 and 1994, with only H. molitrix being recorded in the 2022 fyke net survey.

4. Discussion

4.1. Species Diversity

Quantifying the diversity and distribution of species across temporal and spatial scales is crucial towards a greater understanding of the ecological community structure and dynamics [58,59,60]. The use of eDNA metabarcoding to assess fish biodiversity and assemblage structure has become common in freshwater [33,61,62] and marine [7,63] environments. We assessed alpha (within habitat) diversity and beta (between habitats) diversity among the Mississippi River bottomland habitats, and quantified spatio-temporal fish assemblage relationships. Although habitat complexity makes these systems difficult to thoroughly sample using traditional capture-based methods [3], our use of eDNA metabarcoding allowed a more complete characterization of the diversity harbored by these unique habitats than was previously available.
Our eDNA metabarcoding survey detected 51 out of 134 species listed in a recently compiled comprehensive list of species for the entire lower reach of the Mississippi River [3]. We detected eighty-three percent of species (33 of 40) recorded in MDC survey records of the Black Island Conservation Area between 1940 and 1994 and triple the number of species detected in a fyke net survey conducted by the MDC in 2022. Moreover, 19 of 51 taxa we detected using eDNA metabarcoding were never recorded in any previous surveys of Black Island habitats. Our eDNA metabarcoding survey increased the list of known species in the Black Island Conservation Area by a third.
Two-thirds of the species detected from their eDNA (34 of 51) were classified as “uncommon” in the Mississippi River and backwaters by Ref. [3]. These results suggest that eDNA metabarcoding was either effective at detecting rare species, or those species may be more common than capture-based surveys generally indicate. There were also seven species detected from their eDNA in this study that are listed as “common” or “abundant” in Mississippi River habitats [3], but have never been reported in Black Island capture-based surveys. Some of these species reach a large adult size (e.g., I. punctatus, P. olivaris, A. grunniens) that may make them more challenging to record by capture-based means using methods that are commonly employed in backwater habitats (e.g., fyke nets). Others are river channel species (e.g., A. chrysocloris, N. atherinoides) [10] that may be present in backwater habitats only infrequently. Two-thirds of the species detected by their eDNA are dependent on backwater habitats for at least a portion of their life history (Table 2), while only a third of the species are dependent on fluvial habitats for any portion of their life histories [3].
This study demonstrated that Black Island lowland habitats contain a highly diverse ichthyofauna. Estimates of species richness were comparable to or greater than the eDNA-based species richness estimates reported in Missouri Ozark uplands stream habitats, which were conducted using the same set of 12S and 16S gene markers [60]. In a survey of three sites in the St. Francis River drainage within the Ozark-lowland border region of Missouri, species richness (Hill number q = 0 and 95% species coverage) estimates ranged ~25–35 species [60] compared with estimates of 32–40 species per the Black Island habitat (Figure 3) in this study.

4.2. Assemblage Structure

Variations in backwater habitat characteristics that include vegetation, submerged structure, depth, seasonal persistence, and connectivity to the river channel impact fish assemblages among the Mississippi River backwater habitats [64,65]. On Black Island, deeply incised bayou habitats were the most isolated from the Mississippi River channel, and exhibited the greatest depth, steepest banks, highest clarity, lowest conductivity, and greatest seasonal stability among all the sampled habitats. Robinson Lake, the slough, and the ditch were all more directly connected to the river channel, particularly when the river was at the flood stage (e.g., in spring 2022, Figure 2). These habitats were seasonally more dynamic regarding depth, surface area, and temperature, with many of the spring sample sites presenting as dry on the fall sampling date. The contour was very flat in the lake, with aquatic habitats inundated into heavily vegetated surrounding areas in the spring. Conductivity and Secchi depth (a proxy for clarity) were identified as the two environmental factors that were most correlated with the assemblage structure; specifically, conductivity was lower and clarity was higher in bayous compared with all other habitats. The reduced conductivity and greater clarity of the bayous may result from isolation from the river channel in the spring, though this was not tested.
Generally, the overlap in species occupying various habitats was extensive. However, each of the habitat types had distinctive fish assemblages, as indicated by the nMDS and PERMANOVA. The relatively small subset of species identified as main contributors to the assemblage differences among habitats included two silverside species (family Atherinopsidae), with the brook silverside (L. sicculus) frequenting the bayou complex, and the inland silverside (M. beryllina) being more frequent in Robinson Lake, as well as in the interconnected ditch and slough. Brook silversides are common in both upland Ozark and small lowland stream habitats throughout the region, while inland silversides are a large-river species, common in the Mississippi River [10]; so, these contrasting distributions reflect differences in connectivity between Black Island habitats and the Mississippi River channel. The western pirate perch (Aphredoderus gibbosus) exhibited a distribution among habitats very similar to the inland silverside, and was detected frequently in the lake, ditch, and slough habitats, but was nearly absent from the bayous. The western pirate perch is widely distributed among lowland habitats and is also found in the Mississippi River channel and backwaters [10]. The distribution of the spotted bass (Micropterus punctulatus) matched that of the brook silverside in the bayous, where it may do well in the relatively clear lentic habitat.
We examined spring and fall bayou samples to assess the differences between the three bayous, as well as the potential seasonal effect on the assemblage composition. The significant assemblage structure within the bayou complex was more subtle and primarily contrasted the larger and deeper Wolf Bayou with the narrower and shallower Samples and Hosner Bayous. Differences between these respective bayou habitats were primarily due to the greater diversity of species detected in Wolf Bayou, including the paddlefish (Polydon spatula) and the threadfin shad (Dorosoma petenense). Both are filter feeders, preferring larger open waters [10]. Though the threadfin shad was only detected in Wolf Bayou in the spring, where it was regularly detected, it was also detected frequently in Hosner Bayou and rarely in Samples Bayou in the fall. This pattern of distributional expansion could be attributable to an increase in seasonal abundance due to spawning between the sampling dates in May versus October.

4.3. Taxonomic Distribution of Diversity

Across all families and in all samples, the greatest taxonomic diversity was exhibited by the sunfishes and black basses (family Centrarchidae). Members of this family generally exhibit sedentary habits and are distributed often in slow moving or still waters with submerged cover [10], so the Mississippi River lowlands provide an ideal habitat for many of these species. In fact, nine of the thirteen extant sunfishes in the genus Lepomis [66,67] were detected in this study. Five of the sunfish species have widespread distributions, while four of the species are rare or exhibit distributions specific to lowland habitats, making their presence notable. These included the dollar sunfish (L. marginatus), which was ubiquitous according to the eDNA data, and the redear (L. microlophus), redspotted (L. miniatus), and bantam (L. symmetricus) sunfishes, each of which were detected in only a few samples in either the bayous or Robinson Lake (Table 2).
Equally important as the families that were well represented in the Black Island habitats is a family that was not well represented. There was a notably limited diversity of North American minnow species (family Leuciscidae). The Leuciscids are the most speciose fish family in North America [68], as well as in the Mississippi River and its backwaters [3]. Only four minnow species were detected in our study, and of those, only the pugnose minnow (Opsopoeodus emiliae) was widespread across habitat types. The Mississippi silvery minnow (Hybognathus nuchalis), the emerald shiner (Notropis atherinoides), and the golden shiner (Notemigonous crysoleucas) were each detected in only a few samples. The minnow family includes numerous large-river species that have been documented in the adjacent Mississippi River [3,10], but were not detected in this survey or previous surveys of the Black Island wetland complex, suggesting that these wetland habitats may not be appropriate for these species, at least at the times and places that the surveys were conducted. There are also a number of minnow species whose distributions include many of the small streams of the adjacent alluvial plain ecosystem that were not detected in this study [10]. The absence of these species could be indicative of the impact of the levee system as a barrier preventing access of some wetland species to the bottomland habitats trapped along the margins of the Mississippi River by the levee system. A more comprehensive evaluation of this possibility provides a future avenue for conservation research in this system.

4.4. Invasive and Introduced Species, and Species of Conservation Concern

Our results indicated that eDNA metabarcoding is a useful tool for detecting invasive species as demonstrated in previous studies [69]. All five invasive Asian carp were detected ubiquitously across all the habitats we sampled. They were also frequently observed, particularly in the shallow slough and Robinson Lake habitats, in both the spring and fall sampling trips. The fact that forty percent of all eDNA reads in the study were attributable to these five invasive species is an alarming observation and underlines the scale of invasive species’ prevalence and impacts in these lowland habitats. The sheer volume of eDNA detected from these invasive species, and particularly from the bighead carp (Hypophthalmichthys nobilis) and silver carp (H. molitrix), which together accounted for 29% of all the sequenced eDNA reads, does require caution when making inferences regarding when and where these species may be frequenting within the Black Island habitat complex. Studies have shown that eDNA that becomes bound to silt and clay particles can have persistence times that are orders of magnitude longer than eDNA in the water column [31,32]. It is possible that high-abundance, high-biomass species, like the Hypophthalmichthys species, have saturated portions of the floodplain environment with eDNA, making their detection unavoidable. If the goal of an eDNA metabarcoding survey is to determine the distribution of the less abundant native fish species in a region, it may be beneficial to modify the detection conditions by using blocking primers for Hypophthalmichthys species in the PCR reactions to avoid the detection of common invasive species [70].
Historically, the lowland habitats of Black Island provided an ideal habitat for the critically imperiled alligator gar (Atractosteus spatula) [71,72,73]. Wolf Bayou was identified as a priority site for the reintroduction of alligator gar by the Missouri Department of Conservation, and the species was stocked five different times between 2013 and 2022 (S. Mondragon pers. comm.). It was reassuring to detect alligator gar eDNA at three sample locations in Wolf Bayou, including in both the spring and fall samples. Not much more can be inferred about the status of alligator gar in this bayou complex other than that the species was not detected in either of the other bayous, which are all interconnected. Other species of conservation concern detected in this survey included the imperiled bantam sunfish (Lepomis symmetricus) in both the bayou and Robinson Lake habitats, and the vulnerable Mississippi silvery minnow and river darter, both of which were detected in the river slough habitat.

5. Conclusions

Though the degradation of floodplain habitats persists in modern times [74], our study further demonstrates the wealth of information that can be extracted from the advancement of eDNA biomonitoring tools. Importantly, we were able to demonstrate significant fish assemblage distinctions among lowland habitat types using eDNA survey methods across a period when a fyke net survey identified far fewer species only months earlier. Species of conservation concern were documented, and fish assemblages associated with water permanence and river connection took shape. The information from this study and others stemming from it will contribute to the understanding of floodplain communities and how to best preserve them.

Supplementary Materials

The following supporting information can be downloaded at: https://www.mdpi.com/article/10.3390/d16080495/s1, Table S1: Presence/Absence data for each combined sample location for spring and fall collections, Table S2: Pair-wise PERMANOVA tests to determine which habitats are significantly different from one another, Table S3: Spearman rank correlations of individual species that show the strongest correlation with overall spring assemblage structure, calculated using BIOENV.

Author Contributions

Authors contributed in the following ways: Conceptualization, E.J.L., L.K.B. and D.D.D.; methodology, E.J.L., V.M.L. and D.D.D.; database construction, E.J.L., V.M.L. and D.D.D.; sample collection, E.J.L. and D.D.D.; data analysis, E.J.L., A.D.G. and D.D.D.; funding acquisition, D.D.D. and L.K.B.; data curation, E.J.L. and D.D.D.; writing—original draft preparation, E.J.L. and D.D.D.; writing—review and editing, D.D.D., A.D.G. and L.K.B. All authors have read and agreed to the published version of the manuscript.

Funding

This research was funded by the Missouri Department of Conservation, cooperative agreement no. 460.

Institutional Review Board Statement

This study did not involve animals and an institutional review of protocols was not applicable.

Data Availability Statement

All the eDNA metabarcoding sample fastq files and associated metadata are deposited in the SRA (BioProject PRJNA1135988).

Acknowledgments

We wish to thank D. Ostendorf and the fisheries staff at the MDC Cape Girardeau office for discussions during the development of our study design, and the selection of sampling locations; C. Rice and D. Ostendorf for access to the MDC survey records; S. Mondragon for the alligator gar stocking records; and R. Hrabik for discussions on species collections in the region.

Conflicts of Interest

The authors declare no conflicts of interest.

References

  1. Jarvis, S.G.; Mackay, E.B.; Risser, H.A.; Feuchtmayr, H.; Fry, M.; Isaac, N.J.B.; Thackeray, S.J.; Henrys, P.A. Integrating freshwater biodiversity data sources: Key challenges and opportunities. Freshw. Biol. 2023, 68, 1479–1488. [Google Scholar] [CrossRef]
  2. Radinger, J.; Britton, J.R.; Carlson, S.M.; Magurran, A.E.; Alcaraz-Hernández, J.D.; Almodóvar, A.; Benejam, L.; Fernández-Delgado, C.; Nicola, G.G.; Oliva-Paterna, F.J.; et al. Effective monitoring of freshwater fish. Fish Fish. 2019, 20, 729–747. [Google Scholar] [CrossRef]
  3. Schramm, H.L.; Hatch, J.T.; Hrabik, R.A.; Slack, W.T. Fishes of the Mississippi River. Am. Fish. Soc. Symp. 2016, 84, 53–77. [Google Scholar]
  4. DuBowy, P.J. Mississippi River Ecohydrology: Past, present and future. Ecohydrol. Hydrobiol. 2013, 13, 73–83. [Google Scholar] [CrossRef]
  5. Best, J. Anthropogenic stresses on the world’s big rivers. Nat. Geosci. 2019, 12, 7–21. [Google Scholar] [CrossRef]
  6. Deiner, K.; Bik, H.M.; Mächler, E.; Seymour, M.; Lacoursière-Roussel, A.; Altermatt, F.; Creer, S.; Bista, I.; Lodge, D.M.; de Vere, N.; et al. Environmental DNA metabarcoding: Transforming how we survey animal and plant communities. Mol. Ecol. 2017, 26, 5872–5895. [Google Scholar] [CrossRef] [PubMed]
  7. Schenekar, T. The current state of eDNA research in freshwater ecosystems: Are we shifting from the developmental phase to standard application in biomonitoring? Hydrobiologia 2023, 850, 1263–1282. [Google Scholar] [CrossRef]
  8. Ruppert, K.M.; Kline, R.J.; Rahman, M.S. Past, present, and future perspectives of environmental DNA (eDNA) metabarcoding: A systematic review in methods, monitoring, and applications of global eDNA. Glob. Ecol. Conserv. 2019, 17, e00547. [Google Scholar] [CrossRef]
  9. Schramm, H.L.; Ickes, B.S. The Mississippi River: A Place for Fish the Mississippi River: A Place for Fish. Am. Fish. Soc. Symp. 2016, 84, 3–34. [Google Scholar]
  10. Pflieger, W.L. The Fishes of Missouri, 2nd ed.; Missouri Department of Conservation: Jefferson City, MI, USA, 1997. [Google Scholar]
  11. Pierce, S.C.; Kröger, R.; Pezeshki, R. Managing artificially drained low-gradient agricultural headwaters for enhanced ecosystem functions. Biology 2012, 1, 794–856. [Google Scholar] [CrossRef]
  12. United States Army Corps of Engineers (USACE). Mississippi River and Tributaries Project—Levee System Evaluation Report for the National Flood Insurance Program; United States Army Corps of Engineers: Washington, DC, USA, 2014. [Google Scholar]
  13. Olson, K.R.; Morton, L.W.; Speidel, D. Missouri Ozark Plateau Headwaters Diversion engineering feat. J. Soil Water Conserv. 2016, 71, 13A–19A. [Google Scholar] [CrossRef]
  14. Olson, K.R.; Morton, L.W.; Speidel, D. Little river drainage district conversion of big swamp to fertile agricultural land. J. Soil Water Conserv. 2016, 71, 37A–43A. [Google Scholar] [CrossRef]
  15. Jenkins, C.N.; Van Houtan, K.S.; Pimm, S.L.; Sexton, J.O. US protected lands mismatch biodiversity priorities. Proc. Natl. Acad. Sci. USA 2015, 112, 5081–5086. [Google Scholar] [CrossRef] [PubMed]
  16. Noss, R.F.; Platt, W.J.; Sorrie, B.A.; Weakley, A.S.; Means, D.B.; Costanza, J.; Peet, R.K. How global biodiversity hotspots may go unrecognized: Lessons from the North American Coastal Plain. Divers. Distrib. 2015, 21, 236–244. [Google Scholar] [CrossRef]
  17. Isphording, W.; Fitzpatrick, J., Jr. Geologic and evolutionary history of drainage systems in the Southeastern United States. In Biodiversity of the Southeastern United States Aquatic Communities; Hackney, C., Adams, S., Martin, W., Eds.; John Wiley and Sons: New York, NY, USA, 1992; pp. 19–56. [Google Scholar]
  18. Cross, F.B.; Mayden, R.L.; Stewart, J.D. Fishes in the western Mississippi drainage. In Zoogeography of North American Freshwater Fishes; Hocutt, C.H., Wiley, E.O., Eds.; Wiley: New York, NY, USA, 1986; pp. 363–412. [Google Scholar]
  19. Warren, M.L.; Burr, B.M.; Walsh, S.J.; Bart, H.L.; Cashner, R.C.; Etnier, D.A.; Freeman, B.J.; Kuhajda, B.R.; Mayden, R.L.; Robison, H.W.; et al. Diversity, Distribution, and Conservation Status of the Native Freshwater Fishes of the Southern United States. Fisheries 2000, 25, 7–31. [Google Scholar] [CrossRef]
  20. Sowa, S.P.; Annis, G.; Morey, M.E.; Diamond, D.D. A gap analysis and comprehensive conservation strategy for riverine ecosystems of Missouri. Ecol. Monogr. 2007, 77, 301–334. [Google Scholar] [CrossRef]
  21. Junk, W.J.; Bayley, P.B.; Sparks, R.E. The flood pulse concept in River-Floodplain Systems. Can. Spec. Publ. Fish. Aquat. Sci. 1989, 106, 110–127. [Google Scholar]
  22. Phelps, Q.E.; Tripp, S.J.; Herzog, D.P.; Garvey, J.E. Temporary connectivity: The relative benefits of large river floodplain inundation in the lower Mississippi River. Restor. Ecol. 2015, 23, 53–56. [Google Scholar] [CrossRef]
  23. Allen, Y.; Kimmel, K.; Constant, G. Using Remote Sensing to Assess Alligator Gar Spawning Habitat Suitability in the Lower Mississippi River. North Am. J. Fish. Manag. 2020, 40, 580–594. [Google Scholar] [CrossRef]
  24. Schramm, H.L.; Eggleton, M.A. Applicability of the flood-pulse concept in a temperate floodplain river ecosystem: Thermal and temporal components. River Res. Appl. 2006, 22, 543–553. [Google Scholar] [CrossRef]
  25. Humphries, P.; King, A.J.; Koehn, J.D. Fish, flows and flood plains: Links between freshwater fishes and their environment in the Murray-Darling River system, Australia. Environ. Biol. Fishes 1999, 56, 129–151. [Google Scholar] [CrossRef]
  26. Sparks, R.E. Need for ecosystem management of large rivers and their floodplains. NCASI Tech. Bull. 1999, 2, 507. [Google Scholar] [CrossRef]
  27. Dettmers, J.M.; Gutreuter, S.; Wahl, D.H.; Soluk, D.A. Patterns in abundance of fishes in main channels of the upper Mississippi River system. Can. J. Fish. Aquat. Sci. 2001, 58, 933–942. [Google Scholar] [CrossRef]
  28. Mächler, E.; Little, C.J.; Wüthrich, R.; Alther, R.; Fronhofer, E.A.; Gounand, I.; Harvey, E.; Hürlemann, S.; Walser, J.C.; Altermatt, F. Assessing different components of diversity across a river network using eDNA. Environ. DNA 2019, 1, 290–301. [Google Scholar] [CrossRef]
  29. Rees, H.C.; Maddison, B.C.; Middleditch, D.J.; Patmore, J.R.M.; Gough, K.C. The detection of aquatic animal species using environmental DNA—A review of eDNA as a survey tool in ecology. J. Appl. Ecol. 2014, 51, 1450–1459. [Google Scholar] [CrossRef]
  30. Harrison, J.B.; Sunday, J.M.; Rogers, S.M. Predicting the fate of eDNA in the environment and implications for studying biodiversity. Proc. R. Soc. B Biol. Sci. 2019, 286, 20191409. [Google Scholar] [CrossRef] [PubMed]
  31. Nevers, M.B.; Przybyla-Kelly, K.; Shively, D.; Morris, C.C.; Dickey, J.; Byappanahalli, M.N. Influence of sediment and stream transport on detecting a source of environmental DNA. PLoS ONE 2020, 15, e0244086. [Google Scholar] [CrossRef]
  32. Turner, C.R.; Uy, K.L.; Everhart, R.C. Fish environmental DNA is more concentrated in aquatic sediments than surface water. Biol. Conserv. 2015, 183, 93–102. [Google Scholar] [CrossRef]
  33. Cilleros, K.; Valentini, A.; Allard, L.; Dejean, T.; Etienne, R.; Grenouillet, G.; Iribar, A.; Taberlet, P.; Vigouroux, R.; Brosse, S. Unlocking biodiversity and conservation studies in high-diversity environments using environmental DNA (eDNA): A test with Guianese freshwater fishes. Mol. Ecol. Resour. 2019, 19, 27–46. [Google Scholar] [CrossRef]
  34. García-Machado, E.; Laporte, M.; Normandeau, E.; Hernández, C.; Côté, G.; Paradis, Y.; Mingelbier, M.; Bernatchez, L. Fish community shifts along a strong fluvial environmental gradient revealed by eDNA metabarcoding. Environ. DNA 2022, 4, 117–134. [Google Scholar] [CrossRef]
  35. Lecaudey, L.A.; Schletterer, M.; Kuzovlev, V.V.; Hahn, C.; Weiss, S.J. Fish diversity assessment in the headwaters of the Volga River using environmental DNA metabarcoding. Aquat. Conserv. Mar. Freshw. Ecosyst. 2019, 29, 1785–1800. [Google Scholar] [CrossRef]
  36. Kačergytė, I.; Petersson, E.; Arlt, D.; Hellström, M.; Knape, J.; Spens, J.; Żmihorski, M.; Pärt, T. Environmental DNA metabarcoding elucidates patterns of fish colonisation and co-occurrences with amphibians in temperate wetlands created for biodiversity. Freshw. Biol. 2021, 66, 1915–1929. [Google Scholar] [CrossRef]
  37. United States Geological Survey. Floodplain Elevation Data. Available online: https://apps.nationalmap.gov/viewer/ (accessed on 12 August 2024).
  38. Williams, K.E.; Huyvaert, K.P.; Piaggio, A.J. No filters, no fridges: A method for preservation of water samples for eDNA analysis. BMC Res. Notes 2016, 9, 298. [Google Scholar] [CrossRef] [PubMed]
  39. Spens, J.; Evans, A.R.; Halfmaerten, D.; Knudsen, S.W.; Sengupta, M.E.; Mak, S.S.T.; Sigsgaard, E.E.; Hellström, M. Comparison of capture and storage methods for aqueous macrobial eDNA using an optimized extraction protocol: Advantage of enclosed filter. Methods Ecol. Evol. 2017, 8, 635–645. [Google Scholar] [CrossRef]
  40. Goldberg, C.S.; Turner, C.R.; Deiner, K.; Klymus, K.E.; Thomsen, P.F.; Murphy, M.A.; Spear, S.F.; McKee, A.; Oyler-McCance, S.J.; Cornman, R.S.; et al. Critical considerations for the application of environmental DNA methods to detect aquatic species. Methods Ecol. Evol. 2016, 7, 1299–1307. [Google Scholar] [CrossRef]
  41. Kumar, G.; Farrell, E.; Reaume, A.M.; Eble, J.A.; Gaither, M.R. One size does not fit all: Tuning eDNA protocols for high- and low-turbidity water sampling. Environ. DNA 2022, 4, 167–180. [Google Scholar] [CrossRef]
  42. Miya, M.; Sato, Y.; Fukunaga, T.; Sado, T.; Poulsen, J.Y.; Sato, K.; Minamoto, T.; Yamamoto, S.; Yamanaka, H.; Araki, H.; et al. MiFish, a set of universal PCR primers for metabarcoding environmental DNA from fishes: Detection of more than 230 subtropical marine species. R. Soc. Open Sci. 2015, 2, 150088. [Google Scholar] [CrossRef] [PubMed]
  43. Deagle, B.E.; Kirkwood, R.; Jarman, S.N. Analysis of Australian fur seal diet by pyrosequencing prey DNA in faeces. Mol. Ecol. 2009, 18, 2022–2038. [Google Scholar] [CrossRef] [PubMed]
  44. Klymus, K.E.; Richter, C.A.; Thompson, N.; Hinck, J.E. Metabarcoding of environmental DNA samples to explore the use of uranium mine containment ponds as a water source for wildlife. Diversity 2017, 9, 54. [Google Scholar] [CrossRef]
  45. Valentini, A.; Taberlet, P.; Miaud, C.; Civade, R.; Herder, J.; Thomsen, P.F.; Bellemain, E.; Besnard, A.; Coissac, E.; Boyer, F.; et al. Next-generation monitoring of aquatic biodiversity using environmental DNA metabarcoding. Mol. Ecol. 2016, 25, 929–942. [Google Scholar] [CrossRef]
  46. Nakagawa, H.; Yamamoto, S.; Sato, Y.; Sado, T.; Minamoto, T.; Miya, M. Comparing local- and regional-scale estimations of the diversity of stream fish using eDNA metabarcoding and conventional observation methods. Freshw. Biol. 2018, 63, 569–580. [Google Scholar] [CrossRef]
  47. Mathon, L.; Valentini, A.; Guérin, P.E.; Normandeau, E.; Noel, C.; Lionnet, C.; Boulanger, E.; Thuiller, W.; Bernatchez, L.; Mouillot, D.; et al. Benchmarking bioinformatic tools for fast and accurate eDNA metabarcoding species identification. Mol. Ecol. Resour. 2021, 21, 2565–2579. [Google Scholar] [CrossRef] [PubMed]
  48. Alberdi, A.; Aizpurua, O.; Gilbert, M.T.P.; Bohmann, K. Scrutinizing key steps for reliable metabarcoding of environmental samples. Methods Ecol. Evol. 2018, 9, 134–147. [Google Scholar] [CrossRef]
  49. McColl-Gausden, E.F.; Weeks, A.R.; Coleman, R.A.; Robinson, K.L.; Song, S.; Raadik, T.A.; Tingley, R. Multispecies models reveal that eDNA metabarcoding is more sensitive than backpack electrofishing for conducting fish surveys in freshwater streams. Mol. Ecol. 2021, 30, 3111–3126. [Google Scholar] [CrossRef]
  50. Chao, A.; Jost, L. Coverage-based rarefaction and extrapolation: Standardizing samples by completeness rather than size. Ecology 2012, 93, 2533–2547. [Google Scholar] [CrossRef]
  51. Chao, A.; Gotelli, N.J.; Hsieh, T.C.; Sander, E.L.; Ma, K.H.; Colwell, R.K.; Ellison, A.M. Rarefaction and extrapolation with Hill numbers: A framework for sampling and estimation in species diversity studies. Ecol. Monogr. 2014, 84, 45–67. [Google Scholar] [CrossRef]
  52. Roswell, M.; Dushoff, J.; Winfree, R. A conceptual guide to measuring species diversity. Oikos 2021, 130, 321–338. [Google Scholar] [CrossRef]
  53. Hsieh, T.; Ma, K.; Chao, A. iNEXT: Interpolation and Extrapolation for Species Diversity, R package version 3.0.1; R Core Team: Vienna, Austria, 2024. [Google Scholar]
  54. Anderson, M.J.; Gorley, R.N.; Clarke, K.R. PERMANOVA+ for PRIMER: Guide to Software and Statistical Methods; PRIMER-E: Plymouth, UK, 2008. [Google Scholar]
  55. Mathieu, C.; Hermans, S.M.; Lear, G.; Buckley, T.R.; Lee, K.C.; Buckley, H.L. A systematic review of sources of variability and uncertainty in eDNA data for environmental monitoring. Front. Ecol. Evol. 2020, 8, 135. [Google Scholar] [CrossRef]
  56. Beng, K.C.; Corlett, R.T. Applications of Environmental DNA (eDNA) in Ecology and Conservation: Opportunities, Challenges and Prospects; Springer: Dordrecht, The Netherlands, 2020; Volume 29, ISBN 0123456789. [Google Scholar]
  57. Missouri Department of Conservation (MDC). Missouri Species and Communities of Conservation Concern Checklist; Missouri Department of Conservation: Jefferson City, MO, USA, 2022. [Google Scholar]
  58. Geheber, A.D.; Piller, K.R. Spatio-temporal patterns of fish assemblage structure in a coastal plain stream: Appropriate scales reveal historic tales. Ecol. Freshw. Fish 2012, 21, 627–639. [Google Scholar] [CrossRef]
  59. Zbinden, Z.D.; Geheber, A.D.; Lehrter, R.J.; Matthews, W.J. Multifaceted assessment of stream fish alpha and beta diversity using spatial models. Hydrobiologia 2022, 849, 1795–1820. [Google Scholar] [CrossRef]
  60. Lee, V.M.; Berkman, L.K.; Geheber, A.D.; Landwer, B.; Ludwig, E.J.; Duvernell, D.D. Putting eDNA to the test: A field comparison of eDNA metabarcoding to established protocols for assessing biodiversity in Missouri’s Ozark Highland streams. Environ. DNA 2024, 6, e510. [Google Scholar] [CrossRef]
  61. Hallam, J.; Clare, E.L.; Jones, J.I.; Day, J.J. Biodiversity assessment across a dynamic riverine system: A comparison of eDNA metabarcoding versus traditional fish surveying methods. Environ. DNA 2021, 3, 1247–1266. [Google Scholar] [CrossRef]
  62. Euclide, P.T.; Lor, Y.; Spear, M.J.; Tajjioui, T.; Vander Zanden, J.; Larson, W.A.; Amberg, J.J. Environmental DNA metabarcoding as a tool for biodiversity assessment and monitoring: Reconstructing established fish communities of north-temperate lakes and rivers. Divers. Distrib. 2021, 27, 1966–1980. [Google Scholar] [CrossRef]
  63. Miya, M. Environmental DNA Metabarcoding: A Novel Method for Biodiversity Monitoring of Marine Fish Communities. Ann. Rev. Mar. Sci. 2022, 14, 161–185. [Google Scholar] [CrossRef]
  64. Koel, T.M. Spatial Variation in Fish Species Richness of the Upper Mississippi River System. Trans. Am. Fish. Soc. 2004, 133, 984–1003. [Google Scholar] [CrossRef]
  65. Dembkowski, D.J.; Miranda, L.E. Hierarchy in factors affecting fish biodiversity in floodplain lakes of the Mississippi Alluvial Valley. Environ. Biol. Fishes 2012, 93, 357–368. [Google Scholar] [CrossRef]
  66. Harris, P.M.; Roe, K.J.; Mayden, R.L. A Mitochondrial DNA Perspective on the Molecular Systematics of the Sunfish Genus Lepomis (Actinopterygii: Centrarchidae). Copeia 2005, 2005, 340–346. [Google Scholar] [CrossRef]
  67. Near, T.J.; Koppelman, J.B. Species diversity, phylogeny and phylogeography of Centrarchidae. In Centrarchid Fishes: Diversity, Biology, and Conservation; Cooke, S.J., Philipp, D.P., Eds.; Wiley-Blackwell: Chichester, UK, 2009; pp. 1–38. ISBN 9781405171229. [Google Scholar]
  68. Schönhuth, S.; Vukić, J.; Šanda, R.; Yang, L.; Mayden, R.L. Phylogenetic relationships and classification of the Holarctic family Leuciscidae (Cypriniformes: Cyprinoidei). Mol. Phylogenet. Evol. 2018, 127, 781–799. [Google Scholar] [CrossRef] [PubMed]
  69. Pukk, L.; Kanefsky, J.; Heathman, A.L.; Weise, E.M.; Nathan, L.R.; Herbst, S.J.; Sard, N.M.; Scribner, K.T.; Robinson, J.D. eDNA metabarcoding in lakes to quantify influences of landscape features and human activity on aquatic invasive species prevalence and fish community diversity. Divers. Distrib. 2021, 27, 2016–2031. [Google Scholar] [CrossRef]
  70. Rojahn, J.; Gleeson, D.M.; Furlan, E.; Haeusler, T.; Bylemans, J. Improving the detection of rare native fish species in environmental DNA metabarcoding surveys. Aquat. Conserv. Mar. Freshw. Ecosyst. 2021, 31, 990–997. [Google Scholar] [CrossRef]
  71. Solomon, L.E.; Phelps, Q.E.; Herzog, D.P.; Kennedy, C.J.; Taylor, M.S. Juvenile alligator gar movement patterns in a disconnected floodplain habitat in southeast Missouri. Am. Midl. Nat. 2013, 169, 336–344. [Google Scholar] [CrossRef]
  72. Smith, N.G.; Daugherty, D.J.; Brinkman, E.L.; Wegener, M.G.; Kreiser, B.R.; Ferrara, A.M.; Kimmel, K.D.; David, S.R. Advances in Conservation and Management of the Alligator Gar: A Synthesis of Current Knowledge and Introduction to a Special Section. North Am. J. Fish. Manag. 2020, 40, 527–543. [Google Scholar] [CrossRef]
  73. Adams, S.R.; Inebnit, T.E.; Lewis, L.C.; Naus, C.J.; Kluender, E. Spawning Ecology and Spawning Site Fidelity of Alligator Gar, Atractosteus spatula, in the Fourche LaFave River: Implications for River-Floodplain Management and Alligator Gar Conservation Spawning Ecology and Spawning Site Fidelity of Alligator Gar. Southeast. Fishes Counc. Proc. 2024, 1, 64. [Google Scholar]
  74. Morrison, R.R.; Simonson, K.; McManamay, R.A.; Carver, D. Degradation of floodplain integrity within the contiguous United States. Commun. Earth Environ. 2023, 4, 215. [Google Scholar] [CrossRef]
Figure 1. Map of numbered sample collection sites. (a) Black Island (yellow dot) is in southeastern Missouri, near the northern extent of the U.S. Gulf Coastal Plain ecoregion (gray area). Sample collection sites are color coded by habitat for (b) the bayou habitats, (c) Robinson Lake, and (d) the ditch and slough habitats. Wolf Bayou sample 3 (red stripes) was a small creek inlet, determined post hoc to be a different habitat, and excluded from combined-habitat analyses of Wolf Bayou. The map was obtained from Ref. [37].
Diversity 16 00495 g001
Figure 2. Mississippi River stage (m) at the nearby Caruthersville monitoring station highlighting the dates when the eDNA sampling was conducted, as well as when the MDC deployed fyke nets during their spring 2022 survey.
Diversity 16 00495 g002
Figure 3. A comparison of Hill diversity (95% CI) estimates at 95% species coverage for the Black Island habitats estimated for the spring (solid lines) and fall (dashed lines) samples.
Diversity 16 00495 g003
Figure 4. Non-metric multidimensional scaling analysis (nMDS) depicting the assemblage structure among Black Island habitats in spring 2022 (2D stress = 0.18).
Diversity 16 00495 g004
Figure 5. Distributions of six species with the strongest correlations (based on the BIOENV procedure) to the overall assemblage structure among the habitats. (a) Labidesthes sicculus; (b) Micropterus punctulatus; (c) Aphredoderus gibbosus; (d) Menidia beryllina; (e) Polydictis olivaris; (f) Morone chrysops. Habitat abbreviations include RL—Robinsion Lake, S—slough, D—ditch, WB—Wolf Bayou, HB—Hosner Bayou, SB—Samples Bayou.
Diversity 16 00495 g005
Figure 6. Two environmental variables were most correlated with the assemblage structure. These included (a) conductivity, which was lowest in the bayou habitats, and (b) Secchi depth, which was highest in the bayou habitats. Bubble sizes within each panel represent the measured values at each site. Habitat abbreviations include RL—Robinsion Lake, S—slough, D—ditch, WB—Wolf Bayou, HB—Hosner Bayou, SB—Samples Bayou.
Diversity 16 00495 g006
Table 1. Characteristics and approximate maximum dimensions for the floodplain habitats sampled for an analysis of fish communities using eDNA in southeastern Missouri.
LengthWidthSpring Depth (m)Fall Depth (m)
Habitat ComplexSites(km)(m)MeanMaxMeanMaxHabitats
Wolf Bayou complex-oxbow lake bayou complexWolf Bayou1.91002.57.926.7Steep banks, little vegetation, submerged structure extensive in places, canopy cover limited along shorelines.
Hosner Bayou0.9501.53.31.22.4
Samples Bayou0.7501.74.312.1
Robinson Bayou-expanse of low relief floodplainRobinson Lake22000.61.20.30.5Shallow banks, extensive flooding into vegetated habitat (in spring), very little submerged structure, canopy cover extensive within flooded vegetation (in spring).
Black Island margin-slough and ditch complexDitch>5100.91.7drydrySteep banks, vegetation along shoreline, no submerged structure, canopy cover extensive along slough but absent along ditch.
Slough5300.81.40.50.6
Table 2. List of species detected among the Black Island backwater habitats with a heat map indicating the percent of combined samples (red high/blue low) that were positive for species presence for each habitat.
AbundanceDependencePercent of Total Read CountSpringFall
FamilySpeciesSloughDitchRobin-son LakeWolf BayouHosner BayouSamples BayouWolf BayouHosner BayouSamples BayouMDC
Surveys (Years
Recorded)
AmiidaeAmia ocellicaudaUB3.43%100%100%100%100%75%100%83%100%100%40; 79; 22
AnguillidaeAnguilla rostrataU 0.004%33%0%0%0%0%0%0%0%0%
AphredoderidaeAphredoderus gibbosusUB0.13%100%33%100%0%0%0%0%0%50%40; 79; 22
AtherinopsidaeLabidesthes sicculusUF0.33%0%0%0%83%75%100%100%100%100%66; 79; 94
Menidia beryllinaCF0.14%67%67%86%17%0%0%17%50%0%78; 22
CatostomidaeCarpiodes spp. (carpio, cyprinus)A/UF0.05%100%100%43%50%25%50%50%75%50%79
Ictiobus spp. (bubalus, cyprinellus, niger)A/C/UB10.36%100%100%100%100%100%100%100%100%100%40; 79
Moxostoma macrolepidotumUF0.00%0%0%0%0%0%0%0%0%0%79 b
CentrarchidaeCentrarchus macropterusPB0.00%0%0%0%0%0%0%0%0%0%40
Lepomis cyanellusUB2.35%67%67%100%100%100%100%100%100%100%66; 22
Lepomis gulosusUB0.89%100%100%100%100%100%100%83%75%100%40; 66; 22
Lepomis humilisUB6.89%100%100%100%100%100%100%100%100%100%79; 94; 22
Lepomis macrochirusCB12.3%100%100%100%100%100%100%100%100%100%40; 66; 79; 94; 22
Lepomis marginatusPB6.13%100%100%100%100%100%100%100%100%100%
Lepomis megalotisUB0.43%100%100%71%100%100%100%83%100%100%79; 94; 22
Lepomis microlophusUB0.003%0%0%0%0%0%25%0%0%0%
Lepomis miniatusUB0.01%0%0%14%0%0%0%0%0%0%
Lepomis symmetricusUB0.02%0%0%86%67%25%0%17%0%0%
Micropterus punctulatusPB0.24%33%33%0%100%75%100%100%50%100%
Micropterus nigricansUB0.71%100%100%86%100%100%100%100%75%100%66; 79; 94
Pomoxis annularisCB0.33%100%100%100%83%100%75%100%75%100%40; 79; 22
Pomoxis nigromaculatusUB0.52%100%100%100%83%100%75%83%75%75%40; 22
ClupeidaeAlosa chrysochlorisCF0.01%67%0%0%33%0%0%0%25%0%
Dorosoma cepedianumAB4.37%100%100%100%100%100%75%100%100%100%40; 66; 79
Dorosoma petenenseUB0.25%67%100%57%67%0%0%100%100%50%
EsocidaeEsox americanusPB0.01%0%0%29%0%0%0%0%0%0%79 b
FundulidaeFundulus spp. (notatus, olivaceus)PB0.87%100%100%100%100%100%100%83%100%100%66; 79; 94
IctaluridaeAmeiurus spp. (melas, natalis)UB0.01%0%0%57%0%0%0%0%0%0%40; 79; 22
Ictalurus punctatusC 0.21%100%100%100%100%75%75%100%100%100%79 b
Noturus gyrinusUB0.02%0%0%14%50%0%50%50%25%50%66; 79; 94
Pylodictis olivarisA 0.35%100%100%29%100%100%100%83%100%100%
LepisosteidaeAtractosteus spatulaUB0.004%0%0%0%50%0%0%17%0%0%
Lepisosteus oculatusUB1.49%100%100%100%100%100%100%100%100%100%22
Lepisosteus osseusCB0.15%67%100%57%100%100%75%100%100%100%
Lepisosteus platostomusCB3.22%100%100%100%100%100%100%100%100%100%40; 79; 22
LeuciscidaeHybognathus hayi aUB0.00%0%0%0%0%0%0%0%0%0%79 b
Hybognathus nuchalisCF0.0002%33%0%0%0%0%0%0%0%0%
Notemigonus crysoleucasPB0.01%0%0%57%0%25%0%33%25%0%40; 79; 22
Notropis atherinoidesAF0.002%33%0%43%0%0%0%0%0%0%
Opsopoeodus emiliaePB0.28%100%0%86%67%100%75%83%100%100%79
Paranotropis shumardi aCF0.00%0%0%0%0%0%0%0%0%0%79
MoronidaeMorone chrysopsCF0.07%100%100%29%17%25%0%33%50%0%79 b
PercidaeEtheostoma asprigeneUB0.68%100%100%86%83%100%100%67%75%100%66;79
Etheostoma chlorosomaPB0.40%100%0%86%83%75%75%67%100%100%79
Etheostoma gracileUF0.01%33%0%86%33%0%0%17%0%0%66; 22
Percina caprodesU 0.004%0%33%0%50%0%0%0%0%25%
Percina shumardiUF0.001%33%0%0%0%0%0%0%0%0%79 b
PoeciliidaeGambusia affinisUB1.59%100%100%100%83%50%25%33%75%100%40; 66; 79; 94; 22
PolyodontidaePolyodon spathulaCF0.01%0%33%43%67%0%0%83%0%25%79
SciaenidaeAplodinotus grunniensAF0.85%100%100%100%100%100%100%100%100%100%
CyprinidaeCyprinus carpioIB6.89%100%100%100%100%100%100%100%100%100%40
XenocyprididaeCtenopharyngodon idellaIF1.45%100%100%100%100%100%100%100%100%100%
Hypophthalmichthys molitrixIF8.54%100%100%100%100%100%100%100%100%100%22
Hypophthalmichthys nobilisIF20.6%100%100%100%100%100%100%100%100%100%
Mylopharyngodon piceusI 2.36%100%100%100%100%100%100%100%100%100%
Abundance and habitat dependency classifications from Ref. [3]: (A) abundant, (C) common, (U) uncommon, (P) periodic, associated with tributaries, (I) invasive, (F) fluvial-dependent, (B) backwater-dependent. a Species absent from the eDNA reference database; b MDC records represented by single specimens.
Table 3. PERMANOVA comparing the habitats sampled during the spring.
SourcedfSSMSPseudo-FP (perm)Unique Perms
Habitat52284.2456.836.89440.00019897
Res211391.566.261
Total263675.7
Table 4. Averaged environmental variables collected at each sample location for each habitat in the spring and the fall.
Secchi (m)Cond (µS/cm)DO (mg/L)Temp (°C)
SitesSpFaSpFaSpFaSpFa
Wolf Bayou1.113093096.64.82423
Hosner Bayou0.70.72613108.46.92723
Samples Bayou10.82813007.55.52620
Robinson Lake0.50.14653395.55.92815
Ditch0.5NA406NA5.8NA24NA
Slough0.50.14853617.76.62616
Table 5. PERMANOVA comparing the bayou habitats sampled during the spring and the fall.
SourcedfSSMSPseudo-FP (perm)Unique Perms
Bayou2364.9182.442.810.00259941
Season1146.1146.072.250.0559957
Bayou × Season2180.190.051.390.199940
Res221429.564.98
Total272119.6
Table 6. Pairwise PERMANOVA tests to determine which habitats are significantly different from one another. Hosner Bayou (HB), Samples Bayou (SB), and Wolf Bayou (WB).
GroupstP (perm)Unique PermsP (MC)
HB, SB1.280.1499540.17
HB, WB1.730.01399470.028
SB, WB1.760.02299590.028
Disclaimer/Publisher’s Note: The statements, opinions and data contained in all publications are solely those of the individual author(s) and contributor(s) and not of MDPI and/or the editor(s). MDPI and/or the editor(s) disclaim responsibility for any injury to people or property resulting from any ideas, methods, instructions or products referred to in the content.

